 EPA
EPAImpacts of 2020 Colonial Pipeline Rupture Continue to Grow
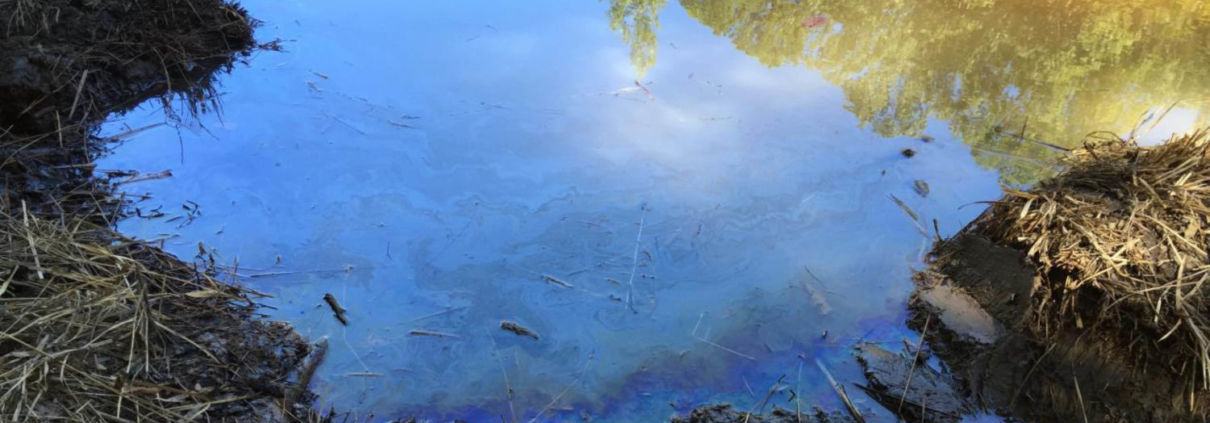
In August 2020, the Colonial Pipeline ruptured, spilling an estimated 1.2 million gallons of gasoline—18 times more than originally reported.
In August 2020, the Colonial Pipeline ruptured, spilling an estimated 1.2 million gallons of gasoline—18 times more than originally reported.
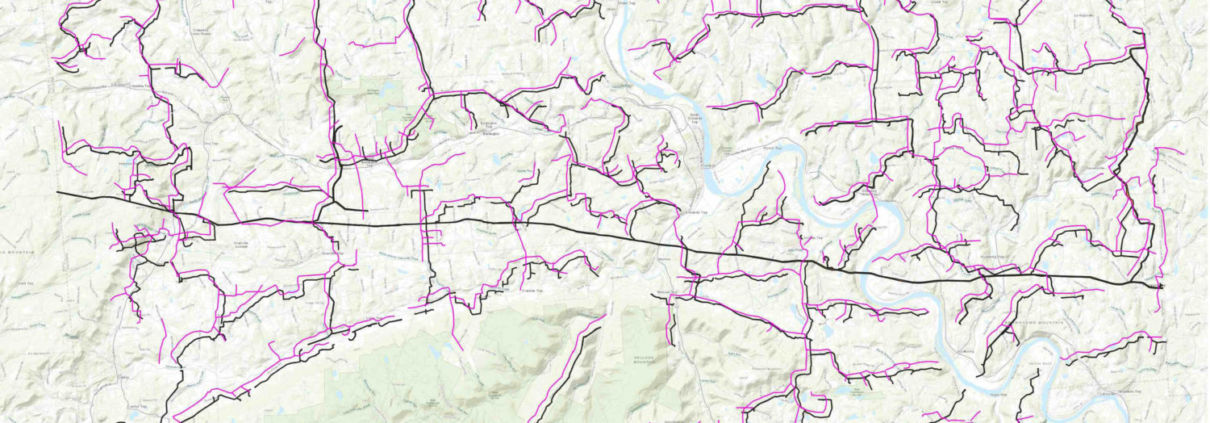
FracTracker mapped gathering lines in Bradford County, PA. Public data on gathering lines are incomplete, leaving us to fill in the gaps.
The map below shows 6,950 total incidents since 2010, translating to 1.7 incidents per day. Pipelines are dangerous, in part because regulation around them is ineffective.
In December 2019, Plains All-American and Valero pipeline companies announced plans to build the 49-mile Byhalia Pipeline through southwestern Tennessee and northwestern Mississippi. The proposed Byhalia Connection Pipeline is a 24-inch, high pressure (1500 psi) conduit, conveying crude oil coming Oklahoma, bound for the Gulf coast. The pipeline, which is designed to carry up to 420,000 barrels of oil a day, provides a link between the Diamond Pipeline to the west and the Capline Pipeline to the east. Construction is planned to begin in early 2021, and be completed by year’s end. Plains All-American insists that all safety precautions are being considered, but the outcry among residents and environmental advocates has been considerable.
Many factors—environmental, geological, social, and economic—have emerged as reasons that this pipeline should not move ahead. And industry most certainly didn’t count on pushback from the local community. Residents, allies, and the media have risen up to challenge the project. In this article, we’ll take a look at the story from various perspectives, augmented by FracTracker’s mapping insights.
UPDATE: On Friday, July 2, 2021, Plains All American announced that it would be abandoning its plans to build the controversial Byhalia Connection Pipeline. As one activist involved in the fight proudly stated, “We’ve shown them that we aren’t the path of least resistance. We are the path of resilience.” Read more about this momentous victory for the people of South Memphis here.
Environmental and hydrological
Demographics and disaster preparedness
This interactive map looks at the various risks associated with the proposed Byhalia Connection Pipeline. The map contains all of the data layers related to the topics in this article. Scroll down in this article to find interactive maps separated out by topic. All data sources are listed in the “Details” section of the maps, as well as at the end of this article. Items will activate in this map dependent on the level of zoom in or out.
View Full Screen | Updated March, 2021
The 49-mile route of the proposed Byhalia Connection Pipeline passes through a patchwork of rural, suburban, and urban landscapes. Along the route, the pipeline would cross seven named waterways — Johnson Creek, Hurricane Creek, Bean Patch Creek, Camp Creek, Short Brook, Camp Creek Canal, and Coldwater Creek — and also pass immediately adjacently to a nearly 5-mile-long wetlands complex that surrounds the Coldwater River. But the natural environment is home to many more waterways than those that have official names on topographic maps. According to FracTracker’s inspection of National Wetlands Inventory data collected by the United States Fish and Wildlife Service, the proposed pipeline crosses or touches 62 streams in 102 separate locations, 25 forested wetlands, an emergent wetland, 17 ponds, and one lake.
Close to the City of Memphis, 0.8 miles of the pipeline would run directly through the Davis Wellfield Wellhead Protection Zone. The proposed pipeline is located over the extraordinary Memphis Sands Aquifer, which provides potable water for more than 400,000 people. Memphis Light, Gas and Water (MLGW) Company pumps water from over 175 artesian wells in Shelby County, Tennessee, alone—right in the path of the pipeline route. The aquifer itself is a sensitive resource, already under demand by the human population of the area, as well as many industries such as breweries and as a supply of cooling water for a nearby power plant.
Memphis Sands Aquifer is part of the larger Middle Claiborne Aquifer, a groundwater and geological unit in the lower Mississippi drainage. Technically speaking, the Memphis Sands portion of the aquifer is located in Tennessee, but is continuous with the Sparta Sands Aquifer, located in Mississippi. In the eastern portion of the Byhalia Connection’s proposed route, wetlands along Coldwater River are directly part of the recharge zone of this aquifer.
To learn more about the hydrologic features that may be impacted by the proposed Byhalia Connection Pipeline, explore our interactive map. When this map is viewed full-size, you can choose to view additional layers from the drop-down Layers menu.
View Full Screen | Last updated March 2021
The Memphis Sands Aquifer lies 350 to 1000 feet under Memphis (see Figure 1), and spans an area of 7500 square miles, roughly the size of Lake Ontario. “It’s one of the best (aquifers) in the world in terms of thickness, aerial content, quality of water”, according to Roy Van Arsdale, Professor of Geology at University of Memphis. Under Shelby County alone — where Memphis is located — the aquifer contains approximately 58 trillion gallons of clean water. Over time, the aquifer has seen threats from overpumping, as the population of Memphis grew. In addition, industrial pollution has turned up in some samples, including cancer-causing benzene. Policy protections on the aquifer have been lacking, although there is increasingly vocal public awareness about the need for more comprehensive groundwater resource protection in the area.
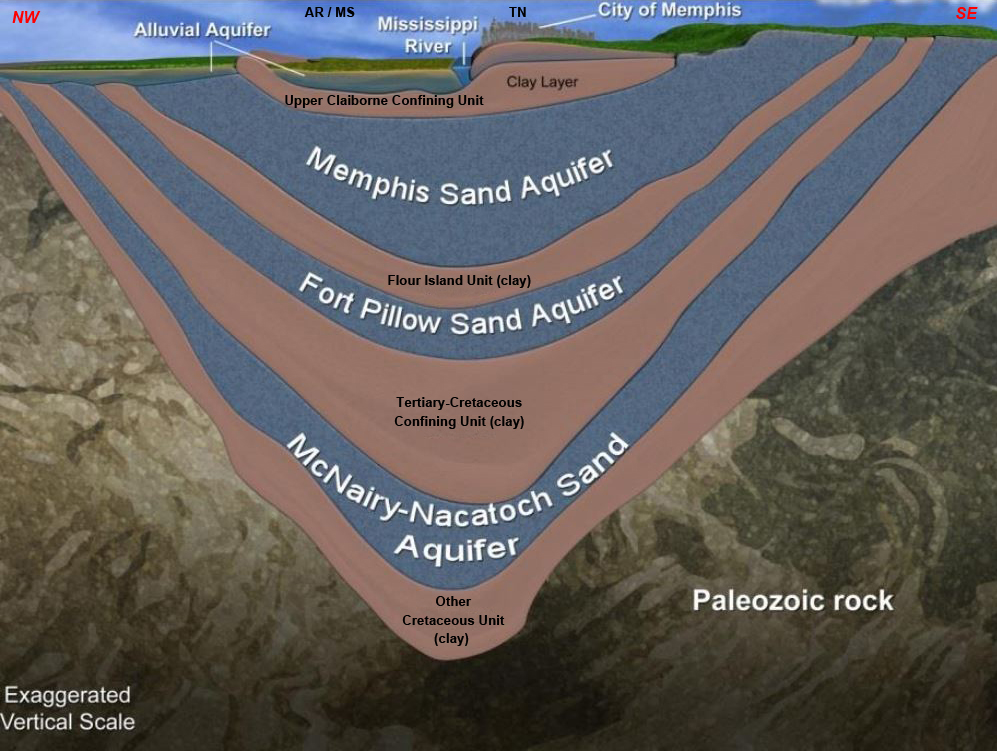
Figure 1. Cross-section of aquifers under Memphis, TN. Graphic modified from here.
Although water withdrawals from the aquifer have declined significantly since 2000 due, in part, to more water-efficient household appliances that reduce demand in comparison with older models, the MLGW pumped 126 million gallons a day from the aquifer in 2015. Consequently, the level of the aquifer has been rising in recent years, as the rate of recharge has exceeded use.
The courts have suggested that the water in the aquifer is an intrastate resource, and that therefore, Mississippi cannot have sole governance over the extraction of the water within its state boundaries. Instead, usage should be through “equitable apportionment.” Further arguments are still pending, as of late 2020. In short, as Figure 1 shows, withdrawal and recharge of the aquifer do not respect state boundaries.
The details of water law, and who can tap into these, and other deep, ancient aquifers, are complex questions in which agriculture, ecology, geology, and technology bump up against each other. All of these interests, not to mention human health, could be heavily impacted by a crude oil pipeline rupture or other accident that resulted in contamination of this groundwater resource.
Crude oil spills release a panoply of volatile organic compounds into the air and water that are extremely harmful to human and environmental health. These include benzene, ethylbenzene, toluene, and xylene. Polycyclic aromatic hydrocarbons (PAHs), such as carcinogenic benzo[a]pyrene, are also released. In addition, if the oil combusts, hydrogen sulfide gas, as well as heavy metals, including nickel, mercury, and cadmium, will become airborne.
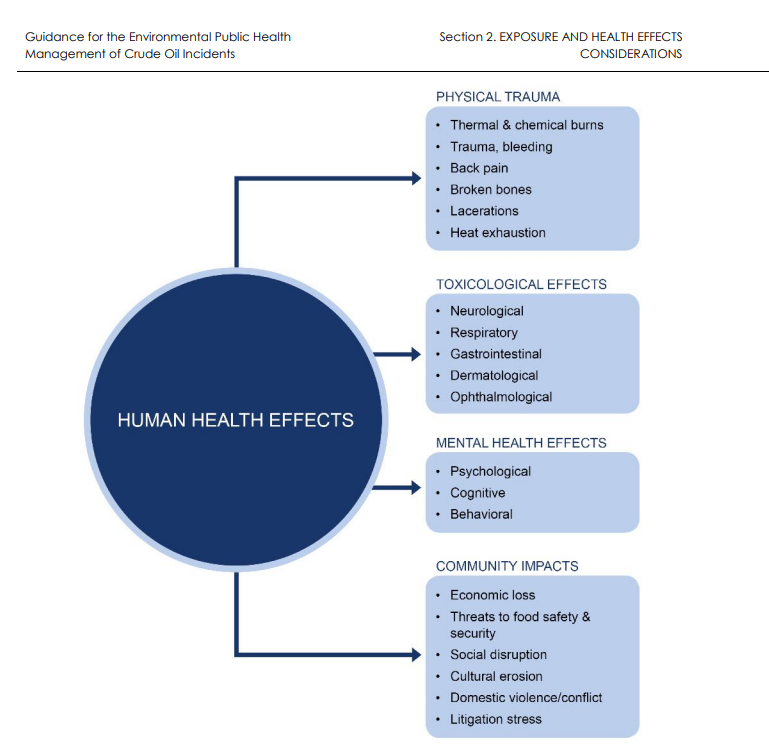
Figure 2. Observed/documented oil spill-induced acute and chronic human health effects. Source: Guidance for the Environmental Public Health Management of Crude Oil Incidents, Health Canada (2018).
The take-away is that crude oil spills from pipelines are not uncommon, result in environmental damage, impacts on the health and safety of workers and nearby residents. Most importantly, despite monitoring and inspections, pipelines fail. A partial list of pipeline failures is shown in the sidebar.
Within the 2-mile buffer of the pipeline, there are 20 facilities that the United States Environmental Protection Agency (US EPA) lists in its Toxic Release Inventory (TRI), including several chemical plants associated with hydrocarbon extraction. Carcinogens such as polycyclic aromatic compounds, benzene, styrene, dioxins, and naphthalene are just a few of the compounds produced by facilities owned by Valero Energy Corporation, Drexel Chemical Company, and other companies within the 2-mile buffer zone of the pipeline, which compound the risks to the populations there. In addition, while the TRI lists exposure to toluene and xylene from these facilities, neither are categorized by EPA’s TRI database as a carcinogen due to a lack of data; however, their deleterious impacts on the central nervous system are undeniable, and well- documented (see examples here and here).
View Full Screen | Updated March, 2021
In this interactive map, you can see sites in the proposed Byhalia Connection route that are listed in the TRI, as well as civic facilities like schools, daycare centers, and health care facilities. When this map is viewed full-size, you can choose to view additional layers from the drop-down Layers menu.
The most active seismic fault line in the eastern United States — the New Madrid Fault — is located about 40 miles from one end of the proposed pipeline (see Figure 2). The last major earthquakes along this fault line occurred in 1811 and 1812. Although the current Richter scale was not in use at that time, first quake in mid-December 1811 was estimated to have had a magnitude of between 7.2 and 8.2, and was followed by an aftershock of about 7.4. In January and February of 1812, there were additional earthquakes of this magnitude. Obviously, at this time in history, there was relatively sparse population in the area, and little infrastructure. Were such a quake to occur today, the outcomes would be catastrophic.
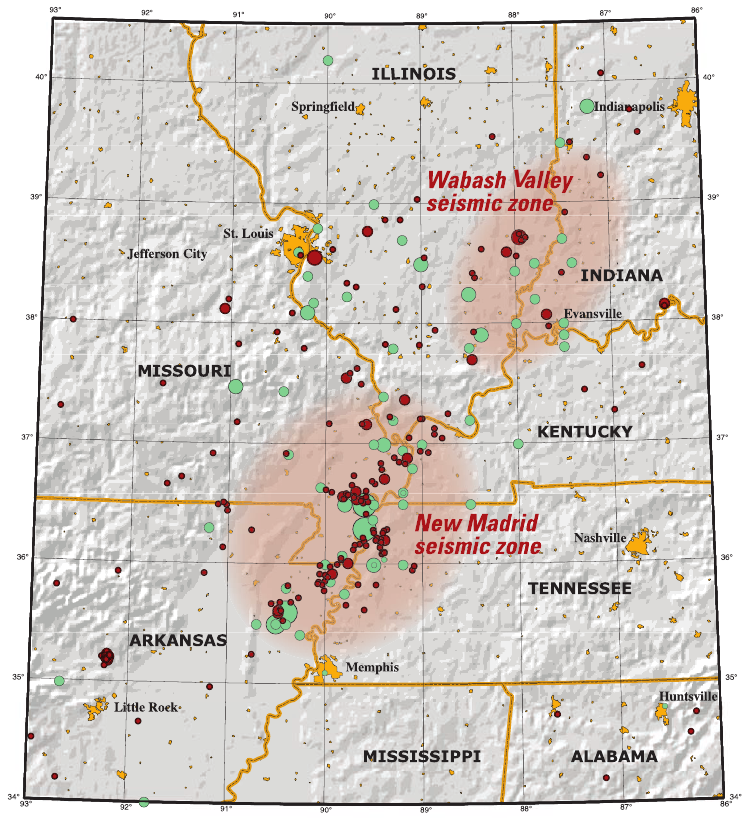
Figure 3: New Madrid Seismic Zone. Source: United States Geological Survey
According to a Wikipedia entry, “[i]n October 2009, a team composed of University of Illinois and Virginia Tech researchers headed by Amr S. Elnashai, funded by the Federal Emergency Management Agency, considered a scenario where all three segments of the New Madrid fault ruptured simultaneously with a total earthquake magnitude of 7.7. The report found that there would be significant damage in the eight states studied – Alabama, Arkansas, Illinois, Indiana, Kentucky, Mississippi, Missouri, and Tennessee – with the probability of additional damage in states farther from the New Madrid Seismic Zone. Tennessee, Arkansas, and Missouri would be most severely impacted, and the cities of Memphis, Tennessee, and St. Louis, Missouri, would be severely damaged. The report estimated 86,000 casualties, including 3,500 fatalities, 715,000 damaged buildings, and 7.2 million people displaced, with two million of those seeking shelter, primarily due to the lack of utility services. Direct economic losses, according to the report, would be at least $300 billion.” Source: University of Illinois report]
Another article on the New Madrid fault added that “….the US Geological Survey and the University of Memphis Center for Earthquake Research estimate there’s a 7 to 10 percent chance of a major quake — one with a magnitude between 7.5 and 8.0 — occurring in the region in the next 50 years….’ The scope is about as big as you could possibly have,’ said Jonathon Monken, director of the Illinois Emergency Management Agency and chairman of the Central U.S. Earthquake Consortium… ‘Putting it in a purely financial context, Hurricane Katrina was a $106 billion disaster. We estimate this would be a $300 billion disaster, the worst in the history of the United States.’”
Earthquake damage to pipelines can occur from movement on the fault itself, soil liquefaction, uplift, and landslides, resulting in potentially catastrophic situations. Engineering solutions to minimize or prevent seismic damage to pipelines do exist. These solutions must be part of the overall pipeline design, however. For example, the Trans-Alaska oil pipeline was constructed with considerations for earthquake impacts in mind. For more information, read about the solution that was implemented there.
This map shows the New Madrid seismic zone in the context of the proposed Byhalia Connection Pipeline. When this map is viewed full-size, you can choose to view additional layers from the drop-down Layers menu.
View Full Screen | Updated March 2021
As eloquently reported in a series of articles in mlk50.com, the siting of the Byhalia Connection Pipeline is not only an issue environmental tied with the natural environment. This is very much an issue of environmental justice, as well. Many of the census blocks along the proposed, preferred route of the pipeline, are 99% Black. Boxtown, a community in southwest Memphis is one of places, and already has a long history of impacts by environmental contamination from the dozens of industries that operate there. Toxic waste from coal power plants includes heavy metals and radioactive materials.
The pipeline route from Memphis to its terminus in Mississippi takes a circuitous route, avoiding wealthier parts of the city and its suburbs, but goes directly through low-income areas, some of which are inhabited by a nearly 100% Black population.
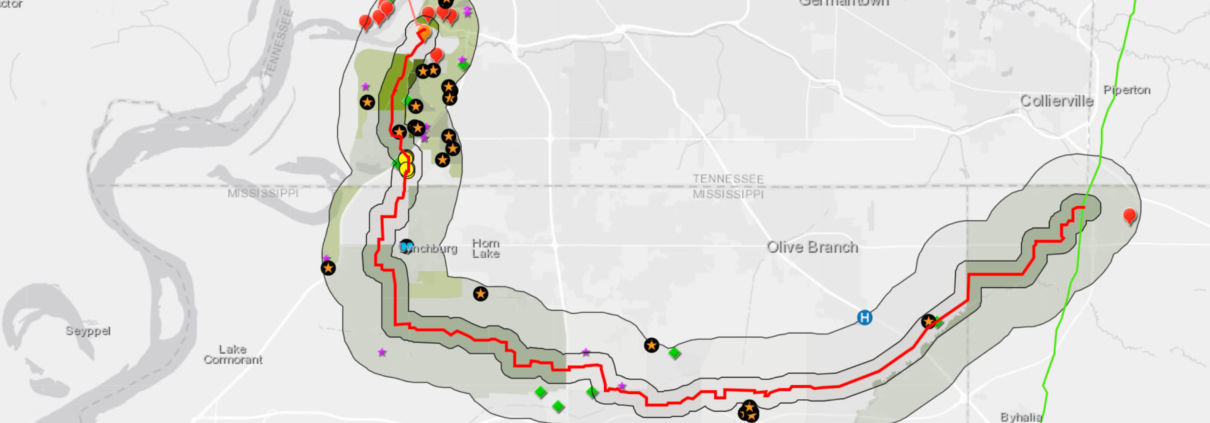
FracTracker looked at US Census data along the pipeline route, and calculated a half-mile (minimum recommended) and two-mile buffer zone from the pipeline right-of-way to consider populations that might be impacted in the case of an accident.
Explore the the demographics along the proposed Byhalia Connection Pipeline route. When this map is viewed full-size, you can choose to view additional layers from the drop-down Layers menu, such as the non-white population ration along the proposed pipeline route.
View Full Screen | Updated March 2021
There are 15,000 people living in the immediate evacuation zone of a half mile from the pipeline. In some parts of South Memphis, within this half-mile evacuation zone, population density is above 4,000 people per square mile, and the Black population approaches 100%. Within a two mile distance, the number climbs to over 76,000. Depending on the direction of the wind, a crude oil-induced fire could spew dangerous levels of volatile organic compounds through the air towards these populations. The disproportional risks to minority and low-income populations make the location of this pipeline — undeniably — an issue of environmental justice.
| Demographic | Within ½ mile of Byhalia Connection Pipeline | Within 2 miles of Byhalia Connection Pipeline |
| Total population | 15,041 | 76,016 |
| Non-white population | 7204 (48%, although some parts of South Memphis are 99+%) | 27,548 (36%, although some parts of South Memphis are 99+%) |
| Low income population | 4272 (28%, although some parts of South Memphis are 90+%) | 43,486(57%, although some parts of South Memphis are 90+%) |
Table 1: Population demographics along the proposed Byhalia Connection pipeline corridor.
Key civic facilities are also located within the half-mile evacuation zone of the pipeline. Were a disaster to occur, would the schools, childcare centers and medical facilities be able to successfully usher their residents and students to safety? Would they have had regular safety trainings to prepare them for this possibility?
| Facility | Within ½ mile of pipeline | Within 2 miles of pipeline |
| Child care | 4 (one within 800 feet) | 30 |
| Public school | 2 (one within 800 feet) | 26 |
| EMS | 2 | 11 |
| Hospital | 0 | 1 |
| Private school | 0 | 1 |
Table 2: Facilities along the proposed Byhalia Connection pipeline corridor (also shown in the interactive map here).
Former Vice President Al Gore voiced his opposition to the Byhalia Connection and put Memphis elected officials on notice during a rally against the pipeline on March 14, 2021.
Source: Article in commercialappeal.com
“Why is it that 64% of the polluting facilities of these pipeline communities are located in or adjacent to Black communities? Why is it that the cancer rate in SW Memphis four times higher than the national average? Why is it that Black children suffer from asthma three times more than white children? Why is it that the death rate from asthma for Black children is ten times higher than for white children?” – Former Vice President Al Gore
And two days later, on March 16th, the Memphis City Council unanimously approved a resolution that opposes the Byhalia Connection Pipeline project.
Approximately 300 property owners adjacent to the pipeline have already accepted monetary compensation to abandon their homes or sell property easements to make way for the pipeline. If a landowner refuses payment offered by the pipeline company for a property easement — often far under market value — the company can take the landowner to court, and seize the property (or portion of it) with no requirement of compensation. Although a majority of property owners accepted the terms of the easements drawn up by Byhalia’s developers, at least 14 did not. When numerous owners refused, nine properties were targeted for taking by eminent domain, and sued by the pipeline company. The Southern Environmental Law Center (SELC) is defending many of these property owners, claiming that the seizures — regardless of whether they are temporary or permanent — do not comply with the criteria of meeting a public good. The oil being transported in the proposed pipeline is entirely bound for export.
“The pipeline company is not created by, affiliated with or owned by the government, and the general public would have no access to the proposed crude oil pipeline… So, there is no ‘public use’ justifying the use of the condemnation power as required by Tennessee law,” said one of SELC’s attorneys. In addition, SELC has cited the illegality of the pipeline route because it runs through the municipal wellfield, and therefore violates permits issued by the Army Corps of Engineers. The Army Corp was still considering this request, as of mid-January 2021.
Furthermore, the eminent domain targeting of land owned by Black Americans in the south is a pointed question of racial justice. Historically, black and brown people throughout the United States have had far lower levels of home ownership than whites. This gap is most pronounced in lower income areas.

Figure 5: Homeownership rate in the US, by household income (2017). Source: The Urban Institute.
“The 71.9 percent white homeownership rate in 2017 represented a 0.7 percentage point decline since 2010, and the 41.8 percent black homeownership rate represented a 2.7 percentage point decline during that same period. The 30.1 percentage point gap is wider than it was when race-based discrimination against homebuyers was legal.” The Urban Institute
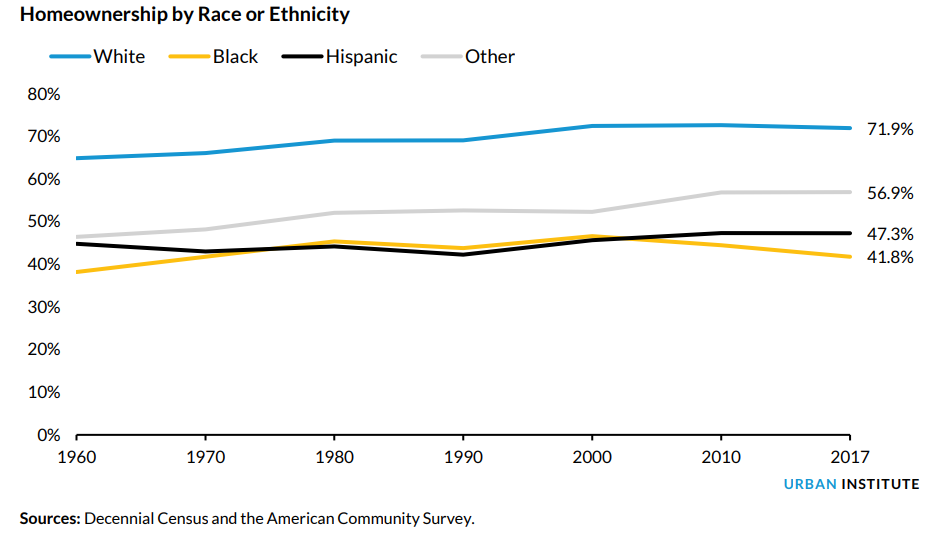
Figure 6: Homeownership in the US by race or ethnicity. Source: The Urban Institute.
Losing land to eminent domain represents a loss of control for a landowner — white or black. But the loss is especially unjust when a property may have been so hard won, and sometimes the result of a multi-generational lineage of ownership, as is the case for many properties along the Byhalia right-of-way.
FracTracker has created an interactive map showing the locations of crude oil spills across the United States between 2010 and 2021, using the most up-to-date information from PHMSA, the Pipeline and Hazardous Materials Safety Administration.
View Full Screen | Updated March, 2021
You can also read more about a wider diversity of hazardous liquid materials accidents analyzed by FracTracker in an article from February 2020, entitled “Pipelines Continue to Catch Fire and Explode”.
A 2020 research paper states, “Modeling and analysis of a catastrophic oil spill and vapor cloud explosion in a confined space upon oil pipeline leaking” provides a stark example of the damage done from the leak and explosion of a crude oil pipeline operating at a third of the pressure proposed for Byhalia.
“It is obvious that the explosion caused big damages to the adjacent buildings, roads, and public structures. Moreover, the explosion, combustion, and the shock wave caused injuries and deaths of workers, pedestrians, and residents. The total affected zone spread nearly 5 km [3.1 miles].”
Note: The oil pipeline shown in Shengzhu, Xu, et al.’s paper in was 28 inches in diameter, and operating at a pressure of between 400 and 660 psi. A vapor cloud from the spill into a municipal drainage area caused this explosion, which killed 62 people and injured 136 in November 2013. The 24-inch, proposed Byhalia pipeline would operate at triple the pressure of the pipeline shown in these photos of its explosion.
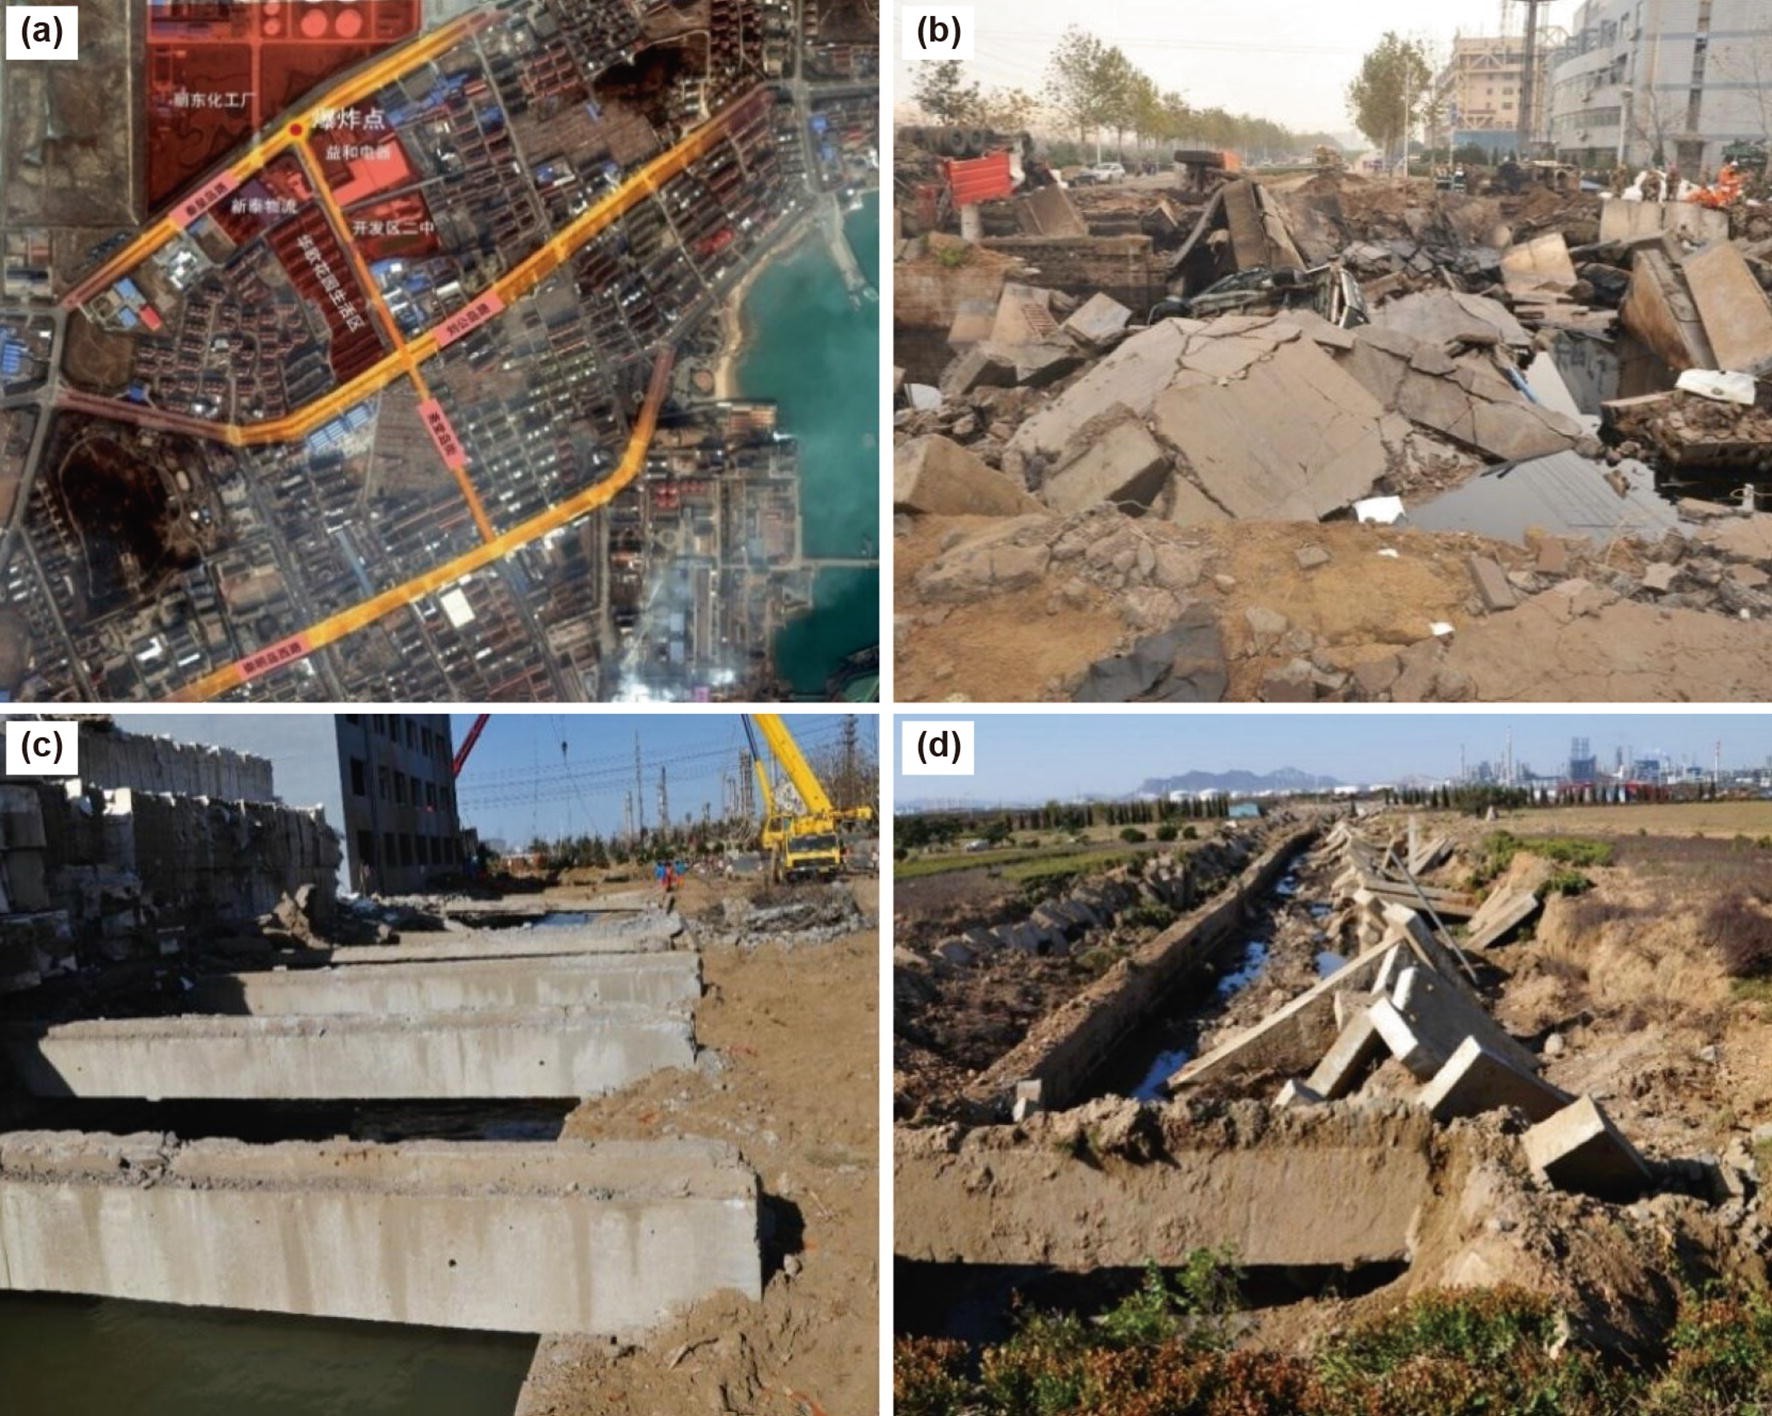
(a) bird’s eye view of the location of the explosion point, (b) scene of the oil spill point after explosion, (c) scene of the nearby street, (d) scene of the drainage of the adjacent plant.
Figure 7: Scene of an oil pipeline explosion site in China. (a) bird’s eye view of the location of the explosion point, (b) scene of the oil spill point after explosion, (c) scene of the nearby street, (d) scene of the drainage of the adjacent plant. Image from Shengzhu, Xu, et al.
Health Canada published the information document Guidance on the Management of Crude Oil Incidents (2018), which details important information about how to deal with crude oil spills. Here are checklists on whether to evacuate or shelter in place and information on determining protective zone distances, particularly downwind of a spill from the 2016 Emergency Response Guidebook.
In case of a large spill: Consider initial downwind evacuation for at least 300 meters (1000 feet).
In case of a fire: If tank, rail car or tank truck is involved in a fire, ISOLATE for 800 meters (1/2 mile) in all directions; also, consider initial evacuation for 800 meters (1/2 mile) in all directions. Source: Petroleum crude oil hazards


The Byhalia Connection Pipeline is receiving considerable scrutiny, both from media sources like the Memphis Daily News and MLK50, as well as advocacy groups including Sierra Club’s Tennessee Chapter, the Southern Environmental Law Center, Memphis Community Against the Pipeline, and Protect Our Aquifer. In a move considered egregious by a vast swath of stakeholders, in early February 2021, the US Army Corps of Engineers approved a Nationwide 12 permit to fast-track the Byhalia project, effectively cutting out public comment from the process, and lightening the environmental review requirements. Because the project touches vulnerabilities in the intersection of environment, economics, health, safety, and social justice, this discussion is not likely to easily recede into the background, despite placating claims by the companies that are poised to profit.
Protests are ongoing, and just recently, on February 22, 2021, United States Congressional Representative Steve Cohen sent a direct appeal to President Biden to revoke a key permit for Byhalia, directly citing the burden the pipeline would impose on long-suffering Black neighborhoods in South Memphis. Simultaneously, the Public Works Department of Memphis is considering a resolution condemning the pipeline, and asking the Memphis Light, Gas, and Water Division to oppose the project.
This story will undoubtedly continue to evolve in the upcoming months.
Regardless of where a pipeline is sited, there are inevitably risks to the environment, and to human communities living nearby. The proposed Byhalia Connection pipeline project is situated in a particularly problematic intersection where environmental justice, hydrology, geology, and risks to human and environmental health intersect. Without taking all of these factors into consideration, a potentially catastrophic cascade of impacts may ensue. Engagement and resistance to the project by the residents in the area, as well as support by advocacy groups, will hopefully result in comprehensive consideration of all the risks. Time will tell whether the project is modified, or simply defeated.
MLK50.com maintains an archive of excellent reading materials on this controversial project that can be found here.
The Falcon Ethane Pipeline System is at the center of major investigations into possible noncompliance with construction and public safety requirements and failing to report drilling mud spills, according to documents obtained from the Pennsylvania Department of Environmental Protection (PA DEP) by FracTracker Alliance. These investigations, which are yet to be released, also uncovered instances of alleged data falsification in construction reports and Shell Pipeline Company firing employees in retaliation for speaking up about these issues.
3/17/21 Press release: https://www.fractracker.org/falcon-investigation-press-release-fractraccker-alliance/
Shell’s attempts to cut corners while constructing this 98-mile pipeline, likely motivated by the increasingly bleak economic prospects of this project, present serious public safety concerns for the thousands of residents along its route in Pennsylvania, West Virginia, and Ohio.
These allegations are serious enough to warrant immediate action. We’re calling on the Pipeline and Hazardous Materials Safety Administration (PHMSA) to thoroughly examine these allegations and suspend construction if not yet completed, or, in the case that construction is complete, operation of the Falcon Pipeline. Furthermore, we call on state environmental regulators to fully investigate construction incidents throughout the entire pipeline route, require Shell Pipeline to complete any necessary remediation, including funding independent drinking water testing, and take enforcement action to hold Shell accountable. Read our letters to these agencies here.
These investigations were featured in a March 17th article by Anya Litvak in the Pittsburgh Post-Gazette.
3/18/21 update:
Additional coverage of this story was published in a Times Online article by Daveen Ray Kurutz, a StateImpact Pennsylvania article by Reid Frazier, and an Observer-Reporter article by Rick Shrum.
According to documents obtained through a public records request, a whistleblower contacted PHMSA in 2019 with serious concerns about the Falcon, including that the pipeline may have been constructed with defective corrosion coating. PHMSA is a federal agency that regulates pipeline operation. The whistleblower also shared environmental threats occurring within the DEP’s jurisdiction, prompting the PA DEP and Pennsylvania Attorney General’s Office to get involved.
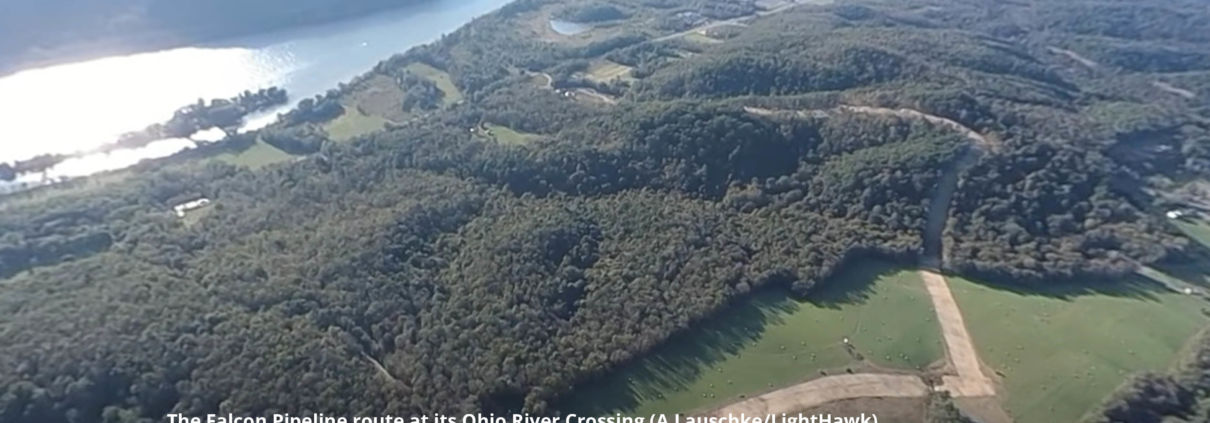
Many of the issues with the Falcon relate to a construction method used to install pipelines beneath sensitive areas like roads and rivers called horizontal directional drilling (HDD). Shell Pipeline contracted Ellingson Trenchless LLC to complete over 20 HDDs along the Falcon, including crossings beneath drinking water sources such as the Ohio River and its tributaries. FracTracker and DeSmog Blog previously reported on major drilling mud spills Shell caused while constructing HDDs and how public agencies have failed to regulate these incidents.
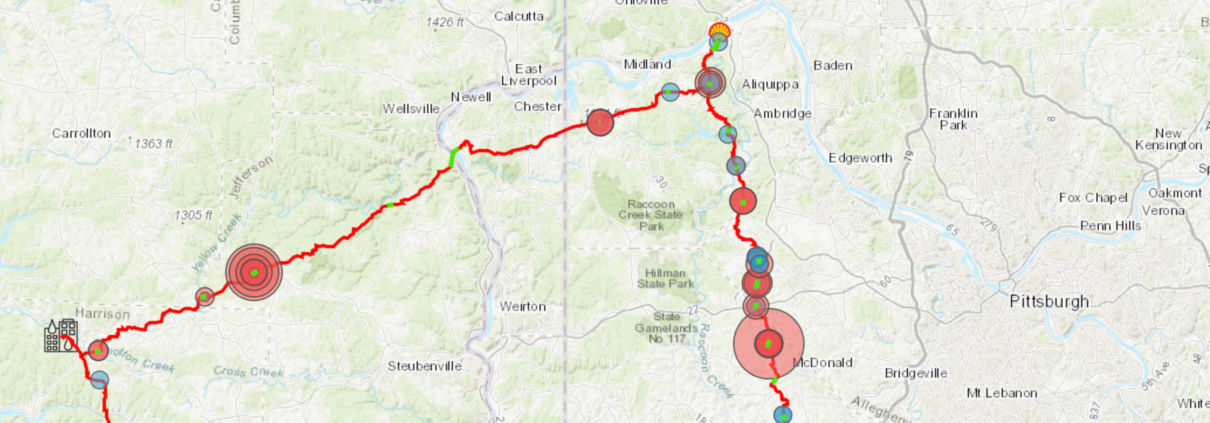
This map shows the Falcon Pipeline’s HDD crossings and spills of drilling fluid spills that occurred through 3/5/2020. To see the data sources, click on the information icon found in the upper right corner of the map header as well as under the map address bar.
View Map Full Sized | Updated 6/16/20
Correspondence between the PA DEP and PHMSA from February 26, 2020 reveal the gravity of the situation. While PHMSA conducted an inquiry into the whistleblower’s complaints in 2019 and concluded there were no deficiencies, PA DEP Secretary Patrick McDonnell wrote that his agency felt it was incomplete and urged PHMSA to conduct a more thorough investigation. Secretary McDonnell noted the PA DEP “has received what appears to be credible information that sections of Shell’s Falcon Pipeline project in western PA, developed for the transportation of ethane liquid, may have been constructed with defective corrosion coating protection,” and that “corroded pipes pose a possible threat of product release, landslide, or even explosions.”
FracTracker submitted a Freedom of Information Act request with PHMSA asking for documents pertaining to this inquiry, and was directed to the agency’s publicly available enforcement action webpage. The page shows that PHMSA opened a case into the Falcon on July 16, 2020, five months after Secretary McDonnell sent the letter. PHMSA sent Shell Pipeline Company a Notice of Amendment citing several inadequacies with the Falcon’s construction, including:
Shell responded with its amended procedures on July 27, 2020, and PHMSA closed the case on August 13, 2020.
Of note, PHMSA states it is basing this Notice on an inspection conducted between April 9th and 11th, 2019, when construction on the Falcon had only recently started. PHMSA has confirmed its investigation on the Falcon is ongoing, however we question the accuracy of self reported data given to PHMSA inspectors should be questioned
The PA DEP also brought the matter to the attention of the US Environmental Protection Agency.
The Falcon pipeline also crosses through Ohio and briefly, West Virginia. While we do not know how these states are involved in these investigations, our past analyses raise concerns about the Ohio Environmental Protection Agency’s (OEPA) ability to regulate the pipeline’s HDD crossings.
One of the focuses of the Pennsylvania DEP’s investigation is the failure to report drilling fluid spills that occur while constructing a HDD crossing. The PA DEP shut down all HDD operations in November, 2019 and forced Shell to use monitors to calculate spills, as was stated in permit applications.
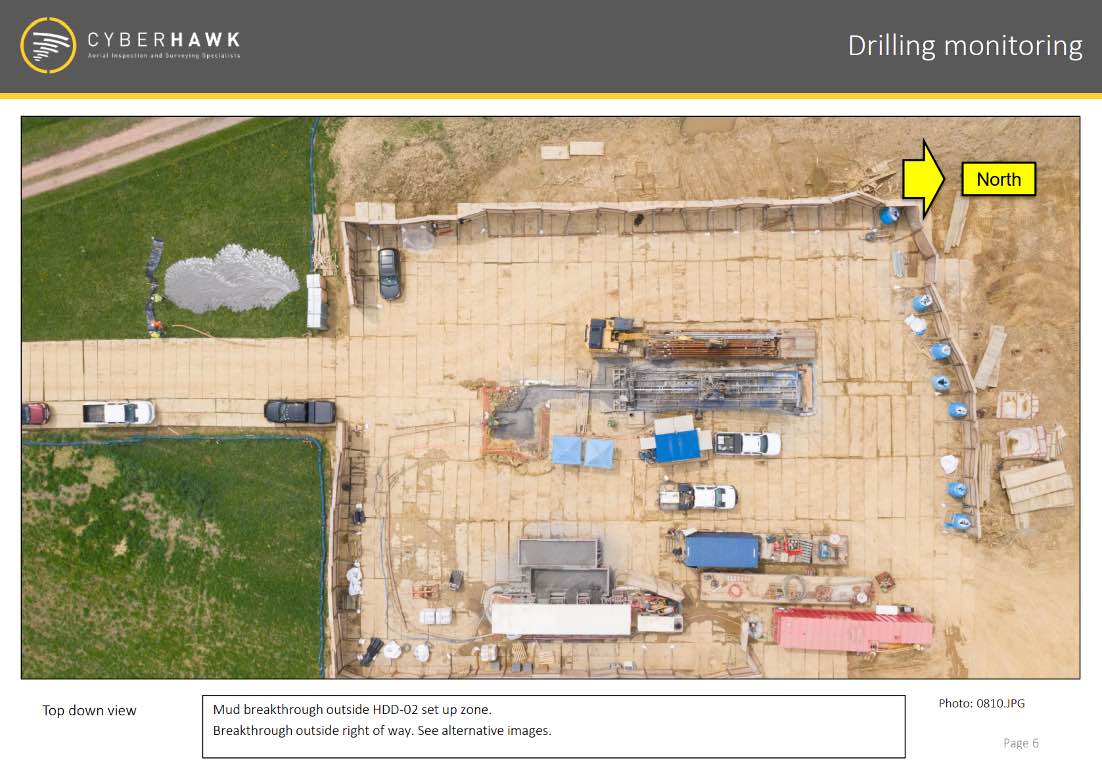
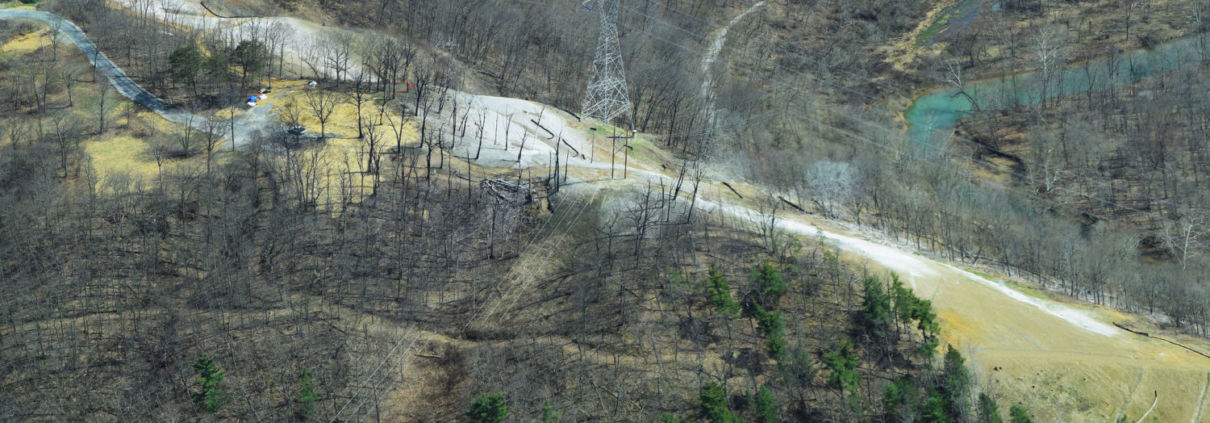
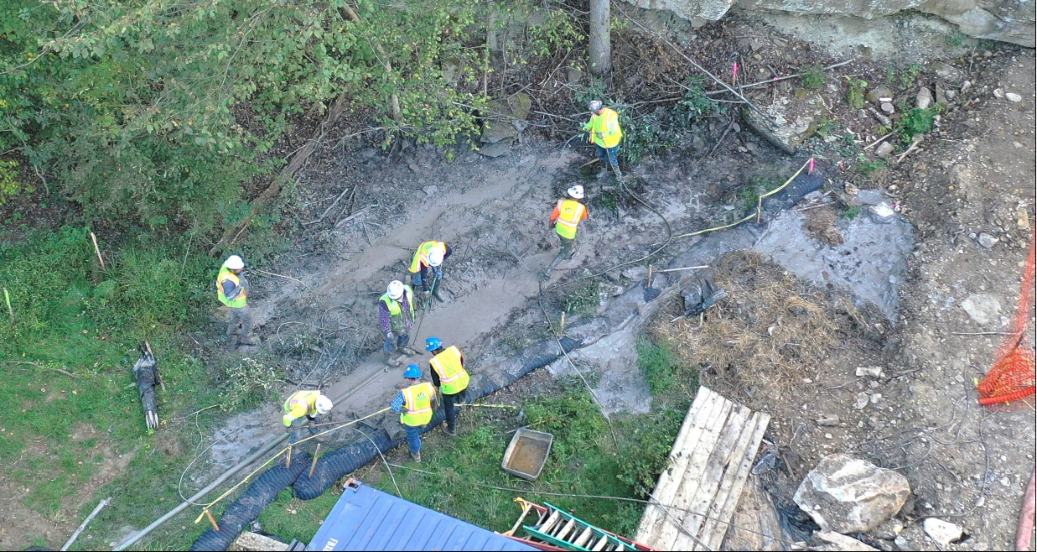
A horizontal directional drilling (HDD) construction site for the Falcon Pipeline in Southview, Washington County, Pennsylvania. You can see where the drilling mud has returned to the surface in the top left of the photo. Photo by Cyberhawk obtained by FracTracker Alliance through a right-to-know request with the Pennsylvania Department of Environmental Protection.
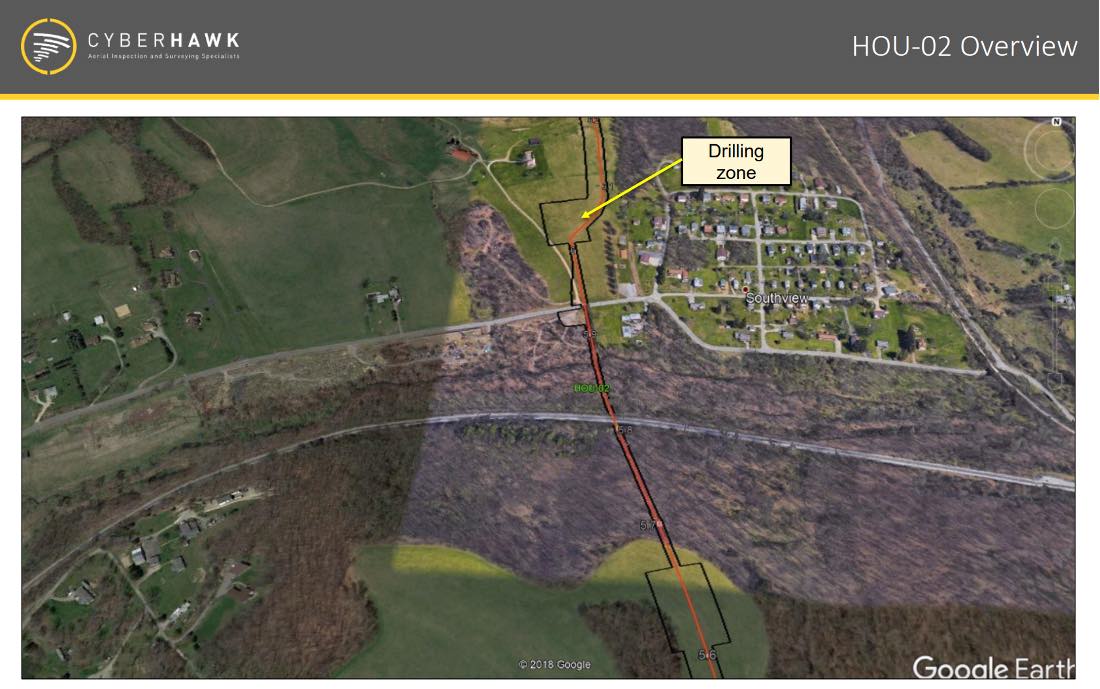
The Falcon Pipeline’s HDD locations are often close to neighborhoods, like the HOU-02 crossing in Southview, Washington County, Pennsylvania. Photo by Cyberhawk obtained by FracTracker Alliance through a right-to-know request with the Pennsylvania Department of Environmental Protection.
To our knowledge, the OEPA did not enforce this procedure, instead relying on workers to manually calculate and report spills. Shell’s failure to accurately self-report raises concerns about the safety of the Falcon’s HDD crossings in Ohio, including the crossing beneath the Ohio River, just upstream of drinking water intakes for Toronto and Steubenville, Ohio.
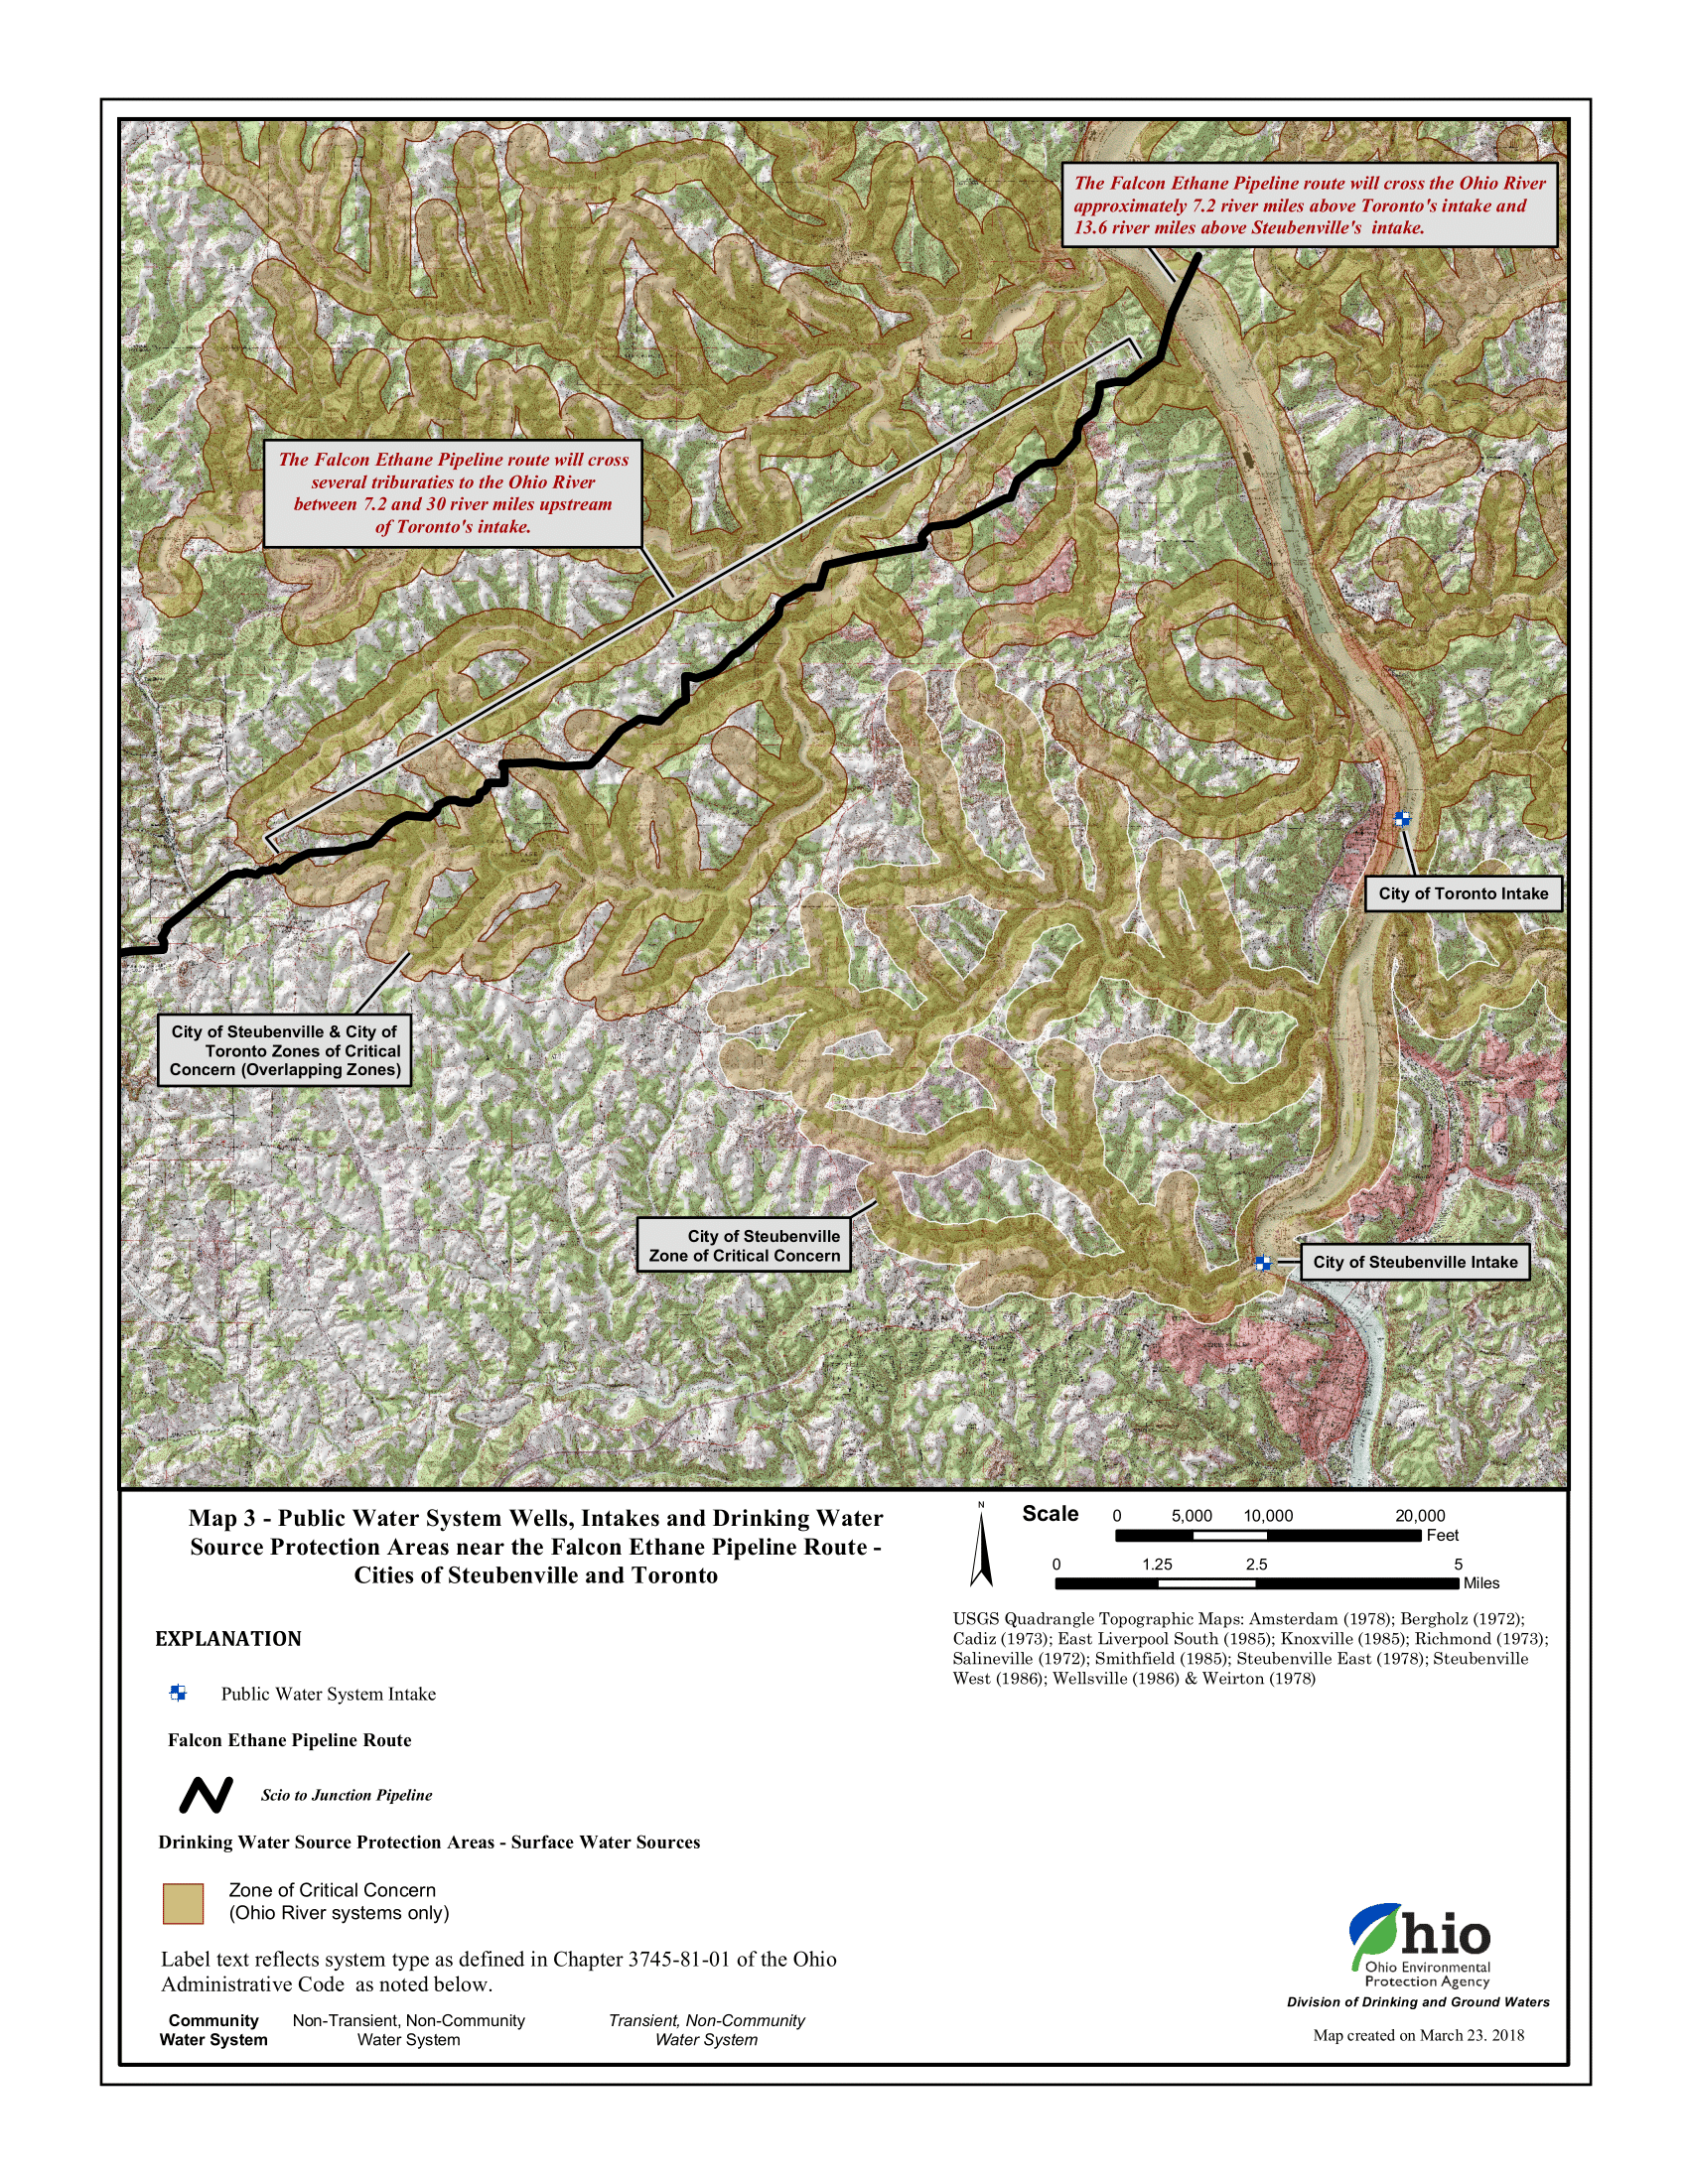
Public water system wells, intakes, and Drinking Water Source Protection Areas nears the Falcon Pipeline Route. Note, the pipeline route may have slightly changed since this map was produced. Source: Ohio EPA
The Falcon is connected to one of Shell’s most high-profile projects: a $6 billion to $10 billion plastic manufacturing plant, commonly referred to as the Shell ethane cracker, in Beaver County, Pennsylvania. These massive projects represent the oil and gas industry’s far-fetched dream of a new age of manufacturing in the region that would revolve around converting fracked gas into plastic, much of which would be exported overseas.
Many in the Ohio River Valley have raised serious concerns over the public health implications of a petrochemical buildout. The United States’ current petrochemical hub is in the Gulf Coast, including a stretch of Louisiana known colloquially as “Cancer Alley” because of the high risk of cancer from industrial pollution.
Construction of the ethane cracker and the Falcon pipeline have forged forward during the COVID-19 pandemic. In another example of the culture of fear at the worksite, several workers expressed concern that speaking publicly about unsafe working conditions that made social distancing impossible would cost them their jobs. Yet the state has allowed work to continue on at the plant, going so far as to grant Shell the approval to continue work without the waiver most businesses had to obtain. As of December 2020, over 274 Shell workers had contracted the coronavirus.
While the oil and gas industry had initially planned several ethane crackers for the region, all companies except for Shell have pulled out or put their plans on hold, likely due to the industry’s weak financial outlook.
A June 2020 report by the Institute for Energy Economics and Financial Analysis (IEEFA), stated that:
Royal Dutch Shell owes a more complete explanation to shareholders and the people of Pennsylvania of how it is managing risk. Shell remains optimistic regarding the prospects for its Pennsylvania Petrochemical Complex in Beaver County, Penn. The complex, which is expected to open in 2021 or 2022, is part of a larger planned buildout of plastics capacity in the Ohio River Valley and the U.S. IEEFA concludes that the current risk profile indicates the complex will open to market conditions that are more challenging than when the project was planned. The complex is likely to be less profitable than expected and face an extended period of financial distress.
Many of Pennsylvania’s elected officials have gone to great lengths to support this project. The Corbett administration enticed Shell to build this plastic factory in Pennsylvania by offering Shell a tax break for each barrel of fracked gas it buys from companies in the state and converts to plastic (valued at $66 million each year). The state declared the construction site a Keystone Opportunity Zone, giving Shell a 15-year exemption from state and local taxes. In exchange, Shell had to provide at least 2,500 temporary construction jobs and invest $1 billion in the state, giving the company an incredible amount of power to decide where resources are allocated in Pennsylvania.
Would the state have asked Shell for more than 2,500 construction jobs if it knew these jobs could be taken away when workers spoke out against life-threatening conditions? Will the politicians who have hailed oil and gas as the only job creator in the region care when workers are forced to hide their identity when communicating with public agencies?
The PA DEP appears to have played a key role in calling for this investigation, yet the agency itself was recently at the center of a different investigation led by Pennsylvania Attorney General Josh Shapiro. The resulting Investigating Grand Jury Report revealed systematic failure by the PA DEP and the state’s Department of Health to regulate the unconventional oil and gas industry. One of the failures was that the Department seldom referred environmental crimes to the Attorney General’s Office, which must occur before the Office has the authority to prosecute.
The Office of Attorney General is involved in this investigation, which the PA DEP is referring to as noncriminal.
The Grand Jury Report also cited concerns about “the revolving door” that shuffled PA DEP employees into higher-paying jobs in the oil and gas industry. The report cited examples of PA DEP employees skirting regulations to perform special favors for companies they wished to be hired by. The watchdog research organization Little Sis listed 47 fracking regulators in Pennsylvania that have moved back and forth between the energy industry, including Shell’s Government Relations Advisor, John Hines.
The Falcon Pipeline sits empty as people across the nation are amping up pressure on President Biden to pursue bold action in pursuit of environmental justice and a just transition to clean energy. Following Biden’s cancellation of the Keystone XL pipeline, Indigenous leaders are calling for him to shut down other projects including Enbridge Line 3 and the Dakota Access Pipeline.
Over a hundred groups representing millions of people have signed on to the Build Back Fossil Free campaign, imploring Biden to create new jobs through climate mobilization. Americans are also pushing Biden to be a Plastic Free President and take immediate action to address plastic pollution by suspending and denying permits for new projects like the Shell ethane cracker that convert fracked gas into plastic.
If brought online, the Falcon pipeline and Shell ethane cracker will lock in decades of more fracking, greenhouse gasses, dangerous pollution, and single-use plastic production.
Just as concerning, Shell will need to tighten its parasitic grip on the state’s economic and legislative landscape to keep this plant running. Current economic and political conditions are not favorable for the Shell ethane cracker: financial analysts report that its profits will be significantly less than originally presented. If the plant is brought online, Shell’s lobbyists and public relations firms will be using every tactic to create conditions that support Shell’s bottom line, not the well-being of residents in the Ohio River Valley. Politicians will be encouraged to pass more preemptive laws to block bans on plastic bags and straws to keep up demand for the ethane cracker’s product. Lobbyists will continue pushing for legislation that imposes harsh fines and felony charges on people who protest oil and gas infrastructure, while oil and gas companies continue to fund police foundations. Shell will ensure that Pennsylvania keeps extracting fossil fuels to feed its ethane cracker.
The Falcon pipeline is at odds with global demands to address plastic and climate crises. As these new documents reveal, it also poses immediate threats to residents along its route. While we’re eager for more information from state and federal agencies to understand the details of this investigation, it’s clear that there is no safe way forward with the Falcon Pipeline.
Royal Dutch Shell has been exerting control over people through the extraction of their natural resources ever since it began drilling for oil in Dutch and British colonies in the 19th Century. What will it take to end its reign?
Health & Safety | Legislation & Politics | Petrochemicals & Plastics | Pipelines
As a spring 2020 intern with FracTracker, my work mostly involved mapping gathering lines in West Virginia and Ohio. Gathering lines are pipelines that transport oil and gas from the wellhead to either compressor stations or storage/processing facilities. The transmission pipelines (which are often larger in diameter than gathering lines) take the oil and gas from the processing facilities to other storage facilities/compressor stations, or to distribution pipelines which go to end users and consumers. As you can see from Figure 2 in the map of Doddridge County, WV, many gathering lines eventually converge at a compressor station. You can think of gathering lines like small brooks and streams that feed transmission pipelines. The transmission lines are the main arteries, like a river, moving larger quantities of gas and oil over longer distances.
The main project and goal of my internship was to record as many gathering pipelines as I could find in Ohio and West Virginia, since gathering lines are not generally mapped and therefore not easily available for the public to view. For example, the National Pipeline Mapping System’s public map viewer (created by the Department of Transportation Pipeline and Hazardous Materials Safety Administration) has a note stating, “It does not contain gas gathering or distribution pipelines.” Mapping gathering lines makes this data accessible to the public and will allow us to see the bigger picture when it comes to assessing the environmental impact of pipelines.
After collecting gathering line location data, I performed GIS analysis to determine the amount of acreage of land that has been clearcut due to gathering pipeline installations.
Another analysis we could perform using this data is to count the total number of waterways that the gathering lines cross/interact with and assess the quality of water and wildlife in areas with higher concentrations of gathering pipelines.
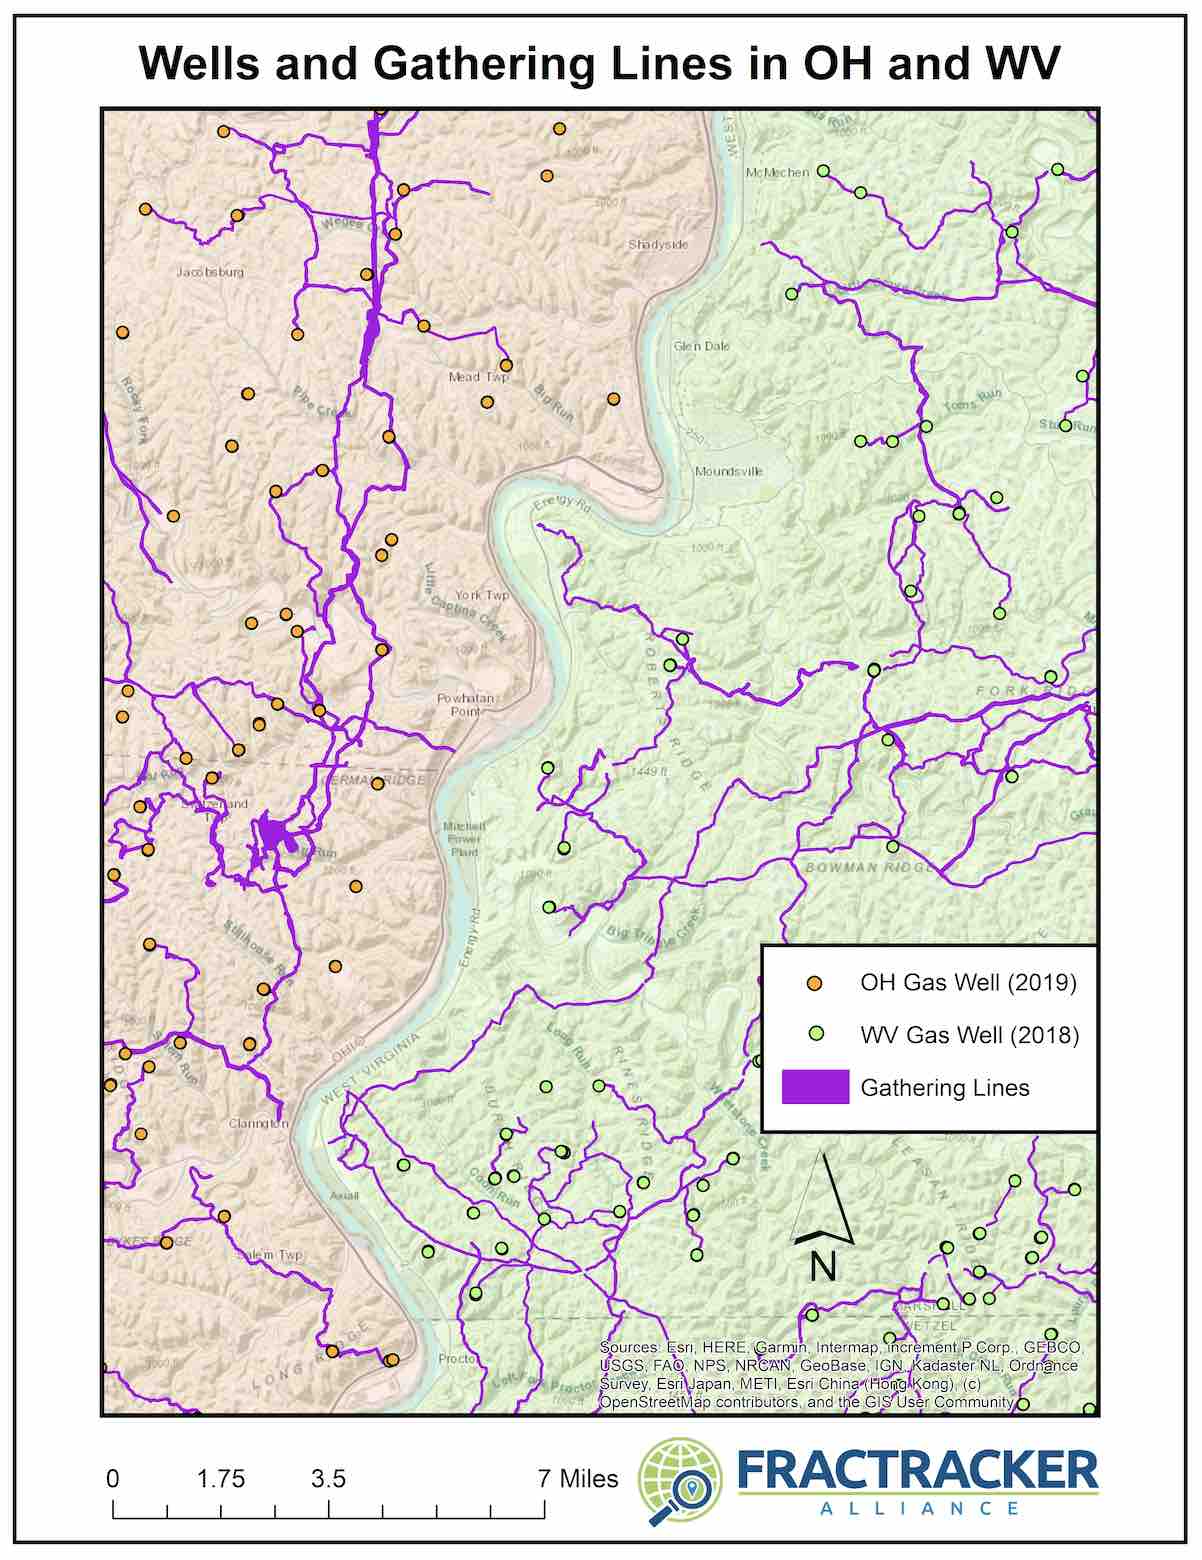
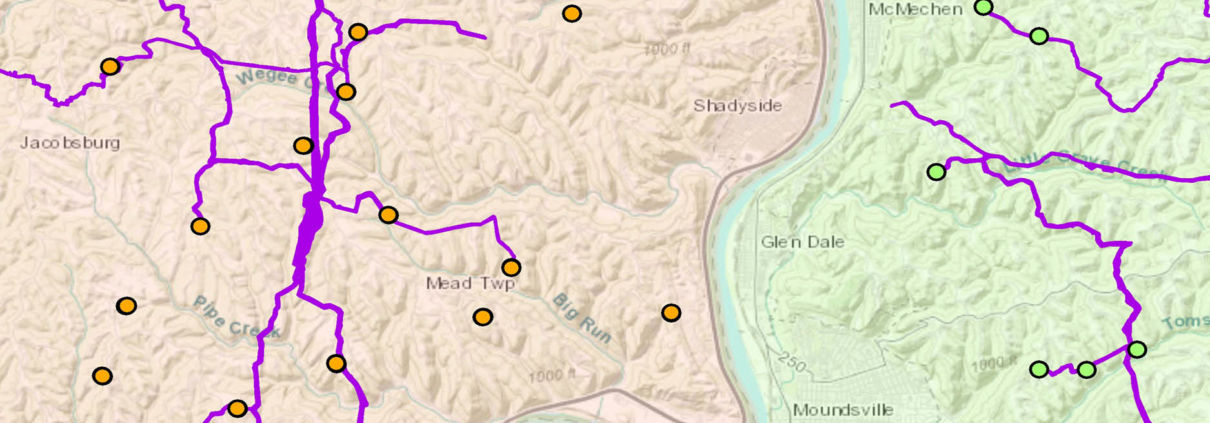
Figure 1. This map shows an overview of gathering line pipelines in the Powhatan Point, Ohio and Moundsville, West Virginia of the Ohio River Valley.
I worked with an aerial imagery BaseMap layer (a BaseMap is the bottommost layer when viewing a map), a county boundaries layer, production well location points, and compressor station location points. I then traced lines on the earth that appeared to be gathering lines by creating polygon shapefiles in the GIS application ArcMap.
My methodology and process of finding the actual routes of the gathering lines included examining locations at various map scale ranges to find emerging line patterns of barren land that connect different production well points on the map. I would either concentrate on looking for patterns along well pad location points and look for paths that may connect those points, or I would begin at the nearest gathering line I had recorded to try to find off-shoot paths off of those pipelines that may connect to a well pad, compressor station or previously recorded gathering line.
I did run into a few problems during my search for gathering lines. Sometimes, I would begin to trace a gathering line path, only to either loose the path entirely, or on further inspection, find that it was a power line path. Other times when using the aerial imagery basemap, the gathering line would flow into an aerial photo from a year prior to the pipeline installation and I would again lose the path. To work around these issues, I would first follow the gathering line trail to its end point before I started tracing the path. I would also view the path very closely in various scale ranges to ensure I wasn’t tracing a road, waterway, or powerline pathway.
In the three months that I was working on recording gathering pipeline paths in Ohio and West Virginia, I found approximately 29,103 acres (3,494 miles) of barren land clearcut by gathering pipelines. These total amounts are not exact since not all gathering lines can be confirmed. There are still more gathering lines to be recorded in both Ohio and West Virginia, but these figures give the reader an idea of the land disturbance caused by gathering lines, as shown in Figures 1 and 2.
In Ohio, I recorded approximately 10,083 acres (641 miles) with the average individual gathering pipeline taking up about 45 acres of land. With my gathering line data and data previously recorded by FracTracker, I found that there are 28,490 acres (1,690 miles) of land spanning 9 counties in southeastern Ohio that have been cleared and used by gathering lines.
For West Virginia, I was able to record approximately 19,020 acres (1,547 miles) of gathering lines, with the average gathering line taking up about 48 acres of space each. With previous data recorded in West Virginia by FracTracker, the total we have so far for the state is 22,897 acres (1,804 miles), although that is only accounting for the 9 counties in northern West Virginia that are recorded.
Figure 2. This aerial view map shows connecting gathering line pipelines that cover a small portion of Doddridge County, WV.
I was shocked to see how many gathering lines there are in these rural areas. Not only are they very prevalent in these less populated communities, but it was surprising to see how concentrated and close together they tend to be. When most people think of pipelines, they think of the big transmission pipeline paths that cross multiple states and are unaware of how much land that the infrastructure of these gathering pipelines also take up.
It was also very eye-opening to find that there are at least 29,000 acres of land in Ohio and West Virginia that were clearcut for the installation of gathering lines. It is even more shocking that these gathering pipelines are not being recorded or mapped and that this data is not publicly available from the National Pipeline Mapping System. While driving through these areas you may only see one or two pipelines briefly from your car, but by viewing the land from a bird’s eye perspective, you get a sense of the scale of this massive network. While the transmission pipeline arteries tend to be bigger, the veins of gathering lines displace a large amount of land as well.
I was also surprised by the sheer number of gathering lines I found that crossed waterways, rivers, and streams. During this project, it wasn’t unusual at all to follow a gathering line path that would cross water multiple times. In the future, I would be interested to look at the number of times these gathering pipelines cross paths with a stream or river, and the impact that this has on water quality and surrounding environment. I hope to continue to record gathering lines in Ohio and West Virginia, as well as Pennsylvania, so that we may learn more about this infrastructure and the impact it may have on the environment.
I first heard of FracTracker three years ago when I was volunteering with an environmental group called Keep Wayne Wild in Ohio. Since learning about FracTracker, I have been impressed with their eye-opening projects and their ability to make the gas and oil industry more transparent. A few years after first hearing about FracTracker, and as my interest in the GIS field continued to grow, I began taking GIS classes and reached out to them for this internship opportunity.
By Trevor Oatts, FracTracker Spring 2020 Data & GIS Intern
Part of the Falcon Public Environmental Impact Assessment – a FracTracker series on the impacts of Falcon Ethane Pipeline System
Challenges have plagued Shell’s construction of the Falcon Pipeline System through Pennsylvania, Ohio, and West Virginia, according to documents from the Pennsylvania Department of Environmental Protection (DEP) and the Ohio Environmental Protection Agency (EPA).
Records show that at least 70 spills have occurred since construction began in early 2019, releasing over a quarter million gallons of drilling fluid. Yet the true number and volume of spills is uncertain due to inaccuracies in reporting by Shell and discrepancies in regulation by state agencies.
A drilling fluid spill from Falcon Pipeline construction near Moffett Mill Road in Beaver County, PA. Source: Pennsylvania DEP
Releases of drilling fluid during Falcon’s construction include inadvertent returns and losses of circulation – two technical words used to describe spills of drilling fluid that occur during pipeline construction.
Drilling fluid, which consists of water, bentonite clay, and chemical additives, is used when workers drill a borehole horizontally underground to pull a pipeline underneath a water body, road, or other sensitive location. This type of installation is called a HDD (horizontal directional drill), and is pictured in Figure 1.
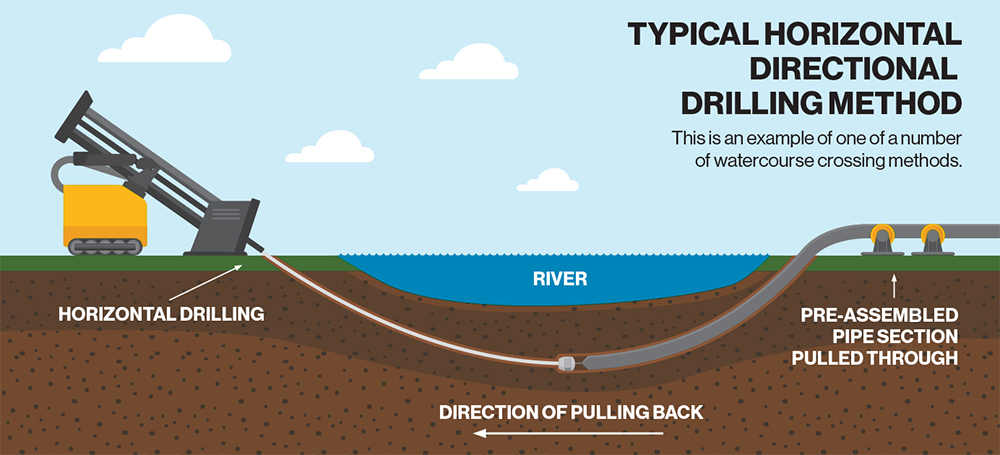
Figure 1. An HDD operation – Thousands of gallons of drilling fluid are used in this process, creating the potential for spills. Click to expand. Source: Enbridge Pipeline
Here’s a breakdown of what these types of spills are and how often they’ve occurred during Falcon pipeline construction, as of March, 2020:
However, according to the Ohio EPA, Shell is not required to submit reports for losses of circulation that are less than the definition of an inadvertent return, so many losses may not be captured in the list above. Additionally, documents reveal inconsistent volumes of drilling mud reported and discrepancies in the way releases are regulated by the Pennsylvania DEP and the Ohio EPA.
Very few of these incidents were published online for the public to see; FracTracker obtained information on them through a public records request. The map below shows the location of all known drilling fluid releases from that request, along with features relevant to the pipeline’s construction. Click here to view full screen, and add features to the map by checking the box next to them in the legend. For definitions and additional details, click on the information icon.
Our investigation into these incidents began early this year when we received an anonymous tip about a release of drilling fluids in the range of millions of gallons at the SCIO-06 HDD over Wolf Run Road in Jefferson County, Ohio. The source stated that the release could be contaminating drinking water for residents and livestock.
Working with Clean Air Council, Fair Shake Environmental Legal Services, and DeSmog Blog, we quickly discovered that this spill was just the beginning of the Falcon’s construction issues.
Documents from the Ohio EPA confirm that there were at least eight losses of circulation at this location between August 2019 and January 2020, including losses of unknown volume. The SCIO-06 HDD location is of particular concern because it crosses beneath two streams (Wolf Run and a stream connected to Wolf Run) and a wetland, is near groundwater wells, and runs over an inactive coal mine (Figure 2).
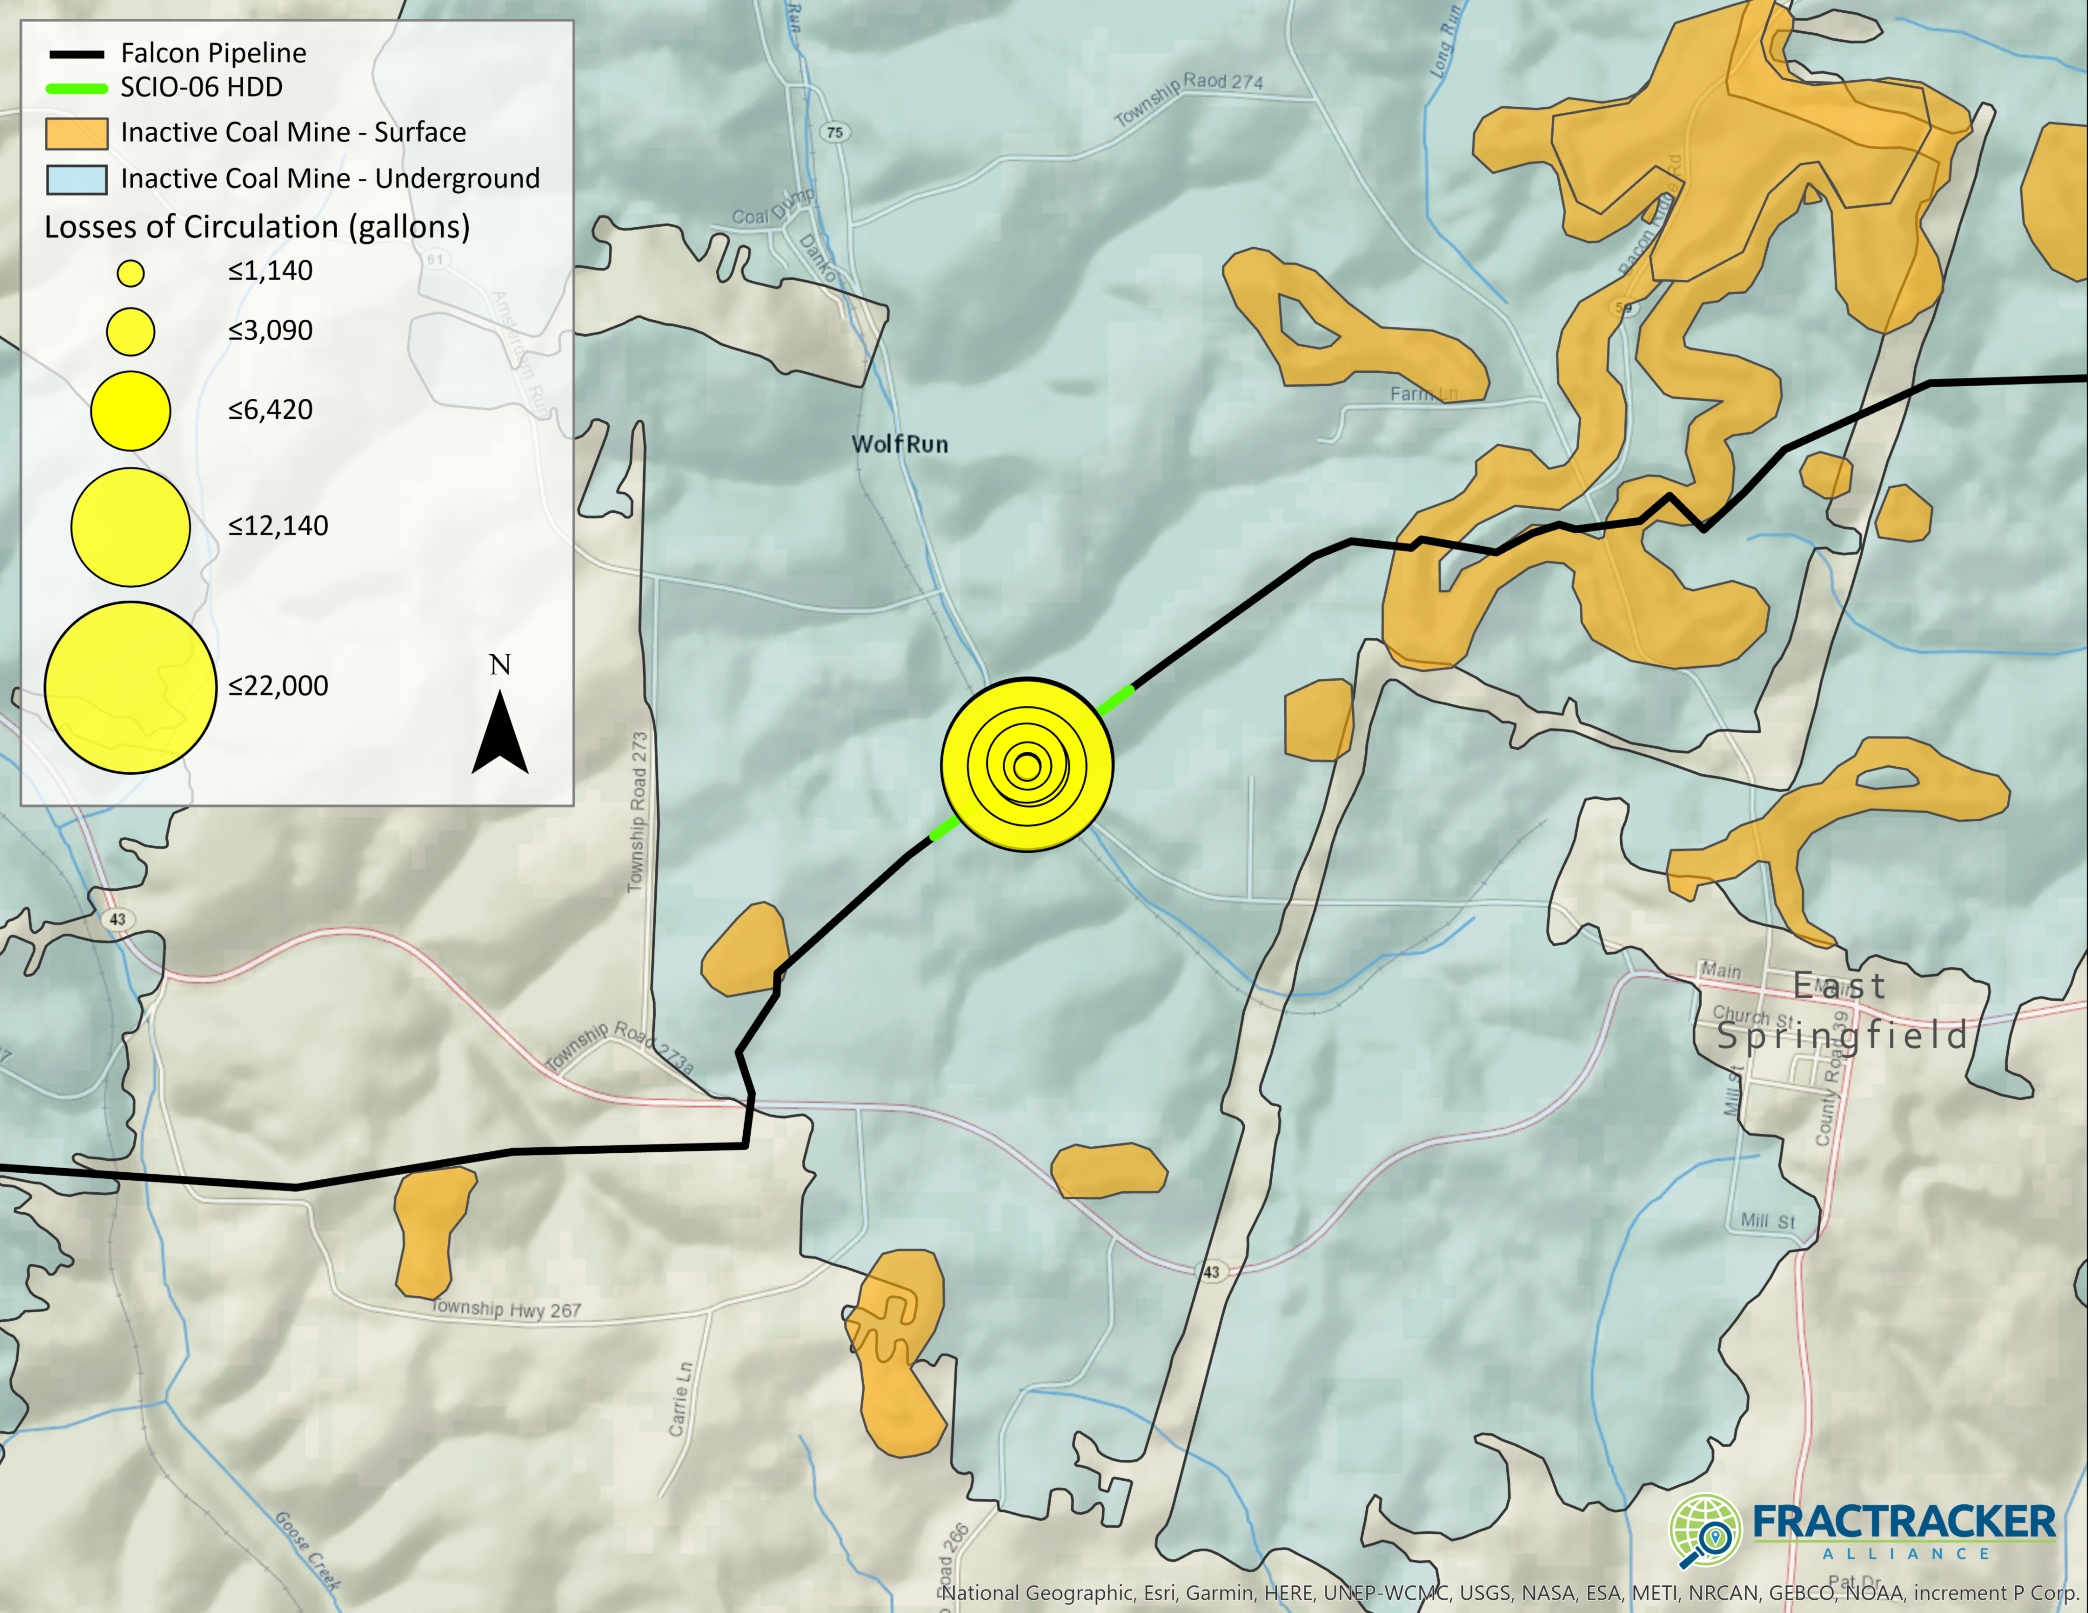
Figure 2. Losses of circulation that occurred at the SCIO-06 horizontal directional drill (HDD) site along the Falcon Pipeline in Jefferson County Ohio. Data Sources: OH EPA, AECOM
According to Shell’s survey, the coal mine (shown in Figure 2 in blue) is 290 feet below the HDD crossing. A hazardous scenario could arise if an HDD site interacts with mine voids, releasing drilling fluid into the void and creating a new mine void discharge.
A similar situation occurred in 2018, when EQT Corp. was fined $294,000 after the pipeline it was installing under a road in Forward Township, Pennsylvania hit an old mine, releasing four million gallons of mine drainage into the Monongahela River.
The Ohio EPA’s Division of Drinking and Ground Waters looked into the issues around this site and reported, “GIS analysis of the pipeline location in Jefferson Co. does not appear to risk any vulnerable ground water resources in the area, except local private water supply wells. However, the incident location is above a known abandoned (pre-1977) coal mine complex, mapped by ODNR.”
While we cannot confirm if there was a spill in the range of millions of gallons as the source claimed, the reported losses of circulation at the SCIO-06 site total over 60,000 gallons of drilling fluid. Additionally, on December 10th, 2019, the Ohio EPA asked AECOM (the engineering company contracted by Shell for this project) to estimate what the total fluid loss would be if workers were to continue drilling to complete the SCIO-06 crossing. AECOM reported that, in a “very conservative scenario based on the current level of fluid loss…Overall mud loss to the formation could exceed 3,000,000 gallons.”
Despite this possibility of a 3 million+ gallon spill, Shell resumed construction in January, 2020. The company experienced another loss of circulation of 4,583 gallons, reportedly caused by a change in formation. However, in correspondence with a resident, Shell stated that the volume lost was 3,200 gallons.
Whatever the amount, this January loss of circulation appears to have convinced Shell that an HDD crossing at this location was too difficult to complete, and in February 2020, Shell decided to change the type of crossing at the SCIO-06 site to a guided bore underneath Wolf Run Rd and open cut trench through the stream crossings (Figure 3).
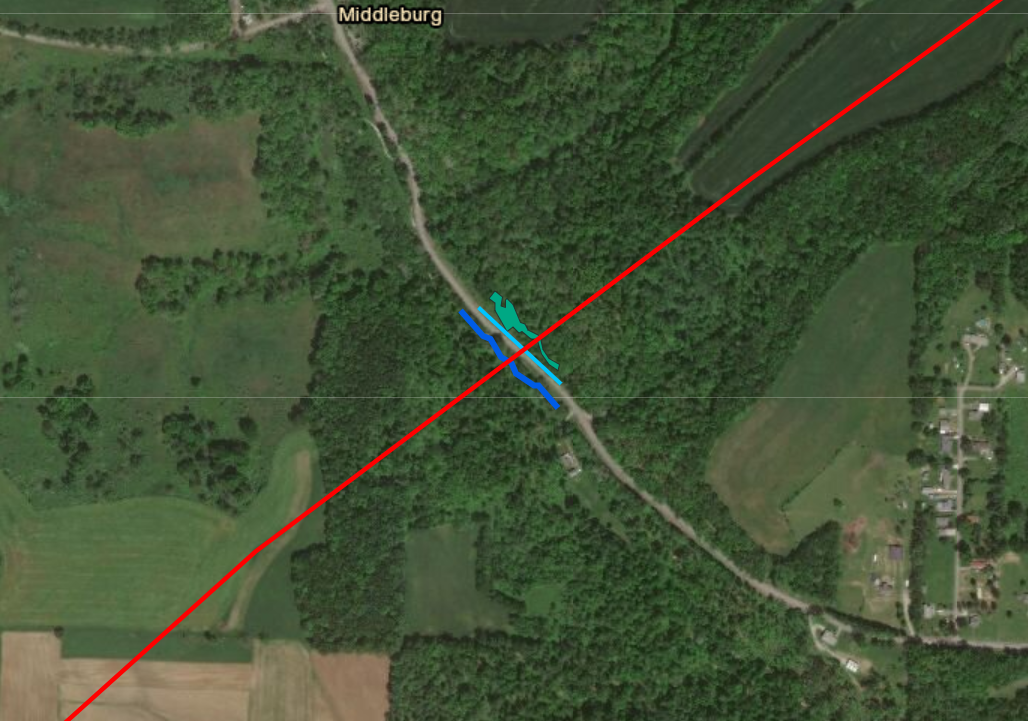
Figure 3. The SCIO-06 HDD site, which may be changed from an HDD crossing to an open cut trench and conventional bore to cross Wolf Run Rd, Wolf Run stream (darker blue), an intermittent stream (light blue) and a wetland (teal). Click to expand.
An investigation by DeSmog Blog revealed that Shell applied for the route change under Nationwide Permit 12, a permit required for water crossings. While the Army Corps of Engineers authorized the route change on March 17th, one month later, a Montana federal court overseeing a case on the Keystone XL pipeline determined that the Nationwide Permit 12 did not meet standards set by federal environmental laws – a decision which may nullify the Falcon’s permit status. At this time, the ramifications of this decision on the Falcon remain unclear.
In looking through Shell’s loss of circulation reports, we noted several discrepancies about the volume of drilling fluid released for different spills, including those that occurred at the SCIO-06 site. As one example, the Ohio EPA stated an email about the SCIO-06 HDD, “The reported loss of fluid from August 1, 2019 to August 14, 2019 in the memo does not appear to agree with the 21,950 gallons of fluid loss reported to me during my site visit on August 14, 2019 or the fluid loss reported in the conference call on August 13, 2019.”
In addition to errors on Shell’s end, our review of documents revealed significant confusion around the regulation of drilling fluid spills. In an email from September 26, 2019, months after construction began, Shell raised the following questions with the Ohio EPA:
A possible explanation for why Shell reported inconsistent volumes of spills is because they were not using the proper technology to measure them.
Shell’s “Inadvertent Returns from HDD: Assessment, Preparedness, Prevention and Response Plan” states that drilling rigs must be equipped with “instruments which can measure and record in real time, the following information: borehole annular pressure during the pilot hole operation; drilling fluid discharge rate; the spatial position of the drilling bit or reamer bit; and the drill string axial and torsional loads.”
In other words, Shell should be using monitoring equipment to measure and report volumes of drilling fluid released.
Despite that requirement, Shell was initially monitoring releases manually by measuring the remaining fluid levels in tanks. After inspectors with the Pennsylvania DEP realized this in October, 2019, the Department issued a Notice of Violation to Shell, asking the company to immediately cease all Pennsylvania HDD operations and implement recording instruments. The violation also cited Shell for not filing weekly inadvertent return reports and not reporting where recovered drilling fluids were disposed.
In Ohio, there is no record of a similar request from the Ohio EPA. The anonymous source that originally informed us of issues at the SCIO-6 HDD stated that local officials and regulatory agencies in Ohio were likely not informed of the full volumes of the industrial waste releases based on actual meter readings, but rather estimates that minimize the perceived impact.
While we cannot confirm this claim, we know a few things for sure: 1) there are conflicting reports about the volume of drilling fluids spilled in Ohio, 2) according to Shell’s engineers, there is the potential for a 3 million+ gallon spill at the SCIO-06 site, and 3) there are instances of Shell not following its permits with regard to measuring and reporting fluid losses.
The inconsistent ways that fluid losses (particularly those that occur underground) are defined, reported, and measured leave too many opportunities for Shell to impact sensitive ecosystems and drinking water sources without being held accountable.
Drilling fluid is primarily composed of water and bentonite clay (sodium montmorillonite), which is nontoxic. If a fluid loss occurs, workers often use additives to try and create a seal to prevent drilling fluid from escaping into underground voids. According to Shell’s “Inadvertent Returns From HDD” plan, it only uses additives that meet food standards, are not petroleum based, and are consistent with materials used in drinking water operations.
However, large inadvertent returns into waterways cause heavy sedimentation and can have harmful effects on aquatic life. They can also ruin drinking water sources. Inadvertent returns caused by HDD construction along the Mariner East 2 pipeline have contaminated many water wells.
Losses of circulation can impact drinking water too. This past April in Texas, construction of the Permian Highway Pipeline caused a loss that left residents with muddy well water. A 3 million gallon loss of circulation along the Mariner East route led to 208,000 gallons of drilling mud entering a lake, and a $2 million fine for Sunoco, the pipeline’s operator.
Our Falcon Public EIA Project found 240 groundwater wells within 1/4 mile of the pipeline and 24 within 1,000 ft of an HDD site. The pipeline also crosses near surface water reservoirs. Drilling mud spills could put these drinking water sources at risk.
But when it comes to understanding the true impact of the more than 245,000+ gallons of drilling fluid lost beneath Pennsylvania and Ohio, there are a lot of remaining questions. The Falcon route crosses over roughly 20 miles of under-mined land (including 5.6 miles of active coal mines) and 25 miles of porous karst limestone formations (learn more about karst). Add in to the mix the thousands of abandoned, conventional, and fracked wells in the region – and you start to get a picture of how holey the land is. Where or how drilling fluid interacts with these voids underground is largely unknown.
In addition to the SCIO-04 HDD, there are other drilling fluid losses that occurred in sensitive locations.
In Robinson Township, Pennsylvania, over a dozen losses of circulation (many of which occurred over the span of several days) released a reported 90,067 gallons of drilling fluid into the ground at the HOU-04 HDD. This HDD is above inactive surface and underground mines.
The Falcon passes through and near surface drinking water sources. In Beaver County, Pennsylvania, the pipeline crosses the headwaters of the Ambridge Reservoir and the water line that carries out its water for residents in Beaver County townships (Ambridge, Baden, Economy, Harmony, and New Sewickley) and Allegheny County townships (Leet, Leetsdale, Bell Acres, and Edgeworth). The group Citizens to Protect the Ambridge Reservoir, which formed in 2012 to protect the reservoir from unconventional oil and gas infrastructure, led efforts to stop Falcon Construction, and the Ambridge Water Authority itself called the path of the pipeline “not acceptable.” In response to public pressure, Shell did agree to build a back up line to the West View Water Authority in case issues arose from the Falcon’s construction.
Unfortunately, a 50-gallon inadvertent return was reported at the HDD that crosses the waterline (Figure 4), and a 160 gallon inadvertent return occurred in Raccoon Municipal Park within the watershed and near its protected headwaters (Figure 5). Both of these releases are reported to have occurred within the pipeline’s construction area and not into waterways.

Figure 4) HOU-10 HDD location on the Falcon Pipeline, where 50 gallons were released on the drill pad on 7/9/2019
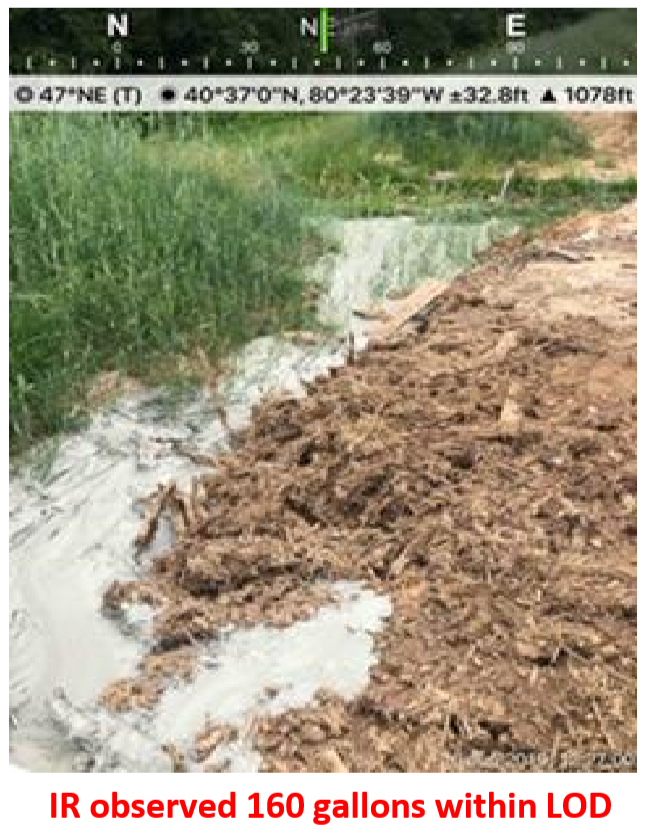
Figure 5) SCIO-05 HDD location on the Falcon Pipeline, where 160 gallons were released on 6/10/19, within the pipeline’s LOD (limit of disturbance)
Farther west, the pipeline crosses through the watershed of the Tappan Reservoir, which provides water for residents in Scio, Ohio and the Ohio River, which serves over 5 million people.
A 35- gallon inadvertent return occurred at a conventional bore within the Tappan Lake Protection Area, impacting a wetland and stream. We are not aware of any spills impacting the Ohio River.
This investigation makes it clear that weak laws and enforcement around drilling fluid spills allows pipeline construction to harm sensitive ecosystems and put drinking water sources at risk. Furthermore, regulations don’t require state agencies or Shell to notify communities when many of these drilling mud spills occur.
Despite the issues Shell experienced during construction, work on the Falcon continued over the past months during state shelter-in-place orders, while many businesses were forced to close.
The problem continues where the 97-mile pipeline ends – at the Shell ethane cracker. In March, workers raised concerns about the unsanitary conditions of the site, and stated that crowded workspaces made social distancing impossible. While Shell did halt construction temporarily, state officials gave the company the OK to continue work – even without the waiver many businesses had to obtain.
The state’s decision was based on the fact it considered the ethane cracker to “support electrical power generation, transmission and distribution.” The ethane cracker – which is still months and likely years away from operation – does not currently produce electrical power and will only provide power generation to support plastic manufacturing.
This claim continues a long pattern of the industry attempting to trick the public into believing that we must continue expanding oil and gas operations to meet our country’s energy needs. In reality, Shell and other oil and gas companies are attempting to line their own pockets by turning the country’s massive oversupply of fracked gas into plastic. And just as Shell and state governments have put the health of residents and workers on the line by continuing construction during a global pandemic, they are sacrificing the health of communities on the frontlines of the plastic industry and climate change by pushing forward the build-out of the petrochemical industry during a global climate crisis.
This election year, while public officials are pushing forward major action to respond to the economic collapse, let’s push for policies and candidates that align with the people’s needs, not Big Oil’s.
By Erica Jackson, Community Outreach & Communications Specialist, FracTracker Alliance
By Kim Fraczek (Sane Energy Project), with input and mapping by Karen Edelstein (FracTracker Alliance)
Despite overwhelming concern about the impacts of fossil fuels on climate chaos, pipeline projects are springing up all over the country in an effort find markets for the surplus of fracked gas extracted from the Marcellus region in Pennsylvania. New Yorkers are directly impacted by these problematic supply chains. The energy company, National Grid, is proposing to raise New Yorkers’ monthly bills in order to complete a new, 30-inch high-pressure fracked gas transmission pipeline through Brooklyn, New York. National Grid euphemistically named the 350-psi pipeline the “The Metropolitan Reliability Pipeline Project.” Gas moving through this pipeline is destined for a National Grid Depot on Newtown Creek, which divides Brooklyn from the borough of Queens. National Grid plans to expand liquefied natural gas (LNG) storage and vaporizer operations at the Depot. The Depot expansion will also facilitate trucking transport of gas to and from North Brooklyn to destinations in Long Island and Massachusetts.
For an industry explanation on how vaporizers work, click here.
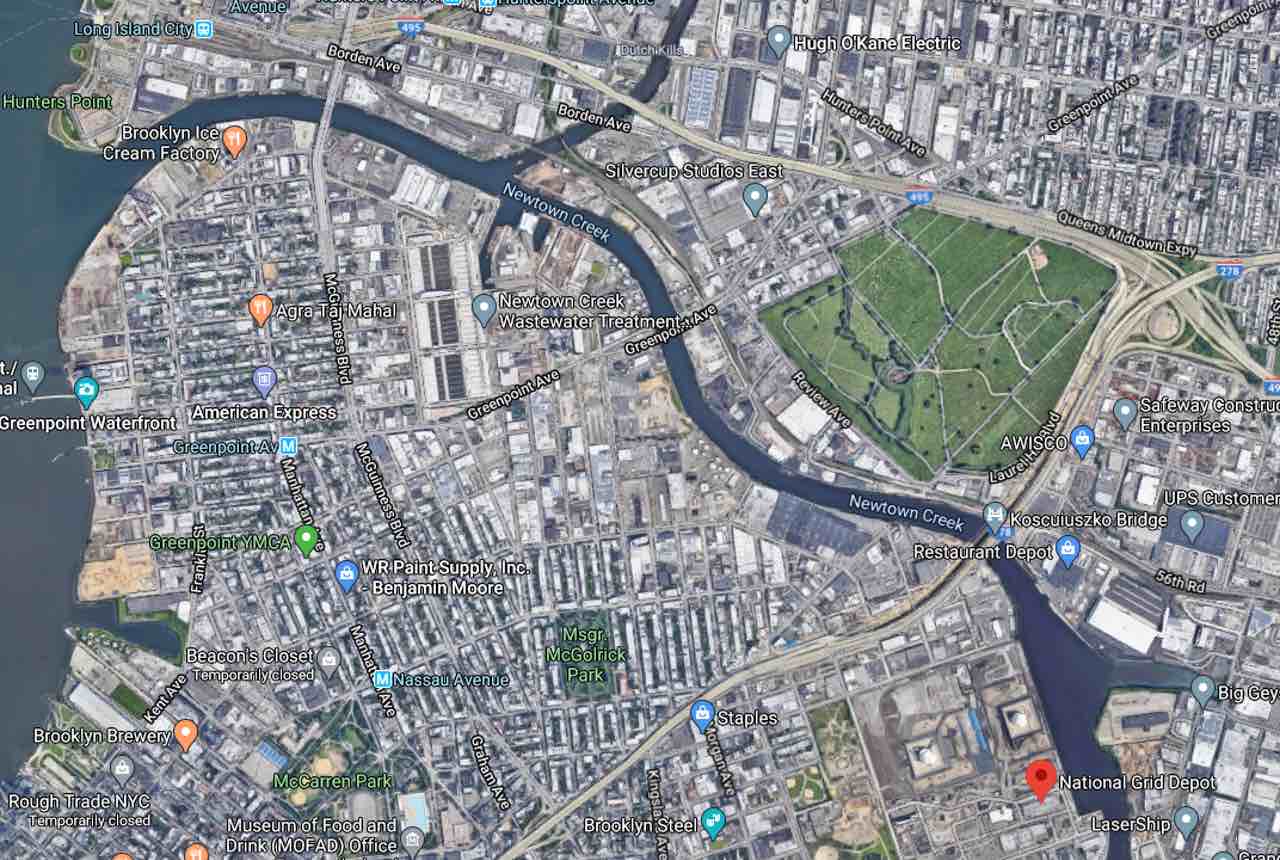
National Grid Depot is located on the western bank of Newtown Creek. Source: Google Maps
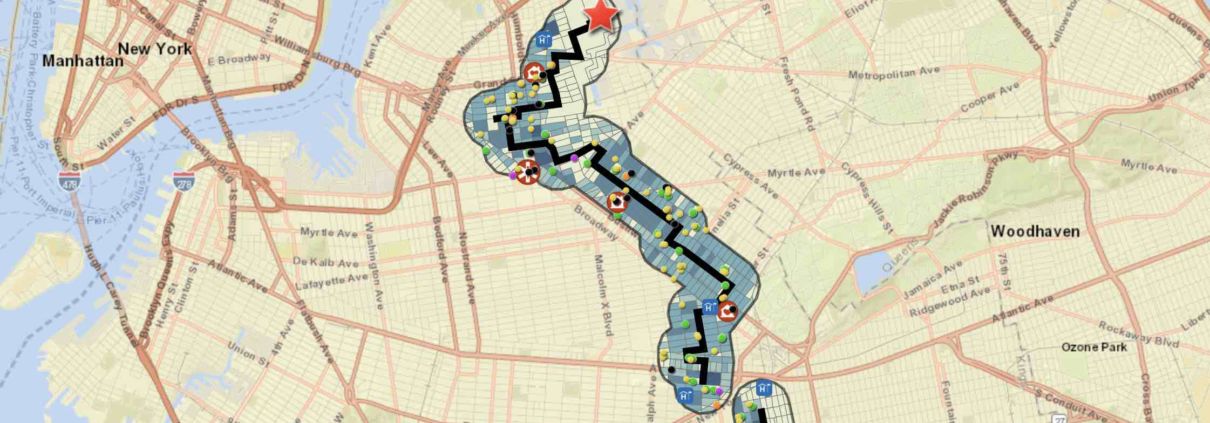
Pipelines also present risks of catching fire and exploding. On average, a 350-psi gas pipeline has an evacuation radius of approximately 1275 feet. FracTracker Alliance created the interactive map, below, using 2010 census data to show population density in the neighborhoods within this blast zone. According to FracTracker, there were 614 reported pipeline incidents in the United States in 2019 alone, resulting in the death of 10 people, injuries to another 35, and about $259 million in damages.
View map fullscreen | How FracTracker maps work
There is widespread community opposition to this pipeline, LNG expansion, and trucking proposal because it will:
Opponents of this pipeline project also raise objections that the pipeline will:
National Grid is currently constructing Phase 4 of the pipeline. However, public pressure and concern about COVID-19 safety measures forced them to stop construction on March 27, 2020. After Governor Cuomo issued an executive order to halt all non-essential work, neighbors reported the company was not mandating personal protective equipment (PPE) nor social distancing for its workers.
Additionally, funding to build north of Montrose Avenue in Bushwick through to Greenpoint—neighborhoods in northeastern Brooklyn on the border with Queens that make up the fifth phase of the pipeline construction—is pending a decision by the Public Service Commission. The approval of the fifth phase of the pipeline would allow it to reach the LNG facility at Greenpoint.
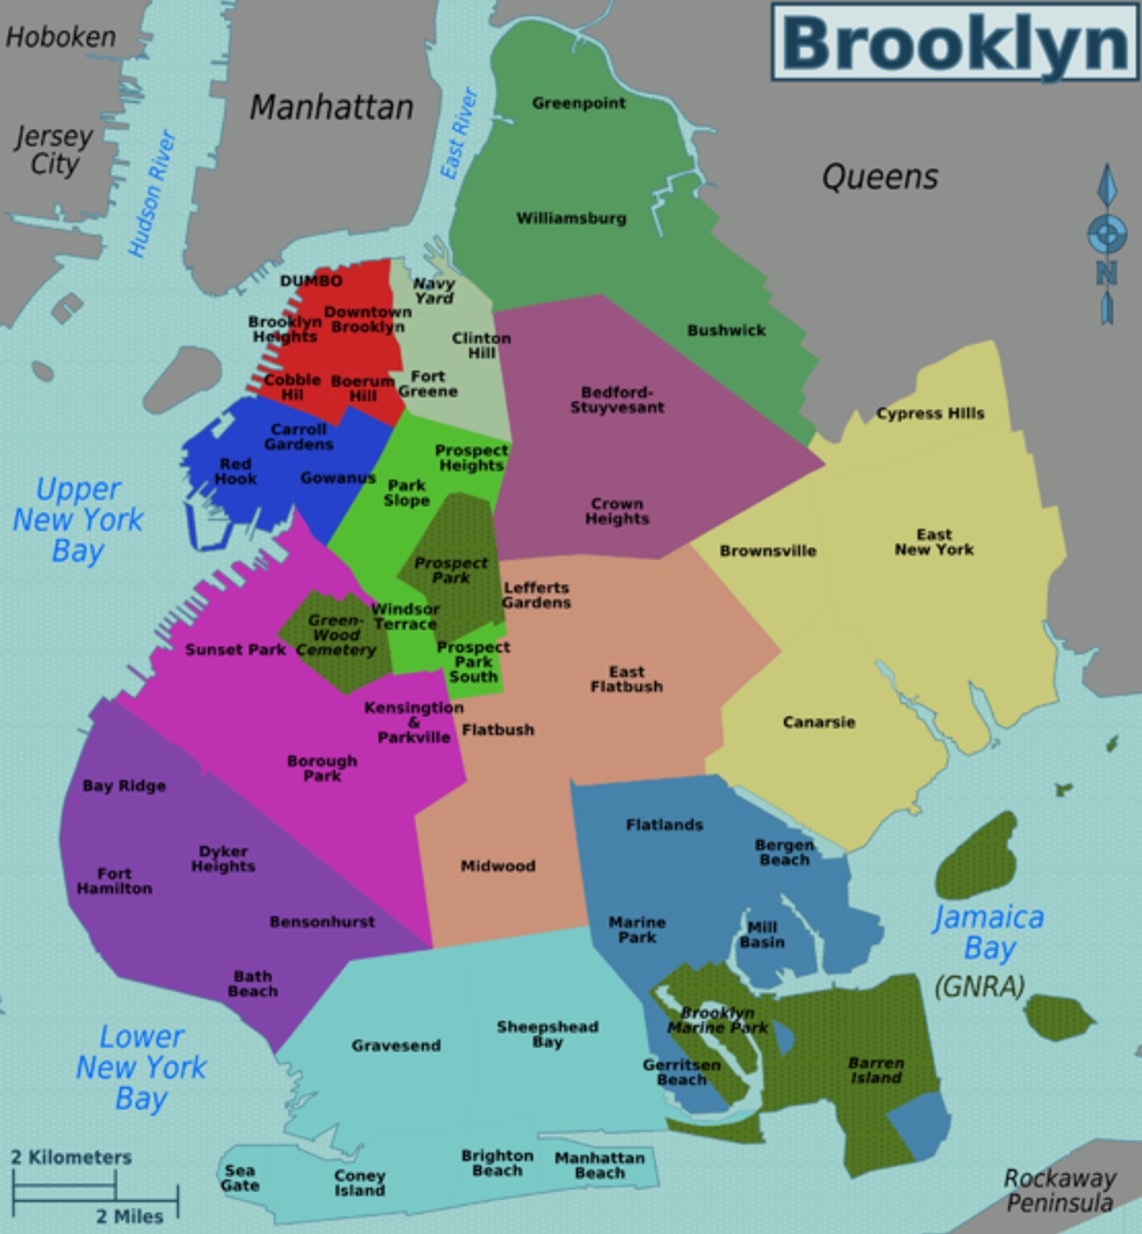
Generalized map of Brooklyn neighborhoods. Source: Wikipedia.
The current National Grid rate case proceeding is in its last stage of discovery, testimony, cross-examination, and final briefs from parties to the rate case. The Administrative Law Judges overseeing the proceeding will review all parties’ information, and make a recommendation to the Public Service Commission, a five-person panel appointed by New York State Governor Cuomo to regulate our utilities. This decision will most likely happen at the monthly meeting on June 18, 2020, where they also may make a decision on National Grid’s Long Term Plan proceeding that could determine the future of LNG expansion in North Brooklyn.
Sane Energy Project has laid out a clear and cogent set of arguments. These include:
As gas prices continue to drop and renewable energy technologies are more accessible and wide-spread, the whole equation that relies on a fossil fuel-based economy becomes more desperate and unsustainable. Many communities are also saying “no” to new pipelines in their communities, so industry is looking to ship fracked gas over land by truck. Another method for disposing of surplus gas is to compress it into LNG (liquefied natural gas) and ship it to international markets by boat.
For more updates on the North Brooklyn Pipeline, check Sane Energy Project’s website. If you live in the New York/Metropolitan area and want to get involved in this fight, there are numerous ways in which you can work with Sane Energy. Click here for details.

FracTracker Alliance has released a new national map, filled with energy and petrochemical data. Explore the map, continue reading to learn more, and see how your state measures up!
This map has been updated since this blog post was originally published, and therefore statistics and figures below may no longer correspond with the map
The items on the map (followed by facility count in parenthesis) include:
For oil and gas wells, view FracTracker’s state maps.
This map is by no means exhaustive, but is exhausting. It takes a lot of infrastructure to meet the energy demands from industries, transportation, residents, and businesses – and the vast majority of these facilities are powered by fossil fuels. What can we learn about the state of our national energy ecosystem from visualizing this infrastructure? And with increasing urgency to decarbonize within the next one to three decades, how close are we to completely reengineering the way we make energy?
The “power plant” legend item on this map contains facilities with an electric generating capacity of at least one megawatt, and includes independent power producers, electric utilities, commercial plants, and industrial plants. What does this data reveal?

Power plants by energy source. Data from EIA.
In terms of the raw number of power plants – solar plants tops the list, with 2,916 facilities, followed by natural gas at 1,747.
In terms of megawatts of electricity generated, the picture is much different – with natural gas supplying the highest percentage of electricity (44%), much more than the second place source, which is coal at 21%, and far more than solar, which generates only 3% (Figure 1).

Figure 1. Electricity generation by source in the United States, 2019. Data from EIA.
This difference speaks to the decentralized nature of the solar industry, with more facilities producing less energy. At a glance, this may seem less efficient and more costly than the natural gas alternative, which has fewer plants producing more energy. But in reality, each of these natural gas plants depend on thousands of fracked wells – and they’re anything but efficient.
The cost per megawatt hour of electricity for a renewable energy power plants is now cheaper than that of fracked gas power plants. A report by the Rocky Mountain Institute, found “even as clean energy costs continue to fall, utilities and other investors have announced plans for over $70 billion in new gas-fired power plant construction through 2025. RMI research finds that 90% of this proposed capacity is more costly than equivalent [clean energy portfolios, which consist of wind, solar, and energy storage technologies] and, if those plants are built anyway, they would be uneconomic to continue operating in 2035.”
The economics side with renewables – but with solar, wind, geothermal comprising only 12% of the energy pie, and hydropower at 7%, do renewables have the capacity to meet the nation’s energy needs? Yes! Even the Energy Information Administration, a notorious skeptic of renewable energy’s potential, forecasted renewables would beat out natural gas in terms of electricity generation by 2050 in their 2020 Annual Energy Outlook.
This prediction doesn’t take into account any future legislation limiting fossil fuel infrastructure. A ban on fracking or policies under a Green New Deal could push renewables into the lead much sooner than 2050.
In a void of national leadership on the transition to cleaner energy, a few states have bolstered their renewable portfolio.

Figure 2. Electricity generation state-wide by source, 2019. Data from EIA.
One final factor to consider – the pie pieces on these state charts aren’t weighted equally, with some states’ capacity to generate electricity far greater than others. The top five electricity producers are Texas, California, Florida, Pennsylvania, and Illinois.
In 2018, approximately 28% of total U.S. energy consumption was for transportation. To understand the scale of infrastructure that serves this sector, it’s helpful to click on the petroleum refineries, crude oil rail terminals, and crude oil pipelines on the map.

Transportation Fuel Infrastructure. Data from EIA.
The majority of gasoline we use in our cars in the US is produced domestically. Crude oil from wells goes to refineries to be processed into products like diesel fuel and gasoline. Gasoline is taken by pipelines, tanker, rail, or barge to storage terminals (add the “petroleum product terminal” and “petroleum product pipelines” legend items), and then by truck to be further processed and delivered to gas stations.
The International Energy Agency predicts that demand for crude oil will reach a peak in 2030 due to a rise in electric vehicles, including busses. Over 75% of the gasoline and diesel displacement by electric vehicles globally has come from electric buses.
China leads the world in this movement. In 2018, just over half of the world’s electric vehicles sales occurred in China. Analysts predict that the country’s oil demand will peak in the next five years thanks to battery-powered vehicles and high-speed rail.
In the United States, the percentage of electric vehicles on the road is small but growing quickly. Tax credits and incentives will be important for encouraging this transition. Almost half of the country’s electric vehicle sales are in California, where incentives are added to the federal tax credit. California also has a “Zero Emission Vehicle” program, requiring electric vehicles to comprise a certain percentage of sales.
We can’t ignore where electric vehicles are sourcing their power – and for that we must go back up to the electricity generation section. If you’re charging your car in a state powered mainly by fossil fuels (as many are), then the electricity is still tied to fossil fuels.
Many of the oil and gas infrastructure on the map doesn’t go towards energy at all, but rather aids in manufacturing petrochemicals – the basis of products like plastic, fertilizer, solvents, detergents, and resins.
This industry is largely concentrated in Texas and Louisiana but rapidly expanding in Pennsylvania, Ohio, and West Virginia.
On this map, key petrochemical facilities include natural gas plants, chemical plants, ethane crackers, and natural gas liquid pipelines.

Petrochemical infrastructure. Data from EIA.
Natural gas processing plants separate components of the natural gas stream to extract natural gas liquids like ethane and propane – which are transported through the natural gas liquid pipelines. These natural gas liquids are key building blocks of the petrochemical industry.
Ethane crackers process natural gas liquids into polyethylene – the most common type of plastic.
The chemical plants on this map include petrochemical production plants and ammonia manufacturing. Ammonia, which is used in fertilizer production, is one of the top synthetic chemicals produced in the world, and most of it comes from steam reforming natural gas.
As we discuss ways to decarbonize the country, petrochemicals must be a major focus of our efforts. That’s because petrochemicals are expected to account for over a third of global oil demand growth by 2030 and nearly half of demand growth by 2050 – thanks largely to an increase in plastic production. The International Energy Agency calls petrochemicals a “blind spot” in the global energy debate.

Petrochemical development off the coast of Texas, November 2019. Photo by Ted Auch, aerial support provided by LightHawk.
Investing in plastic manufacturing is the fossil fuel industry’s strategy to remain relevant in a renewable energy world. As such, we can’t break up with fossil fuels without also giving up our reliance on plastic. Legislation like the Break Free From Plastic Pollution Act get to the heart of this issue, by pausing construction of new ethane crackers, ensuring the power of local governments to enact plastic bans, and phasing out certain single-use products.
Mapped out, this web of fossil fuel infrastructure seems like a permanent grid locking us into a carbon-intensive future. But even more overwhelming than the ubiquity of fossil fuels in the US is how quickly this infrastructure has all been built. Everything on this map was constructed since Industrial Revolution, and the vast majority in the last century (Figure 3) – an inch on the mile-long timeline of human civilization.
Figure 3. Global Fossil Fuel Consumption. Data from Vaclav Smil (2017)
In fact, over half of the carbon from burning fossil fuels has been released in the last 30 years. As David Wallace Wells writes in The Uninhabitable Earth, “we have done as much damage to the fate of the planet and its ability to sustain human life and civilization since Al Gore published his first book on climate than in all the centuries—all the millennia—that came before.”
What will this map look like in the next 30 years?
A recent report on the global economics of the oil industry states, “To phase out petroleum products (and fossil fuels in general), the entire global industrial ecosystem will need to be reengineered, retooled and fundamentally rebuilt…This will be perhaps the greatest industrial challenge the world has ever faced historically.”
Is it possible to build a decentralized energy grid, generated by a diverse array of renewable, local, natural resources and backed up by battery power? Could all communities have the opportunity to control their energy through member-owned cooperatives instead of profit-thirsty corporations? Could microgrids improve the resiliency of our system in the face of increasingly intense natural disasters and ensure power in remote regions? Could hydrogen provide power for energy-intensive industries like steel and iron production? Could high speed rail, electric vehicles, a robust public transportation network and bike-able cities negate the need for gasoline and diesel? Could traditional methods of farming reduce our dependency on oil and gas-based fertilizers? Could zero waste cities stop our reliance on single-use plastic?
Of course! Technology evolves at lightning speed. Thirty years ago we didn’t know what fracking was and we didn’t have smart phones. The greater challenge lies in breaking the fossil fuel industry’s hold on our political system and convincing our leaders that human health and the environment shouldn’t be externalized costs of economic growth.

For the past decade, petroleum operators in the United States have been busy pumping record amounts of oil and gas from the ground. But has the pace been too frenzied? Since the vast majority of the oil and gas is not used in situ, the industry must transport these hydrocarbon products to other locations. The principal way of achieving this is through pipelines, a process which has resulted in thousands of incidents, causing hundreds of injuries and fatalities, thousands of evacuations, and billions of dollars’ worth of damage.
The United States has an estimated 3 million miles of hazardous liquid, gas distribution, and gathering and transmission pipelines in operation, and more are being built every day. Not only have the pipelines themselves become so ubiquitous that most people never give them a second thought, the incidents themselves have become so familiar to us that even severe ones struggle to gain any attention outside of the local media area.
In 2019, there were 614 reported pipeline incidents in the United States, resulting in the death of 10 people, injuries to another 35, and about $259 million in damages. As mentioned below, some of these totals are likely to creep upward as additional reports are filed. In terms of statistical fluctuations, 2019 was slightly better than normal, but of course statistics only tell a part of the story. Friends and family of the ten people that died last year would find no comfort knowing that there were fewer such casualties than 2017, for example. Similarly, it would be useless to comfort a family that lost their home by reminding them that someone lost an even bigger and more expensive home the year before.
Keeping in mind the human impact, let’s take a look at the data.
These incidents are broken into three separate reports:
View map fullscreen | How FracTracker maps work
| Report | Incidents | Fatalities | Injuries | Evacuees | Damages ($) | Fires | Explosions |
| Hazardous Liquids Lines | 3,978 | 10 | 26 | 2,482 | 2,812,391,218 | 130 | 15 |
| Gas Transmission & Gathering Lines | 1,226 | 25 | 108 | 12,984 | 1,315,162,976 | 133 | 57 |
| Gas Distribution | 1,094 | 105 | 522 | 20,526 | 1,229,189,997 | 659 | 257 |
| Totals | 6,298 | 140 | 656 | 35,992 | 5,356,744,191 | 922 | 329 |
But is increasing the capacity of the pipes a good idea? As FracTracker has shown in the past, pipeline incidents occur at a rate of about 1.7 incidents per day. This holds true with updated data, showing 6,298 incidents from January 1, 2010 through December 17, 2019, which was the latest report filed when the data was downloaded in early February 2020.
In 2018, roughly three million miles of natural gas pipelines transported almost 28 trillion cubic feet (Tcf) of gas, which is roughly 13 times the volume of Mount Everest. For liquids, pipeline data is available showing shipments of from one region of the country (known as a PAD District) to another, which shows that 1.27 billion barrels of crude oil were shipped through almost 81,000 miles of pipelines in 2018, and 3.39 billion barrels through nearly 214,000 miles of pipes when counting natural gas liquids and refined petroleum products.
Note that these figures are less than 2018 estimates based on 70% of liquid petroleum products being moved by pipeline. This discrepancy could be accounted for by the dramatic increase in production in recent years, or perhaps by intra-PAD shipments not listed in the data above. For example, petroleum produced in the Permian Basin in western Texas and eastern New Mexico may travel nearly 500 miles by pipeline en route to export terminals on the Gulf coast, while remaining in the same PAD District. If the 70% estimate holds true, then roughly 2.8 billion barrels (117 billion gallons) of crude would be shipped by pipeline, more than twice as much as the 1.27 billion barrel figure shown above.
The drilling boom in the United States was quickly followed by a boom in pipeline construction. Total mileage for liquid pipelines – known as hazardous liquid lines – increased by 20% from 2010 to 2018. For those aware of thousands of miles of recent gas pipeline projects, it is confusing to hear that the data from the Pipeline and Hazardous Materials Safety Administration (PHMSA) are mixed for natural gas. It does show a 2.4% increase in total miles for gas distribution mainlines to 1.3 million miles, and a 2.0% increase over the same time in distribution service lines, which run from the mainlines to the consumer. However, the total mileage for transmission lines – which are large diameter pipes that move gas long distances – actually contracted 2.1% to just under 302,000 miles. Total mileage for gathering lines fell even more, by 8.4% to just under 18,000 miles. However, since PHMSA estimates only 5% of gathering lines report to the agency, this last figure is probably not a valid estimate.
If this data is accurate, it means that the thousands of miles of transmission and gathering lines built in recent years were more than offset by decommissioned routes. However, given the record production levels mentioned above, it is almost certain that total capacity of the system has gone up, which can be accomplished through a combination of increased pressure and diameter of the pipe.
| Year | Incidents | Fatalities | Injuries | Evacuees | Damages ($) | Fires | Explosions |
| 2010 | 350 | 1 | 3 | 686 | 1,075,193,990 | 8 | 1 |
| 2011 | 344 | 0 | 1 | 201 | 273,526,547 | 9 | 2 |
| 2012 | 366 | 3 | 4 | 235 | 145,477,426 | 10 | 2 |
| 2013 | 401 | 1 | 6 | 858 | 278,525,540 | 15 | 2 |
| 2014 | 455 | 0 | 0 | 34 | 140,211,610 | 20 | 4 |
| 2015 | 460 | 1 | 0 | 138 | 256,251,180 | 16 | 1 |
| 2016 | 420 | 3 | 9 | 104 | 212,944,094 | 17 | 2 |
| 2017 | 415 | 1 | 1 | 58 | 163,118,772 | 7 | 0 |
| 2018 | 405 | 0 | 2 | 165 | 152,573,682 | 15 | 1 |
| 2019 | 362 | 0 | 0 | 3 | 114,568,377 | 13 | 0 |
| Grand Total | 3978 | 10 | 26 | 2482 | 2,812,391,218 | 130 | 15 |
The most important statistics when considering pipeline incidents are those representing bodily harm – injuries and fatalities. In those respects, at least, 2019 was a good year for hazardous liquid pipelines, with no reported injuries or fatalities. Most of the other metrics were below average as well, including 362 total incidents, three evacuees, $115 million in damages, and zero explosions. The 13 reported fires represents a typical year. However, we should keep in mind that the results may not be complete for 2019. The data was downloaded on February 3, 2020, but represented the January 2020 update of the dataset. Additionally, there is often a gap between the incident date and the reporting date, which is sometimes measured in months.
One thing that really sticks out about hazardous liquid pipelines is that the pipelines that fail the most often are the newest. Of the hazardous liquid incidents since 2010, 906 occurred in pipelines that were installed within the decade. By means of comparison, the same amount of incidents occurred in the same period for pipes installed in the 40 years between 1970 and 2009. Of course, the largest category is “Unspecified,” where the install year of the pipeline was left blank in 1,459 of the 3,978 total incidents (37%).
The causes of the incidents are dominated by equipment failure, where the 1,811 incidents accounted for 46% of the total. The next highest total was corrosion failure with 798 incidents, or 20% of the total. Six of the incidents in the “Other Outside Force Damage” are attributed to intentional damage, representing 0.15% of the total.
| Year | Incidents | Fatalities | Injuries | Evacuees | Damages ($) | Fires | Explosions |
| 2010 | 116 | 10 | 61 | 373 | 596,151,925 | 19 | 7 |
| 2011 | 128 | 0 | 1 | 874 | 125,497,792 | 14 | 6 |
| 2012 | 116 | 0 | 7 | 904 | 58,798,676 | 15 | 7 |
| 2013 | 112 | 0 | 2 | 3,103 | 53,022,396 | 11 | 4 |
| 2014 | 142 | 1 | 1 | 1,482 | 61,533,154 | 15 | 6 |
| 2015 | 149 | 6 | 16 | 565 | 61,498,753 | 10 | 6 |
| 2016 | 97 | 3 | 3 | 944 | 107,524,564 | 8 | 4 |
| 2017 | 126 | 3 | 3 | 202 | 85,665,233 | 17 | 7 |
| 2018 | 118 | 1 | 7 | 4,088 | 77,753,611 | 17 | 6 |
| 2019 | 122 | 1 | 7 | 449 | 87,716,872 | 7 | 4 |
| Grand Total | 1,226 | 25 | 108 | 12,984 | 1,315,162,976 | 133 | 57 |
One person died and seven were injured from gas transmission and gathering line accidents that were reported to PHMSA in 2019, which were both below average for this dataset. The total number of incidents was typical, while the 499 evacuees, $88 million in property damage, seven fires, and four explosions were all below normal. Note that only a small fraction of the nation’s gathering lines are required to report incident data to PHMSA, so this data should not be seen as comprehensive. And as with the hazardous liquid incidents, it is likely that not all incidents occurring during the year have had reports filed in time for this analysis.
The distribution of the age of pipes that failed within the past decade is different from the hazardous liquid pipelines. Pipes installed in the 1950s, 1960s, and 1970s were the most likely to fail, although failures in routes built this century represent a secondary peak. The number of incidents where the age of pipe data field was not completed remains high at 135 incidents, but the data gap is not as outrageous as it is for hazardous liquid lines.
Once again, equipment failure is the most common cause of transmission and gathering line accidents, with 390 incidents accounting for 32% of the total. Corrosion failure was the second most common reason, with 239 incidents accounting for an additional 19%. One incident was attributed to intentional damage, accounting for 0.08% of the total.
| Year | Incidents | Fatalities | Injuries | Evacuees | Damages ($) | Fires | Explosions |
| 2010 | 120 | 11 | 44 | 2,080 | 21,155,972 | 82 | 29 |
| 2011 | 116 | 13 | 53 | 4,417 | 27,105,022 | 73 | 32 |
| 2012 | 88 | 9 | 46 | 746 | 25,556,562 | 61 | 22 |
| 2013 | 104 | 8 | 36 | 1,606 | 37,363,960 | 59 | 20 |
| 2014 | 106 | 18 | 93 | 2,037 | 72,885,067 | 61 | 30 |
| 2015 | 101 | 4 | 32 | 948 | 32,176,608 | 65 | 24 |
| 2016 | 115 | 10 | 75 | 2,510 | 56,900,068 | 71 | 28 |
| 2017 | 104 | 16 | 34 | 1,960 | 72,226,380 | 57 | 17 |
| 2018 | 110 | 7 | 81 | 2,561 | 827,647,610 | 64 | 31 |
| 2019 | 130 | 9 | 28 | 1,661 | 56,172,748 | 66 | 24 |
| Grand Total | 1,094 | 105 | 522 | 20,526 | 1,229,189,997 | 659 | 257 |
The nine fatalities and 28 injuries reported for gas distribution lines in 2019 were obviously tragic, but these totals are both below what would be expected in a typical year. The 130 incidents and 66 fires were both above average totals, while the 1,661 evacuees, $56 million in property damage, and 24 explosions were all below average. As with the other reports, these totals are subject to change as additional reports are filed.
The distribution for the age of pipes that failed during the past decade is more like a normal (or bell curve) distribution than the other two datasets, with the most incidents occurring in pipeline routes laid in the 1990s. Much like the hazardous liquids dataset, however, the largest category is “Unspecified”, where the age of the pipe was not entered into the data for one reason or another. These 222 incidents account for 20% of the total, and if we had this data, the distribution could be significantly different.
The causes of distribution line incidents are attributed very differently than either the hazardous liquids or transmission and gathering line datasets. The leading cause is “Other Outside Force Damage,” with 355 incidents accounting for 32% of the total, followed by 330 “Excavation Damage” incidents accounting for an additional 30%. This difference could well be explained because this type of line tends to occur in highly populated areas. The largest subtype for the outside force damage category is damage by motor vehicles not involved in excavation, with 160 incidents, followed by fires or explosions which the operator claims did not originate with the pipeline, with 78 incidents. Intentional damage remains rare – although still way too high – with 15 incidents, or 1.4% of the overall total.
PHMSA incident data is ultimately self-reported by the various operators. Because the vast majority of gathering lines do not report to the agency, this dataset should not be seen as comprehensive for incidents in that category.
There were eleven issues with faulty location data that we were able to correct for this map. There are likely to be more, as only the ones with coordinates rendering outside of the United States were identified. Some of these had mixed up latitude and longitude values, or omitted the negative value for longitude, placing the points in Kyrgyzstan, the Himalayas, and Mongolia. One record had no coordinates at all, but included a detailed description of the location, which was then found on Google Maps. Two wells that rendered in Canada were on the correct longitude for the county that they belonged in, but had faulty latitude values. One of these was reduced by exactly 20° of latitude, while the other was reduced by exactly 7° of latitude, and were then located in the proper county. Other than the adjustments for these eleven incidents, all location data reflects the data available on the PHMSA .
The data above reflects 6,298 incidents over the course of a decade, with a few more incidents likely to trickle in during the next few updates of the reports by PHMSA. And while these discrete incidents account for the majority of human impacts in terms of life and well-being, it is worth noting that these 1.7 incidents per day are not the only problems that occur along millions of miles of pipelines in this country.
William Limpert has analyzed information about pipeline leakage in gas transmission lines, which found that 0.35% of the volume of gas was lost in transmission, one tenth of which was vented or flared intentionally, for example in compressor station blowdown events. This means that 0.315% of the gas is released unintentionally.
These numbers sound tiny, but due to the enormous volume of gas transported in pipes, they really add up quickly. For example, the Atlantic Coast Pipeline, Mr. Limpert’s primary focus, is scheduled to transmit 1.5 billion cubic feet (Bcf) of natural gas per day. At a typical rate of failure, we could expect leakage of 4.725 million cubic feet (MMcf) per day, or 1.725 billion cubic feet over the course of a year. That’s enough gas to provide to all Pennsylvania residential consumers for about 13 days in August, and this is just from one pipeline.
As mentioned above, the entire pipeline network moved about 28 Tcf in 2018. The estimated amount leaked at 0.315% is 88.2 Bcf. What would residential consumers pay for that volume of gas? Even with the current low prices due to the gas glut, the average residual price was $9.43 per Mcf in November 2019, the most recent data available. That means that residential consumers would pay roughly $832 million for an equivalent amount of gas.
There are also countless leaks that occur during the construction of the pipelines themselves. When pipelines are built, they have numerous obstacles to navigate during their construction. Among the most challenging are linear obstacles, such as roads and streams. A method that the industry regularly uses to avoid having to trench through these features is horizontal directional drilling (HDD).
While HDDs are meant to minimize impacts, they very frequently result in an incident known as an “inadvertent return,” when volumes of drilling mud return to the surface through a series of underground voids, frequently karst geology or abandoned mines. The leaking borehole under the road or stream then leaks drilling mud – sometimes thousands of gallons of it – which can then affect aquatic stream life. Additionally, these areas represent voids in the matrix that is intended to keep the pipeline stable and may represent future opportunities for catastrophic failure.
These features are so prevalent in some parts of the country that pipeline operators seem to be unable to avoid them, and regulators seem unwilling to press the issue in a proactive fashion. For example, Energy Transfers’ Mariner East II pipeline is currently being built to move natural gas liquids from Appalachia to its industrial complex and export terminal at Marcus Hook, Pennsylvania. During construction, there have been hundreds of inadvertent returns, both to the soil and waters of the Commonwealth. The presence of karst and abandoned mines along the route were well known ahead of time to the operator designing and implementing the HDDs, as well as the regulators who approved their use.
The many issues along the Mariner East II route, when combined with a massive pipeline explosion in Beaver County led to Pennsylvania’s decision to temporarily block all permit actions by the operator statewide. That hold is now lifted, leading residents along the route worried about a new batch of inadvertent returns, related sinkholes, and other follies as the project is completed. Construction activities for the parallel Mariner East 2X pipeline are already underway.
While residents along the Mariner East pipeline system have seen more than their fair share of impacts from the construction, these impacts are not at all rare on unusual. What is unusual, however, is for regulators to provide data highlighting these types of errors. In Pennsylvania, enough people requesting data on a variety of problematic pipelines has prompted the Department of Environmental Protection to create a Pennsylvania Pipeline Portal page. This only includes information on recent major pipeline projects and is not comprehensive in terms of content, but it is a major step in the right direction in terms of data transparency.
Statistics can never capture the full force of tragedies. Most of us are aware of this point intellectually, and yet when we are confronted with such numbers, it seems that we are obliged to process them in one form or another. Perhaps the most common way is to compartmentalize it, where we might acknowledge the data and misfortune that they represent, but the file it away in the messy cabinet of our mind, clearing the slate of active thought for the next bit of information. Many of us never stop to question whether we can do better.
So, can we do better with pipelines? Perhaps so. If there are structural hazards such as abandoned mines or karst, perhaps regulators could demand that the operator route around them. If there are residents nearby, communities should demand that the pipeline get rerouted as well. Of course, these reroutes will just push the impacts elsewhere, but hopefully to an area where people won’t be affected by them, if such a place exists. Certainly, there could be better standards for construction and identification, so that there are fewer accidents involving pipelines. Or better yet, we could transition to renewable fuels for an ever-increasing share of our energy needs, making dirty and dangerous pipelines a relic of the past.
The one thing that we can no longer afford to do is continue to stick our fingers in our ears and dismiss the entire issue of pipeline safety as manageable or the cost of doing business.
By Matt Kelso, Manager of Data and Technology, FracTracker Alliance
Feature image at top of page shows San Bruno, California, following the 2010 pipeline explosion
![]()
216 Franklin St, Suite 400, Johnstown, PA 15901
Phone: +1 (717) 303-0403 | info@fractracker.org
FracTracker Alliance is a 501(c)3 non-profit: Tax identification number: 80-0844297


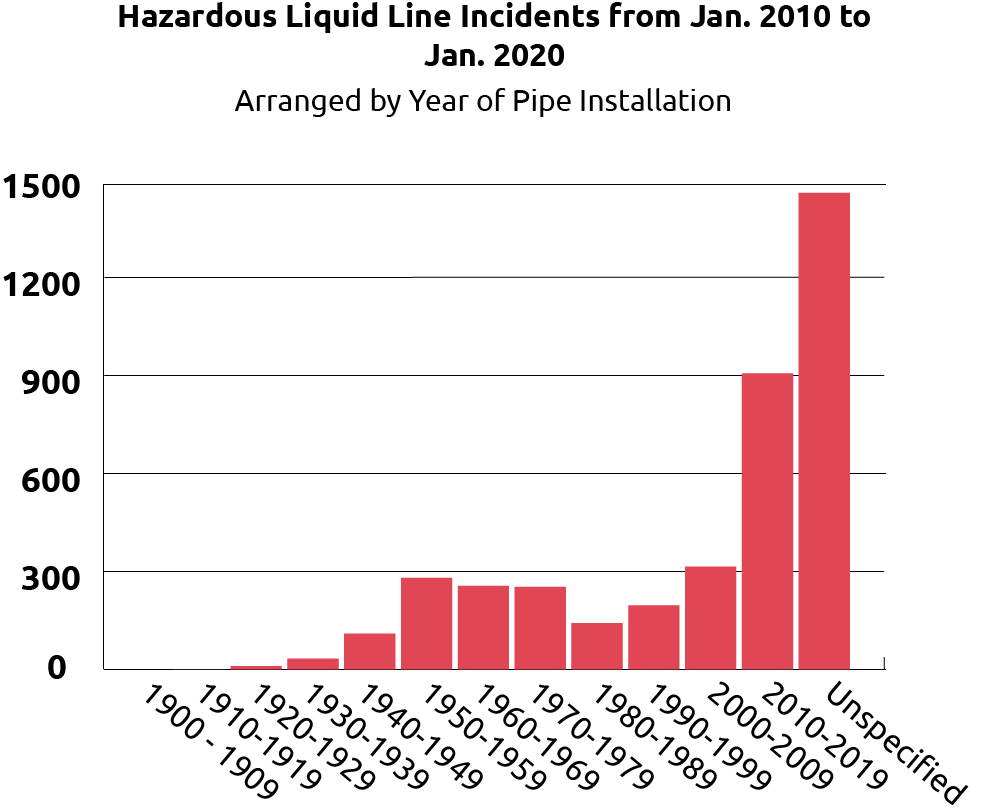
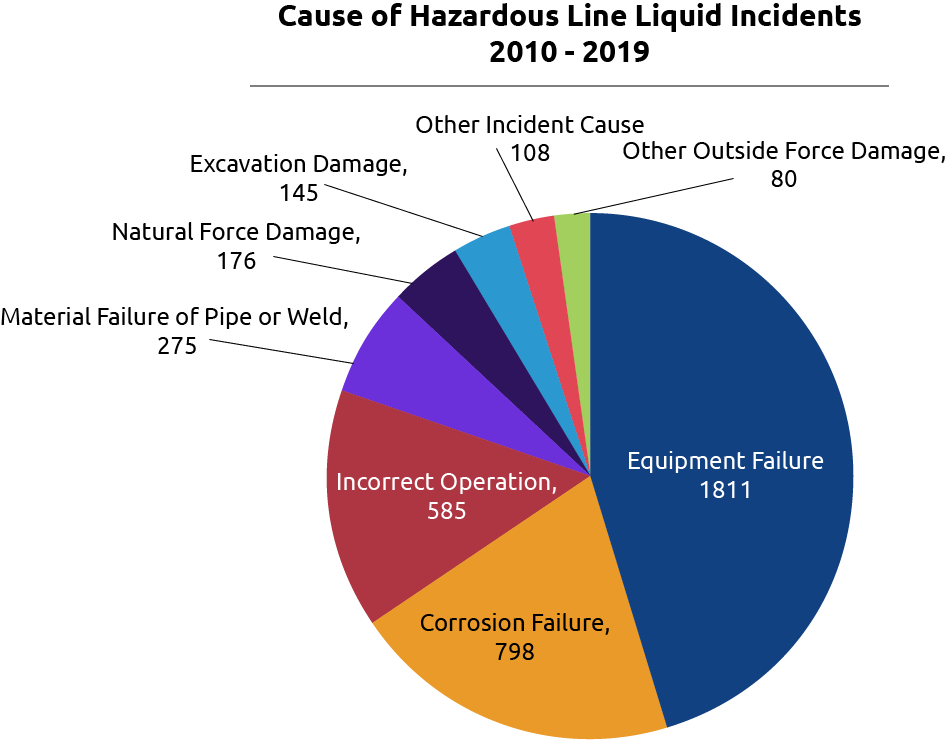
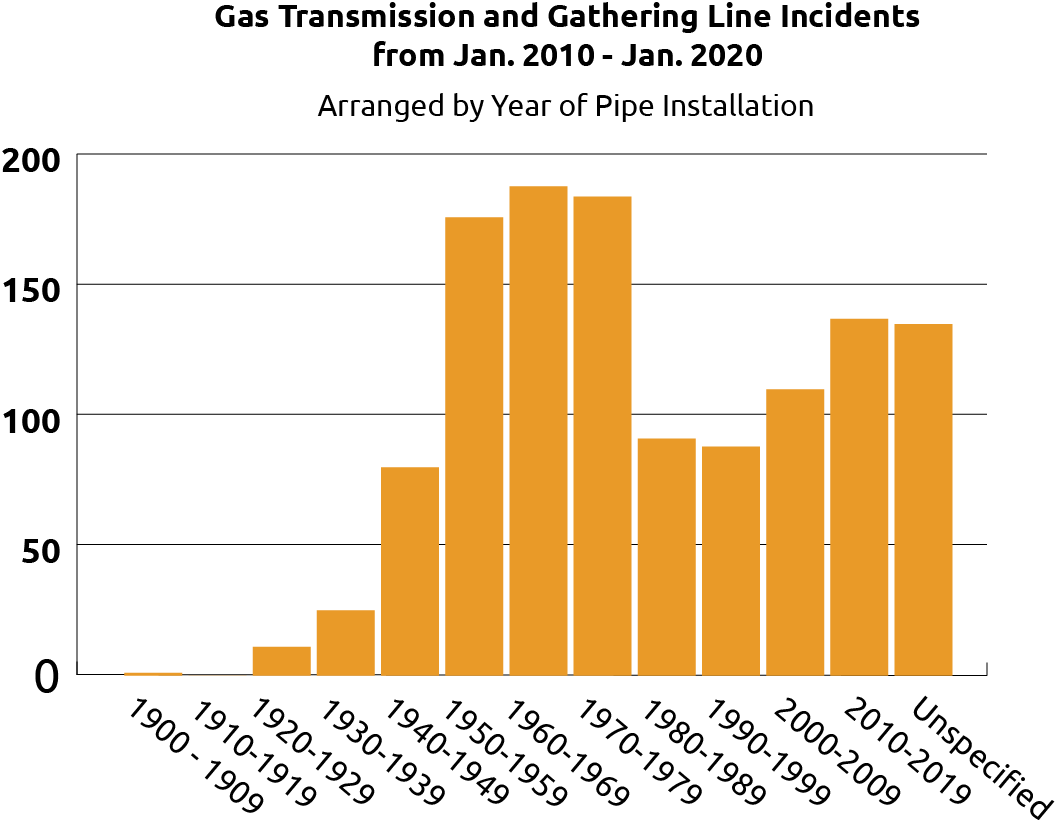
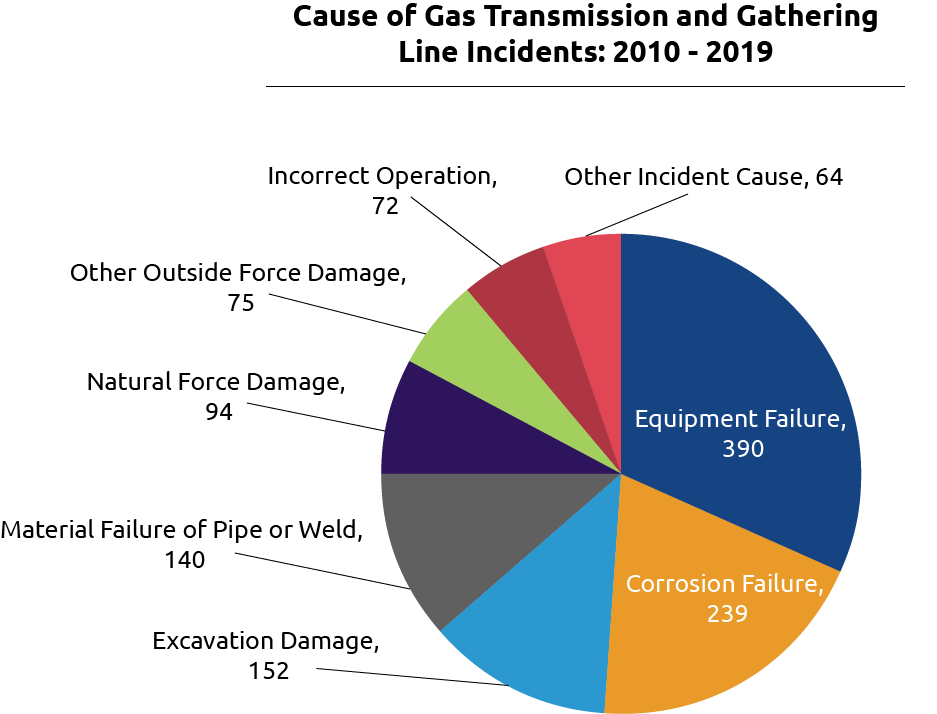
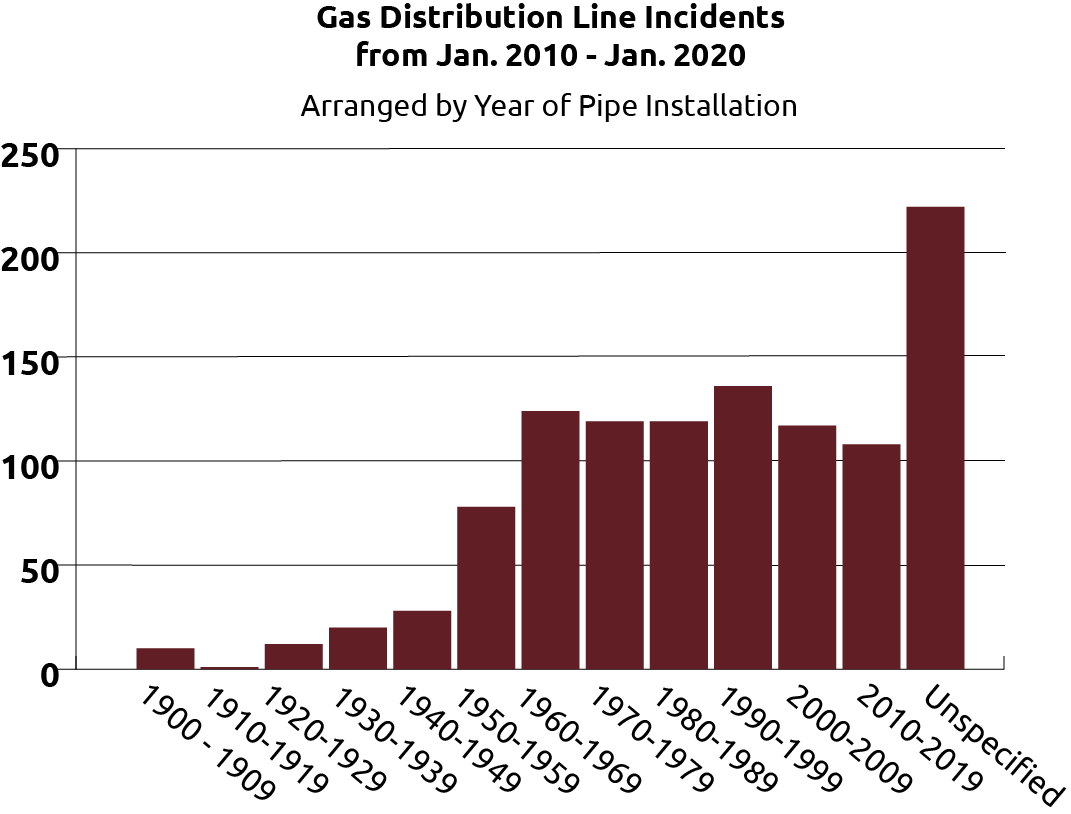
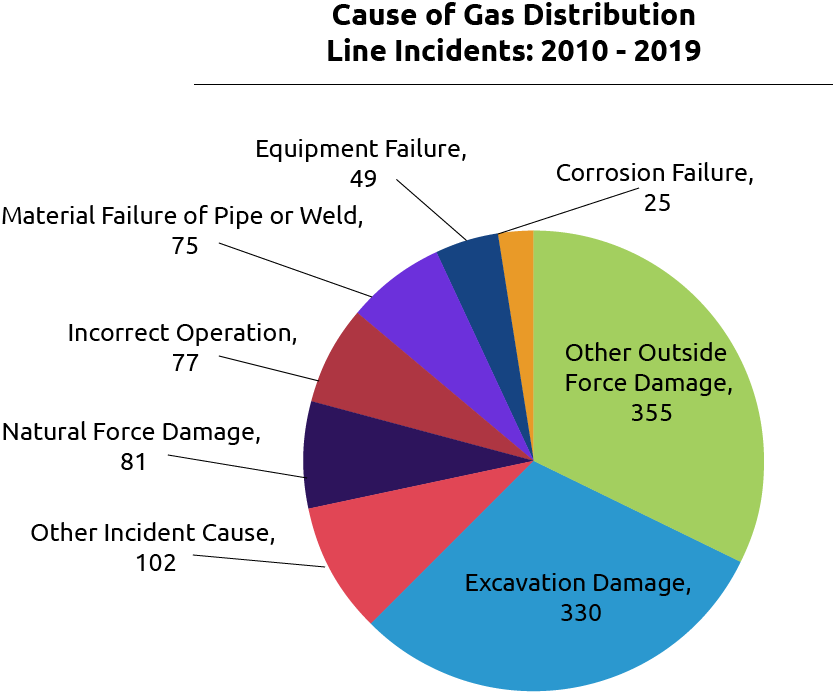