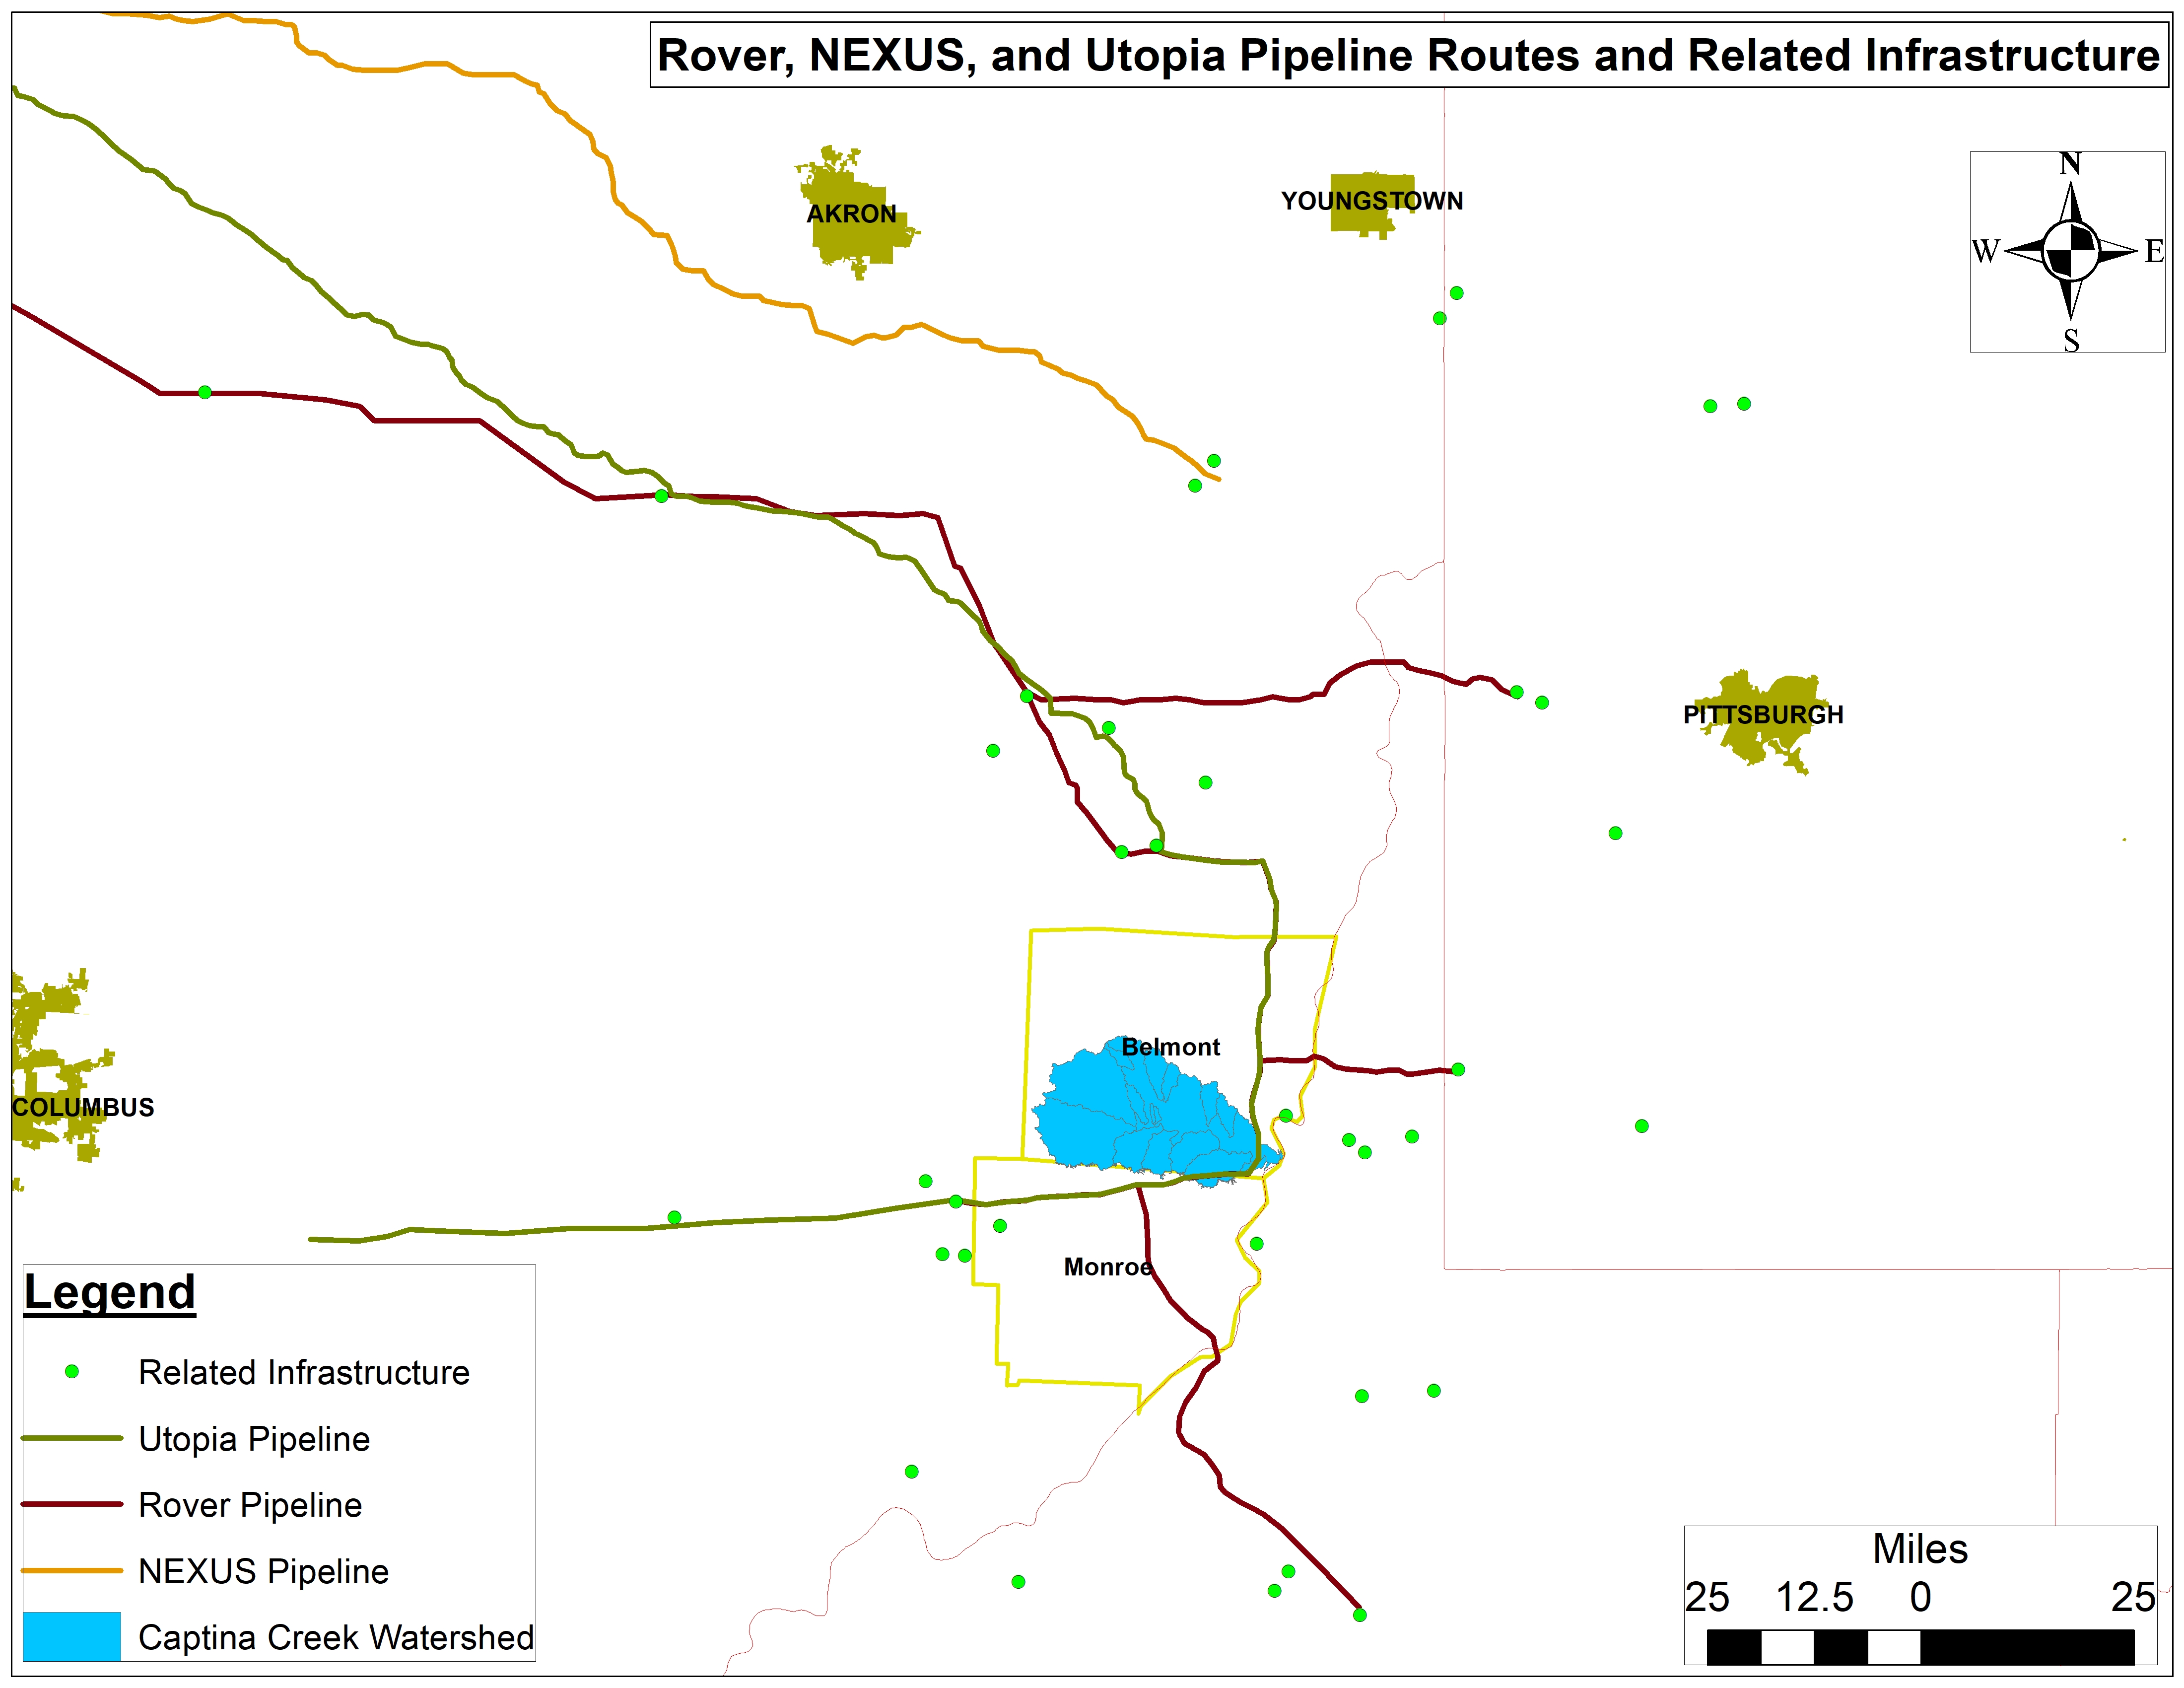
The Captina Creek Watershed straddles the counties of Belmont and Monroe in Southeastern Ohio and feeds into the Ohio River. It is the highest quality watershed in all of Ohio and a great examples of what the Ohio River Valley’s tributaries once looked, smelled, and sounded like. Sadly, today it is caught in the cross-hairs of the oil and gas industry by way of drilling, massive amounts of water demands, pipeline construction, and fracking waste production, transport, and disposal. The images and footage presented in the story map below are testament to the risks and damage inherent to fracking in the Captina Creek watershed and to this industry at large. Data included herein includes gas gathering and interstate transmission pipelines like the Rover, NEXUS, and Utopia (Figure 1), along with Class II wastewater injection wells, compressor stations, unconventional laterals, and freshwater withdrawal sites and volumes.
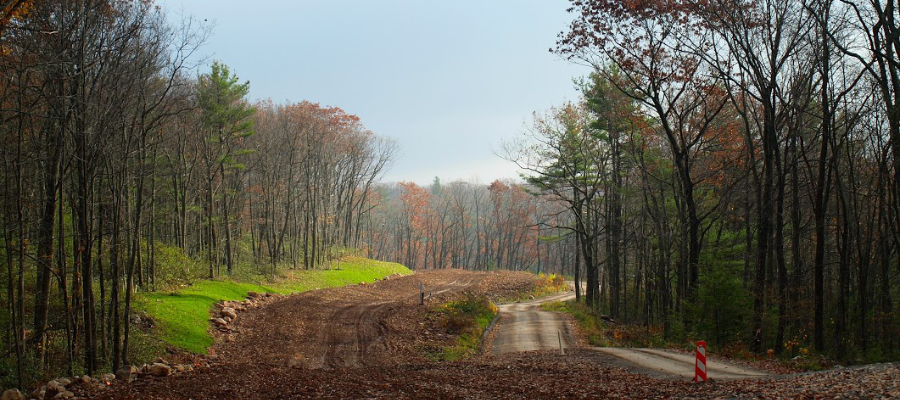
The image at the top of the page captures my motivation for taking a deeper dive into this watershed. Having spent 13+ years living in Vermont and hiking throughout The Green and Adirondack Mountains, I fell in love with the two most prominent tree species in this photo: Yellow Birch (Betula alleghaniensis) and Northern Hemlock (Tsuga candadensis). This feeling of being at home was reason enough to be thankful for Captina Creek in my eyes. Seeing this region under pressure from the oil and gas industry really hit me in my botanical soul. We remain positive with regards to the area’s future, but protective action against fracking in the Captina Creek Watershed is needed immediately!
Fracking in the Captina Creek Watershed: A Story Map
https://www.fractracker.org/a5ej20sjfwe/wp-content/uploads/2019/07/DSC_0624_LowRes-scaled.jpg9821500Shannon Smithhttps://www.fractracker.org/a5ej20sjfwe/wp-content/uploads/2025/09/2025-Wordmark-Logo.pngShannon Smith2019-08-07 09:36:032026-04-28 15:34:37Wildness Lost – Pine Creek
In March of 2019, two and a half years after Shell Pipeline Co. announced plans for the Falcon Ethane Pipeline System, the imported pipes arrived at the Port of Philadelphia. As tree clearing and construction begins, we share frustration with residents that the project is underway while many of our concerns remain unaddressed.
Between 2010 and 2018, over 280 pipeline incidents were reported in Ohio, West Virginia, and Pennsylvania (the three states the Falcon crosses). Of those incidents, 70 were fires and/or explosions. As regulatory agencies and operators fail to protect the public, communities are taking the reins.
Residents of southwest PA gather along the Falcon route
These grassroots efforts are contributing to a shift in public perception about the safety and need of pipelines. In some cases, including with the Northeast Energy Direct Pipeline and the Constitution Pipeline, organizing efforts are helping stop projects before they begin.
We invite all residents along the Falcon route to get involved in ongoing efforts to monitor construction. Below, you’ll find a guide to reporting violations as well as high-risk areas along the Falcon route that require close monitoring.
Be a citizen watchdog
Taking photos of pipeline development and recording your observations is a great way to monitor impacts. One tool to use while monitoring is the FracTracker mobile app (search “FracTracker” in the App Store or Google Play to download for free). The app allows the public to submit geolocated photos and descriptions of development, such as pipelines and wells, and concerns, such as spills and noise pollution. These reports help FracTracker crowdsource data and alert us to concerns that need follow up action. The app also contains a map of wells, pipelines, and compressor stations, including the Falcon pipeline route for reference in the field.
Click on the images below to view app reports of Falcon construction.
Documenting violations
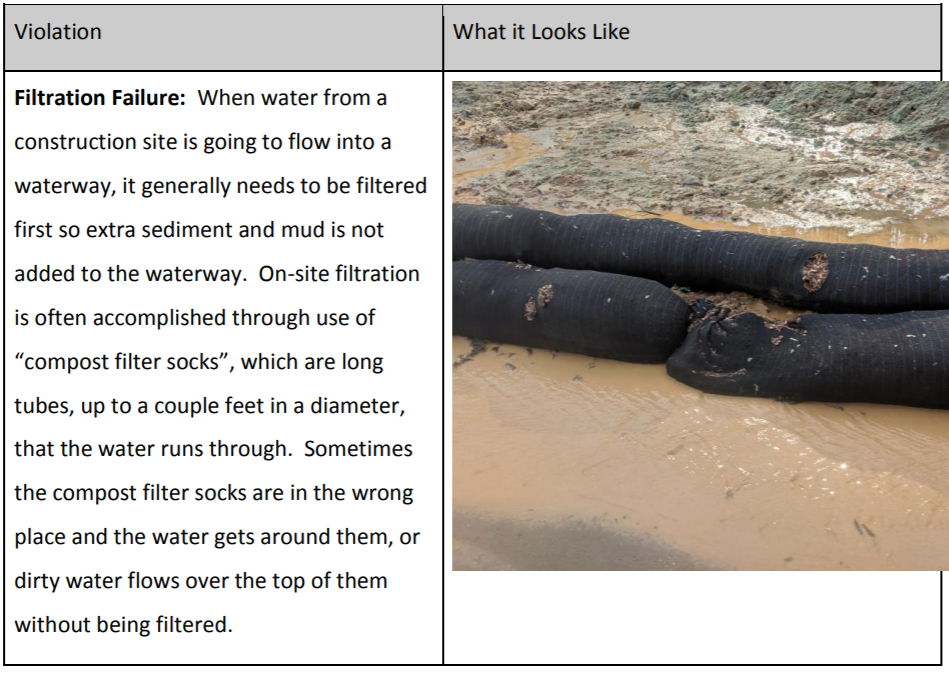
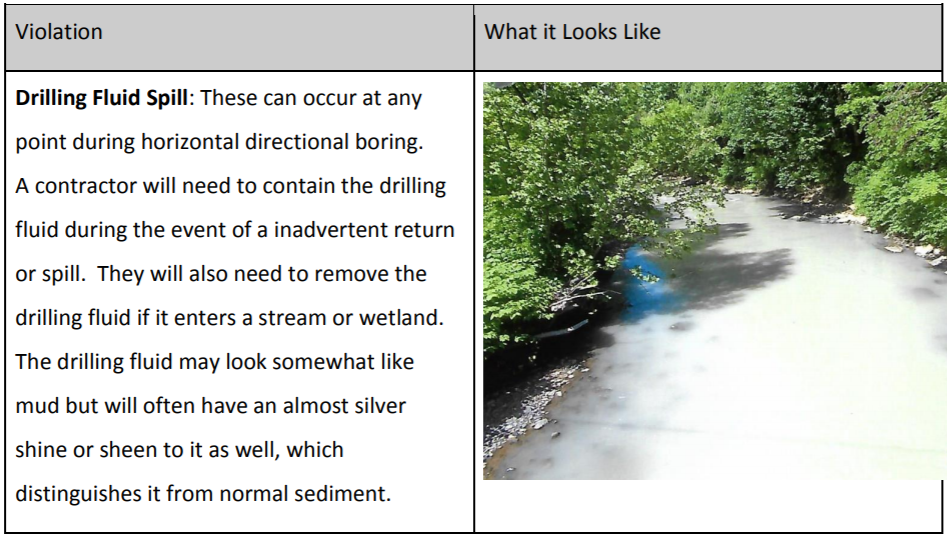
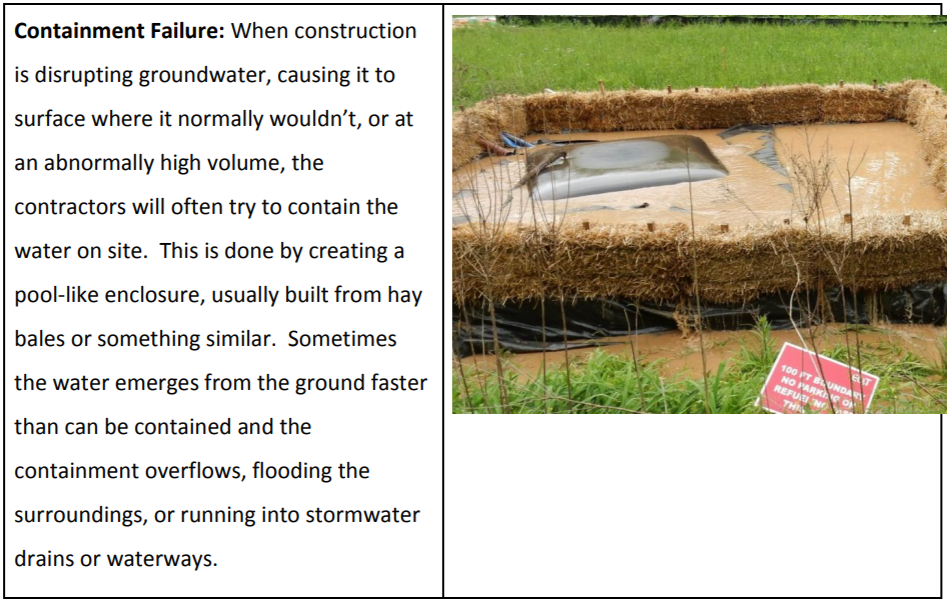
During the construction phase, incidents often occur when companies cause erosion of the ground and release sediment, equipment, or discharge into waterways. Mountain Watershed Association and Clean Air Council have provided the following information on the process of looking for and documenting violations.
Step 1) Document baseline conditions. Documenting the pre-construction status of an area is crucial for understanding how it’s been impacted down the road. Document baseline conditions by taking photos, videos, and notes at different sites, and include the location and date on these materials (the Fractracker app does this for you automatically). Observing sites at different times and in different weather (such as during or after a storm) will give you the best data.
Step 2) Know what to look for. Below are images and descriptions of common construction violations.
4) Contact support organizations. There are several organizations ready to take action once violations have been confirmed. For confirmed violations in Beaver County, PA, contact Alex Bomstein, at the Clean Air Council (215-567-4004 x118) and for confirmed violations in Allegheny or Washington Counties, PA, contact Melissa Marshall at the Mountain Watershed Association (724-455-4200 x7#). For violations in Ohio or West Virginia, reach out to FracTracker (412-802-0273).
Reports made on the FracTracker App are shared with any app user and the FracTracker team, who look through the reports and contact users for any required follow up. App reports can also be submitted to regulatory agencies electronically. Simply visit the web version of the app, click on your report, and copy the URL (web address) of your report. Then “paste” it into the body of an email or online complaint form. The receiver will see the exact location, date, and any notes or photos you included in the report.
Where should you be monitoring?
Monitoring efforts must be limited to publicly accessible land. In general, areas that are most at-risk for environmental impact include stream and wetland crossings, steep slopes (particularly those near water crossings), flood-prone zones, and areas where storm water runoff will reach waterways. View a map of the Falcon’s water crossings here, and continue reading for more vulnerable locations to monitor.
The information below identifies high-risk areas along the pipeline route where monitoring efforts are extra necessary due to their impacts on drinking water, wetlands, undermined areas, and vulnerable species.
Drinking Water
We found 240 private water wells within 1/4 mile of the Falcon.
While all of these wells should be assessed for their level of risk with pipeline construction, the subset of wells nearest to horizontal directional drilling (HDD) sites deserve particular attention. HDD is a way of constructing a pipeline that doesn’t involve digging a trench. Instead, a directional drilling machine is used to drill horizontally underground and the pipe is pulled through.
While an HDD is designed to avoid surface impacts, if rushed or poorly executed, it can damage surface water, groundwater, and private property. The Mariner East 2 pipeline construction left several families without water after construction crews punctured an aquifer at an HDD site.
Shell’s data highlights 24 wells that are within 1,000 feet of a proposed HDD site.
We’ve isolated the groundwater wells and HDDs in a standalone map for closer inspection below. The 24 most at-risk wells are circled in blue.
Testing your groundwater quality before construction begins is crucial for determining impacts later on. Two upcoming workshops in Washington County, PA and another in Beaver County, PA will discuss how to protect your water and property.
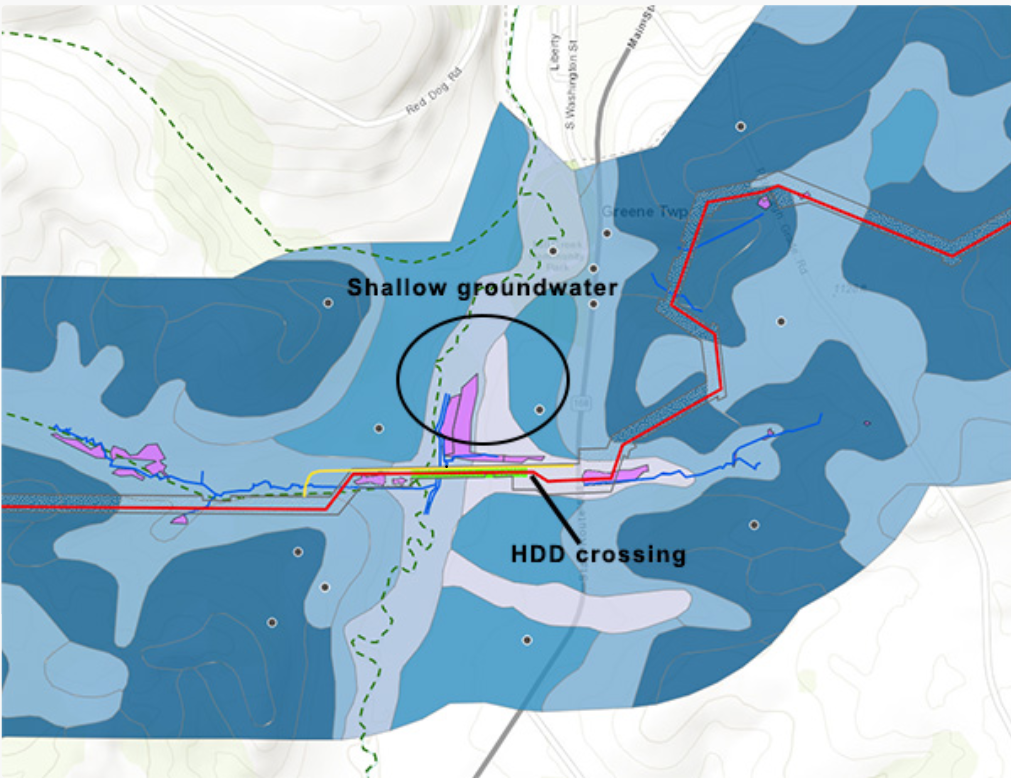
The Falcon’s HDD locations offer disturbing similarities to what caused the Mariner East pipeline spills. Many of Sunoco’s failures were due to inadequately conducted (or absent) geophysical surveys that failed to identify shallow groundwater tables, which then led to drilling mud entering streams and groundwater.
Figure 1 below shows Greene Township, Beaver County, just south of Hookstown, where the “water table depth” is shown. The groundwater at this HDD site averages 20ft on its western side and only 8ft deep on the eastern side.
Figure 1. Water table depth in Greene Township
Water Reservoirs
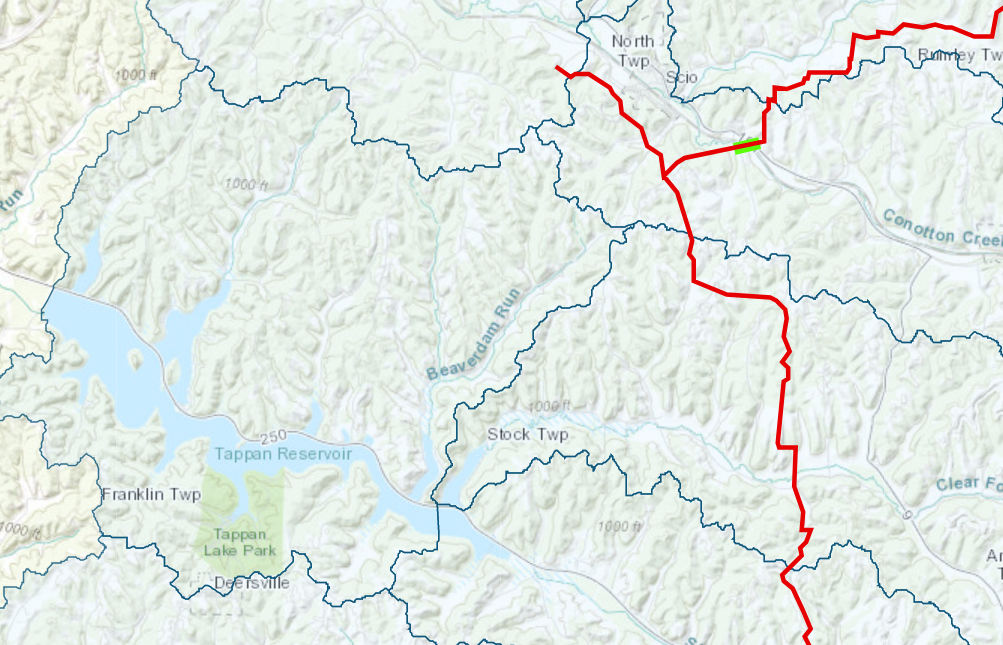
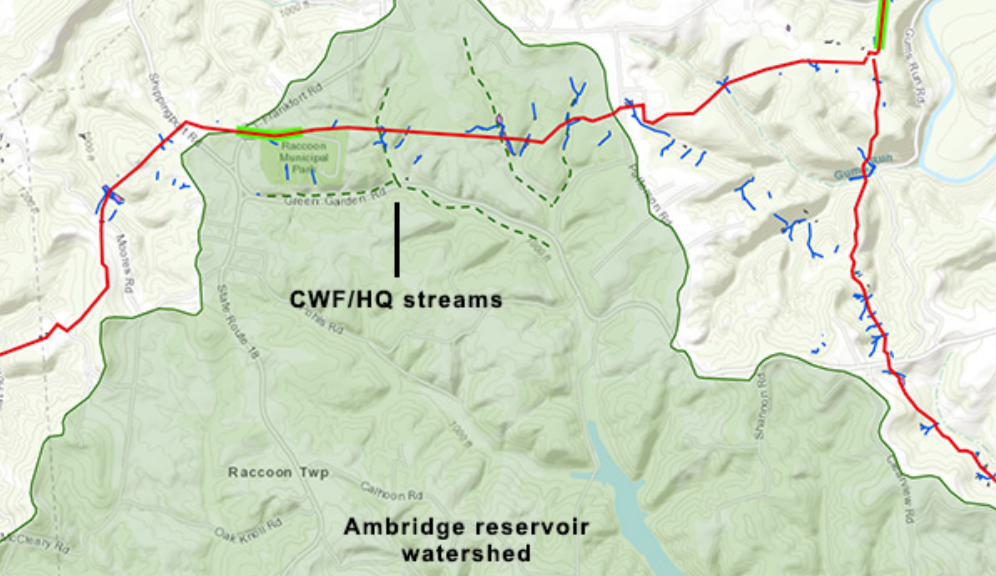
The Falcon also crosses the headwaters of two drinking water reservoirs: the Tappan Reservoir in Harrison County, OH (Figure 2) and the Ambridge Reservoir in Beaver County, PA (Figure 3). The Falcon will also cross the raw water line leading out of the Ambridge Reservoir.
The Ambridge Reservoir supplies water to five townships in Beaver County (Ambridge, Baden, Economy, Harmony, and New Sewickley) and four townships in Allegheny County (Leet, Leetsdale, Bell Acres & Edgeworth). The Tappan Reservoir is the primary drinking water source for residents in Scio.
Figure 2. Tappan Reservoir and the Falcon route in Harrison County, Ohio
Figure 3. Ambridge Reservoir and the Falcon route in Beaver County, Pennsylvania
Wetlands
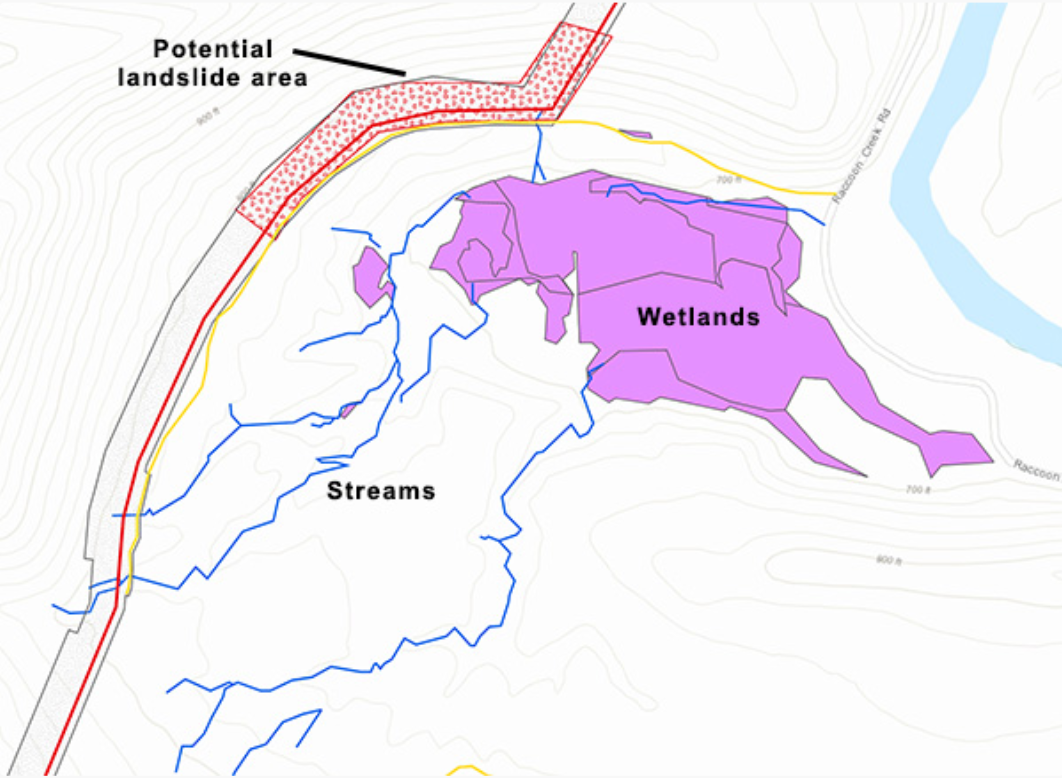
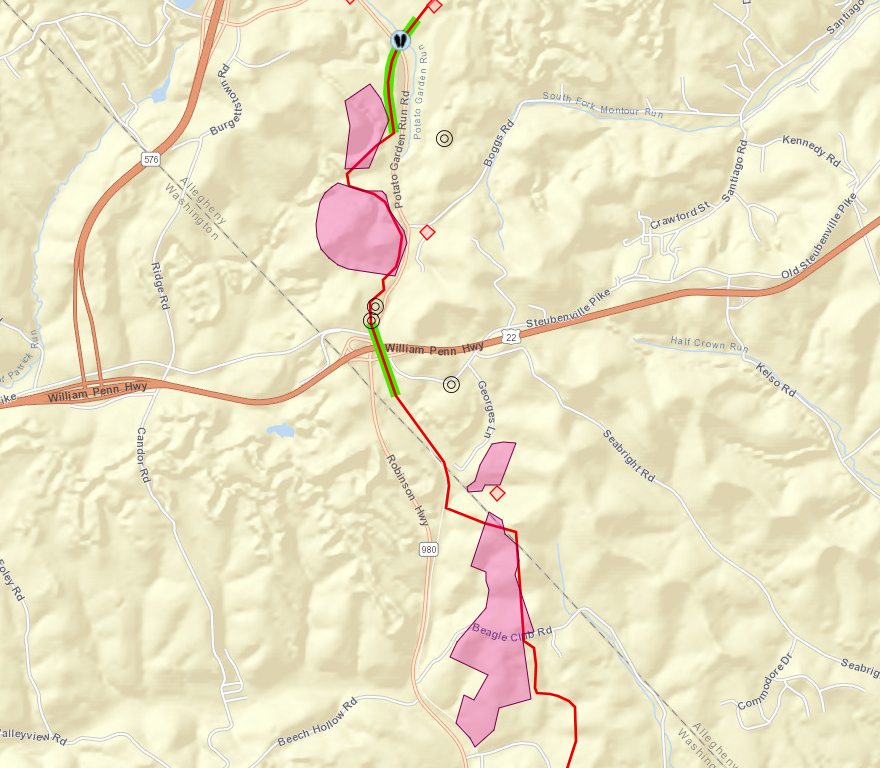
Wetlands that drain into Raccoon Creek in Beaver County, PA will be particularly vulnerable in 2 locations. The first is in Potter Township, off of Raccoon Creek Rd just south of Frankfort Rd, where the Falcon will run along a wooded ridge populated by half a dozen perennial and intermittent streams that lead directly to a wetland, seen in Figure 4. Complicating erosion control further, Shell’s survey data shows that this ridge is susceptible to landslides. This area is also characterized by the USGS as having a “high hazard” area for soil erosion.
Figure 4. Wetlands and streams in Potter Township, PA
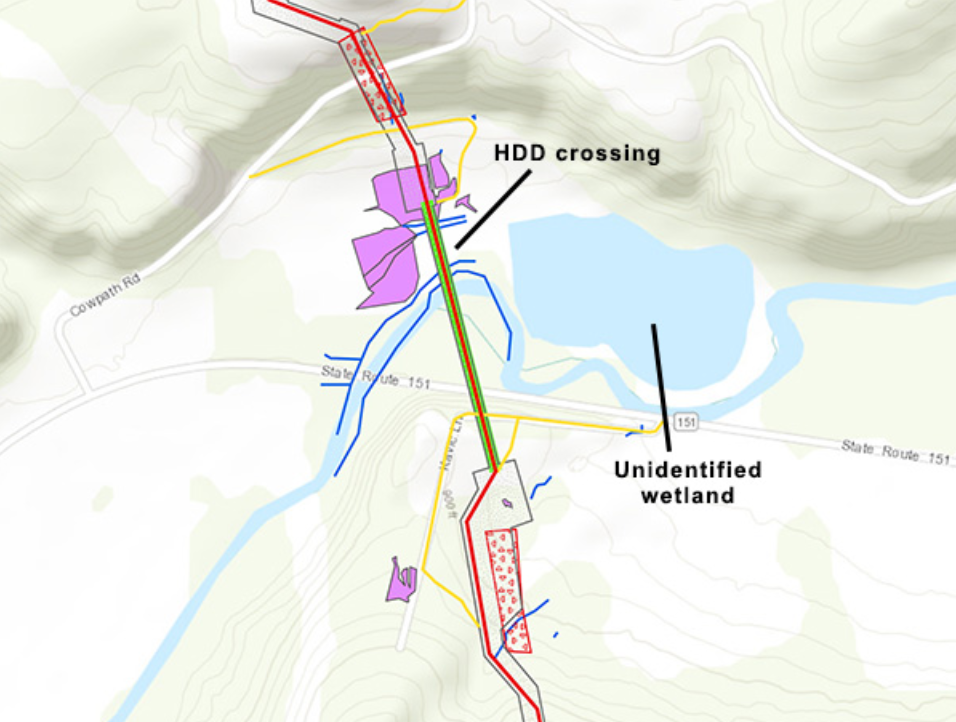
The other wetland area of concern along Raccoon Creek is found in Independence Township at the Beaver County Conservation District (Figure 5). Here, the Falcon will go under the Creek using HDD (highlighted in bright green). Nevertheless, the workspace needed to execute the crossing is within the designated wetland itself. An additional 15 acres of wetland lie only 300ft east of the crossing but are not accounted for in Shell’s data. This unidentified wetland is called Independence Marsh, considered the crown jewel of the Independence Conservancy’s watershed stewardship program.
Figure 5. Wetlands and Raccoon Creek in Independence Township, PA
Subsurface concerns
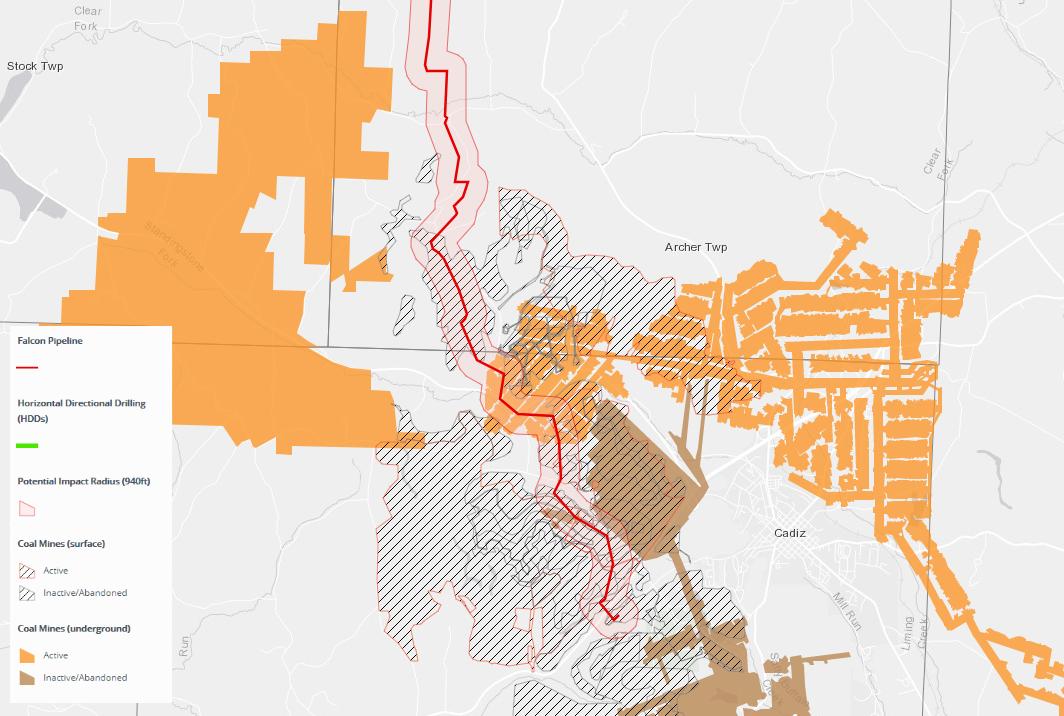
Shell’s analysis shows that 16.8 miles of the Falcon pipeline travel through land that historically has or currently contains coal mines. Our analysis using the same dataset suggests the figure is closer to 20 miles. Construction through undermined areas poses a risk for ground and surface water contamination and subsidence.
Of these 20 miles of undermined pipeline, 5.6 miles run through active coal mines and are located in Cadiz Township, OH (Harrison Mining Co. Nelms Mine, seen in Figure 6); Ross Township, OH (Rosebud Mining Co. Deep Mine 10); and in Greene Township, PA (Rosebud Mining Co. Beaver Valley Mine).
Figure 6. Coal mines and are located in Cadiz Township, OH
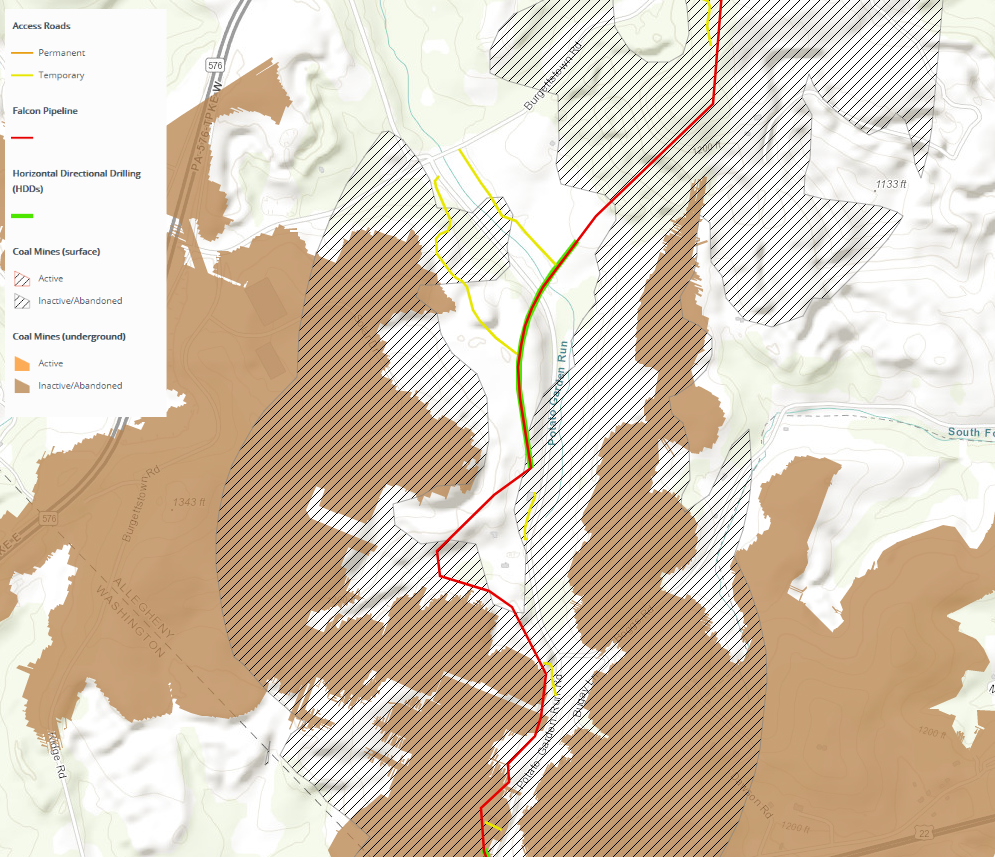
More than 25 of the Falcon’s 97 pipeline miles will be laid within karst landscapes, including 9 HDD sites. Karst is characterized by soluble rocks such as limestone prone to sinkholes and underground caves. A cluster of these are located in Allegheny and Washington counties, PA, with extensive historical surface mining operations.
The combination of karst and coal mines along Potato Garden Run, in Figure 7, make this portion of the pipeline route particularly risky. At this HDD site, the Falcon will cross a coal waste site identified in the permits as “Imperial Land Coal Slurry” along with a large wetland.
Figure 7. Coal mines in Imperial, Pennsylvania
Vulnerable species
Southern Redbelly Dace
The Southern Redbelly Dace, a threatened species, is especially vulnerable to physical and chemical (turbidity, temperature) changes to their environment. PA Fish and Boat Commission explicitly notes in their correspondence with Shell that “we are concerned about potential impacts to the fish, eggs and the hatching fry from any in-stream work.” Of note is that these sites of concern are located in designated “High Quality/Cold Water Fishes” streams of the Service Creek watershed (Figure 8). PFBC stated that that no in-stream work in these locations should be done between May 1 and July 31.
Figure 8. “High Quality/Cold Water Fishes” streams identified as habitat for the Southern Redbelly Dace
Northern Harriers & Short-Eared Owls
Portions of the Falcon’s workspace are located near 6 areas with known occurrences of Short-eared Owls (PA endangered species) and Northern Harriers (PA threatened species). Pennsylvania Game Commission requested a study of these areas to identify breeding and nesting locations, which were executed from April-July 2016 within a 1,000-foot buffer of the pipeline’s workspace (limited to land cover areas consisting of meadows and pasture). One Short-eared Owl observation and 67 Northern Harrier observations were recorded during the study. PGC’s determined that, “based on the unusually high number of observations at these locations” work should not be done in these areas during harrier breeding season, April 15 through August 31.
Figure 9. Surveyed areas for Short-eared Owls (PA endangered species) and Northern Harriers (PA threatened species)
Bald Eagles
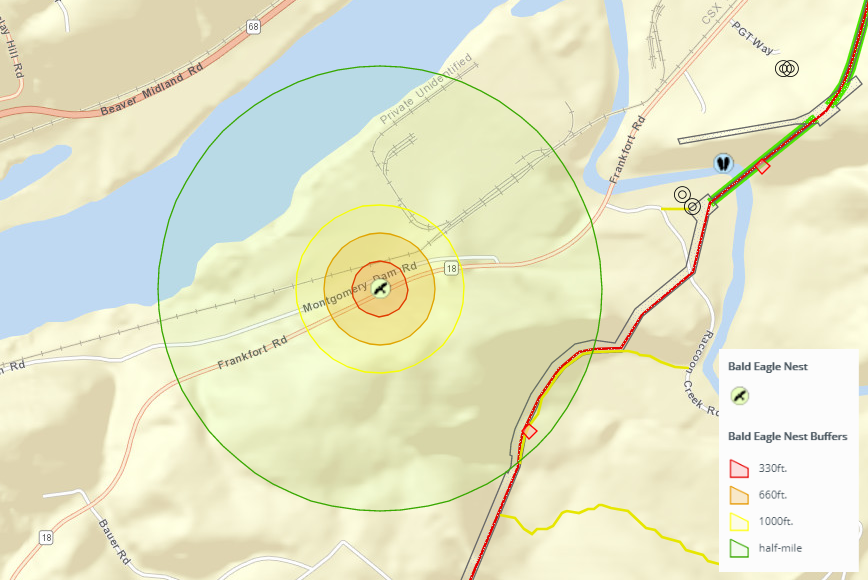
A known Bald Eagle nest is located in Beaver County. Two potential “alternate nests” are located where the Falcon crosses the Ohio River. National Bald Eagle Management Guidelines bar habitat disturbances that may interfere with the ability of eagles to breed, nest, roost, and forage. The 1 active nest in close proximity to the Falcon, called the Montgomery Dam Nest, is located just west of the pipeline’s terminus at Shell’s ethane cracker facility.
U.S. Fish and Wildlife Service requested that Shell only implement setback buffers for the one active nest at Montgomery Dam (Figure 10). These include no tree clearing within 330 feet, no visible disturbances with 660 feet, and no excessive noise with 1,000 feet of an active nest. Furthermore, Shell must avoid all activities within 660ft of the nest from January 1st to July 31st that may disturb the eagles, including but not limited to “construction, excavation, use of heavy equipment, use of loud equipment or machinery, vegetation clearing, earth disturbance, planting, and landscaping.
Figure 10. Bald Eagle nest in Potter Township, Pennsylvania
Bats
The Falcon is located within the range of federally protected Indiana Bats and Northern Long-eared Bats in Pennsylvania and West Virginia. In pre-construction surveys, 17 Northern Long-eared Bats were found at 13 of the survey sites, but no Indiana Bats were captured.
A total of 9 Northern Long-eared Bat roost trees were located, with the nearest roost tree located 318 feet from the pipeline’s workspace. Figure 11 below shows a cluster of roost trees in Raccoon Township, PA. For a map of all the roost trees, click here. The U.S. Fish and Wildlife Service stated that “Due to the presence of several Northern Long-eared Bat roost trees within the vicinity of the project footprint (although outside of the 150-foot buffer), we recommend the following voluntary conservation measure: No tree removal between June 1 and July 31.”
The Pennsylvania Game Commission noted in early correspondences that Silver-haired Bats may be in the region (a PA species of special concern). PGC did not require a further study for the species, but did request a more restrictive conservation of no tree clearing between April 1 and October 31.
Figure 11. Northern long-eared bat roost trees in Raccoon Township, Pennsylvania
For more information on the wildlife impacts of the Falcon Pipeline, click here.
By documenting the impacts of the Falcon Pipeline, you’re contributing to a growing body of work that shows the risks of fossil fuel pipelines. Not only does this evidence protect drinking water and vulnerable species, it serves as evidence against an inherently dangerous project that will contribute to climate change and the global plastics crisis.
We hope you’re inspired to take action and add your voice to a growing team in the region committed to safer and healthier environments. Thank YOU for your dedication to the cause!
By Erica Jackson, Community Outreach and Communications Specialist, FracTracker Alliance.
Portions of this article were adapted from previous posts in the Falcon Public EIA Project, written by Kirk Jalbert.
https://www.fractracker.org/a5ej20sjfwe/wp-content/uploads/2019/05/PipelineConstructionFeature.png6671500Erica Jacksonhttps://www.fractracker.org/a5ej20sjfwe/wp-content/uploads/2025/09/2025-Wordmark-Logo.pngErica Jackson2019-05-08 08:27:302021-04-15 14:56:31The Falcon Public Monitoring Project
Contact: Lee Ziesche, lee@saneenergyproject.org, 954-415-6282
Interactive Map Shows Expansion of Fracked Gas Infrastructure in New York State
And showcases powerful community resistance to it
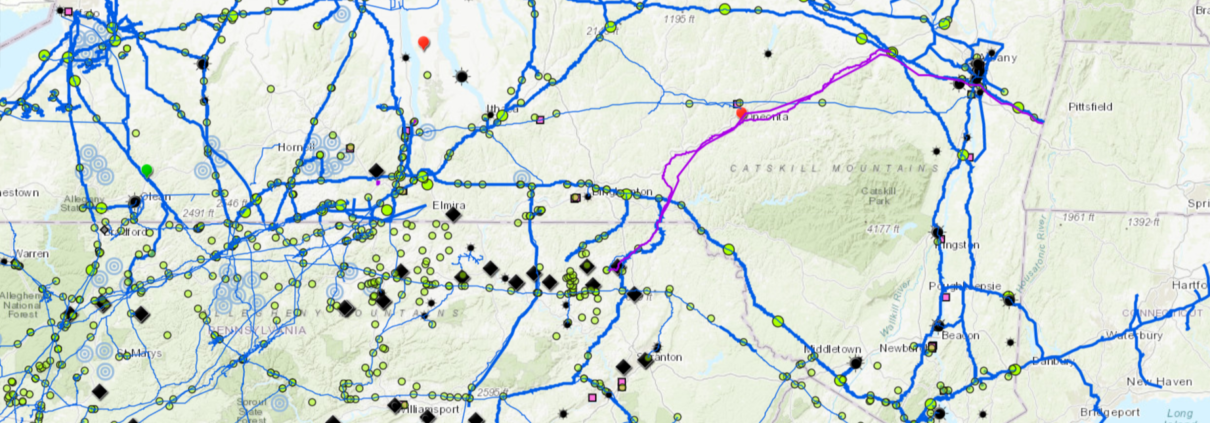
New York, NY – A little over a year after 55 New Yorkers were arrested outside of Governor Cuomo’s door calling on him to be a true climate leader and halt the expansion of fracked gas infrastructure in New York State, grassroots advocates Sane Energy Project re-launched the You Are Here (YAH) map, an interactive map that shows an expanding system of fracked infrastructure approved by the Governor.
“When Governor Cuomo announced New York’s climate goals in early 2019, it’s clear there is no room for more extractive energy, like fossil fuels.” said Kim Fraczek, Director of Sane Energy Project, “Yet, I look at the You Are Here Map, and I see a web of fracked gas pipelines and power plants trapping communities, poisoning our water, and contributing to climate change.”
Sane Energy originally launched the YAH map in 2014 on the eve of the historic People’s Climate March, and since then, has been working with communities that resist fracked gas infrastructure to update the map and tell their stories.
“If you read the paper, you might think Governor Cuomo is a climate leader, but one look at the YAH Map and you know that isn’t true. Communities across the state are living with the risks of Governor Cuomo’s unprecedented buildout of fracked gas infrastructure,” said Courtney Williams, a mother of two young children living within 400 feet of the AIM fracked gas pipeline. “The Governor has done nothing to address the risks posed by the “Algonquin” Pipeline running under Indian Point Nuclear Power Plant. That is the center of a bullseye that puts 20 million people in danger.”
Fracked gas infrastructure poses many of the same health risks as fracking and the YAH map exposes a major hypocrisy when it comes to Governor Cuomo’s environmental credentials. The Governor has promised a Green New Deal for New York, but climate science has found the expansion of fracking and fracked gas infrastructure is increasing greenhouse gas emissions in the United States.
“The YAH map has been an invaluable organizing tool. The mothers I work with see the map and instantly understand how they are connected across geography and they feel less alone. This solidarity among mothers is how we build our power ,” said Lisa Marshall who began organizing with Mothers Out Front to oppose the expansion of the Dominion fracked gas pipeline in the Southern Tier and a compressor station built near her home in Horseheads, New York. “One look at the map and it’s obvious that Governor Cuomo hasn’t done enough to preserve a livable climate for our children.”
“Community resistance beat fracking and the Constitution Pipeline in our area,” said Kate O’Donnell of Concerned Citizens of Oneonta and Compressor Free Franklin. “Yet smaller, lesser known infrastructure like bomb trucks and a proposed gas decompressor station and 25 % increase in gas supply still threaten our communities.”
The YAH map was built in partnership with FracTracker, a non-profit that shares maps, images, data, and analysis related to the oil and gas industry hoping that a better informed public will be able to make better informed decisions regarding the world’s energy future.
“It has been a privilege to collaborate with Sane Energy Project to bring our different expertise to visualizing the extent of the destruction from the fossil fuel industry. We look forward to moving these detrimental projects to the WINS layer, as communities organize together to take control of their energy future. Only then, can we see a true expansion of renewable energy and sustainable communities,” said Karen Edelstein, Eastern Program Coordinator at Fractracker Alliance.
Throughout May and June Sane Energy Project and 350.org will be traveling across the state on the ‘Sit, Stand Sing’ tour to communities featured on the map to hold trainings on nonviolent direct action and building organizing skills that connect together the communities of resistance.
“Resistance to fracking infrastructure always starts with small, volunteer led community groups,” said Lee Ziesche, Sane Energy Community Engagement Coordinator. “When these fracked gas projects come to town they’re up against one of the most powerful industries in the world. The You Are Here Map and ‘Sit, Stand Sing’ tour will connect these fights and help build the power we need to stop the harm and make a just transition to community owned renewable energy.”
https://www.fractracker.org/a5ej20sjfwe/wp-content/uploads/2019/04/YouAreHereMap2.png6671500Guest Authorhttps://www.fractracker.org/a5ej20sjfwe/wp-content/uploads/2025/09/2025-Wordmark-Logo.pngGuest Author2019-04-24 15:49:052021-04-15 14:56:34Release: The 2019 You Are Here map launches, showing New York’s hurdles to climate leadership
Although the vast majority of scientists agree that we must rapidly move away from fossil fuels to avoid a human-caused climate catastrophe by the end of this century, pipeline construction remains a big business.
Pipelines are the backbone of domestic fossil fuel use and for delivering fuels to terminals for international export. Yet aside from a few high-profile pipeline controversies that show up in the media, few Americans are aware of the vast network of pipelines that transport oil and gas products from sources of extraction to industry and end-use consumers.
The United States is crisscrossed by over 1.63 million miles of fossil fuel pipelines. This includes:
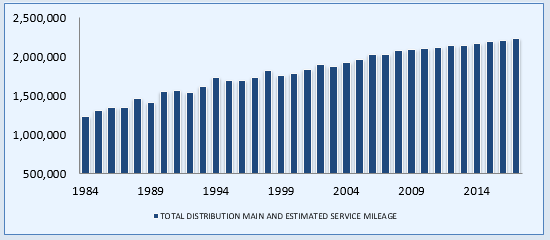
Many of the country’s pipelines have been built within the last few decades, and in recent years, construction of more has been spurred on by the fracking boom. The total mile count of crude oil pipelines (currently 79,000) has increased over 60% between 2004 and 2017. Natural gas distribution and estimated service pipeline miles increased 72% between 1984 and 2017 (Figure 1).
Figure 1. Miles of natural gas distribution (1,296,157 miles) and estimated service ( 927,052 miles) pipelines in the U.S., 1984-2017
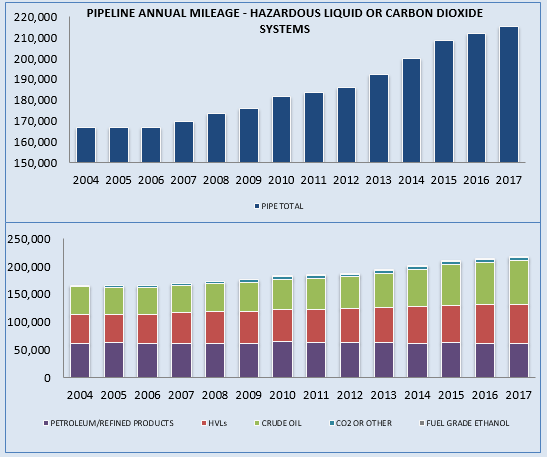
Although total mileage for transmission pipelines slightly dropped between 2004 and 2017 (according to the Pipeline and Hazardous Materials Safety Administration), total mileage for Hazardous Liquids pipelines jumped 33% during that same period (Figures 2 and 3).
Figure 2 (above). Total miles of Hazardous Liquid pipelines in the U.S., 2004-2017 Figure 3 (below). Break down of Hazardous Liquid pipeline miles in the U.S by what they’re transporting, 2004-2017
Exporting natural gas
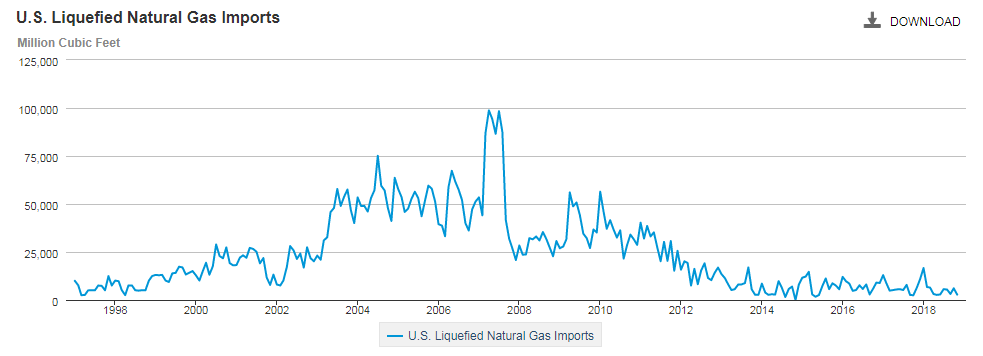
When natural gas is imported or exported, it’s transported in a liquefied form. The product occupies much less space as a liquefied natural gas (LNG) than it does in its gaseous form, making it easier to transport.
For many years, the United States was an importer of natural gas, until 2007, when this trend quickly reversed, coinciding with the “fracking boom” in the Marcellus Shale, as well as several other shale plays in Texas, Wyoming, and elsewhere.
Figure 4. U.S. imports of natural gas, which is transported as liquefied natural gas (LNG)
LNG facilities store and process natural gas to help move it between markets. Between 2010 and 2017, the number of LNG facilities increased from 122 to 152 (includes LNG storage facilities). This nearly 25% increase reflects the surplus of natural gas in the lower 48 states.
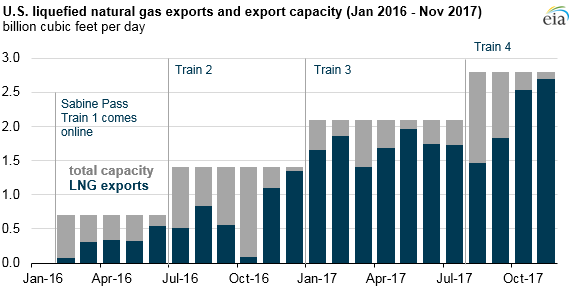
The U.S. began exporting LNG in 2016, especially to Europe and China, where demand is high. According to the United States Energy Information Administration (EIA), LNG exports doubled between 2016 and 2017 (Figure 5).
Figure 5. U.S. LNG exports between January, 2016 and October, 2017, are shown in the blue bars
Exports are again expected to double over 2018 levels by the end of 2019, reaching a storage capacity of 9.6 billion cubic feet per day. The US is now the third largest exporter of LNG, after Australia and Qatar.
The breakdown of LNG terminals —existing and future— according to FERC is shown below. These terminals receive LNG imports or ship out LNG for export. The shift from LNG import to export activity over time is quite striking. No new import facilities are currently in the planning phase, yet there are 19 export facilities proposed and another 10 already approved.
Table 1. Import and Export LNG Terminals in the US: Current, Approved, and Proposed.
19: Pascagoula, MS; Cameron Parish, LA (2); Brownsville, TX (3); Port Arthur, TX; Jacksonville, FL; Plaquemines Parish, LA (2); Calcasieu Parish, LA; Nikiski, AK; Freeport, TX; Coos Bay, OR; Corpus Christi, TX; La Fourche Parish, LA; Sabine Pass, LA; Galveston Bay, TX
The challenge of keeping up
One of the challenges in working on oil and gas-related environmental advocacy is that from week to week, there are always changes in pipeline status. New pipelines are announced, others are delayed, others are postponed, and in some cases, projects are cancelled or defeated. Pipelines that have been under construction for years go on line. Listings are piece-meal, sometimes very vague, and sometimes reported by third and fourth party sources.
FracTracker is committed to sorting through this information, and providing a window into the expansion of oil and gas infrastructure. We have mapped and assembled information on over 60,000 miles of new and proposed oil and gas transmission pipelines and mapped over 250 projects since 2017.
Of these 60,000 pipeline miles, almost 9,800 have been completed and/or are operating. Close to 7,500 miles were cancelled or defeated. This leaves another 42,700 miles of pipeline that are currently in the replacement, reversal, planning or construction stages.
In the interactive map below, against a background of existing pipelines, we show the newest pipelines that have come “on the radar” since 2017. In addition we show LNG terminals, one of the main destinations for the gas that flows through the pipelines to the export market.
FracTracker is dedicated to bringing transparency to the landscape of oil and gas development. We use mapping tools such as GIS (geographic information systems) to illuminate developments in oil and gas infrastructure expansion.
After we create a composite list of pipelines, the research begins. We search the internet for references to each pipeline, looking for industry announcements, descriptions, news articles, and, most importantly, the docket listings of the Federal Energy Regulatory Commission (FERC).
FERC may release detailed maps of pipeline routes from the company’s Environmental Impact Statement (EIS), filed after operators have progressed past the initial phases of planning. On occasion, we’ll stumble across links to Google Earth files that grassroots groups have ground-truthed. We can convert these .kml files into our ArcGIS mapping software directly.
Digital cartography
How do we go from online pictures of maps to data that we can use in our interactive maps? For the most part, we use a process called georeferencing, also known in some circles as “rubber-sheeting”. One of the beauties of digital cartography and GIS is that through the magic of computing, we can add information about location to mapped information. This allows us to add different features to a map, such as roads or rivers, and ensure that they line up correctly.
Let’s say I have a .jpg (image) file of a pipeline map that crosses four counties in Indiana. The .jpg shows both the pipeline and the county boundaries. I can open my GIS program and add a reference basemap of the United States, which is similar to what you see when you open Google Maps. I can zoom in to Indiana and add a second GIS layer of Indiana’s counties (already built with coordinates in the digital information), and voila! It drops right into where Indiana is on my base map. Can I do this with the pipeline .jpg? Not yet!
I have to use the clues on the pipeline image to place it in the correct location on the GIS map. Luckily, my pipeline map has county boundaries on it, so I can line up the corners (or other shapes) on the pipeline image to where they are on my map that is “smart” about location using ground control points.
Once I’m satisfied that the map I’ve added is in the correct location, I carefully trace the path of the pipeline, saving it as a GIS layer. Because it’s drawn with its own location data included, it will always appear in future maps in the same place relative to the rest of Indiana.
That’s our process in a nutshell.
Want to see this done as a demo? Here’s a nice 10-minute YouTube video:
https://www.fractracker.org/a5ej20sjfwe/wp-content/uploads/2019/02/PipelineConstructionPA.png400900Karen Edelsteinhttps://www.fractracker.org/a5ej20sjfwe/wp-content/uploads/2025/09/2025-Wordmark-Logo.pngKaren Edelstein2019-02-28 19:24:532021-04-15 14:56:54The Growing Web of Oil and Gas Pipelines
Guest blog by Meryl Compton, policy associate with Frontier Group
Roughly half of the homes in America use gas for providing heat, hot water or powering appliances. If you use gas in your home, you know that leaks are bad – they waste money, they pollute the air, and, if exposed to a spark, they could spell disaster.
Our homes, however, are only the end point of a vast production and transportation system that brings gas through a network of pipelines all the way from the wellhead to our kitchens. There are opportunities for wasteful and often dangerous leaks all along the way – leaks that threaten the public’s health and safety and contribute to climate change.
How frequent are gas leaks?
Between January 2010 and November 2018, there were a reported 1,888 incidents that involved a serious injury, fatality or major financial loss related to gas leaks in the production, transmission and distribution system, according to data from the Pipeline and Hazardous Materials Safety Administration. These incidents caused 86 deaths, 487 injuries and over $1 billion in costs.
When gas lines leak, rupture, or are otherwise damaged, the gas released can explode, sometimes right in our own backyards. Roughly one in seven of the incidents referenced above – 260 in total – involved an explosion.
In September 2018, for example, a series of explosions in three Massachusetts communities caused one death, numerous injuries and the destruction of as many as 80 homes. And there are many more stories like it from communities across the U.S. From the 2010 pipeline rupture and explosion in San Bruno, California, that killed eight people and destroyed almost 40 homes to the 2014 disaster in New York City that destroyed two five-story buildings and killed eight people, these events serve as a powerful reminder of the danger posed by gas.
The financial and environmental costs
Gas leaks are also a sheer waste of resources. While some gas is released deliberately in the gas production process, large amounts are released unintentionally due to malfunctioning equipment, corrosion and natural causes like flooding. The U.S. Energy Information Administration estimates that 123,692 million cubic feet of gas were lost in 2017 alone, enough to power over 1 million homes for an entire year. That amount is likely an underestimate. On top of the major leaks reported to the government agency in charge of pipeline safety, many of our cities’ aging gas systems are riddled with smaller leaks, making it tricky to quantify just how much gas is lost from leaks in our nation’s gas system.
Leaks also threaten the stability of our climate because they release large amounts of methane, the main component of gas and a potent greenhouse gas. Gas is not the “cleaner” alternative to coal that the industry often makes it out to be. The amount of methane released during production and distribution is enough to reduce or even negate its greenhouse gas advantage over coal. The total estimated methane emissions from U.S. gas systems have roughly the same global warming impact over a 20-year period as all the carbon dioxide emissions from U.S. coal plants in 2015 – and methane emissions are likely higher than this amount, which is self-reported by the industry.
In most states, there is no strong incentive for gas companies to reduce the amount of leaked gas because they can still charge customers for it through “purchased gas adjustment clauses.” These costs to consumers are far from trivial. Between 2001 and 2011, Americans paid at least $20 billion for gas that never made it to their homes.
These and other dangers of gas leaks are described in a recent fact sheet by U.S. PIRG Education Fund and Frontier Group. At a time when climate change is focusing attention on our energy system, it is critical that communities understand the full range of problems with gas – including the ever-present risk of leaks in the extensive network of infrastructure that brings gas from the well to our homes.
We should not be using a fuel that endangers the public’s safety and threatens the stability of our climate. Luckily, we don’t have to. Switching to electric home heating and hot water systems and appliances powered by renewable energy would allow us to move toward eliminating carbon emissions from homes. Electric heat pumps are twice as efficient as gas systems in providing heat and hot water, making them a viable and commonsense replacement. Similarly, as the cost of wind and solar keep falling, they will continue to undercut gas prices in many regions.
It’s time to move beyond gas and create a cleaner, safer energy system.
By Meryl Compton, policy associate with Frontier Group, a non-profit think tank part of The Public Interest Network. She is based in Denver, Colorado.
Feature image at top of page shows San Bruno, California, following the 2010 pipeline explosion
Pittsburgh, PA – Yesterday, the Pennsylvania Department of Environmental Protection (DEP) announced their decision to issue a permit for the construction of Shell’s Falcon ethane pipeline project in southwest PA. FracTracker Alliance is extremely disappointed that DEP is allowing this project to proceed despite heavy opposition from the public and unaddressed concerns for the safety and well-being of nearby residents and the surrounding environment.
The past year has seen countless issues from the construction of new pipelines in the Commonwealth – from hundreds of “inadvertent returns,” (spills of bentonite drilling mud) along the path of the Mariner East II project to the catastrophic explosion of the week-old Revolution Pipeline in Beaver County. These reoccurring and serious incidents make it clear that oil and gas midstream companies are rushing to put infrastructure in place, and DEP and other regulatory agencies have been failing in their mission to adequately supervise the process.
According to data from the US Pipeline and Hazardous Materials Safety Administration, there were 108 pipeline incidents in Pennsylvania between January 2010 and mid-July 2018, resulting in 8 fatalities, 15 injuries, requiring over 1,100 people to be evacuated from their homes, and causing more than $66 million in property damage. This track record, which does not include the Revolution Pipeline explosion in September of 2018, is frankly unacceptable.
Certainly, the Commonwealth has invested heavily in the Shell Ethane Cracker facility, offering steep tax subsidies and even paying the global petrochemical giant $2.10 for every barrel of ethane it consumes from Pennsylvania wells, equivalent to $1.6 billion over the next 25 years. It appears to FracTracker that these business arrangements have made the continued extraction and exploitation of hydrocarbons the priority for DEP, not protecting the environment and health and safety of Pennsylvanians, as the mission of the Department suggests is their focus. DEP’s decision also traces an unfortunate pattern of opaqueness and poor timing by announcing unpopular decisions right before the holidays.
Fundamentally, oil and gas companies like Shell exist to make profits, and will therefore make decisions to maximize earnings and limit their costs, if left to their own devices. This approach is often directly at odds with public safety, so Pennsylvania entrusts DEP to oversee the operations. FracTracker feels that with their decision to move forward with the project on December 20, 2018, DEP brushed over dozens of substantial concerns regarding the Falcon ethane pipeline project, and therefore failed in this mission. We remain unconvinced that the “appropriate construction techniques and special conditions” required by DEP will adequately protect the environment and health and safety of residents along the Falcon pipeline route.
Dec. 21st Update: After this article was written, FracTracker learned that Ohio’s EPA issued an air quality permit for the cracker plant in Belmont County, Ohio on December 21st. The short public comment period and the rush to issue permits again illustrates that significant public health and environmental concerns are given minimal importance versus corporate wishes and political expediency. The regulatory paradigm is broken. The public has been ill served by the agencies entrusted to safeguard their interests. A collective regional voice should be raised in protest.
Started in 2010 as a southwestern Pennsylvania area website, FracTracker Alliance is now a national organization with regional offices across the United States in Pennsylvania, Washington DC, New York, Ohio, and California. The organization’s mission is to study, map, and communicate the risks of oil and gas development to protect our planet and support the renewable energy transformation. Its goal is to support advocacy groups at the local, regional and national level, informing their actions to positively shape our nation’s energy future. www.fractracker.org
Learn more about FracTracker’s coverage of the Falcon ethane pipeline project by exploring the posts below:
Pipelines play a major role in the oil and gas extraction industry, allowing for the transport of hydrocarbons from well sites to a variety of infrastructure, including processing plants, petrochemical facilities, power generation plants, and ultimately consumers. There are more than 2.7 million miles of natural gas and hazardous liquid pipelines in the United States, or more than 11 times the distance from Earth to the moon.
With all of this infrastructure in place, pipelines are inevitably routed close to homes, schools, and other culturally or ecologically important locations. But how safe are pipelines, really? While they are typically buried underground and out of sight, many residents are concerned about the constant passage of volatile materials through these pipes in close proximity to these areas, with persistent but often unstated possibility that something might go wrong some day.
Safety talking points
In an attempt to assuage these fears, industry representatives and regulators tend to throw around variants of the word “safe” quite a bit:
Pipelines are the safest and most reliable means of transporting the nation’s energy products.
— Keith Coyle, Marcellus Shale Coalition
Although pipelines exist in all fifty states, most of us are unaware that this vast network even exists. This is due to the strong safety record of pipelines and the fact that most of them are located underground. Installing pipelines underground protects them from damage and helps protect our communities as well.
— Pipeline and Hazardous Materials Safety Administration (PHMSA)
Pipelines are an extremely safe way to transport energy across the country.
— Pipeline 101
Knowing how important pipelines are to everyday living is a big reason why we as pipeline operators strive to keep them safe. Pipelines themselves are one of the safest ways to transport energy with a barrel of crude oil or petroleum product reaching its destination safely by pipeline 99.999% of the time.
— American Petroleum Institute
But are pipelines really safe?
Given these talking points, the general public can be excused for being under the impression that pipelines are no big deal. However, PHMSA keeps records on pipeline incidents in the US, and the cumulative impact of these events is staggering. These incidents are broken into three separate reports:
Gas Distribution (lines that take gas to residents and other consumers),
Gas Transmission & Gathering (collectively bringing gas from well sites to processing facilities and distant markets), and
Hazardous Liquids (including crude oil, refined petroleum products, and natural gas liquids).
Below in Table 1 is a summary of pipeline incident data from 2010 through mid-November of this year. Of note: Some details from recent events are still pending, and are therefore not yet reflected in these reports.
Table 1: Summary of pipeline incidents from 1/1/2010 through 11/14/2018
Report
Incidents
Injuries
Fatalities
Evacuees
Fires
Explosions
Damages ($)
Gas Distribution
934
473
92
18,467
576
226
381,705,567
Gas Transmission & Gathering
1,069
99
24
8,614
121
51
1,107,988,837
Hazardous Liquids
3,509
24
10
2,471
111
14
2,606,014,109
Totals
5,512
596
126
29,552
808
291
4,095,708,513
Based on this data, on average each day in the US 1.7 pipeline incidents are reported (a number in line with our previous analyses), requiring 9 people to be evacuated, and causing almost $1.3 million in property damage. A pipeline catches fire every 4 days and results in an explosion every 11 days. These incidents result in an injury every 5 days, on average, and a fatality every 26 days.
Data shortcomings
While the PHMSA datasets are extremely thorough, they do have some limitations. Unfortunately, in some cases, these limitations tend to minimize our understanding of the true impacts. A notable recent example is a series of explosions and fires on September 13, 2018 in the towns of Lawrence, Andover, and North Andover, in the Merrimack Valley region of Massachusetts. Cumulatively, these incidents resulted in the death of a young man and the injuries to 25 other people. There were 60-80 structure fires, according to early reports, as gas distribution lines became over-pressurized.
The preliminary PHMSA report lists all of these Massachusetts fires as a single event, so it is counted as one fire and one explosion in Table 1. As of the November 14 download of the data, property damage has not been calculated, and is listed as $0. The number of evacuees in the report also stands at zero. This serves as a reminder that analysis of the oil and gas industry can only be as good as the available data, and relying on operators to accurately self-report the full extent of the impacts is a somewhat dubious practice.
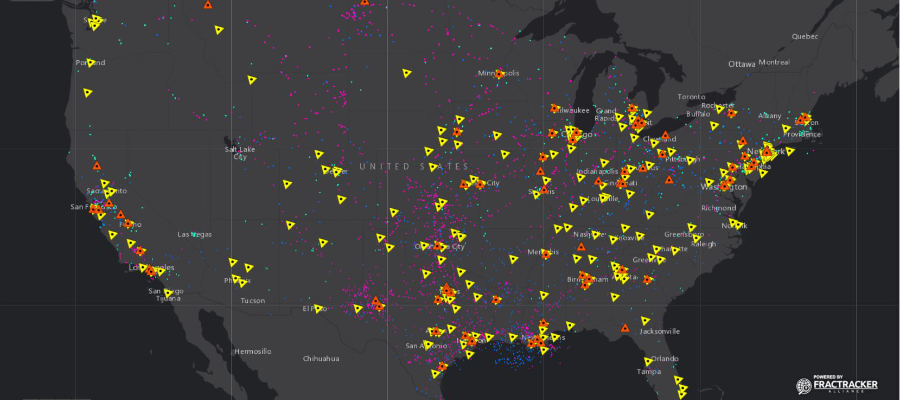
This map shows pipeline incidents in the US from 1/1/2010 through 11/14/2018. Source: PHMSA. One record without coordinates was discarded, and 10 records had missing decimal points or negative (-) signs added to the longitude values. A few obvious errors remain, such as a 2012 incident near Winnipeg that should be in Texas, but we are not in a position to guess at the correct latitude and longitude values for each of the 5,512 incidents.
Another recent incident occurred in Center Township, a small community in Beaver County, Pennsylvania near Aliquippa on September 10, 2018. According to the PHMSA Gas Transmission & Gathering report, this incident on the brand new Revolution gathering line caused over $7 million in damage, destroying a house and multiple vehicles, and required 49 people to evacuate. The incident was indicated as a fire, but not an explosion. However, reporting by local media station WPXI quoted this description from a neighbor:
A major explosion, I thought it was a plane crash honestly. My wife and I jumped out of bed and it was just like a light. It looked like daylight. It was a ball of flame like I’ve never seen before.
From the standpoint of the data, this error is not particularly egregious. On the other hand, it does serve to falsely represent the overall safety of the system, at least if we consider explosions to be more hazardous than fires.
Big picture findings
Comparing the three reports against one another, we can see that the majority of incidents (64%) and damages (also 64%) are caused by hazardous liquids pipelines, even though the liquids account for less than 8% of the total mileage of the network. In all of the other categories, however, gas distribution lines account for more than half of the cumulative damage, including injuries (79%), deaths (73%), evacuees (62%), fires (71%), and explosions (78%). This is perhaps due to the vast network (more than 2.2 million miles) of gas distribution mains and service lines, as well as their nature of taking these hazardous products directly into populated areas. Comparatively, transmission and hazardous liquids lines ostensibly attempt to avoid those locations.
Is the age of the pipeline a factor in incidents?
Among the available attributes in the incident datasets is a field indicating the year the pipeline was installed. While this data point is not always completed, there is enough of a sample size to look for trends in the data. We determined the age of the pipe by subtracting the year the pipe was installed from the year of the incident, eliminating nonsensical values that were created when the pipeline age was not provided. In the following section, we will look at two tables for each of the three reports. The first table shows the cause of the failure compared to the average age, and the second breaks down results by the content that the pipe was carrying. We’ll also include a histogram of the pipe age, so we can get a sense of how representative the average age actually is within the sample.
A. Gas distribution
Each table shows some fluctuation in the average age of pipeline incidents depending on other variables, although the variation in the product contained in the pipe (Table 3) are minor, and may be due to relatively small sample sizes in some of the categories. When examining the nature of the failure in relation to the age of the pipe (Table 2), it does make sense that incidents involving corrosion would be more likely to afflict older pipelines, (although again, the number of incidents in this category is relatively small). On average, distribution pipeline incidents occur on pipes that are 33 years old.
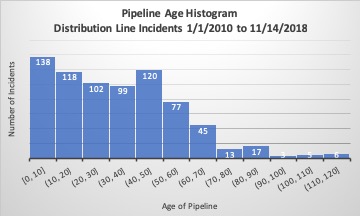
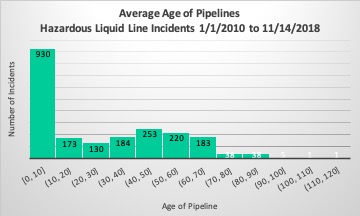
When we look at the histogram (Figure 1) for the overall distribution of the age of the pipeline, we see that those in the first bin, representing routes under 10 years of age, are actually the most frequent. In fact, the overall trend, excepting those in the 40 t0 50 year old bin, is that the older the pipeline, the fewer the number of incidents. This may reflect the massive scale of pipeline construction in recent decades, or perhaps pipeline safety protocol has regressed over time.
Age of Pipeline - Histogram
Figure 1. Age of pipeline histogram for gas distribution line incidents between 1/1/2010 and 11/14/2018. Incidents where the age of the pipe is unknown are excluded.
Age/Cause of Incidents - Table 2
Table 2. Average age of pipe and cause for failure in gas distribution line incidents
Cause of Failure
Incidents – Total
Incidents – Pipe Age Known
Avg. Pipe Age
Corrosion Failure
18
15
53
Equipment Failure
47
41
30
Excavation Damage
271
239
32
Incorrect Operation
62
51
34
Material Failure Of Pipe Or Weld
63
56
40
Natural Force Damage
72
61
42
Other Incident Cause
96
53
41
Other Outside Force Damage
305
227
28
Grand Total
934
743
33
Age/Product Transported - Table 3
Table 3. Average age of pipe and material being transported in gas distribution lines
Product
Incidents – Total
Incidents – Pipe Age Known
Ave. Pipe Age
Natural Gas
862
706
34
Other Gas
3
Propane Gas
11
7
25
Synthetic Gas
1
1
38
(Blank)
57
29
27
Grand Total
934
743
33
B. Gas Transmission & Gathering
Transmission & Gathering line incidents occur on pipelines routes that are, on average, five years older than their distribution counterparts. Corrosion, natural force damage, and material failures on pipes and welds occur on pipelines with an average age above the overall mean, while excavation and “other outside force” incidents tend to occur on newer pipes (Table 4). The latter category would include things like being struck by vehicles, damaged in wildfires, or vandalism. The contents of the pipe does not seem to have any significant correlation with the age of the pipe when we take sample size into consideration (Table 5).
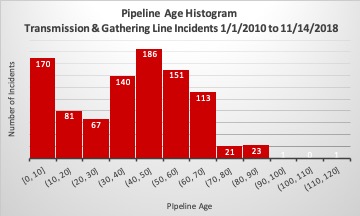
The histogram (Figure 2) for the age of pipes on transmission & gathering line incidents below shows a more normal distribution, with the noticeable exception of the first bin (0 to 10 years old) ranking second in frequency to the fifth bin (40 to 50 years old).
It is worth mentioning that, “PHMSA estimates that only about 5% of gas gathering pipelines are currently subject to PHMSA pipeline safety regulations.” My correspondence with the agency verified that the remainder is not factored into their pipeline mileage or incident reports in any fashion. Therefore, we should not consider the PHMSA data to completely represent the extent of the gathering line network or incidents that occur on those routes.
Age of Pipeline - Histogram
Figure 2. Age of pipeline histogram for transmission & gathering line incidents between 1/1/2010 and 11/14/2018. Incidents where the age of the pipe is unknown are excluded.
Age/Cause of Incidents - Table 4
Table 4. Average age of pipe and cause for failure in gas transmission & gathering line incidents
Cause of Failure
Incidents – Total
Incidents – Pipe Age Known
Ave. Pipe Age
Corrosion Failure
220
212
46
Equipment Failure
327
271
25
Excavation Damage
135
126
52
Incorrect Operation
59
52
26
Material Failure Of Pipe Or Weld
122
119
51
Natural Force Damage
82
76
32
Other Incident Cause
60
46
30
Other Outside Force Damage
64
52
40
Grand Total
1069
954
38
Age/Material Transported - Table 5
Table 5. Average age of pipe and material being transported in gas transmission & gathering lines
Product
Incidents – Total
Incidents – Pipe Age Known
Ave. Pipe Age
Hydrogen Gas
1
1
0
Landfill Gas
1
1
17
Natural Gas
1024
916
38
Other Gas
9
7
33
(Blank)
34
29
38
Grand Total
1069
954
38
C. Hazardous Liquids
The average incident on hazardous liquid lines occurs on pipelines that are 27 years old, which is 6 years younger than for distribution incidents, and 11 years younger than their transmission & gathering counterparts. This appears to be heavily skewed by the equipment failure and incorrect operation categories, both of which occur on pipes averaging 15 years old, and both with substantial numbers of incidents. On the other hand, excavation damage, corrosion, and material/weld failures tend to occur on pipes that are at least 40 years old (Table 6).
In terms of content, pipelines carrying carbon dioxide happen on pipes that average just 11 years old, although there are not enough of these incidents to account for the overall departure from the other two datasets (Table 7).
The overall shape of the histogram (Figure 3) is similar to that of transmission & gathering line incidents, except that the first bin (0 to 10 years old) is by far the most frequent, with more than 3 and a half times as many incidents as the next closest bin (4o to 50 years old). Operators of new hazardous liquid routes are failing at an alarming rate. In descending order, these incidents are blamed on equipment failure (61%), incorrect operation (21%), and corrosion (7%), followed by smaller amounts in other categories. The data indicate that pipelines installed in previous decades were not subject to this degree of failure.
Age of Pipeline - Histogram
Figure 3. Age of pipeline histogram for hazardous liquid line incidents between 1/1/2010 and 11/14/2018. Incidents where the age of the pipe is unknown are excluded.
Age/Cause of Incidents - Table 6
Table 6. Average age of pipe and cause for failure in hazardous liquid line incidents
Cause of Failure
Incidents – Total
Incidents – Pipe Age Known
Avg. Pipe Age
Corrosion Failure
711
465
42
Equipment Failure
1589
879
15
Excavation Damage
126
102
46
Incorrect Operation
500
287
15
Material Failure Of Pipe Or Weld
249
207
41
Natural Force Damage
156
100
29
Other Incident Cause
108
63
33
Other Outside Force Damage
70
53
39
Grand Total
3509
2156
27
Age/Material Transported - Table 7
Table 7. Average age of pipe and material being transported in hazardous liquid lines
Product
Incidents – Total
Incidents – Pipe Age Known
Avg. Pipe Age
Biofuel / Ethanol Blends
4
2
30
CO2 (Carbon Dioxide)
50
40
11
Crude Oil
1764
1090
25
Highly Volatile Liquids*
546
383
23
Refined Petroleum Product
1145
641
32
Grand Total
3509
2156
27
* Highly volatile liquids are transported as liquids but would revert to a gaseous state in ambient conditions, including natural gas liquids like ethane, propane, and butane.
Conclusions
When evaluating quotes, like those listed above, that portray pipelines as a safe way of transporting hydrocarbons, it’s worth taking a closer look at what they are saying.
Are pipelines the safest way of transporting our nation’s energy products? This presupposes that our energy must be met with liquid or gaseous fossil fuels. Certainly, crude shipments by rail and other modes of transport are also concerning, but movements of solar panels and wind turbines are far less risky.
Does the industry have the “strong safety record” that PHMSA proclaims? Here, we have to grapple with the fact that the word “safety” is inherently subjective, and the agency’s own data could certainly argue that the industry is falling short of reasonable safety benchmarks.
And what about the claim that barrels of oil or petroleum products reach their destination “99.999% of the time? First, it’s worth noting that this claim excludes gas pipelines, which account for 92% of the pipelines, even before considering that PHMSA only has records on about 5% of gas gathering lines in their pipeline mileage calculations. But more to the point, while a 99.999% success rate sounds fantastic, in this context, it isn’t good enough, as this means that one barrel in every 100,000 will spill.
For example, the Dakota Access Pipeline has a daily capacity of 470,000 barrels per day (bpd). In an average year, we can expect 1,715 barrels (72,030 gallons) to fail to reach its destination, and indeed, there are numerous spills reported in the course of routine operation on the route. The 590,000 bpd Keystone pipeline leaked 9,700 barrels (407,400 gallons) late last year in South Dakota, or what we might expect from four and a half years of normal operation, given the o.001% failure rate. In all, PHMSA’s hazardous liquid report lists 712,763 barrels (29.9 million gallons) were unintentionally released, while an additional 328,074 barrels (13.8 million gallons) were intentionally released in this time period. Of this, 284,887 barrels (12 million gallons) were recovered, meaning 755,950 barrels (31.7 million gallons) were not.
Beyond that, we must wonder whether the recent spate of pipeline incidents in new routes is a trend that can be corrected. Between the three reports, 1,283 out of the 3,853 (32%) incidents occurred in pipelines that were 10 years old or younger (where the year the pipeline’s age is known). A large number of these incidents are unforced errors, due to poor quality equipment or operator error.
One wonders why regulators are allowing such shoddy workmanship to repeatedly occur on their watch.
By Matt Kelso, Manager of Data and Technology, FracTracker Alliance
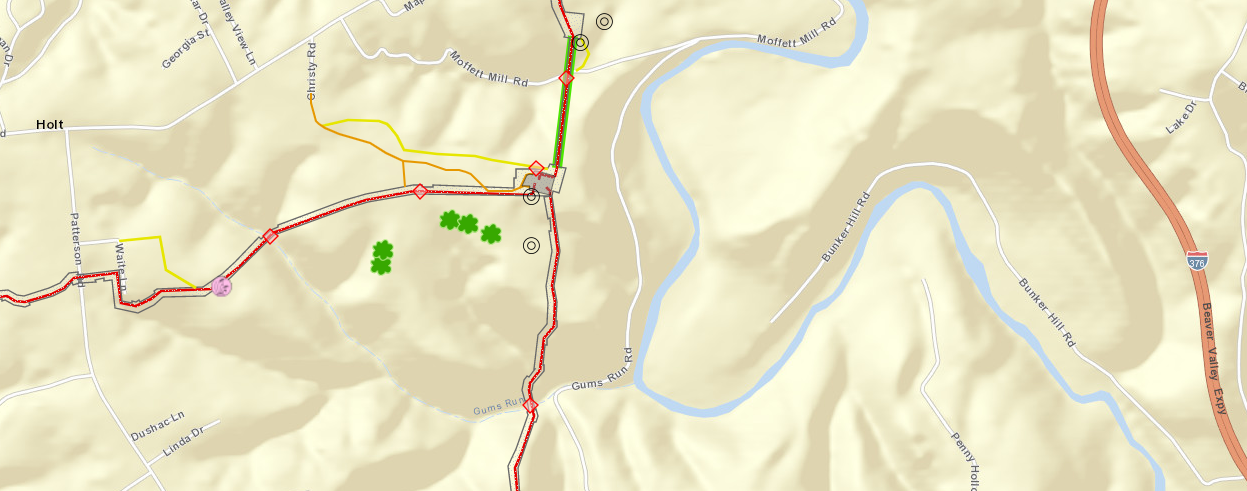
In recent years, Pennsylvanians have had to endure numerous massive pipeline projects in the Commonwealth. Some of these, such as the Mariner East 2, the Revolution, and the Atlantic Sunrise, have been beset with continuous problems. In fact, both the Mariner East 2 and the Revolution projects had their operations suspended in 2018. The operators have struggled to grapple with a variety of issues – ranging from sinkholes near houses, erosion and sediment issues, hundreds ofbentonite spillsinto the waters and upland areas of Pennsylvania, and more.
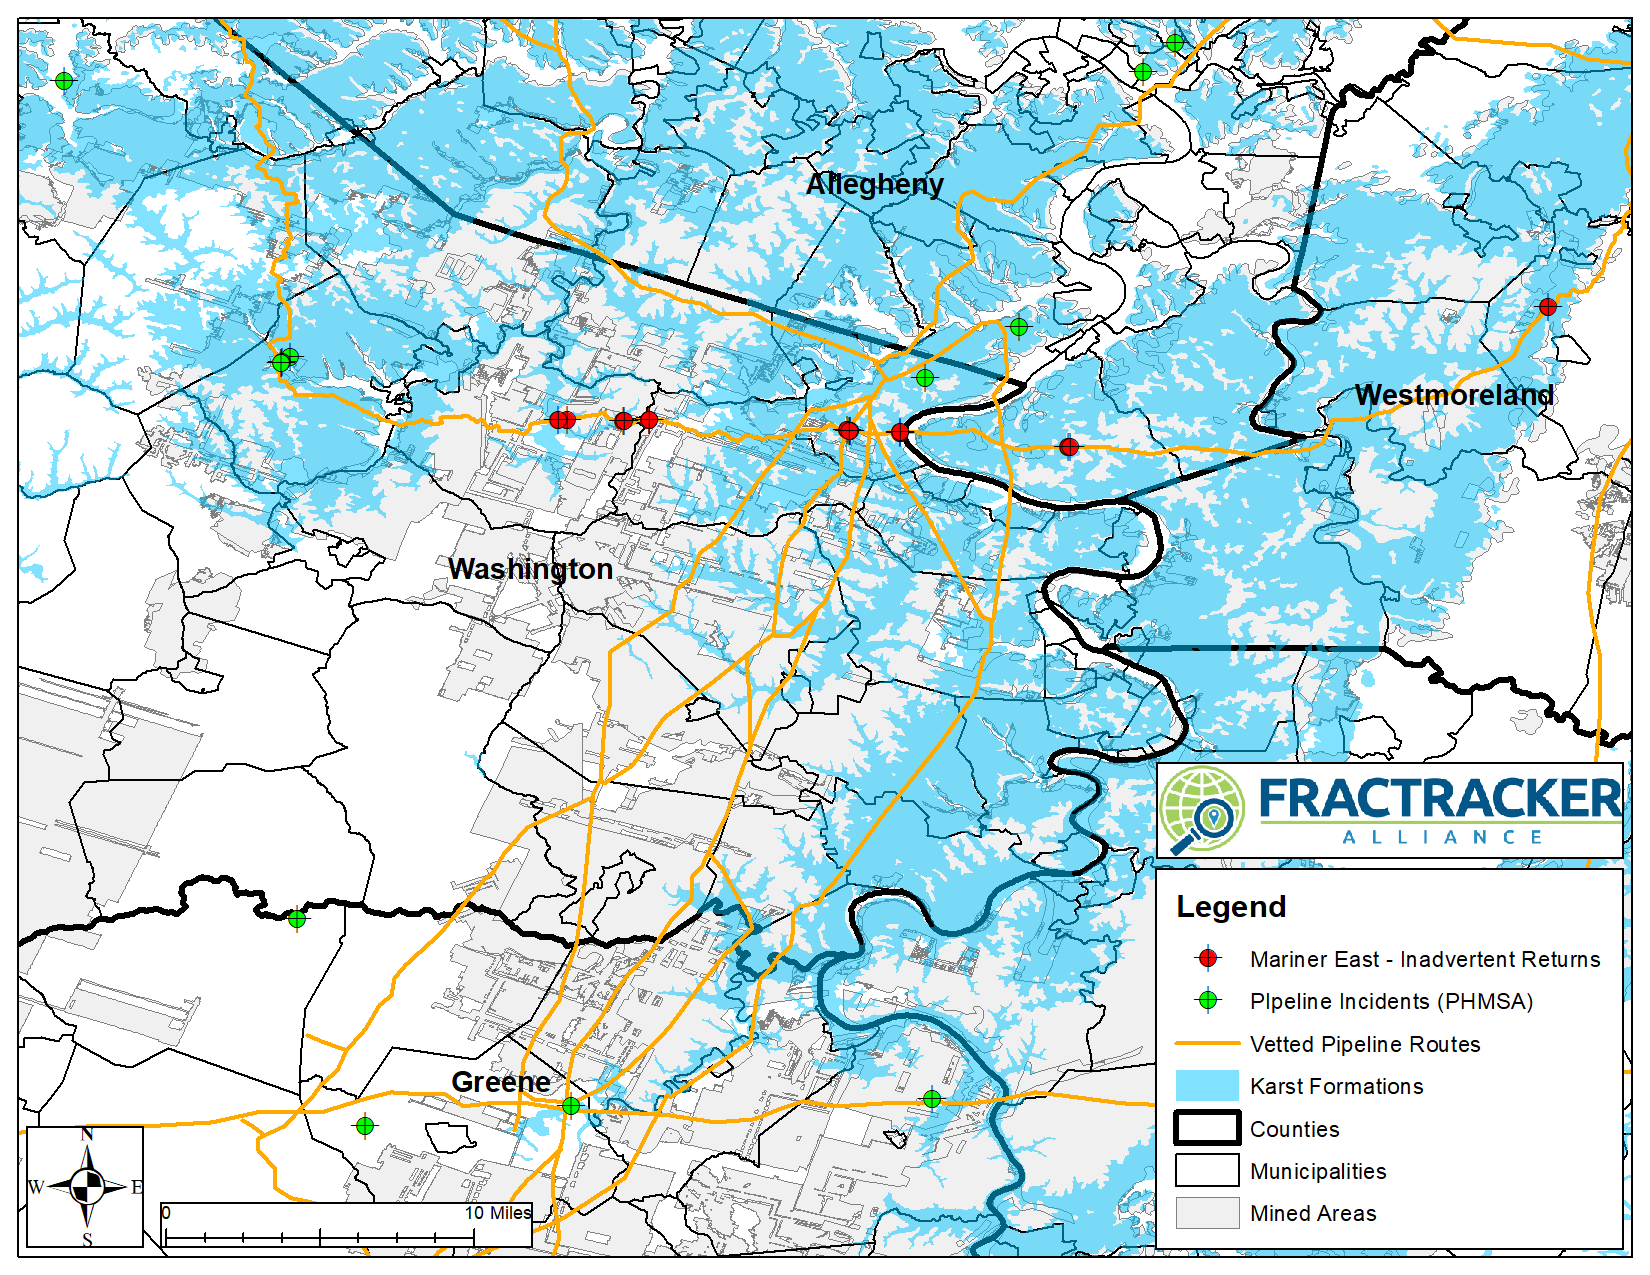
Part of the reason for the recent spate of incidents is the fact that so many pipelines are being built right now. These lines are traversing through undermined areas and land known to have underground karst formations, which are prone to subsidence and sinkholes. With more than 90,000 miles of pipelines and 84,000 miles of streams in Pennsylvania, substantial erosion and runoff issues are unfortunately quite common.
Map of pipeline routes in southwestern PA, various pipeline incidents, and karst formations:
Click here to learn more about recent pipeline incidents in Pennsylvania, along with how users of the FracTracker App have helped to chronicle problems associated with them.
Residents keeping track
Many residents have been trying to document issues in their region of Pennsylvania for a long time. Any pipeline incident should be reported to the Department of Environmental Protection (DEP), but in some instances, people want other residents to know and see what is going on, and submission to DEP does not allow for that. FracTracker’s Mobile App allow users to submit a detailed report, including photographs, which are shared with the public. App users have submitted more than 50 photographs of pipelines in Pennsylvania, including these images below.
The FracTracker Mobile App uses crowd-sourced data to document and map a notoriously nontransparent industry. App users can also report violations, spills, or whatever they find striking. For example, the first image shows construction of the Mariner East 2 in extreme proximity to high density housing. While regulators did approve this construction, and it is therefore not a violation, the app user wanted others to see the impact to nearby residents. Other photos do show incidents, such as the second photo on the second row, showing the sinkhole that appeared along the Mariner East 1 during the construction of the nearby Mariner East 2 pipeline.
Please note that app submissions are not currently shared with DEP, so if you happen to submit an incident on our app that you think they should know about, please contact their office, as well. The FracTracker Mobile App provides latitude and longitude coordinates to make it easier for regulators to find the issue in question.
Why have there been so many problems with pipelines in recent years?
Drillers in Pennsylvania’s Marcellus Shale and other unconventional formations predicted that they would find a lot of natural gas, and they have been right about that. However, the large resulting supply of natural gas from this industrial-scaled drilling is more than the region can use. As a result, gas prices remain low, making drilling unprofitable in many cases, or keep profit margins very low in others.
The industry’s solution to this has been two-pronged. First, there is a massive effort underway to export the gas to other markets. Although there are already more than 2.5 million miles of natural gas pipelines in the United States, or more than 10 times the distance from the Earth to the Moon, it was apparently an insufficient network to achieve the desired outcome in commodity prices. The long list of recent and proposed pipeline projects, complete with information about their status, can be downloaded from the Energy Information Administration (Excel format).
The industry’s other grand effort is to create demand for natural gas liquids (NGLs, mostly ethane, propane, and butane) that accompanies the methane produced in the southwestern portion of the state. The centerpiece of this plan is the construction of multiple ethane crackers, such as the one currently being built in Beaver County by Royal Dutch Shell, for the creation of a new plastics industry in northern Appalachia. These sites will be massive consumers of NGLs which will have to be piped in through pressurized hazardous liquid routes, and would presumably serve to lock in production of unconventional gas in the region for decades to come.
Are regulators doing enough to help prevent these pipeline development problems?
In 2010, the Pipeline and Hazardous Materials Safety Administration (PHMSA) led the formation of an advisory group called Pipelines and Informed Planning Alliance (PIPA), comprised mostly of industry and various state and local officials. Appendix D of their report includes a long list of activities that should not occur in pipeline rights-of-way, from all-terrain vehicle use to orchards to water wells. These activities could impact the structural integrity of the pipeline or impede the operator’s ability to promptly respond to an incident and excavate the pipe.
However, we find this list to be decidedly one-directional. While the document states that these activities should be restricted in the vicinity of pipelines, it does not infer that pipelines shouldn’t be constructed where the activities already occur:
This table should not be interpreted as guidance for the construction of new pipelines amongst existing land uses as they may require different considerations or limitations. Managing land use activities is a challenge for all stakeholders. Land use activities can contribute to the occurrence of a transmission pipeline incident and expose those working or living near a transmission pipeline to harm should an incident occur.
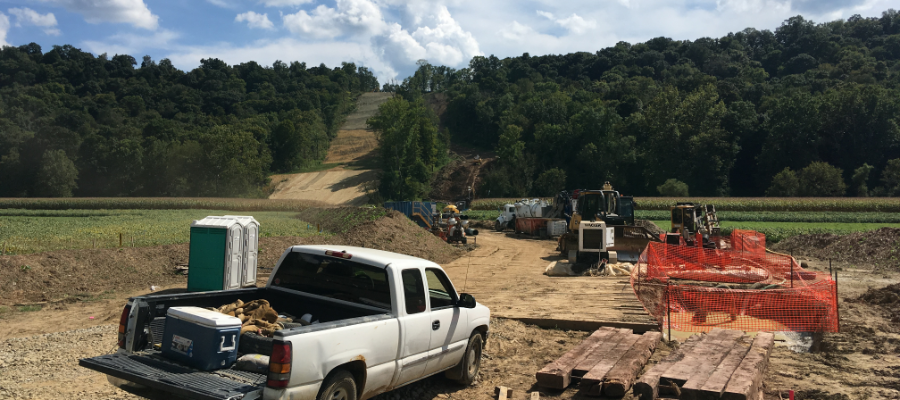
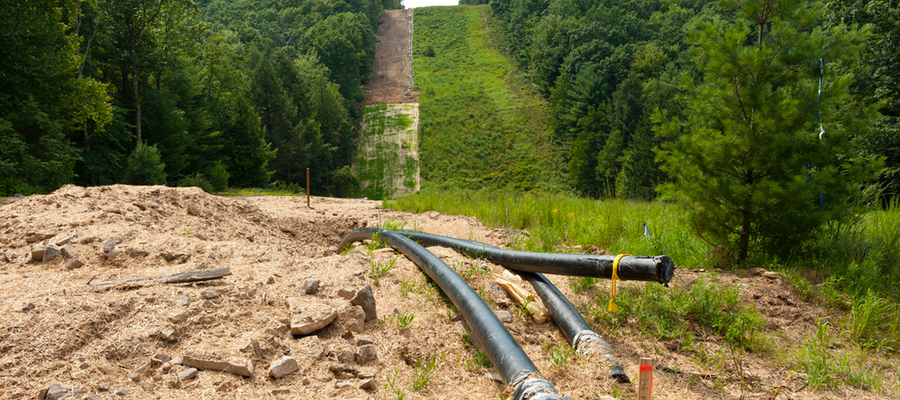
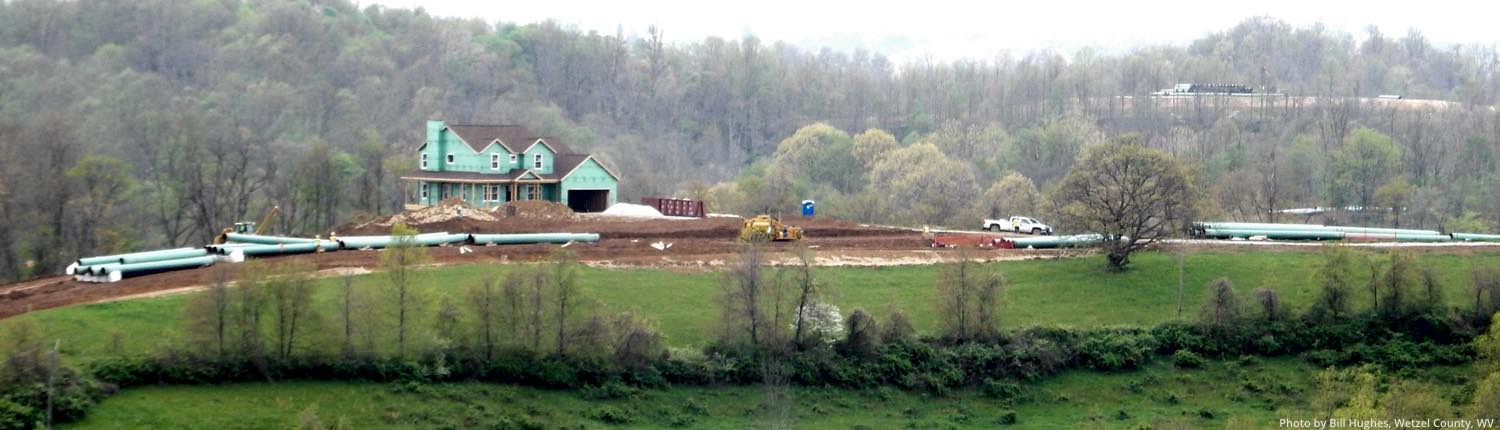
Pipeline being constructed near a home
While we understand the need to be flexible, and we certainly agree that every measure should be taken by those engaging in the dozens of use types listed in the PIPA report, it equally makes sense for the midstream industry to take its own advice, and refrain from building pipelines where these other land uses are already in place, as well. If a carport is disallowed because, “Access for transmission pipeline maintenance, inspection, and repair activities preclude this use,” then what possible excuse can there be to building pipelines adjacent to homes?
What distance is far enough away to escape catastrophic failure in the event of a pipeline fire or blast?
This chart shows varying hazard distances from natural gas pipelines, based on the pipe’s diameter and pressure. Source: Mark J. Stephens, A Model for Sizing High Consequence Areas Associated with Natural Gas Pipelines
It turns out that it depends pretty dramatically on the diameter and pressure of the pipe, as well as the nature of the hydrocarbon being transported. A 2000 report estimates that it could be as little as a 150-foot radius for low-pressure 6-inch pipes carrying methane, whereas a 42-inch pipe at 1,400 pounds per square inch (psi) could be a threat to structures more than 1,000 feet away on either side of the pipeline. There is no way that the general public, or even local officials, could know the hazard zone for something so variable.
While contacting Pennsylvania One Call before any excavation is required, many people may not consider a large portion of the other use cases outlined in the PIPA document to be a risk, and therefore may not know to contact One Call. To that end, we think that hazard placards would be useful, not just at the placement of the pipeline itself, but along its calculated hazard zone, so that residents are aware of the underlying risks.
Valve spacing
If there is an incident, it is obviously critical for operators to be able to respond as quickly as possible. In most cases, a part of this process will be shutting off the flow at the nearest upstream valve, thereby stopping the flow of the hydrocarbons to the atmosphere in the case of a leak, and cutting the source of fuel in the event of a fire. Speed is only one factor in ameliorating the problem, however, with the spacing between shutoff valves being another important component.
Comprehensive datasets on pipeline valves are difficult to come by, but in FracTracker’s deep dive into the Falcon ethane pipeline project, which is proposed to supply the Shell ethane cracker facility under construction Beaver County, we see that there are 18 shutoff valves planned for the 97.5 mile route, or one per every 5.4 miles of pipe. We also know that the Falcon will operate at a maximum pressure of 1,440 psi, and has pipe diameters ranging from 10 to 16 inches. The amount of ethane that could escape is considerable, even if Shell were able to shut the flow off at the valve instantly. It stands to reason that more shutoff valves would serve to lessen the impact of releases or the severity of fires and explosions, by reducing the flow of fuel to impacted area.
Conclusion
Groups promoting the oil and gas industry like to speak of natural gas development as clean and safe, but unless we are comparing the industry to something else that is dirtier or more dangerous, these words are really just used to provoke an emotional response. Even governmental agencies like PHMSA are using the rhetoric.
PHMSA’s mission is to protect people and the environment by advancing the safe transportation of energy and other hazardous materials that are essential to our daily lives.
If the safe transportation of hazardous materials sounds oxymoronic, it should. Oil and gas, and related processed hydrocarbons, are inherently dangerous and polluting.
Report
Events
Fatalities
Injuries
Explosions
Evacuees
Total Damages
Gas Distribution
29
8
19
12
778
$6,769,061
Gas Transmission / Gathering
30
0
2
2
292
$51,048,027
Hazardous Liquids
49
0
0
1
48
$9,115,036
Grand Total
108
8
21
15
1,118
$66,932,124
Impacts of pipeline incidents in Pennsylvania from January 1, 2010 through July 13, 2018. National totals for the same time include 5,308 incidents resulting 125 fatalities, 550 injuries, 283 explosions, and nearly $4 billion in property damage.
Current investments in large-scale transmission pipelines and those facilitating massive petrochemical facilities like ethane crackers are designed to lock Pennsylvania into decades of exposure to this hazardous industry, which will not only adversely the environment and the people who live here, but keep us stuck on old technology. Innovations in renewable energy such as solar and wind will continue, and Pennsylvania’s impressive research and manufacturing capacity could make us well positioned to be a leader of that energy transformation. But Pennsylvania needs to make that decision, and cease being champions of an industry that is hurting us.
Industry, not deterred by resistance from regulators and environmentalists, has developed a new work-around method to get their product to market. Rather than build pipelines across rugged, remote, or highly-populated terrain, a new “solution” called “virtual pipelines” has come on the scene, with roots in New England in 2011.
The term “virtual pipeline,” itself, is so new that it is trademarked by Xpress Natural Gas (XNG), Boston, MA. XNG and other virtual pipeline companies use specially-designed tanker trucks to move compressed natural gas (CNG) or liquefied natural gas (LNG) via our public roads and highways. CNG in this system is under very high pressure — up to 3,600 psi when tank trailers are full. Rail and barge shipments are also considered part of the system, and trailers are designed to be easily loaded onto train cars or boats.
For the gas industry, virtual pipelines can be used in locales where gas is only needed for a limited time period, the pipeline network is not developed, or opposition by landowners is too contentious to make eminent domain an option, among other issues.
Restricted only by permissible weight limits on roads (up to 80,000 pounds or more), 5-axle trucks may make in excess of 100 round trips a day from the fueling location to their destination — sometimes hundreds of miles away. These trucks, which may travel alone or in caravans, are identifiable by the hazard class 2.1 placard they carry: 1971, indicative of flammable, compressed natural gas or methane. Manufacturers of these virtual pipeline rigs tout the safety considerations that go into their engineered design. These considerations include special pressure monitoring for the dozens of tanks and super-strength materials to protect against ruptures.
Specialized equipment has been created to load compressed gas tanks into the trailers that will carry them to their destinations. Here’s a promotional video from Quantum:
Loading CNG into specialized trailers for transport
Impacts on Communities
Following New York State’s rejection of the Constitution Pipeline in 2016 based on water quality concerns, industry has been looking for ways to move natural gas from Pennsylvania’s Marcellus gas fields to the Iroquois Pipeline. The current strategy is to load the gas in canisters from a special compressor facility, and re-inject the gas to a pipeline at the journey’s endpoint. The extent to which virtual pipelines may be utilized in New York State and New England is not well known, but the natural gas industry does speak in sanguine terms about this strategy as a solution to many of its transportation issues.
Citizen blogger/activist Bill Huston has compiled a list accidents that have occurred with CNG transport trucks along the virtual pipeline that runs from a “mother station” at Forest Lake, PA to Manheim, NY, near the Iroquois pipeline. While there have been no explosions or loss of life as a result of these accidents, there are a number of reported incidents of trucks tipping or rolling over, sliding off the road, or spontaneously venting.
To move CNG from “Point A” to “Point B,” truck traffic through populated areas is unavoidable. In central New York, public outcry about virtual pipelines is rising, due in large part to the safety issues associated with increased truck traffic on state highways. In rural New York, state highways run through towns, villages, and cities. They are not separated from population centers in the way that interstate highways typically are. Traffic from CNG transport trucks clogs roadways, in some cases burdening the pass-through communities with 100 or more tractor trailers a day. Routes pass directly in front of schools and health care facilities.
In short, virtual pipelines present a public safety hazard that has yet to be addressed.
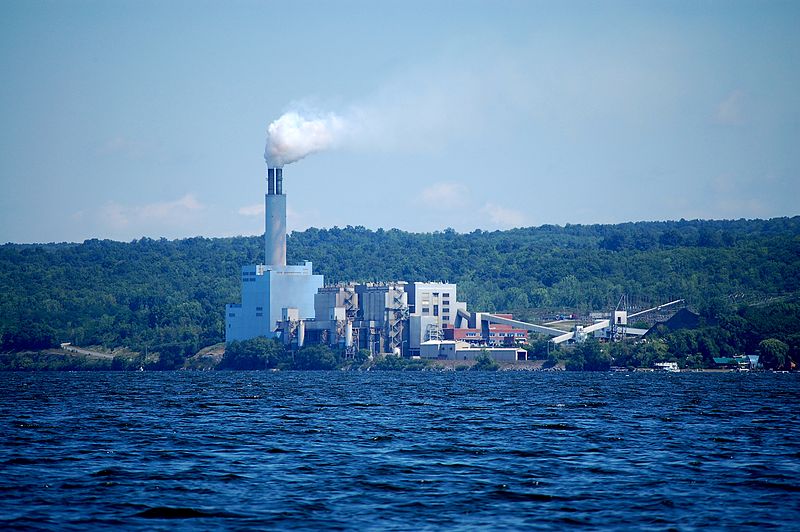
Virtual Pipelines and the Cayuga Power Plant
In Lansing, NY, there is an inefficient and economically-beleaguered power plant, currently run on coal, that the power utility would prefer to see shut down. The Cayuga Power Plant was cited in 2016 for exceeding mercury emissions by nearly 2000%. Its inherently inefficient design makes it a significant greenhouse gas contributor. Years ago, it provided considerable tax benefits to its host community of Lansing, and as such has some lingering support. After both a devastating fire in one stack and mechanical failure in another, the plant has been barely running for the past 3 or 4 years. It is currently used as a “peaker plant“, operating only during periods of excessive demand on the electric grid, during summer months.
New York State’s Governor, Andrew Cuomo, has stated that all coal-power plants will be shut down by 2020.
Cayuga Power Plant in Lansing, NY.
Nonetheless, the plant owners are pushing to re-power the Cayuga Power Plant with natural gas. Currently, however, there is no pipeline to deliver the gas to the plant. Without support by the public nor the Public Service Commission for the construction of a supply pipeline, Cayuga Power Plant has revealed they plan to receive gas deliveries via truck.
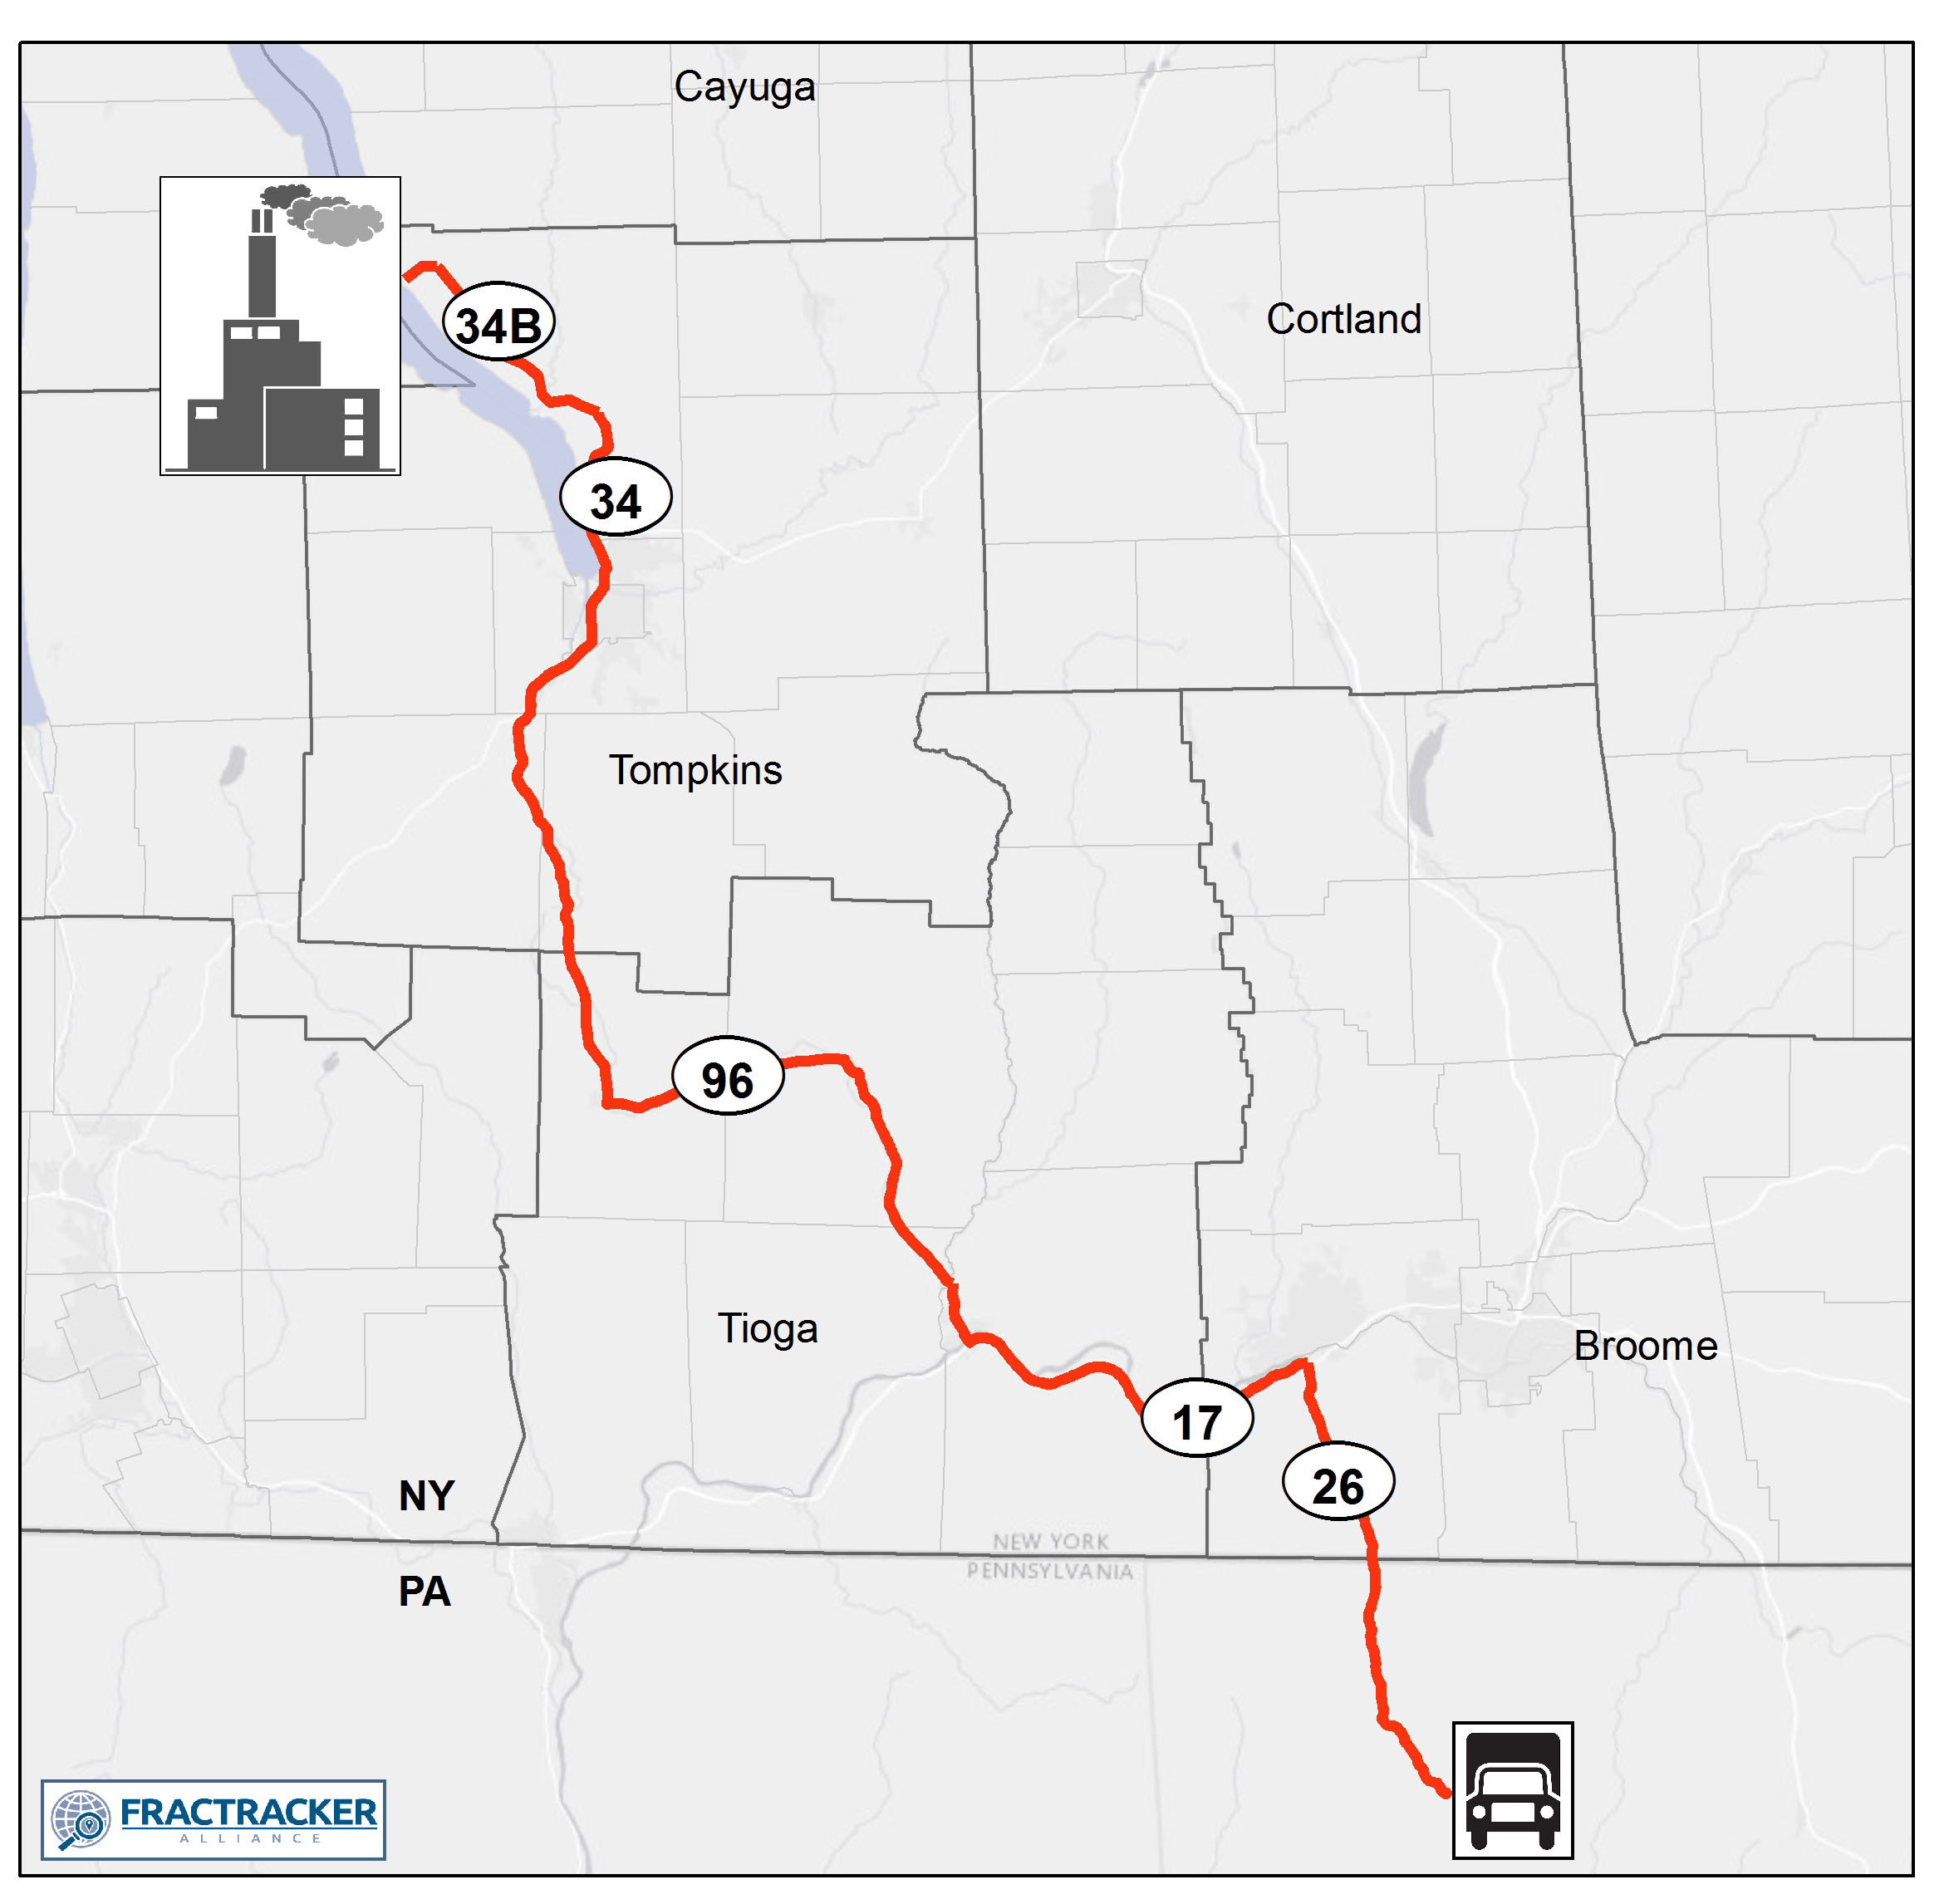
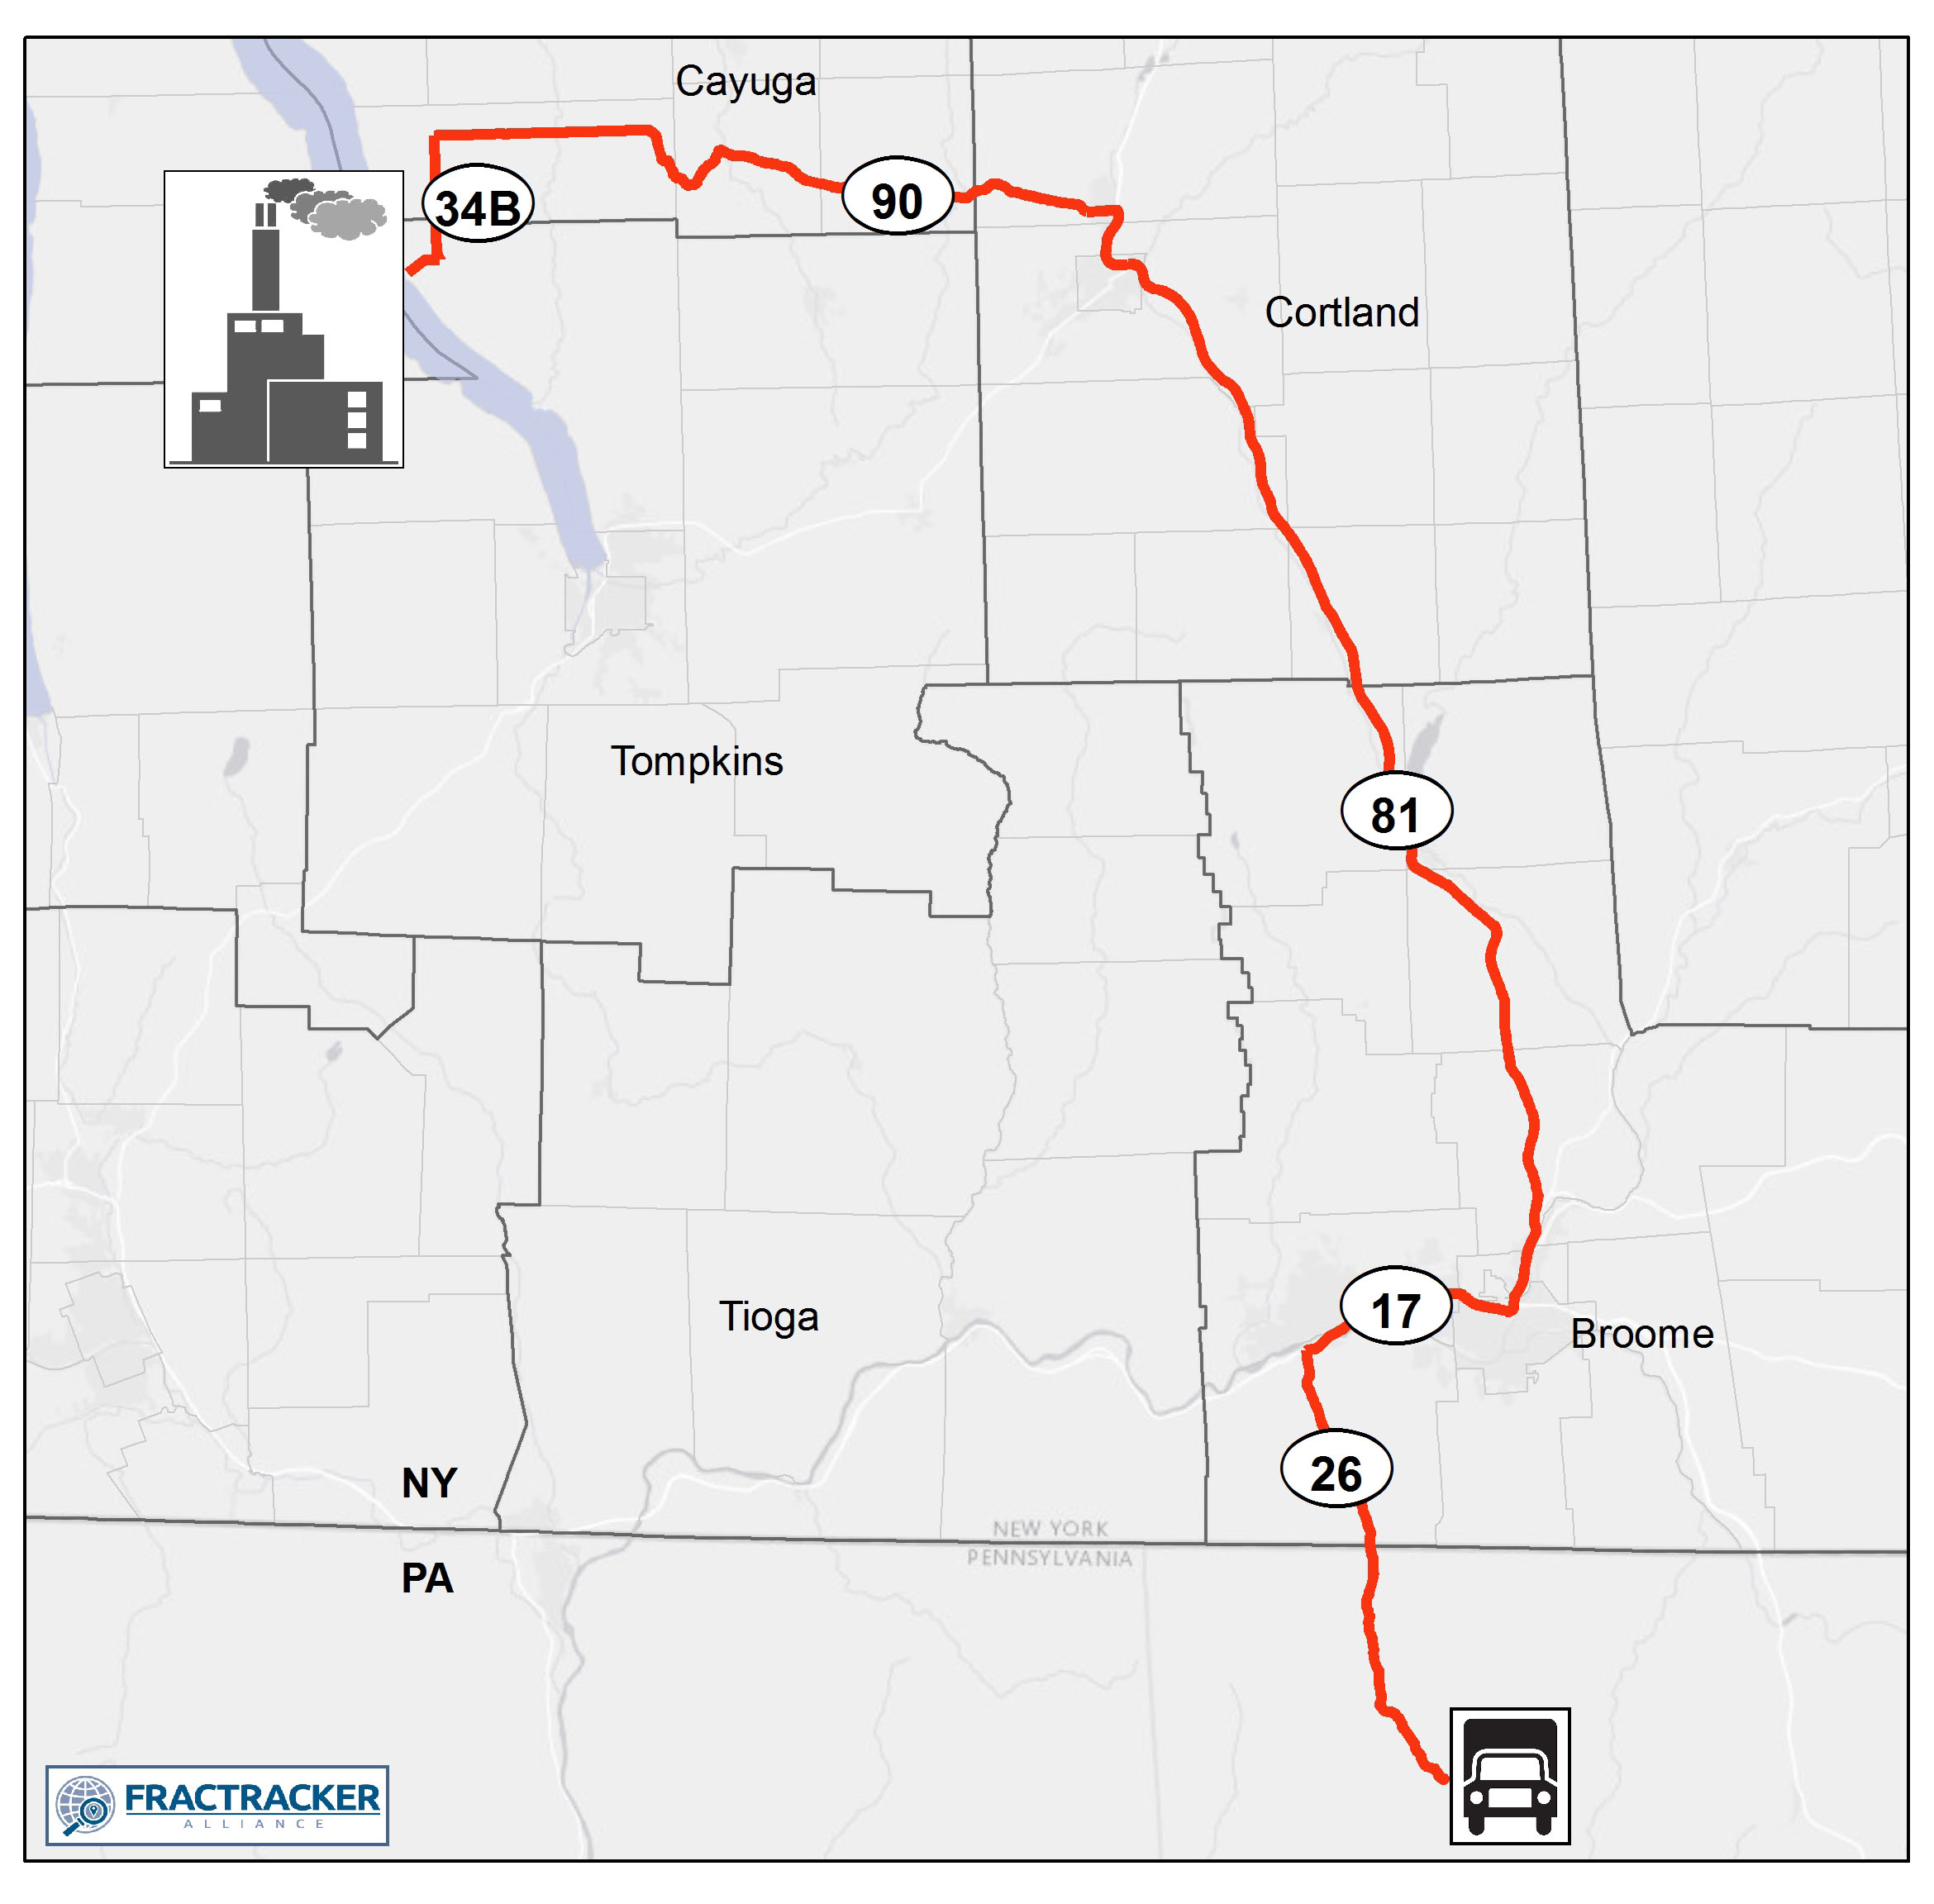
Scenario Maps
FracTracker has modeled the five most likely scenarios that would take compressed natural gas from a loading station in northern Pennsylvania to the Cayuga Power Plant in Lansing. All of the scenarios bring the trucks through populated communities, in dangerous proximity to high-risk facilities where both human safety and evacuations are problematic. The routes also pass through intersections and road stretches that have some of the highest accident rates in the area.
Route 1
Route 1: This route passes within a half mile of homes of 36,669 people in the Villages of Lansing, Candor, Spencer, Owego; Towns of Ithaca, Lansing, Newfield, Danby, Candor, Spencer, Tioga, Owego, Vestal; and the City of Ithaca. Within the half-mile evacuation zone of this route, should there be an accident, are:
17 health care facilities
20 day care centers
4 private school
21 public schools
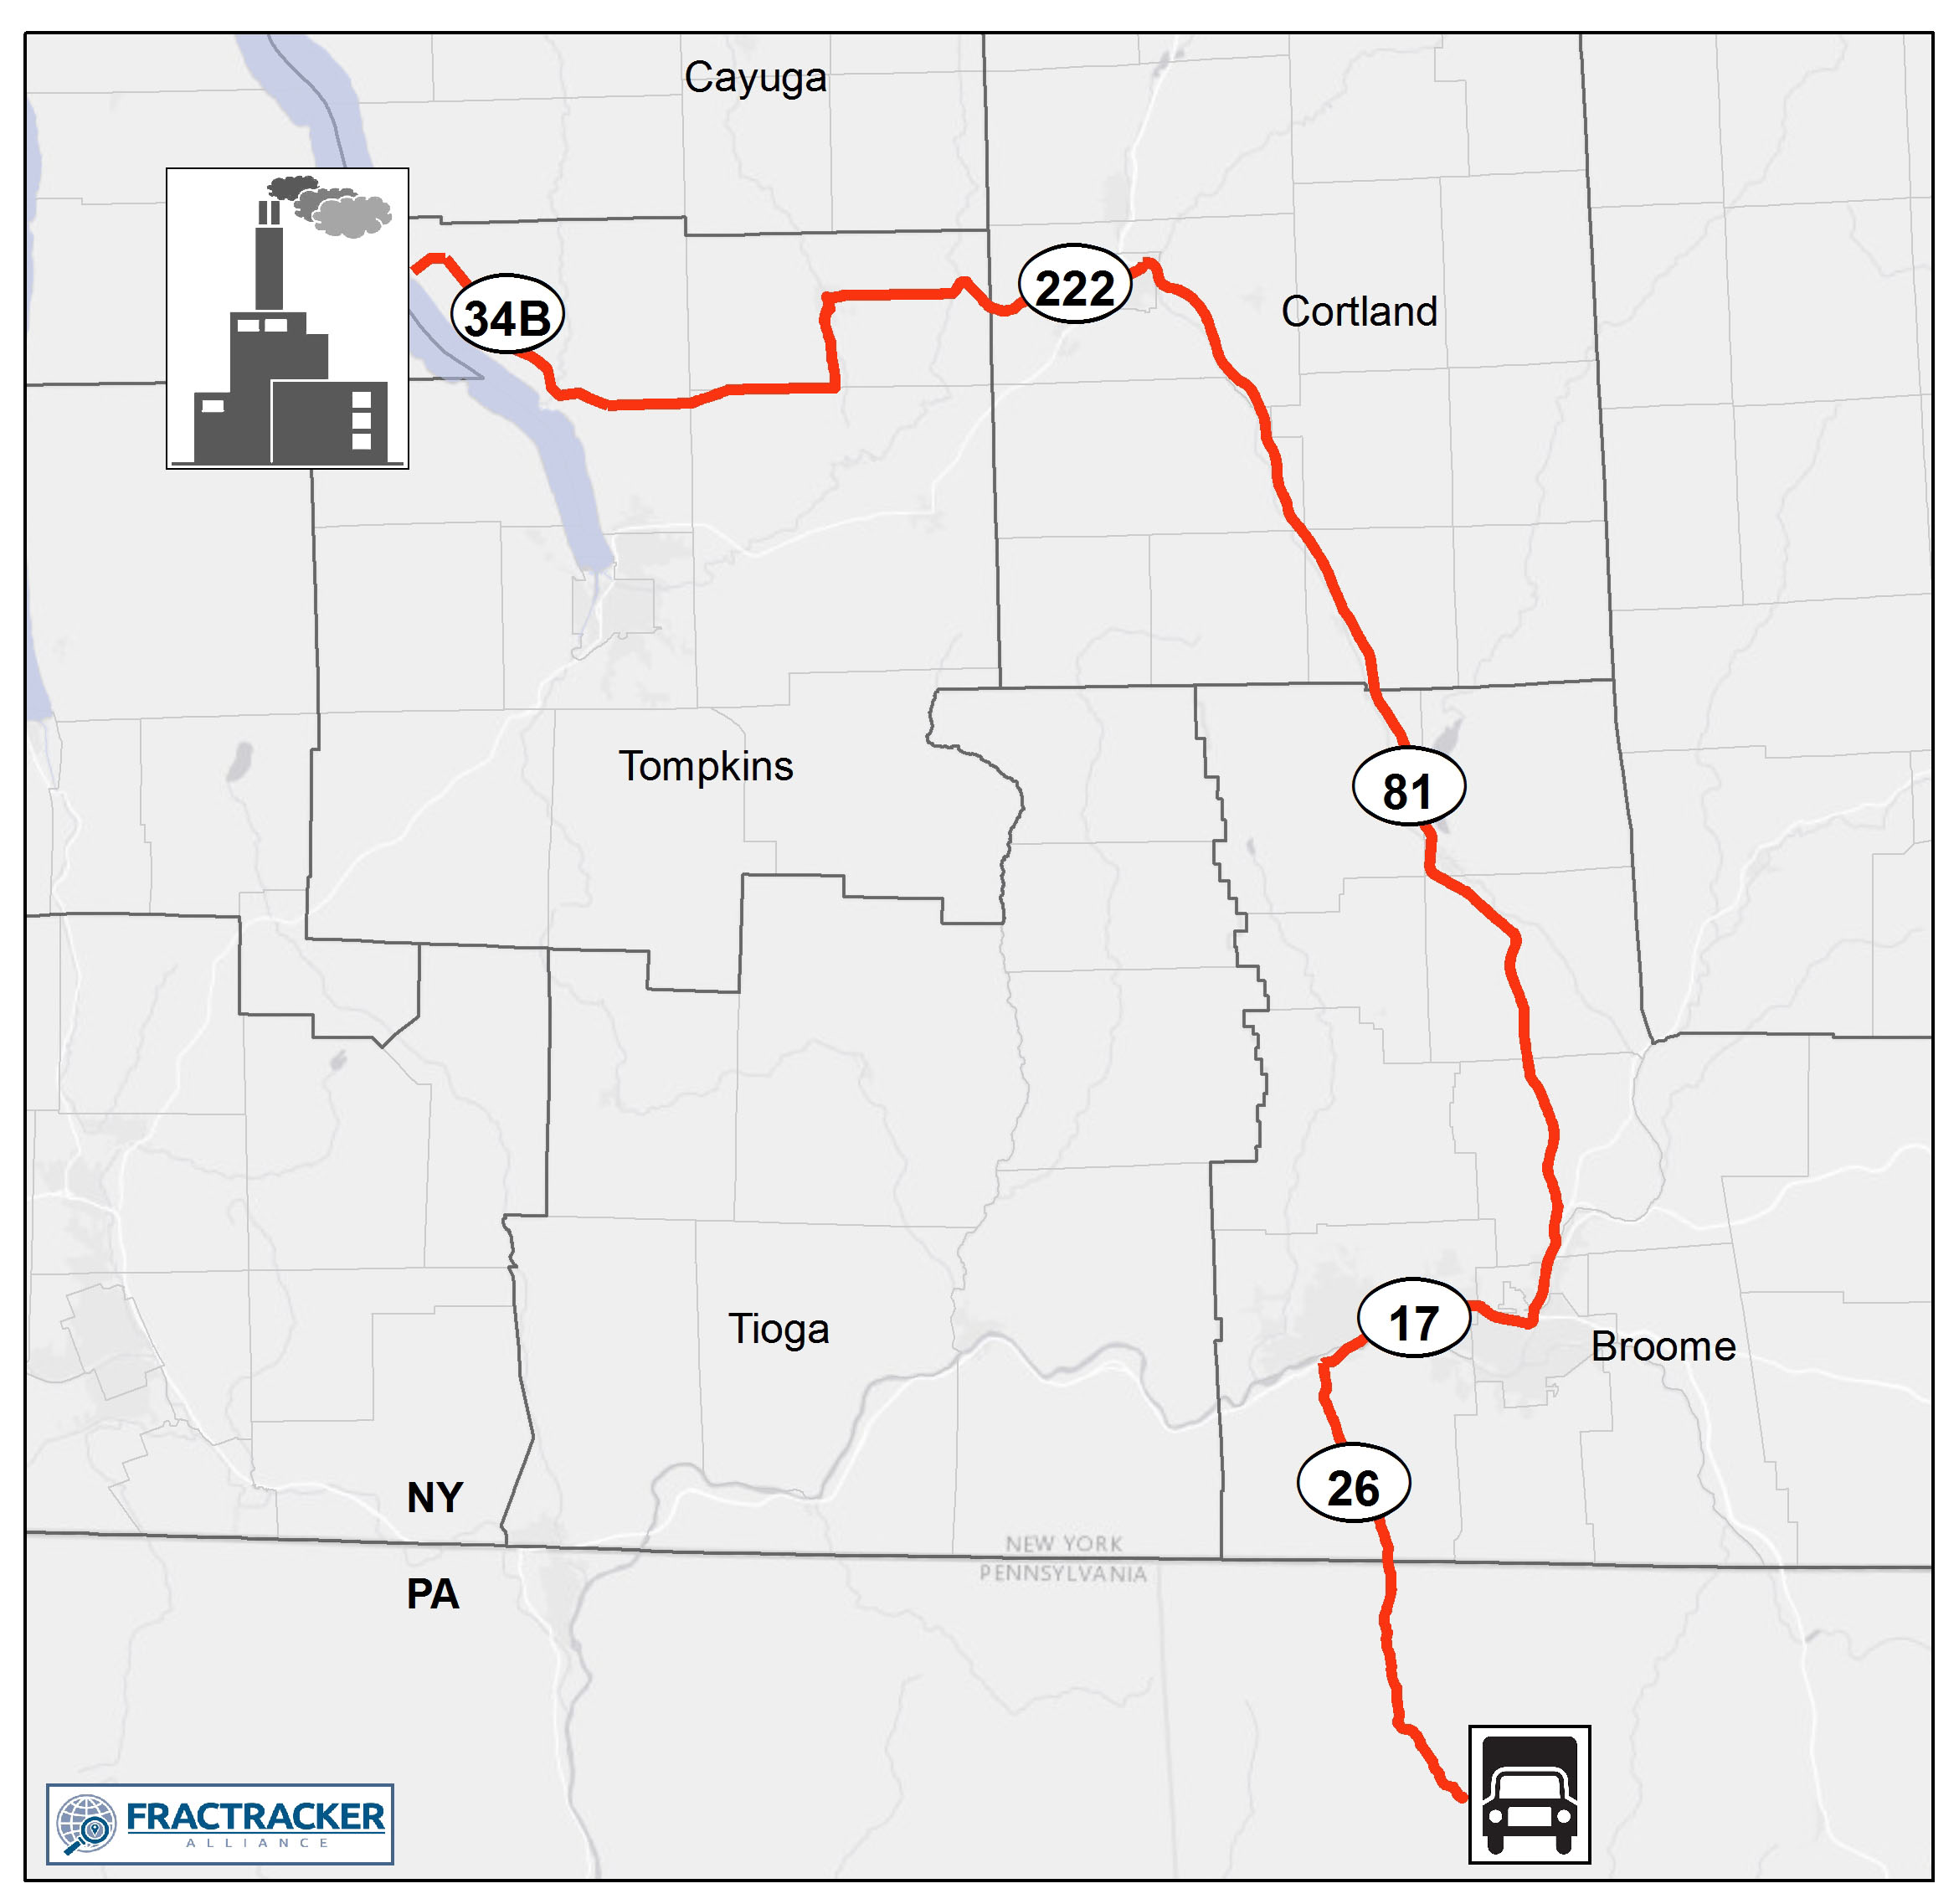
Route 2
Route 2: This route passes within a half mile of homes of 54,182 people in the Villages of Groton, Marathon, Whitney Point, Johnson City; Towns of Lansing, Dryden, Cortlandville, Groton, Virgil, Lapeer, Marathon, Lisle, Triangle, Barker, Chenango, Dickinson, Union, Vestal; and Cities of Cortland and Binghamton. Within the half-mile evacuation zone of this route, should there be an accident, are:
31 health care facilities
37 day care centers
3 private school
19 public schools
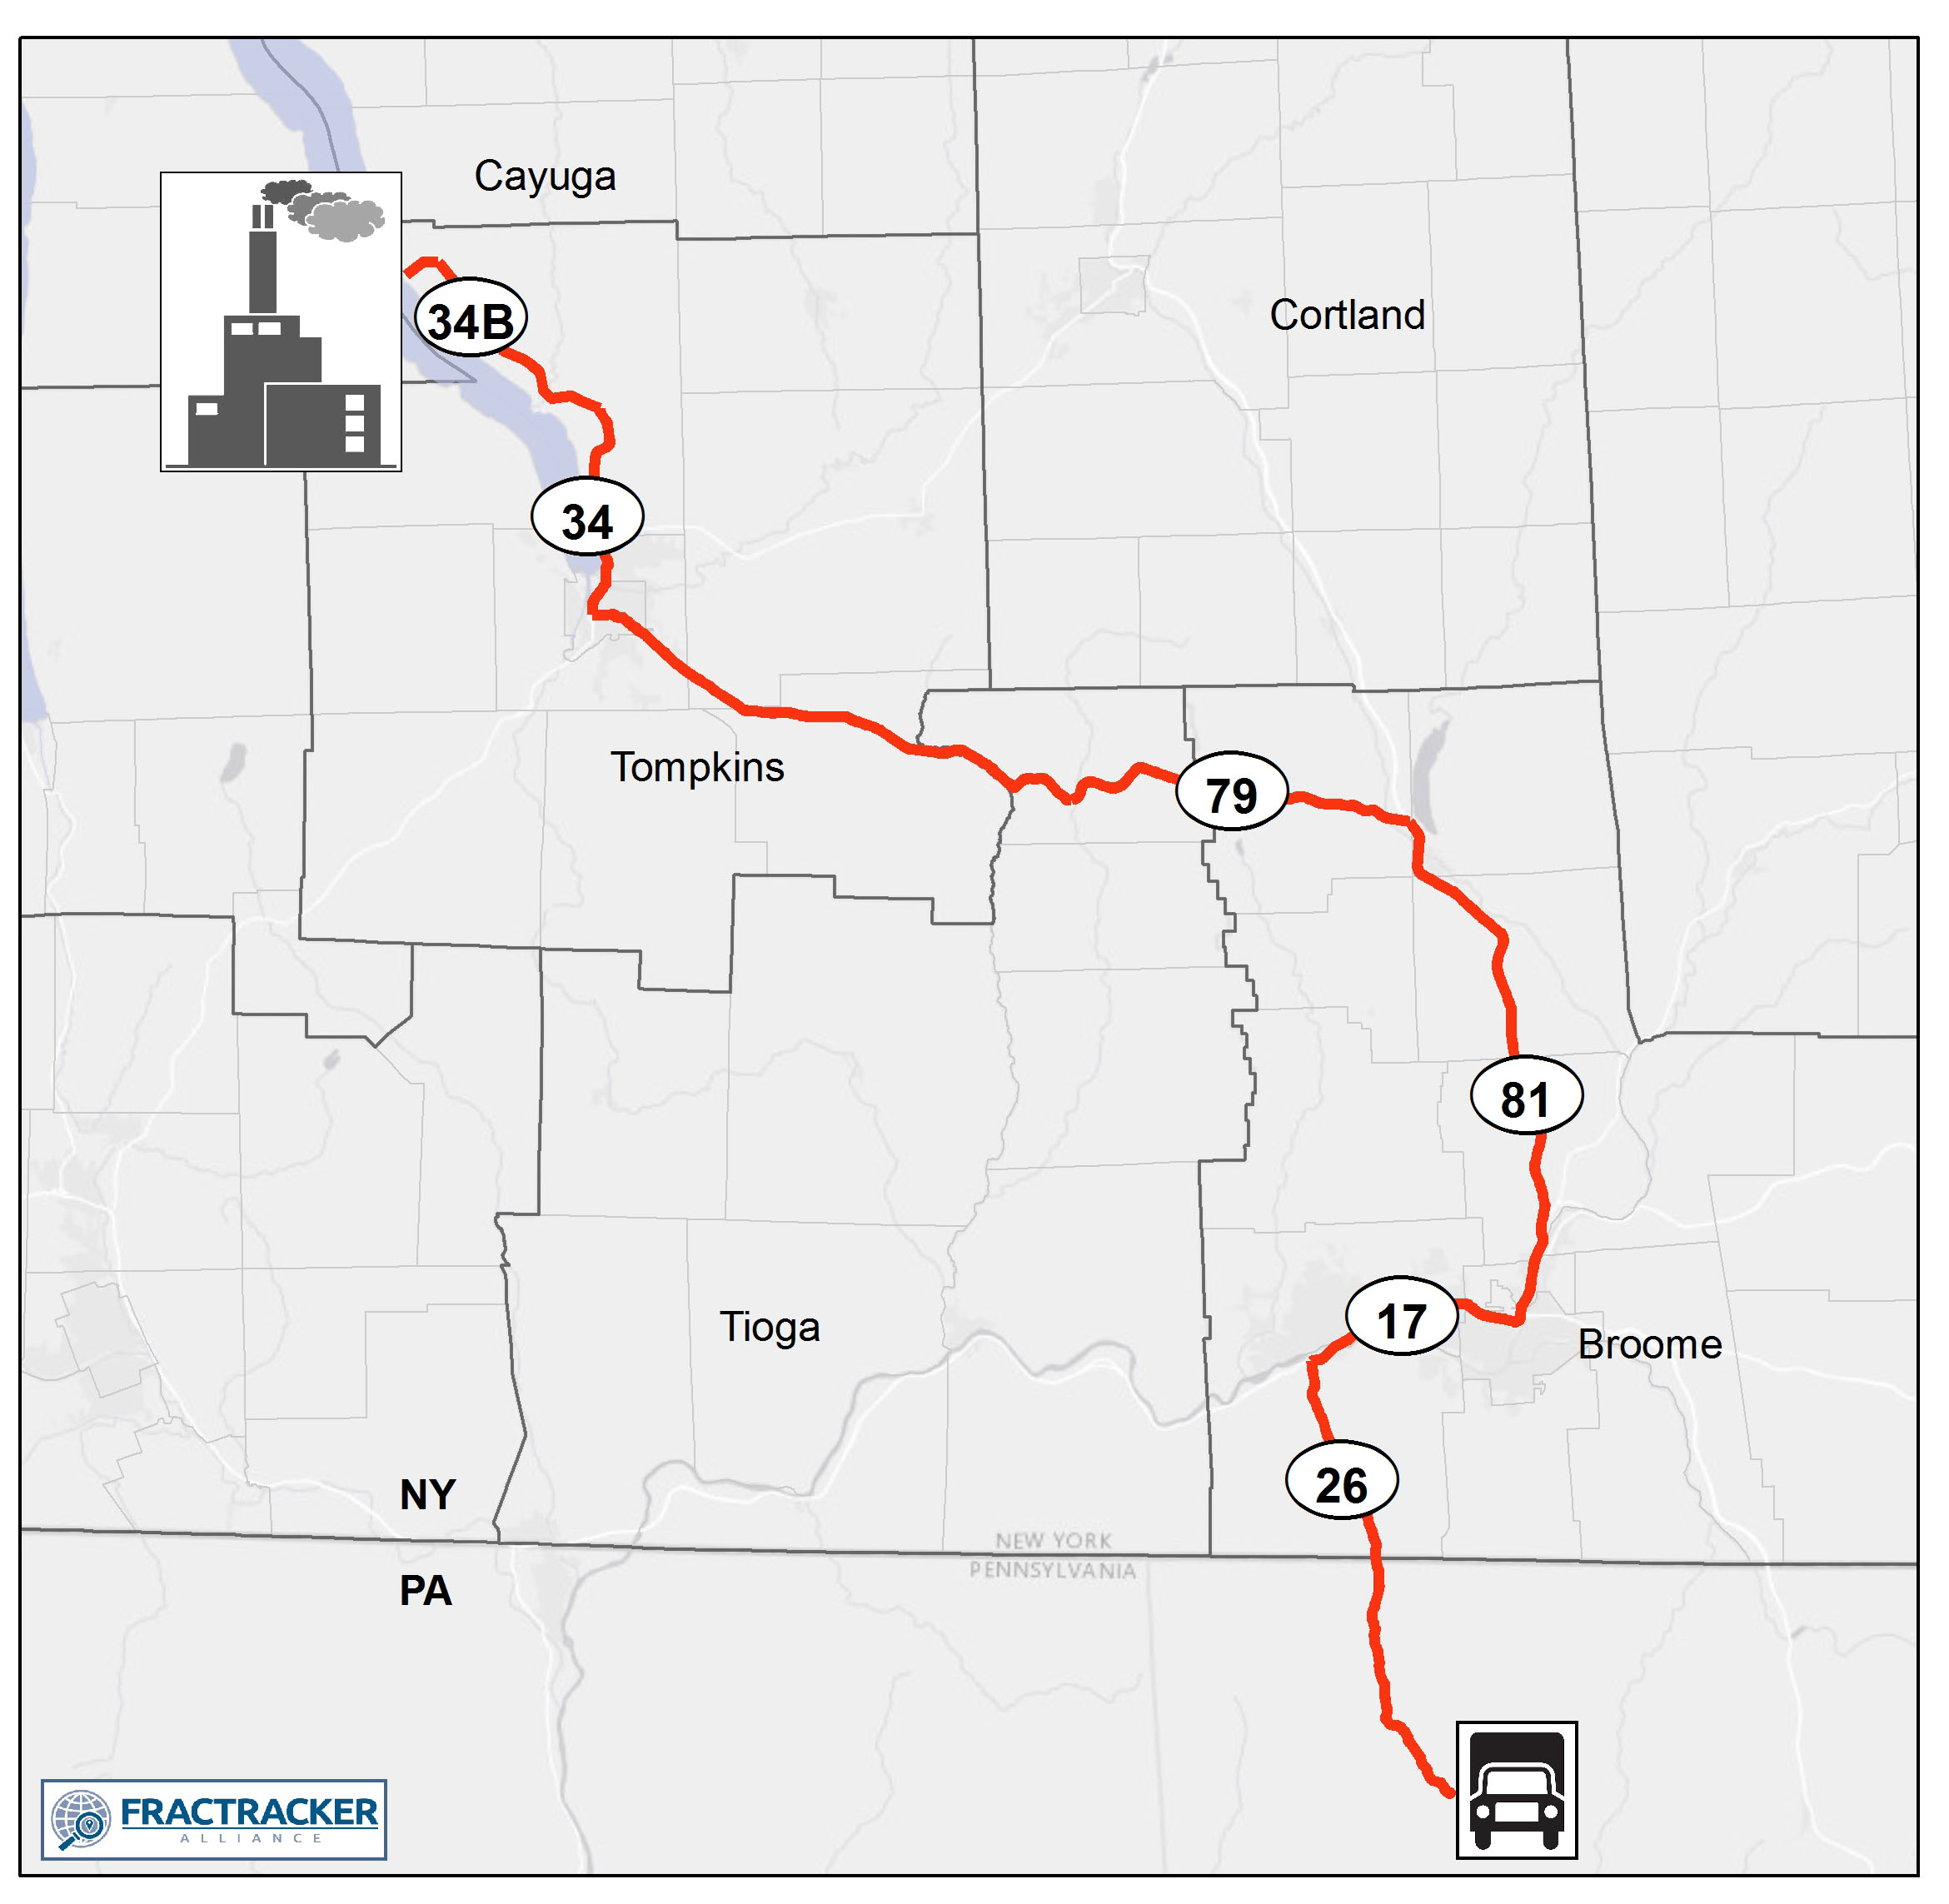
Route 3
Route 3: This route passes within a half mile of homes of 39,638 people in the Villages of Dryden, Lisle, Whitney Point, Johnson City; Towns of Lansing, Dryden, Groton, Harford, Richford, Lisle, Triangle, Barker, Chenango, Dickinson, Union, Vestal; and the City of Binghamton. Within the half-mile evacuation zone of this route, should there be an accident, are:
17 health care facilities
23 day care centers
1 private school
14 public schools
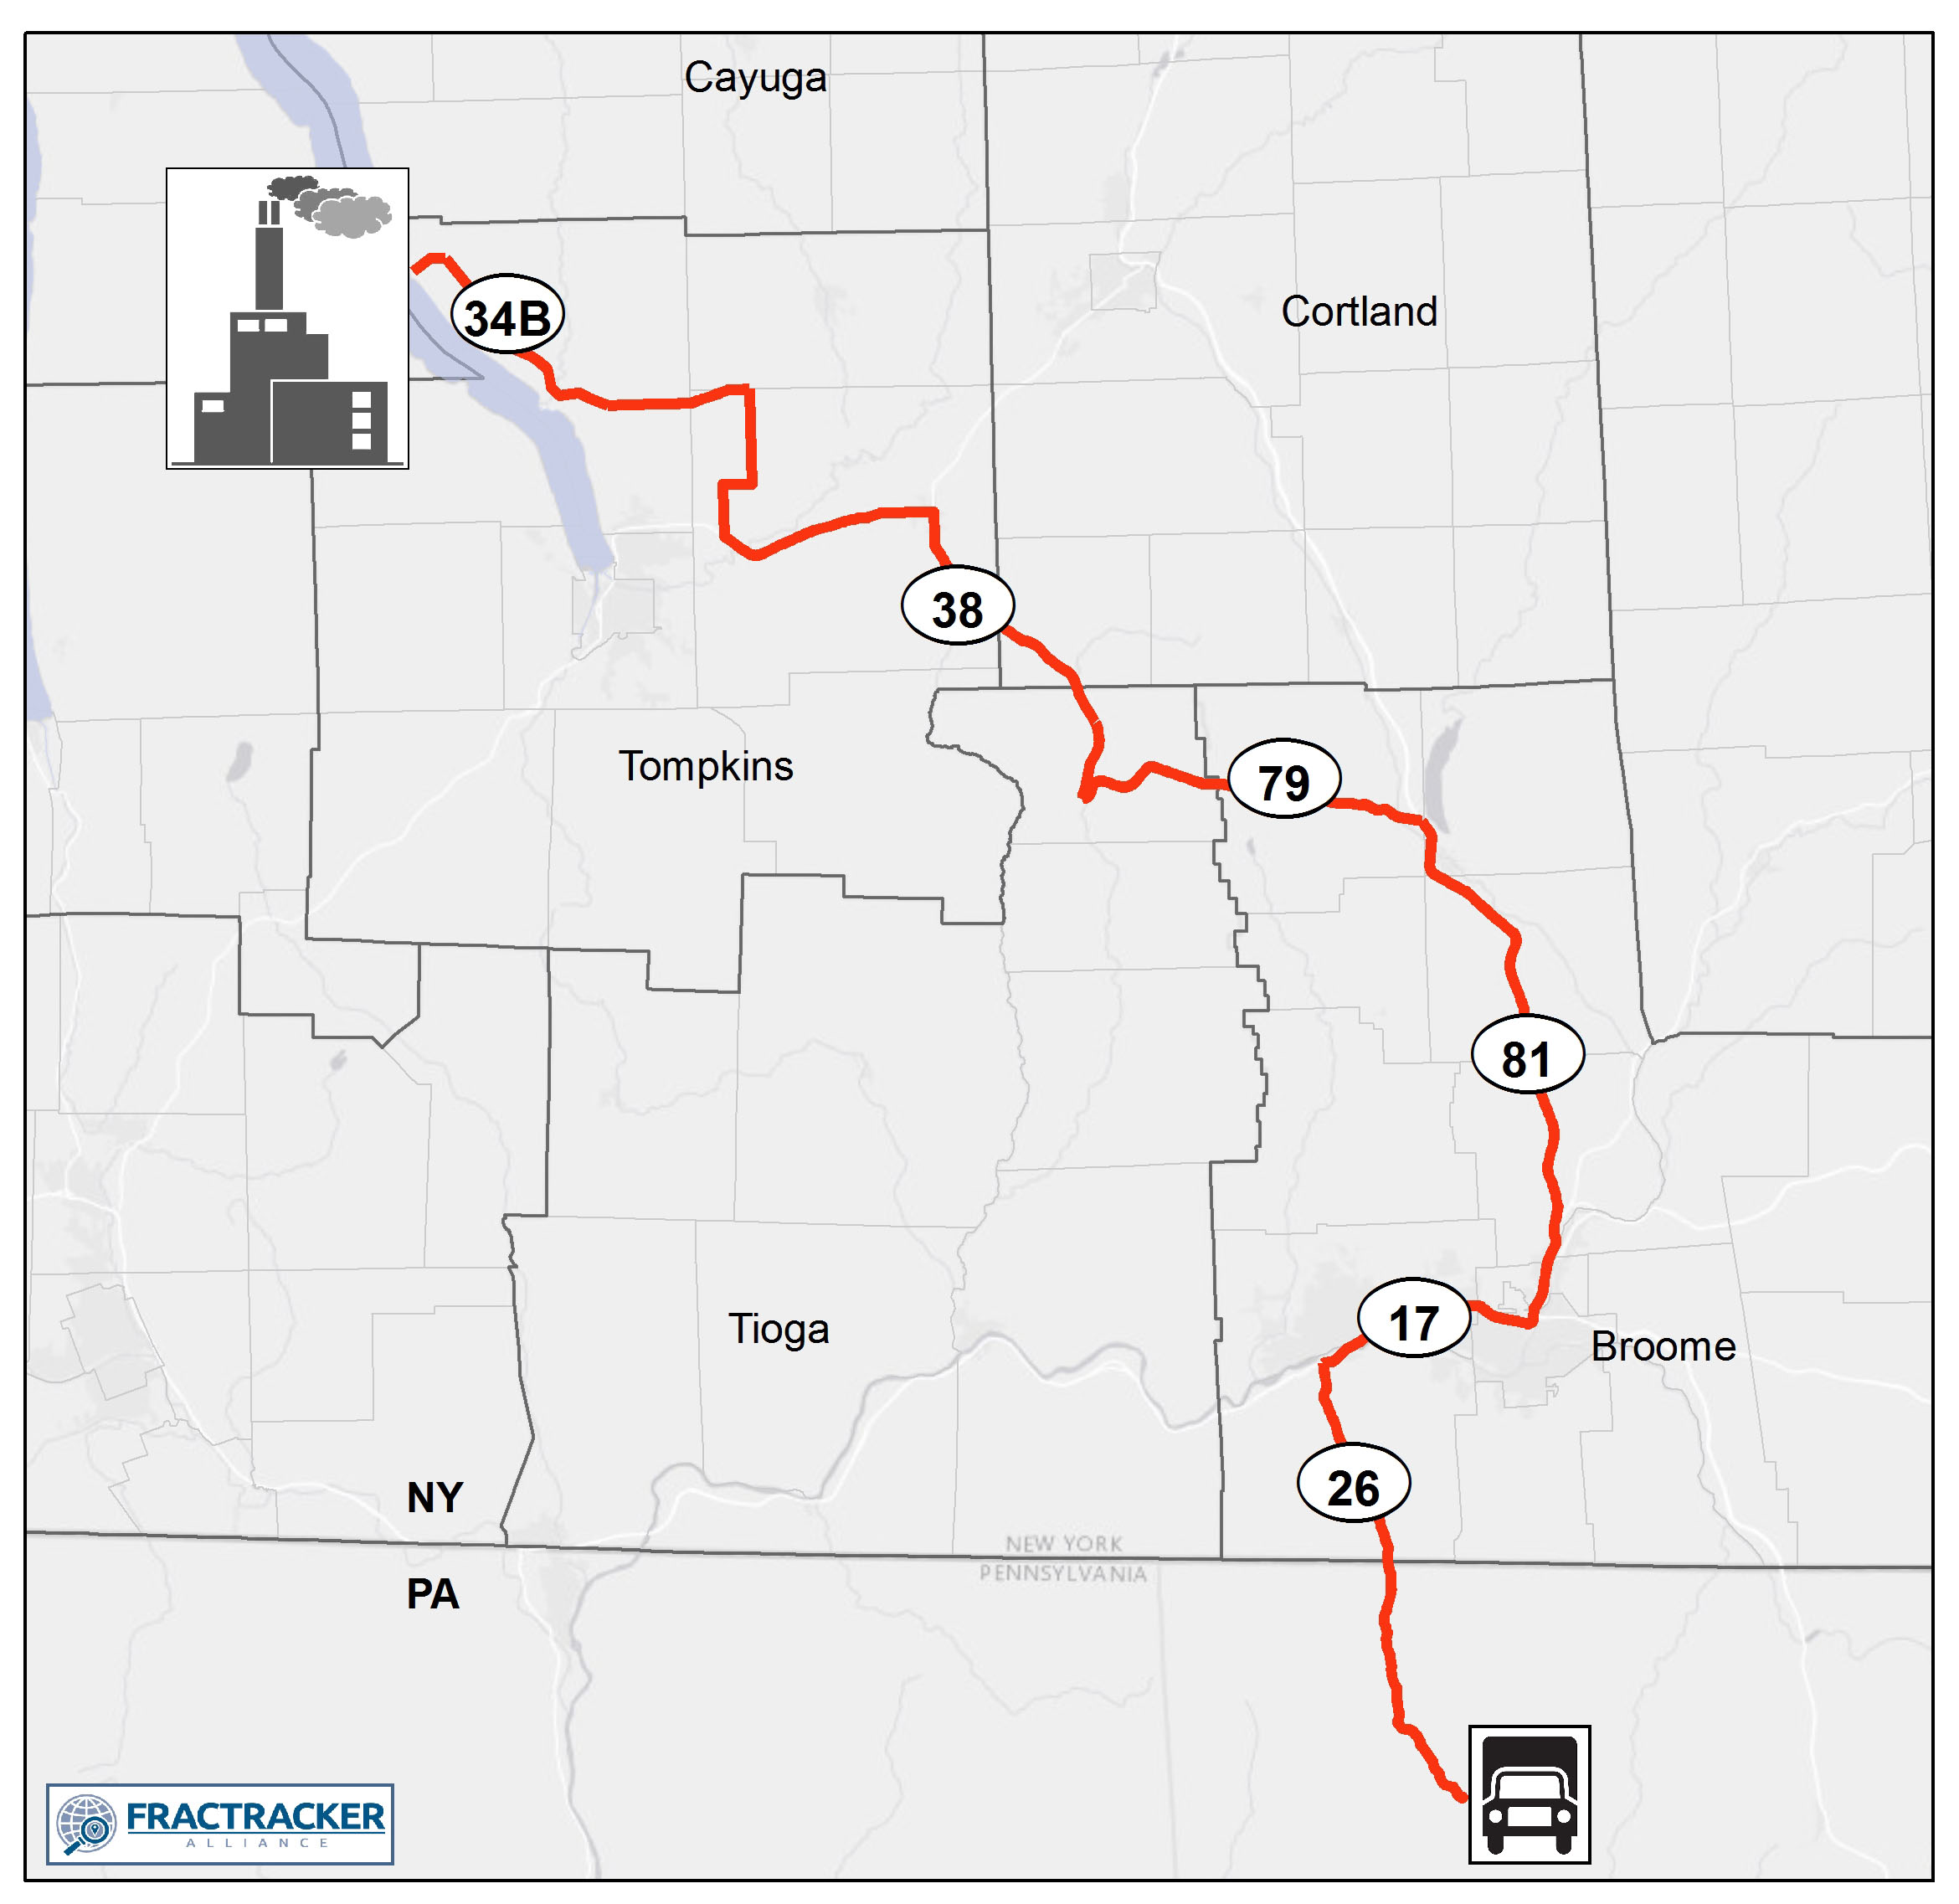
Route 4
Route 4: This route passes within a half mile of homes of 44,804 people in the Villages of Homer, Marathon, Whitney Point, Johnson City; Towns of Lansing, Summerhill, Locke, Genoa, Homer, Cortlandville, Virgil, Lapeer, Marathon, Lisle, Triangle, Barker, Chenango, Dickinson, Union, Vestal; and Cities of Cortland and Binghamton. Within the half-mile evacuation zone of this route, should there be an accident, are:
24 health care facilities
31 day care centers
2 private school
15 public schools
Route 5
Route 5: This route passes within a half mile of homes of 59,731 people in the Villages of Lansing, Lisle, Whitney Point, Johnson City; Towns of Lansing, Dryden, Ithaca, Caroline, Richford, Lisle, Triangle, Barker, Chenango, Dickinson, Union, Vestal; and Cities of Ithaca and Binghamton. Within the half-mile evacuation zone of this route, should there be an accident, are:
26 health care facilities
37 day care centers
3 private school
21 public schools
Click on the tabs in the box above to explore the five potential truck routes with maps.
Interactive Map
For a full interactive map of the potential routes for CNG delivery to the Cayuga Power Plant, and the schools, health care facilities, etc. within a half-mile evacuation zone of the routes, view the interactive map below.
Despite the apparent convenience that virtual pipelines present for the fossil fuel industry, they are not the solution the future energy supply needs. Yes, they present an alternative to pipeline transportation — but they also play a disastrous role in continuing our descent into climate chaos caused by increasing greenhouse gas concentrations in the atmosphere.
Methane leakage is an unavoidable component of the entire life cycle of natural gas usage — from “cradle to grave” — or more precisely, from the moment a well is drilled to when the gas is combusted by its end-user. And methane, as a greenhouse gas, is up to 100 times more potent than carbon dioxide. The Intergovernmental Panel on Climate Change’s (IPCC) recent report (see summary here) is unflinching in its clarion call for immediate, and extreme, cut-backs in greenhouse gas production. If we choose not to heed this call, much of humanity’s future survival is called into question.
By Karen Edelstein, Eastern Program Coordinator, FracTracker Alliance
More of the details about the Cayuga Power Plant will be explained in the upcoming weeks in a related guest blog by environmental activist and organizer, Irene Weiser, of Tompkins County, NY.
https://www.fractracker.org/a5ej20sjfwe/wp-content/uploads/2018/10/VirtualPipelines-Feature-Map.png400900Karen Edelsteinhttps://www.fractracker.org/a5ej20sjfwe/wp-content/uploads/2025/09/2025-Wordmark-Logo.pngKaren Edelstein2018-10-30 15:49:512021-04-15 14:57:33Virtual pipelines: Convenient for Industry, a Burden on Communities
 Photo by Ted Auch, FracTracker Alliance