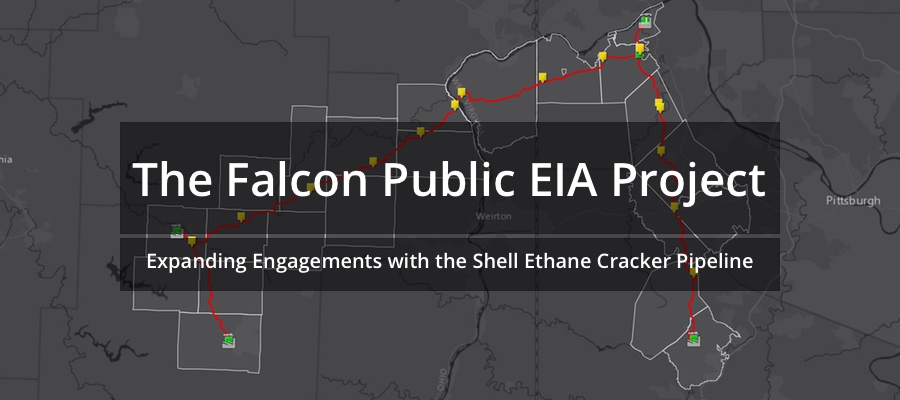
The Falcon: Water Crossings & Hazards
Part of the Falcon Public EIA Project
In this section of the Falcon Public EIA Project, we explore the hydrological and geological conditions of the pipeline’s construction areas. We first identify the many streams, wetlands, and ponds the Falcon must cross, as well as describe techniques Shell will likely use in these water crossings. The second segment of this section highlights how the areas in the Falcon’s path are known for their complex geological features, such as porous karst limestone and shallow water tables that can complicate construction.
Quick Falcon Facts
Map of Falcon water crossings and hazards
The following map will serve as our guide in breaking down the Falcon’s risks to water bodies. Expand the map full-screen to explore its contents in greater depth. Some layers only become visible as you zoom in. A number of additional features of the map are not shown by default, but can be turned on in the “layers” tab. These include information on geological features, water tables, soil erosion characteristics, as well as drinking reservoir boundaries. Click the “details” tab in full-screen mode to read how the different layers were created.
View Map Fullscreen | How FracTracker Maps Work
Defining Water Bodies
The parts of Pennsylvania, West Virginia, and Ohio where the Falcon pipeline will be built lie within the Ohio River Basin. This landscape contains thousands of streams, wetlands, and lakes, making it one of the most water rich regions in the United States. Pipeline operators are required to identify waters likely to be impacted by their project. This two-step process involves first mapping out waters provided by the U.S. Geological Survey’s national hydrological dataset. Detailed field surveys are then conducted in order to locate additional waters that may not yet be accounted for. Many of the streams and wetlands we see in our backyards are not represented in the national dataset because conditions can change on the ground over time. Yet, plans for crossing these must also be present in pipeline operator’s permit applications.
Streams
Streams (and rivers) have three general classifications. “Perennial” streams flow year-round, are typically supplied by smaller up-stream headwaters, and are supplemented by groundwater. In a sense, the Ohio River would be the ultimate perennial stream of the region as all smaller and larger streams eventually end up there. “Intermittent” streams flow for only a portion of the year and are dry at times, such as during the summer when water tables are low. Finally, “ephemeral” streams flow only during precipitation events.
These classifications are important because they can determine the extent of aquatic habitat that streams can support. Working in streams that have no dry period can put aquatic lifeforms at elevated risk. For this and other reasons, many states further designate streams based on their aquatic life “use” and water quality. In Pennsylvania, for instance, the PA DEP uses the designations: Warm Water Fishes (WWF), Trout Stocked (TSF), Cold Water Fisheries (CWF) and Migratory Fishes (MF). Streams with exceptional water quality may receive an additional designation of High Quality Waters (HQ) and Exceptional Value Waters (EV).
Wetlands
Similar to streams, wetlands also have unique designations. These are based on the U.S. Fish and Wildlife Services’ national wetlands inventory. Wetlands are generally defined as “lands transitional between terrestrial and aquatic systems where the water table is usually at or near the surface or the land is covered by shallow water.” As such, wetlands are categorized by their location (such as a tidal estuary or an inland wetland that lacks flowing water), its substrate (bedrock, sand, etc.), and plant life that might be present. While there are hundreds of such categories, only four pertain to the wetlands present in the regions where the Falcon pipeline will be built. Their designations roughly translate to the following:
- Palustrine Emergent (PEM): Marshes and wet meadows hosting perennial small trees, shrubs, mosses, or lichens
- Palustrine Shrub (PSS): Similar to PEMs, but characterized by also having well-established shrubs
- Palustrine Forested (PFO): Similar to PEMs and PSSs, but having trees larger than 6 meters high
- Palustrine Unconsolidated Bottom (PUB) and Palustrine Opem Water (POW) (aka ponds)
Pipeline operators are required to report the crossing length of each wetland they will encounter, as well as the area of permanent and temporary disturbance that would occur in each of these wetlands. When building the pipeline, operators are required to ensure that all measures are taken to protect wetlands by minimizing impacts to plant life, as well as by taking “upland protective measures” to prevent sedimentation runoff during precipitation events. When undergoing FERC EIA scrutiny, operators are also required to limit the width of wetland construction areas to 75 feet or less.
Crossing Methods
Open-Cut Trenching
Pipeline operators use a variety of methods when crossing streams, wetlands, and ponds. Shorter length crossings often employ a rudimentary trench. After the cuts, construction crews attempts to repair damage done in the process of laying the pipeline. For longer crossings, operators can use boring techniques to go underneath water features.

There are two general types of trenches. The first, “open-cut” crossings, are typically used for smaller waterbodies, such as in intermittent streams where flow may not be present during time of construction, or when construction can be completed in a short period of time (typically 24-48 hours). In this process, a trench is laid through the water body without other provisions in place.
The second type, “dry-ditch” crossing, are required by FERC for waterbodies up to 30 feet wide “that are state-designated as either coldwater or significant coolwater or warmwater fisheries, or federally-designated as critical habitat.” In these spaces, pumps are used to transfer stream flow around the area where trenching occurs. In places where sensitive species are present, dry-ditches must include a flume to allow these species to pass through the work area.
Conventional Boring
Conventional boring consists of creating a tunnel for the pipeline to be installed below roads, waterbodies, and other sensitive resources. Bore pits are excavated on either sides of the site. A boring machine is then used to tunnel under the resource and the pipeline is pushed through the bore hole.
Horizontal Directional Drilling
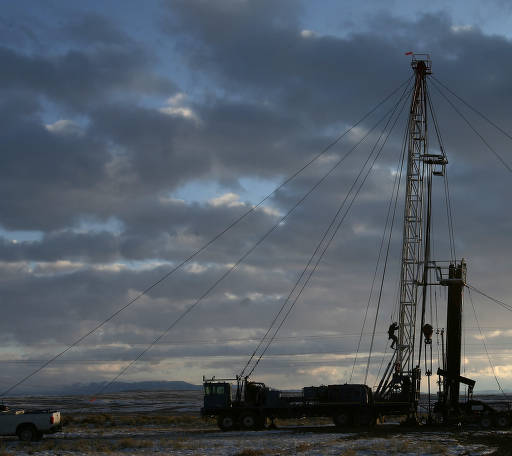
In more difficult or lengthy crossings, operators may choose to bore under a water feature, road, or neighborhood. Horizontal directional drilling (HDD) involves constructing large staging areas on either side of the crossing. A large drill bit is piloted through the ground along with thousands of gallons of water and bentonite clay for lubricant (commonly referred to as drilling muds). HDDs are designed to protect sensitive areas, but operators prefer not to use them as HDDs can be expensive and require in-depth planning in order for things to go well.

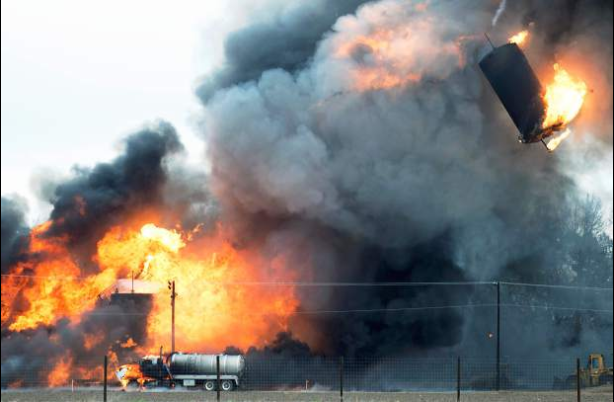
An example of what happens when things are rushed can be seen in Sunoco’s Mariner East 2 pipeline. The PA DEP has cited Sunoco for over 130 inadvertent returns (accidental releases of drilling muds) since construction began. These spills led to damaged water wells and heavy sedimentation in protected streams, as exemplified in the image above. Making matters worse, Sunoco later violated terms of a settlement that required them to re-survey before recommencing construction. See FracTracker’s article on these spills.
Footprint of the Falcon
The overwhelming majority of Falcon’s water body crossings will be executed with either open-cut or dry-ditch methods. There are 40 locations where conventional boring will be used, but only a 3 are used for crossing water resources. Shell intends to use 19 HDDs and, of these, only 13 are used for crossing water bodies of some kind (the longest of which crosses the Ohio River). All other conventional and HDD boring locations will be used to cross under roads and built structures. This is not entirely unusual for pipelines. However, we noted a number of locations where one would expect to see HDDs but did not, such as in the headwaters of the Ambridge and Tappen Reservoirs, as was seen in the images above.
Stream Impacts
Shell identified and/or surveyed a total of 993 stream sections in planning for the Falcon’s construction. As shown on FracTracker’s map, the pipeline’s workspace and access roads will directly intersect 319 of these streams with the following classifications: perennial (96), ephemeral (79), and intermittent (114). An additional 361 streams are located only 500ft from construction areas.
A number of these streams have special designations assigned by state agencies. For instance, in Pennsylvania, we found 10 stream segments listed as Trout Stocked (TS), which are shown on our interactive map.

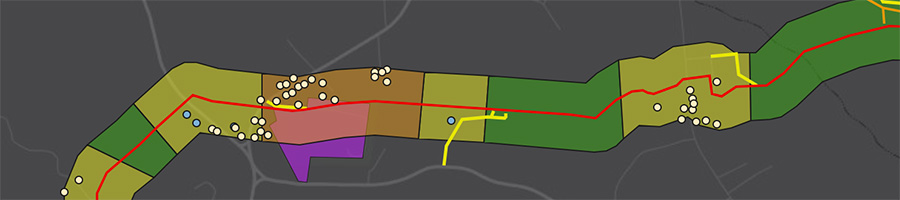
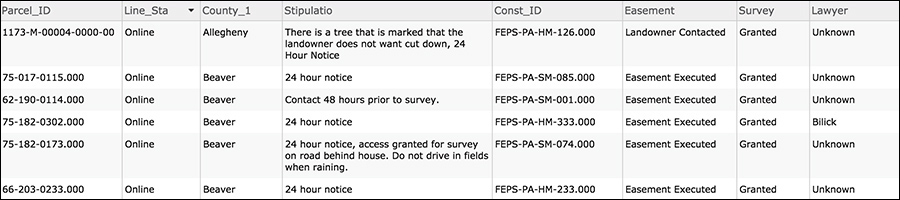
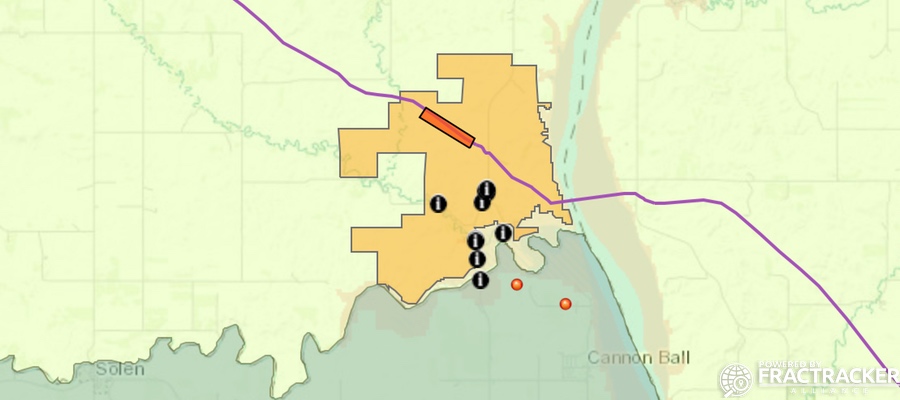
![]() Perhaps more concerning, the Falcon will cross tributaries to the Service Creek watershed 13 times. These feed into three High Quality Cold Water Fishes (HQ/CWF) headwater streams of the Ambridge Reservoir in Beaver County, PA, shown in the image above. They also support the endangered Southern Redbelly Dace (discussed in greater depth here). On the eastern edge of the watershed, the Falcon will cross the raw water line leading out of the reservoir.
Perhaps more concerning, the Falcon will cross tributaries to the Service Creek watershed 13 times. These feed into three High Quality Cold Water Fishes (HQ/CWF) headwater streams of the Ambridge Reservoir in Beaver County, PA, shown in the image above. They also support the endangered Southern Redbelly Dace (discussed in greater depth here). On the eastern edge of the watershed, the Falcon will cross the raw water line leading out of the reservoir.
The reservoir supplies 6.5 million gallons of water a day to five townships in Beaver County (Ambridge, Baden, Economy, Harmony, and New Sewickley) and four townships in Allegheny County (Leet, Leetsdale, Bell Acres & Edgeworth). This includes drinking water services to 30,000 people.
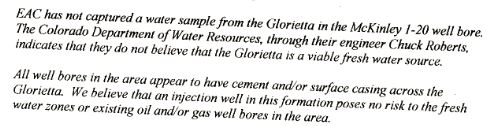
We found a similar concern in Ohio where the Falcon will cross protected headwaters in the Tappan Reservoir watershed at six different locations. The Tappan is the primary drinking water source for residents in Scio. Below is a page from Shell’s permit applications to the PA DEP outlining the crossing of one of the Ambridge Reservoir’s CWF/HQ headwater streams.
Wetland Impacts
Shell identified a total of 682 wetland features relevant to Falcon’s construction, as well as 6 ponds. Of these, the pipeline’s workspace and access roads will directly intersect 174 wetlands with the following classifications: PEM (141), PSS (13), PFO (7), PUB (10), POW (3). An additional 470 of these wetlands, plus the 6 ponds, are located only 500ft from construction areas.
Example 1: Lower Raccoon Creek
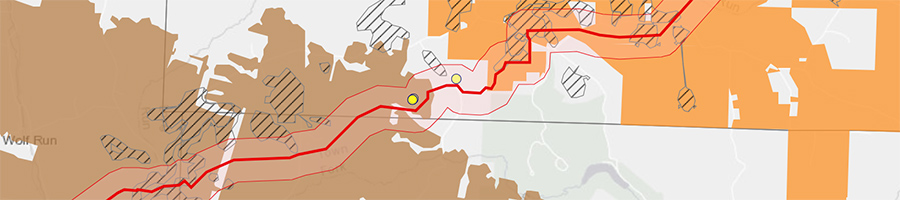
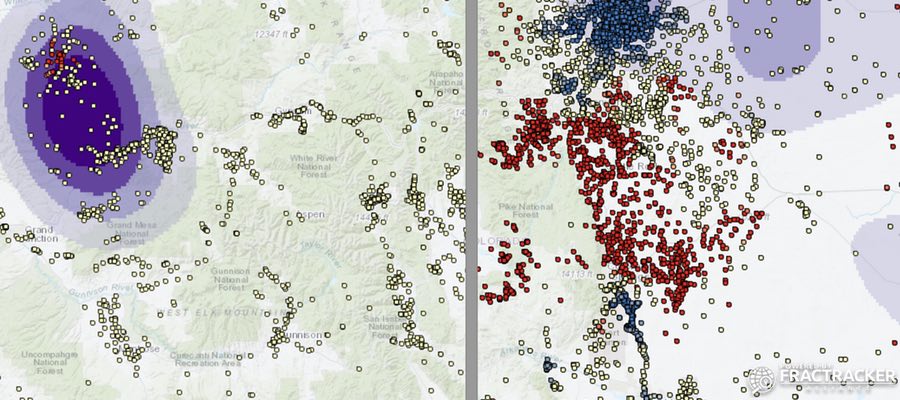
A few wetland locations stand out as problematic in Shell’s construction plans. For instance, wetlands that drain into Raccoon Creek in Beaver County will be particularly vulnerable in two locations. The first is in Potter Township, where the Falcon will run along a wooded ridge populated by half a dozen perennial and intermittent streams that lead directly to a wetland of approximately 14 acres in size, seen below. Complicating erosion control further, Shell’s survey data shows that this ridge is susceptible to landslides, shown in the first map below in dotted red.

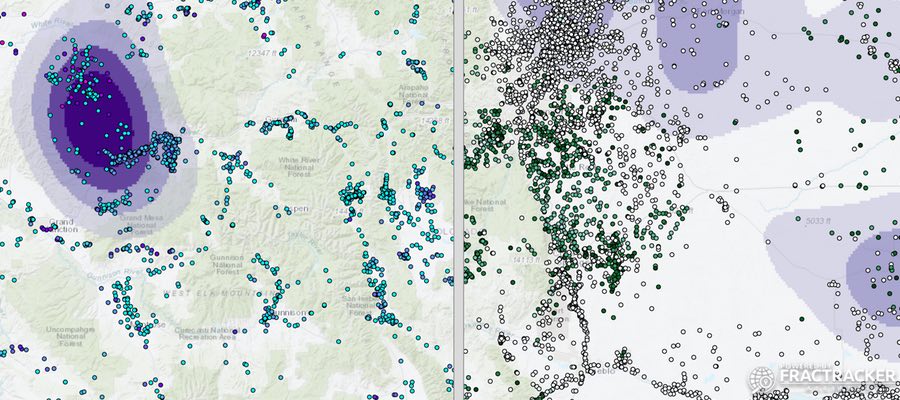
This area is also characterized by the USGS as having a “high hazard” area for soil erosion, as seen in this second image. Shell’s engineers referenced this soil data in selecting their route. The erosion hazard status within 1/4 mile of the Falcon is a layer on our map and can be activated in the full-screen version.

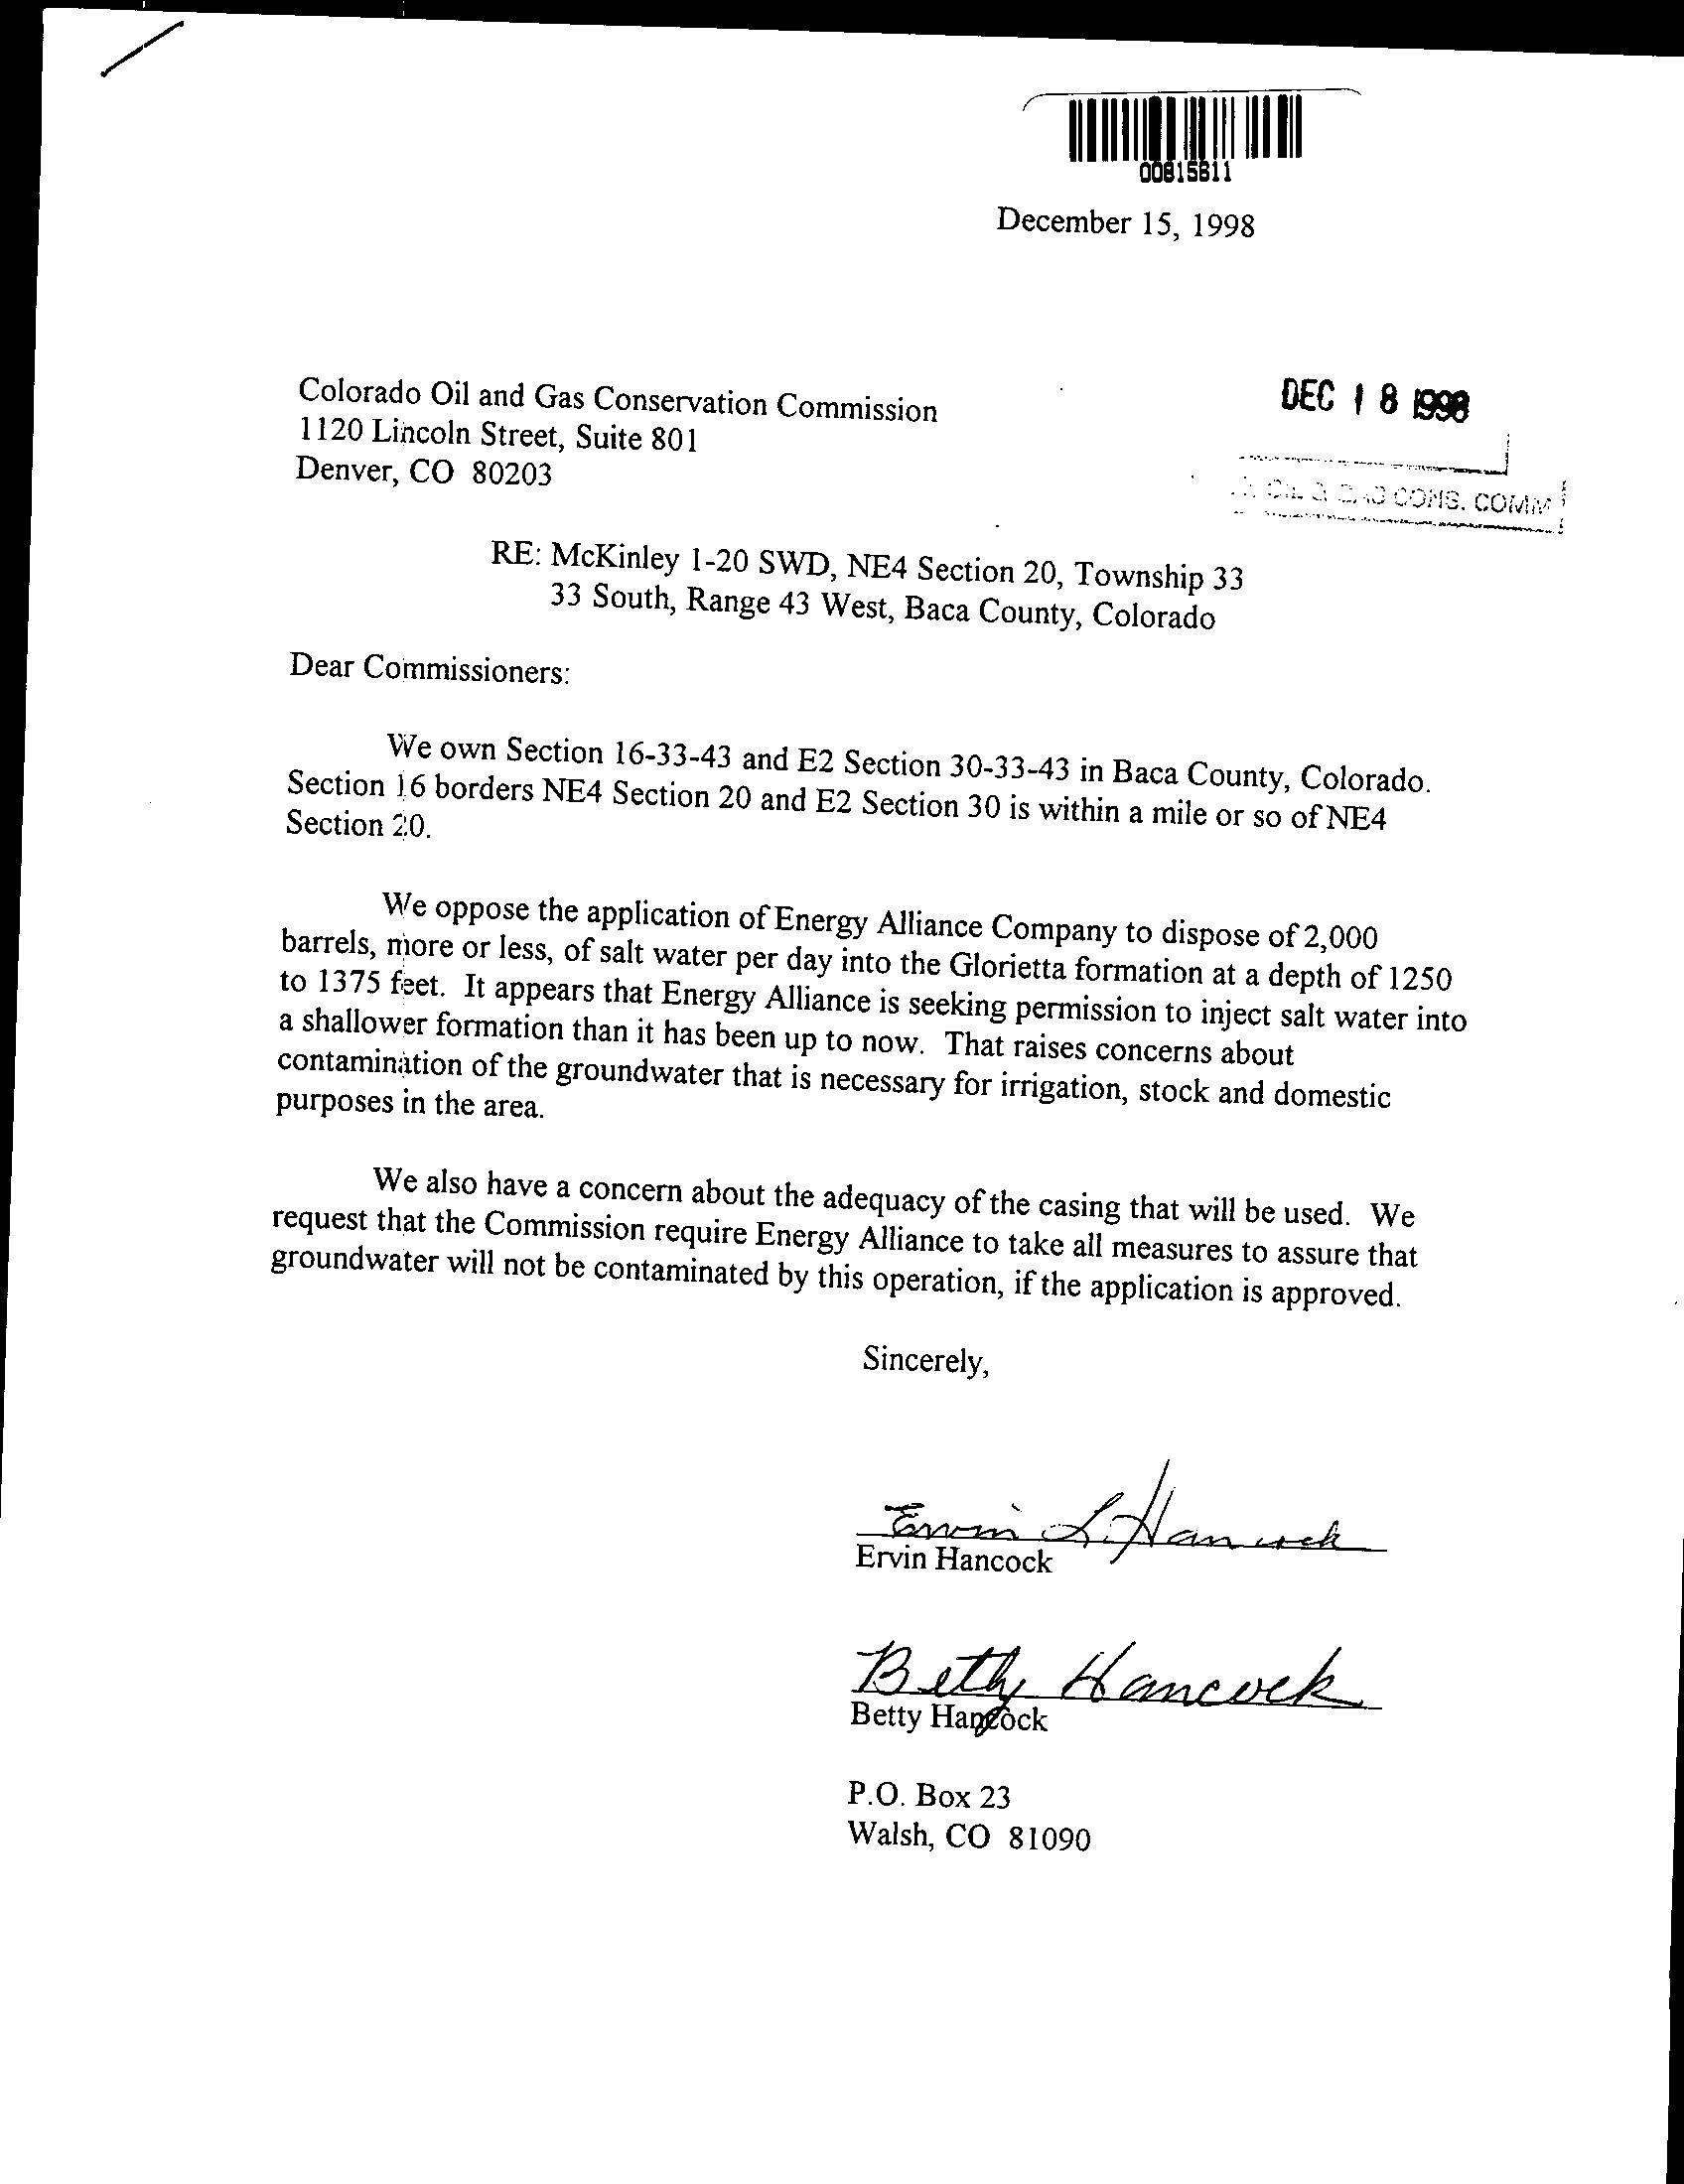
Shell’s permit applications to the PA DEP requires plans be submitted for erosion and sedimentation control of all areas along the Falcon route. Below are the pages that pertain to these high hazard areas.


Example 2: Independence Marsh
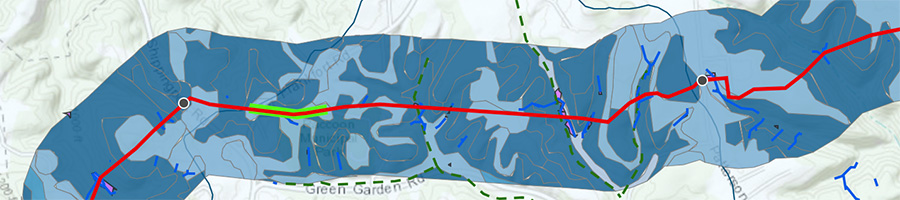
The other wetland area of concern along Raccoon Creek is found in Independence Township. Here, the Falcon will go under the Creek using horizontal drilling (highlighted in bright green), a process discussed in the next section. Nevertheless, the workspace needed to execute the crossing is within the designated wetland itself. An additional 15 acres of wetland lie only 300ft east of the crossing but are not accounted for in Shell’s data.
![]() This unidentified wetland is called Independence Marsh, considered the crown jewel of the Independence Conservancy’s watershed stewardship program. Furthermore, the marsh and the property where the HDD will be executed are owned by the Beaver County Conservation District, meaning that the CCD signed an easement with Shell to cross publicly-owned land.
This unidentified wetland is called Independence Marsh, considered the crown jewel of the Independence Conservancy’s watershed stewardship program. Furthermore, the marsh and the property where the HDD will be executed are owned by the Beaver County Conservation District, meaning that the CCD signed an easement with Shell to cross publicly-owned land.

Groundwater Hazards
The Falcon’s HDD locations offer a few disturbing similarities to what caused the Mariner East pipeline spills. Many of Sunoco’s failures were due to inadequately conducted (or absent) geophysical surveys prior to drilling that failed to identify karst limestone formations and shallow groundwater tables, which then led to drilling muds entering nearby streams and groundwater wells.
Karst Limestone
Karst landscapes are known for containing sinkholes, caves, springs, and surface water streams that weave in and out of underground tunnels. Limestone formations are where we are most likely to see karst landscapes along the Falcon’s route.
![]() In fact, more than 25 of the Falcon’s 97 pipeline miles will be laid within karst landscapes, including 9 HDD sites. However, only three of these HDDs sites are identified in Shell’s data as candidates for potential geophysical survey areas. The fact that the geology of the other 10 HDD sites will not be investigated is a concern.
In fact, more than 25 of the Falcon’s 97 pipeline miles will be laid within karst landscapes, including 9 HDD sites. However, only three of these HDDs sites are identified in Shell’s data as candidates for potential geophysical survey areas. The fact that the geology of the other 10 HDD sites will not be investigated is a concern.
One site where a geophysical survey is planned can be seen in the image below where the Falcon crosses under PA Highway 576. Note that this image shows a “geological formations” layer (with limestone in green). This layer shows the formation types within 1/4 mile of the Falcon and can activated in the full-screen version of our interactive map.

Water Tables
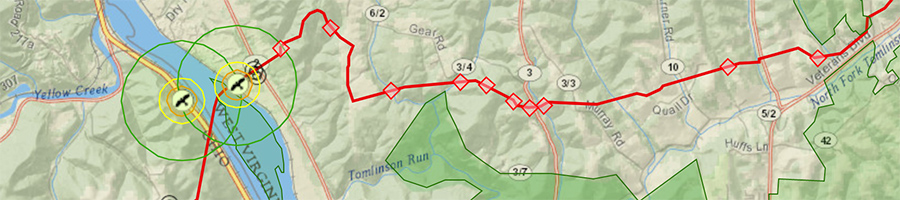
We also assessed the Falcon’s HDDs relative to the groundwater depths and nearby private groundwater wells. The USGS maintains information on minimum water table depths at different times of the year. In the image below we see the optional “water table depth” layer activated on the FracTracker map. The groundwater at this HDD site averages 20ft on its western side and only 8ft deep on the eastern side.

Groundwater Wells
![]() Also seen in the above image is the “groundwater wells” layer from the FracTracker map. We found 240 private water wells within 1/4 mile of the Falcon. This data is maintained by the PA Department of Natural Resources as well as by the Ohio Department of Natural Resources. Comparable GIS data for West Virginia were not readily available thus not shown on our map.
Also seen in the above image is the “groundwater wells” layer from the FracTracker map. We found 240 private water wells within 1/4 mile of the Falcon. This data is maintained by the PA Department of Natural Resources as well as by the Ohio Department of Natural Resources. Comparable GIS data for West Virginia were not readily available thus not shown on our map.
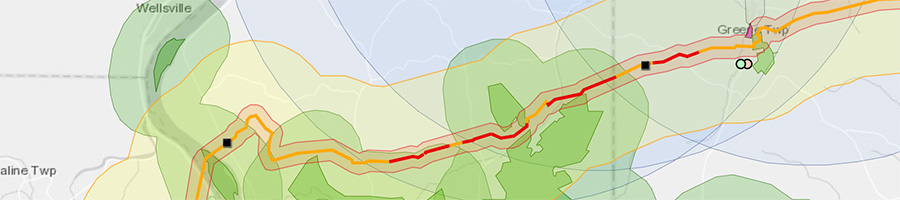
While all of these wells should be assessed for their level of risk with pipeline construction, the subset of wells nearest to HDD sites deserve particular attention. In fact, Shell’s data highlights 24 wells that are within 1,000 feet of a proposed HDD site. We’ve isolated the groundwater wells and HDD sites in a standalone map for closer inspection below. The 24 most at-risk wells are circled in blue.
View Map Fullscreen | How FracTracker Maps Work
* * *
Related Articles
By Kirk Jalbert, FracTracker Alliance