Mariner East 2 Drilling Fluid Spills – Updated Map and Analysis
Last week, a judge with the PA Environmental Hearing Board granted a two week halt to horizontal directional drilling (HDD) operations pertaining to the construction of Sunoco Logistics’ Mariner East 2 (ME2) pipeline. The temporary injunction responds to a petition from the Clean Air Council, Mountain Watershed Association, and the Delaware Riverkeeper Network. It remains in effect until a full hearing on the petition occurs on August 7-9, 2017.
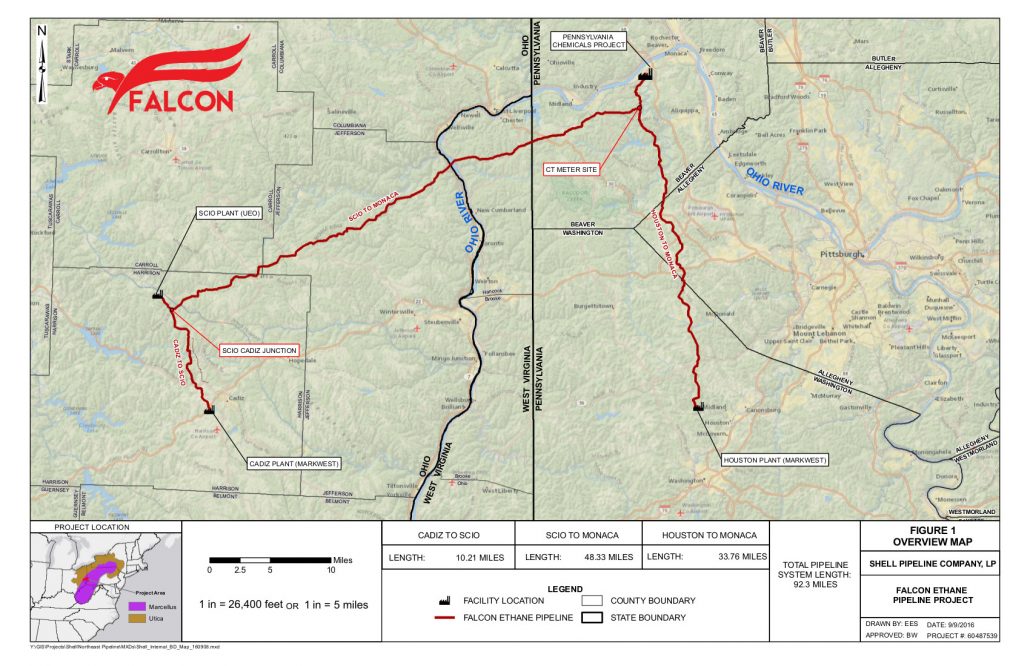
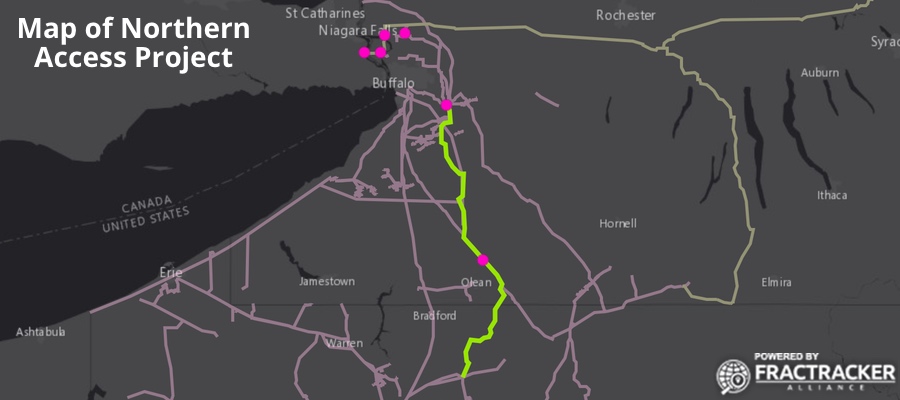
ME2 is a 350-mile long pipeline that, when complete, will carry 275,000 barrels of propane, ethane, butane, and other hydrocarbons per day from the shale gas fields of Western Pennsylvania to a petrochemical export terminal located on the Delaware River.
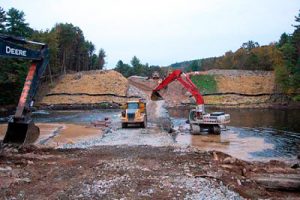
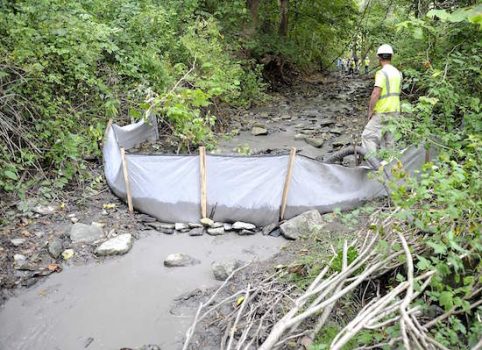
The petition relates to a complaint filed by the three groups detailing as many as 90 “inadvertent returns” (IRs) of drilling fluids and other drilling related spills along ME2’s construction route. IRs refer to incidents that occur during HDD operations in which drilling fluids consisting of water, bentonite clay, and some chemical mixtures used to lubricate the drill bit, come to the surface in unintended places. This can occur due to misdirected drilling, unanticipated underground fissures, or equipment failure.
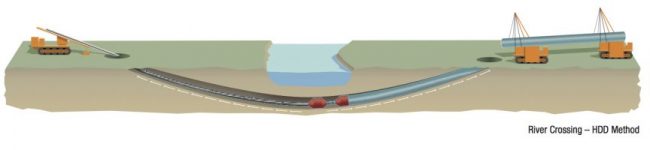
What is Horizontal Directional Drilling?
An illustration of an “ideal” horizontal directional drilling boring operation is seen in the first graphic below (image source). The second image shows what happens when HDDs go wrong (image source).
Mapping Inadvertent Returns
 The Pennsylvania Department of Environmental Protection (DEP) posted information on potential regulatory violations associated with these IRs on the PA Pipeline Portal website on July 24, 2017. This original file listed 49 spill locations. Our original map was based on those locations. As part of their legal filing, volunteer at the Clean Air Council (CAC) have parsed through DEP documents to discover 90 unique spills at these and other locations. On July 31, 2017, the DEP posted a new file that now lists 61 spills, which account for some of these discrepancies but not all.
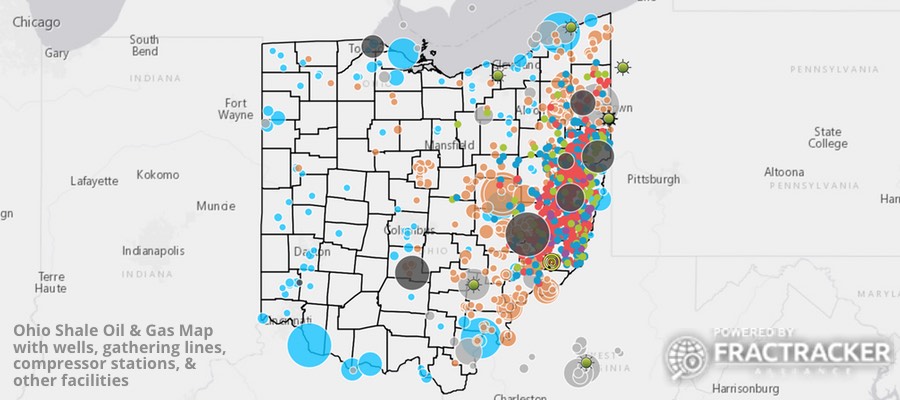
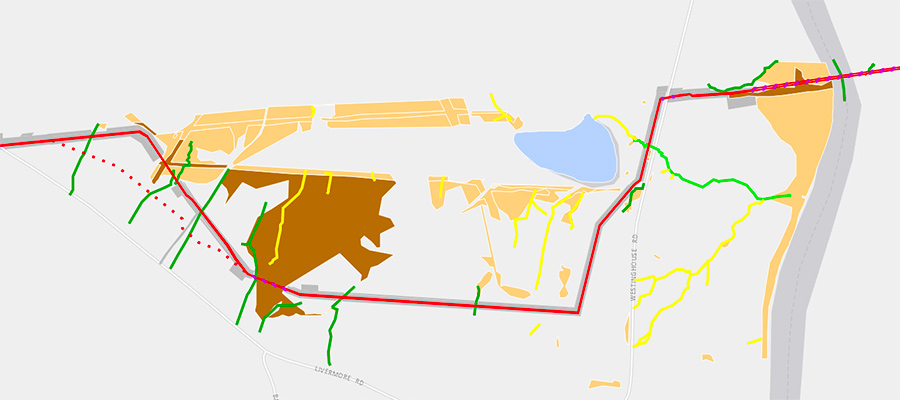
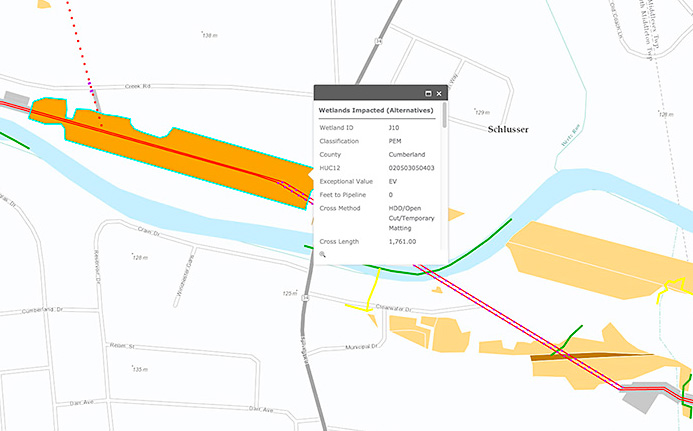
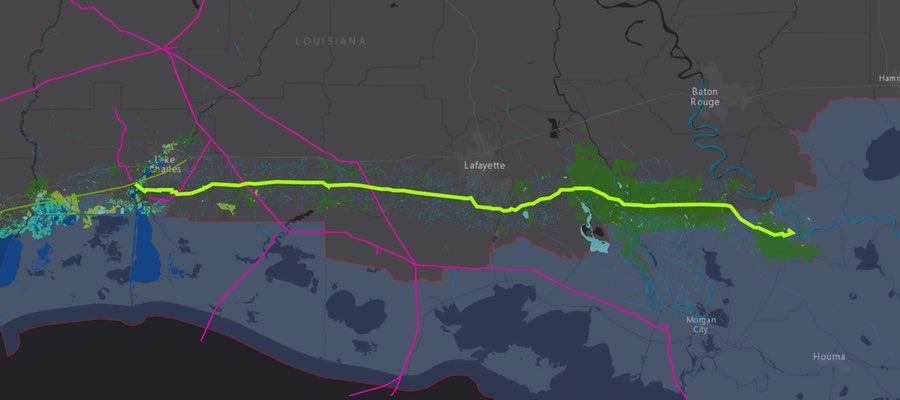
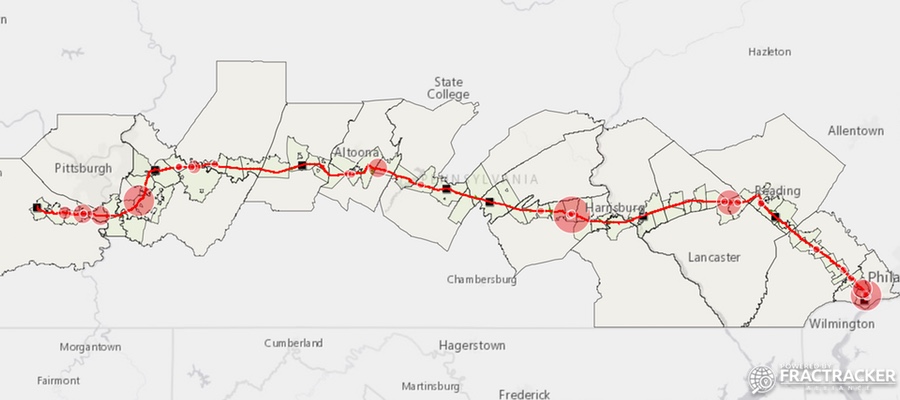
Working with the CAC, we have created a map, seen below, of the 90 known IRs listed in the DEP documents and from CAC’s findings. Also on the map are the locations of all of ME2’s HDD boring locations, pumping stations, and workspaces, as well as all the streams, ponds, and wetlands listed in Sunoco’s permits as implicated in the project’s construction (see our prior article on ME2’s watershed implications here). Open the map full-screen to see many of these features and their more detailed information.
View map fullscreen | How FracTracker maps work
Analysis Results for ME2
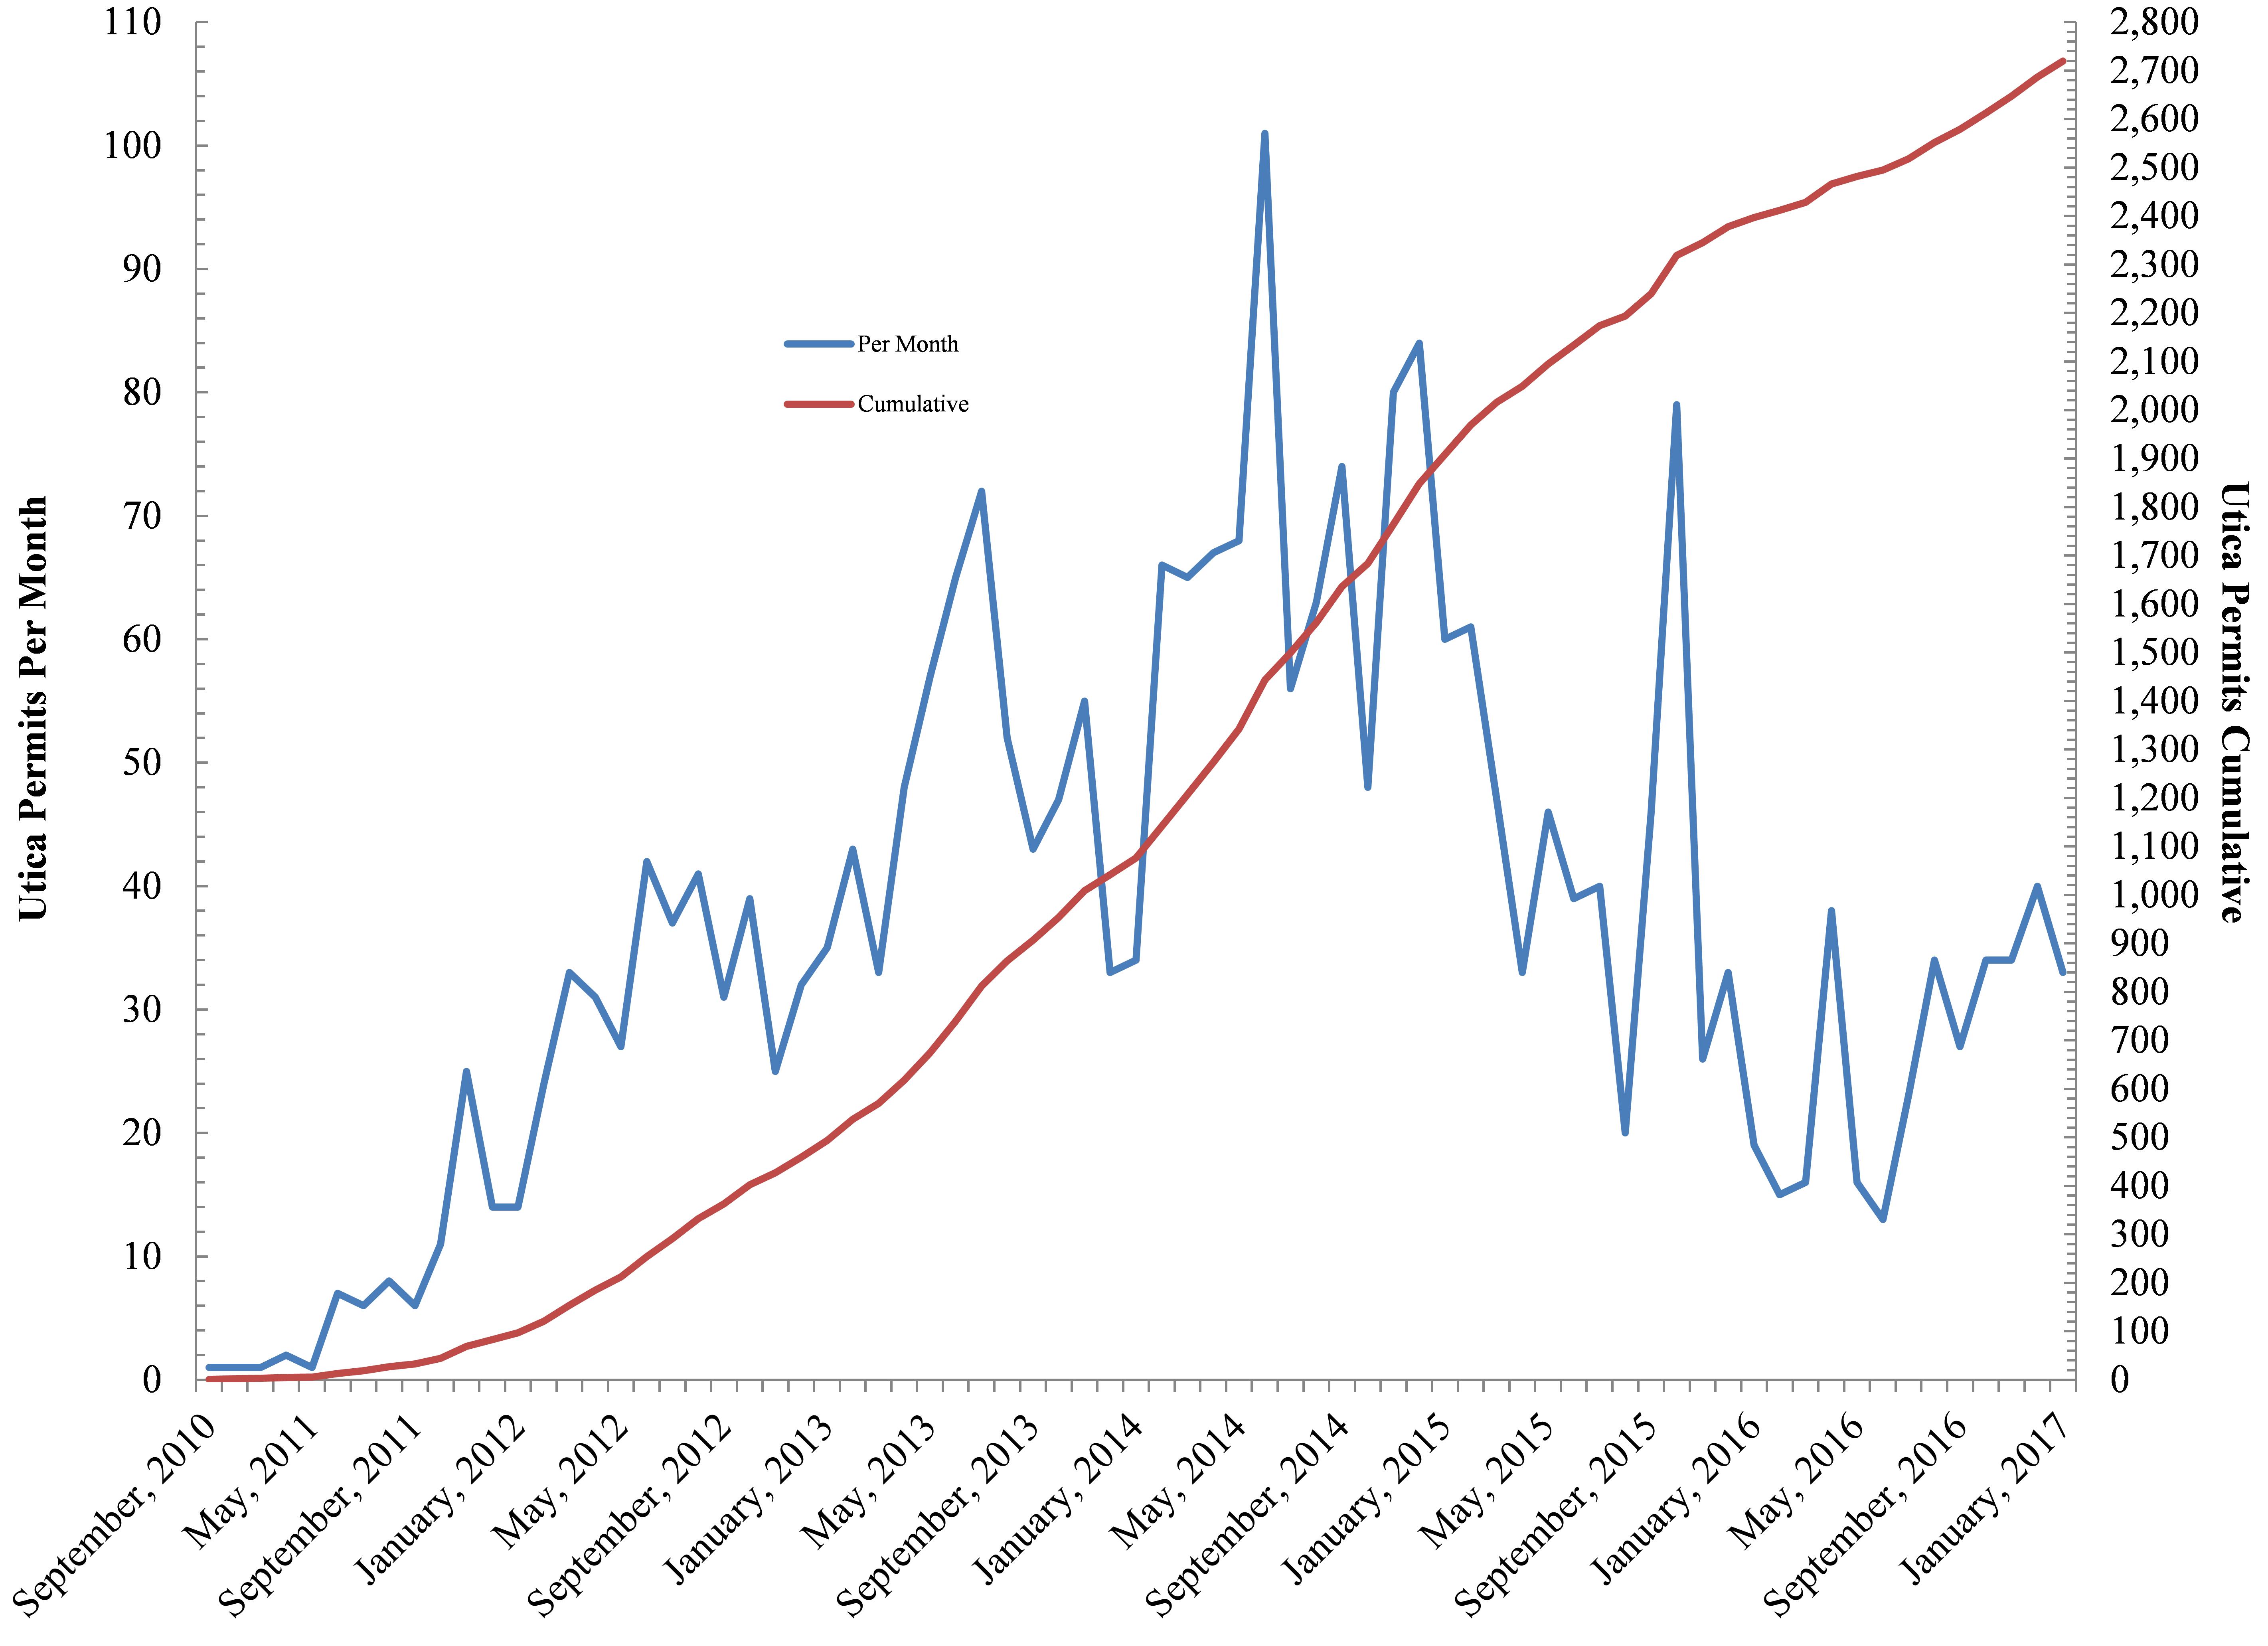
From our analysis, we find that, conservatively, more than 202,000 gallons of drilling fluids have been accidentally released while constructing the Mariner East 2 pipeline in Pennsylvania since the first documented incident on May 3rd. We say conservatively because a number of incidents are still under investigation. In a few instances we may never know the full volume of the spills as only a fraction of the total drilling muds lost were recovered.
We analyzed where these 90 spills occurred relative to known HDD sites and estimate that there are 38 HDDs implicated in these accidents. An additional 11 spills were found at sites where the DEP’s data shows no HDDs, so we calculate the total number of “spill locations” at 42. A full breakdown by county and known gallons spilled at these locations is seen below.
| County | Number of IRs/Spills | Gallons Spilled |
| Allegheny | 4 | 2,050 |
| Berks | 3 | 540 |
| Blair | 3 | 2,400 |
| Chester | 4 | 205 |
| Cumberland | 32 | 162,330 |
| Delaware | 8 | 2,380 |
| Huntingdon | 1 | 300 |
| Lancaster | 7 | 5945 |
| Lebanon | 1 | 300 |
| Washington | 9 | 4,255 |
| Westmoreland | 17 | 21,532 |
| York | 1 | 25 |
| Total | 90 | 202,262 |
A few important notes on our methods and the available data we have to work with:
- CAC obtained spills from DEP incident reports, inadvertent return reports, and other documents describing spills of drilling fluid that have occurred during Mariner East 2 construction. Those documents reflected incidents occurring between April 25, 2017 and June 17, 2017. In reviewing these documents, volunteers identified 61 discrete spills of drilling fluid, many of which happened at similar locations. Unfortunately, separate coordinates and volumes were not provided for each spill.
- When coordinates were not provided, approximate locations of spills were assigned where appropriate, based on descriptions in the documentation. Two IRs have no known location information whatsoever. As such, they are not represented on the map.
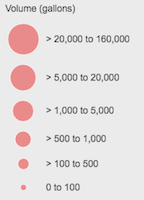
- Spill volumes were reported as ranges when there was inconsistency in documentation regarding the same spill. The map circles represent the high-end estimates within these ranges. Of the 90 known spills, 29 have no volume data. These are represented on the map, but with a volume estimate of zero until more information is available.
- All documentation available to CAC regarding these spills was filed with the Environmental Hearing Board on July 19, 2017. DEP subsequently posted a table of inadvertent returns on its website on July 24, 2017. Some of those spills were the same as ones already identified in documents CAC had reviewed, but 29 of the spills described on the DEP website were ones for which CCAC had never received documentation, although a subset of these are now listed in brief in the DEP spreadsheet posted on July 31, 2017. In total then, the documentation provided to CAC from DEP and spreadsheets on the DEP website describe at least 90 spills.
HDD Implications
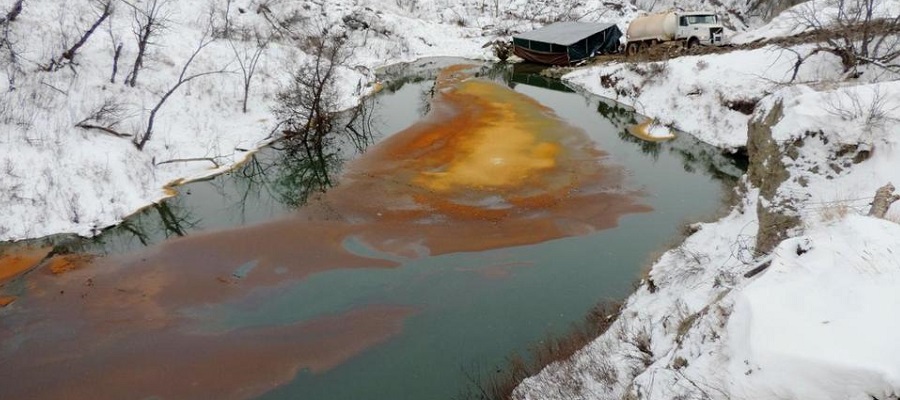
The DEP’s press release assures the public that the drilling fluids are non-toxic and the IRs are “not expected to have any lasting effects on impacted waters of the commonwealth.” But this is not entirely the case. While the fluids themselves are not necessarily a public health threat, the release of drilling fluids into aquifers and drinking wells can make water unusable. This occurred in June in Chester County, for example.
More commonly, drilling fluid sediment in waterways can kill aquatic life due to the fine particulates associated with bentonite clay. Given that HDD is primarily used to lay pipe under streams, rivers, and ponds (as well as roads, parks, and other sensitive areas), this latter risk is a real concern. Such incidents have occurred in many of the instances cited in the DEP documents, including a release of drilling muds into a creek in Delaware County in May.
We hope the above map and summaries provide insights into the current risks associated with the project and levels of appropriate regulatory oversight, as well as for understanding the impacts associated with HDD, as it is often considered a benign aspect of pipeline construction.
By Kirk Jalbert, Manager of Community Based Research and Engagement, FracTracker Alliance
If you have any questions about the map on this page or the data used to create it, please contact Kirk Jalbert at jalbert@fractracker.org.