 https://www.fractracker.org/a5ej20sjfwe/wp-content/uploads/2019/03/IdleWellsHathaway_resize.jpg
400
900
FracTracker Alliance
https://www.fractracker.org/a5ej20sjfwe/wp-content/uploads/2025/09/2025-Wordmark-Logo.png
FracTracker Alliance2025-07-03 13:40:552025-07-03 15:42:15Methane Matters, but Make Polluters Pay: FracTracker’s Response to Carl Pope
https://www.fractracker.org/a5ej20sjfwe/wp-content/uploads/2019/03/IdleWellsHathaway_resize.jpg
400
900
FracTracker Alliance
https://www.fractracker.org/a5ej20sjfwe/wp-content/uploads/2025/09/2025-Wordmark-Logo.png
FracTracker Alliance2025-07-03 13:40:552025-07-03 15:42:15Methane Matters, but Make Polluters Pay: FracTracker’s Response to Carl PopeDoes Hydrogen Have a Role in our Energy Future?
Overview
As the world grapples with carbon pollution, there has been increasing focus on using hydrogen gas as a fuel, because it doesn’t emit carbon dioxide or methane at the point of combustion. But most hydrogen is currently formed from methane, which means that this “carbon-free” fuel source could actually lead to more fracking, if we aren’t careful.
The Carbon Problem
Humans continue to heat our planet with nearly unfettered emissions of greenhouse gasses to our atmosphere. The most serious emissions come in the form of carbon dioxide (CO2) and methane.

According to the US Environmental Protection Agency (EPA), CO2 accounts for about 79% of all human-caused greenhouse gas emissions in the United States, and most of that is derived from the combustion of coal, oil, and gas for energy and transportation purposes. Methane is the main product for gas drilling activities, and it is often associated with oil and coal deposits as well. Methane accounts for about 11% of greenhouse gas emissions in the US, but it also has a global warming potential 25 times higher than that of CO2 over a 100-year timeframe. As enormous as the problem of CO2 emissions is, these data point to methane being about three and a half times larger.
Carbon-Free Solutions
The United States consumed about 100 quadrillion British thermal units of energy in 2019. Realistically, it’s an all-hands-on-deck type of situation to replace our carbon-based fuels with carbon-free solutions that will give our planet the chance to slowly scrub the greenhouse gasses from our atmosphere.
Understandably, the world is now frantically searching for energy sources that don’t pollute carbon into our atmosphere in the form of CO2 or methane. One option is nuclear power, which generates 19% of electricity in the US without carbon emissions, although many people are uncomfortable with the long-lasting waste products, as well as high profile accidents such as Chernobyl and Fukushima. Hydroelectric sources create around 6% of our electricity and don’t emit carbon, either, but they do have a substantial impact on the environment in other ways. Wind (9%), solar (3%), and geothermal (0.4%) power will continue to play ever-increasing roles as well as infrastructure continues to be built out, which will have to include energy storage solutions, among other things. Other than gigantic nuclear powered naval vessels and a few creative solar projects, however, none of these options have yet been shown the ability to work on mobile applications at scale.
The Hydrogen Color Wheel
The process of water electrolysis discovered by Deiman and van Troostwijk can be done in a carbon-neutral way. By applying a clean energy source such as solar power, water molecules are split into hydrogen and oxygen molecules, resulting in zero carbon emissions. However, hydrogen gas can be produced in many ways. To distinguish this from other sources, hydrogen made from electrolysis via clean energy sources is known as green hydrogen.
The map below shows reported hydrogen production facilities in the United States (Figure 1). In 2020, about 95% of hydrogen production was formed by fossil fuels in one way or another. These processes also have colors attributed to them in this hydrogen color scheme. Gray hydrogen is the most common method and is formed by methane reformation. In this process, steam heated to between 700° and 1,000° Celsius, along with a catalyst, converts the methane molecules to hydrogen carbon monoxide (CO), and CO2. The poisonous CO gas is then reacted with water, producing more hydrogen and CO2. In gray hydrogen, all this carbon dioxide is released to the atmosphere, contributing to our climate problems.

Figure 1. Map of hydrogen production sites in the United States. This map was made in March 2022, using a 2020 dataset from the US EPA, available here.
Blue hydrogen is the exact same as gray hydrogen, except that the oil and gas industry promises to sequester the CO2 gas in the former case. Unfortunately, this promise is riddled with problems. For one thing, it still relies on the same energy intensive processes of drilling and fracking to get the methane in the first place. Each well will still requires thousands of diesel-belching truck trips, thousands of tons of sand transported from mines in the upper Midwest, millions of gallons of water, and more.

With aerial support from LightHawk, FracTracker captures a well site in Potter County, Pennsylvania in 2019, showing the industrial activity during the drilling phase of operations.
Uncounted Emission Sources and Loss of Natural Carbon Sinks
The gas will still have to travel through a network of millions of miles of leaky and accident-prone pipelines, powered by a network of polluting compressor stations that emit an estimated 50.7 billion cubic feet of methane per year just from transmission lines.
Earthworks’ Community Empowerment Project uses optical gas imaging cameras to capture emissions that are invisible to the naked eye. This video shows emissions coming from the EagleClaw Midstream South Block 4 Compressor Station in Reeves County, TX, taken in February 2022.
These pipelines travel through a variety of terrain–in the US, about 36% of the land is forested and average 81 metric tons of carbon per acre. Whether through decay or combustion, almost all of this carbon will eventually combine with oxygen and wind up in the atmosphere as CO2, increasing in weight by a factor of 3.67, meaning that each acre of forested land that is cleared will add around 297 metric tons of CO2 to the atmosphere, on average. Additionally, that area will no longer act as a carbon sink. On average, US forests remove an average of 0.84 metric tons (1,852 pounds) of carbon dioxide every year from the atmosphere, which is taken offline with infrastructure construction.
At a minimum, transmission and gathering lines require that a 50 foot right of way be cleared, with some pipelines being three to four times that width. This means that on average, a one-mile stretch of pipeline with a minimum right-of-way through forested land will cost 1,800 metric tons for the one-time cutting, and 5 metric tons every year thereafter.
All of the above describes atmospheric carbon emissions that are not being avoided by continuing to use fracked gas a source for methane. We still must account for the process of getting the steam super-heated to between 700° and 1,000° Celsius. Then we have to account for new pipelines and infrastructure for CO2, essentially repeating the cycle with gas pipeline leaks and incidents, this time with CO2 instead of methane, and the same clearing costs and carbon sink removals as before, for a massive proposed network that is almost entirely yet to be built.
And then what do we do with all of that sequestered CO2? Of the 230 million metric tons of carbon dioxide (MtCO2) currently sequestered, chemical fertilizer uses the most, at 130 MtCO2. Second place goes to oil and gas, with 70-80 MtCO2. CO2 is injected in one well to help push hydrocarbons to a different well to increase production yields in a process called enhanced oil recovery, thus continuing the carbon extraction cycle. The industry advertises that 90-95% of that CO2 stays underground, meaning that 5-10% of it does not, eventually finding its way to the atmosphere.
The Take Away
It is our view that the prospect of clean green hydrogen is being used as a bait-and-switch tactic to get people (and politicians who control the purse-strings) excited about hydrogen. As always, it is important to follow the money, and see who is getting these tax breaks. In the early going, it seems to be dominated by oil and gas extraction companies armed with equations that on paper point towards improved carbon emissions over current practices, but don’t consider the convoluted, carbon-heavy steps along the way necessary to produce this hydrogen gas.
Nor does it consider the inefficiency of the process. In a recent peer reviewed publication, authors Robert Howarth and Mark Jacobson note:
While carbon dioxide emissions are lower, fugitive methane emissions for blue hydrogen are higher than for gray hydrogen because of an increased use of natural gas to power the carbon capture. Perhaps surprisingly, the greenhouse gas footprint of blue hydrogen is more than 20% greater than burning natural gas or coal for heat and some 60% greater than burning diesel oil for heat, again with our default assumptions.
And lower energy efficiency means even more fracking than before.
References & Where to Learn More
- This is the first in a series of FracTracker articles about hydrogen from methane and carbon capture. Read the second article, An Insider Take on the Appalachian Hydrogen CCUS Conference.
- Learn more about the Department of Energy’s strategy regarding hydrogen technology
- View a panel discussion from the Ohio River Valley Institute on the potential impacts of a hydrogen hub in Western Pennsylvania
DATASETS USED IN THE MAP ABOVE
Name: Hydrogen Production Sites
Date: 2020 Dataset, retrieved March 2022
Source: US EPA, available for download here
Topics in This Article:
Join the Conversation
Stay Informed
Support Our Work
FracTracker Alliance helps communicate the risks of oil and gas and petrochemical development to advance just energy alternatives that protect public health, natural resources, and the climate.
By contributing to FracTracker, you are helping to make tangible changes, such as decreasing the number of oil and gas wells in the US, protecting the public from toxic and radioactive chemicals, and stopping petrochemical expansion into vulnerable communities.
Your donations help fund the sourcing and analysis of new data so that we can keep you informed and continually update our resources.
Please donate to FracTracker today as a way to advocate for clean water, clean air, and healthy communities.
What You Should Read Next
https://www.fractracker.org/a5ej20sjfwe/wp-content/uploads/2019/03/IdleWellsHathaway_resize.jpg
400
900
FracTracker Alliance
https://www.fractracker.org/a5ej20sjfwe/wp-content/uploads/2025/09/2025-Wordmark-Logo.png
FracTracker Alliance2025-07-03 13:40:552025-07-03 15:42:15Methane Matters, but Make Polluters Pay: FracTracker’s Response to Carl Pope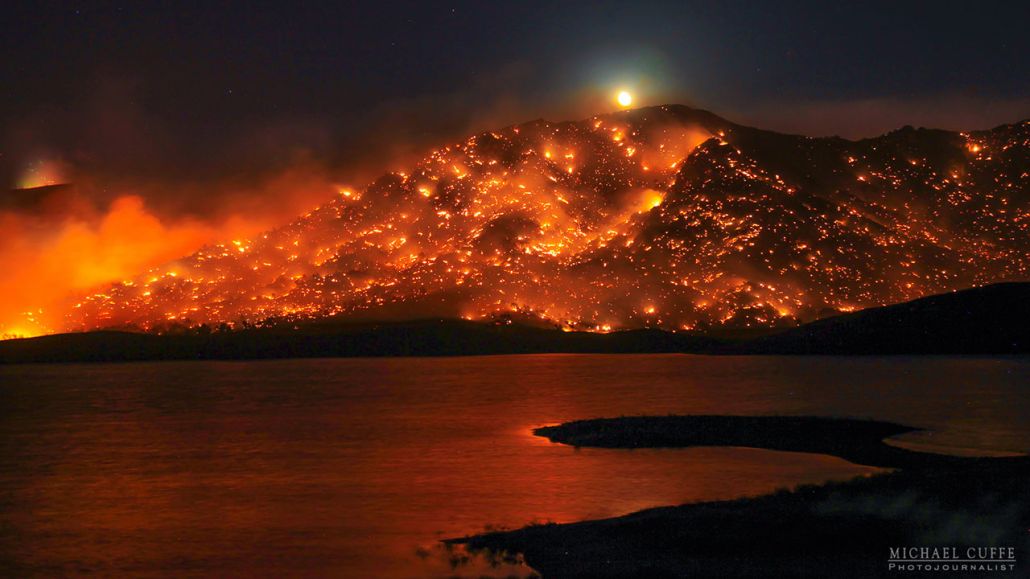 https://www.fractracker.org/a5ej20sjfwe/wp-content/uploads/2025/02/1400669_062416-kabc-cuffe-erskine1-imgcrtr.jpg
720
1280
FracTracker Alliance
https://www.fractracker.org/a5ej20sjfwe/wp-content/uploads/2025/09/2025-Wordmark-Logo.png
FracTracker Alliance2025-01-31 12:07:132025-02-06 14:11:38Can California Energy Policy Move Past its Contradictions?
https://www.fractracker.org/a5ej20sjfwe/wp-content/uploads/2025/02/1400669_062416-kabc-cuffe-erskine1-imgcrtr.jpg
720
1280
FracTracker Alliance
https://www.fractracker.org/a5ej20sjfwe/wp-content/uploads/2025/09/2025-Wordmark-Logo.png
FracTracker Alliance2025-01-31 12:07:132025-02-06 14:11:38Can California Energy Policy Move Past its Contradictions?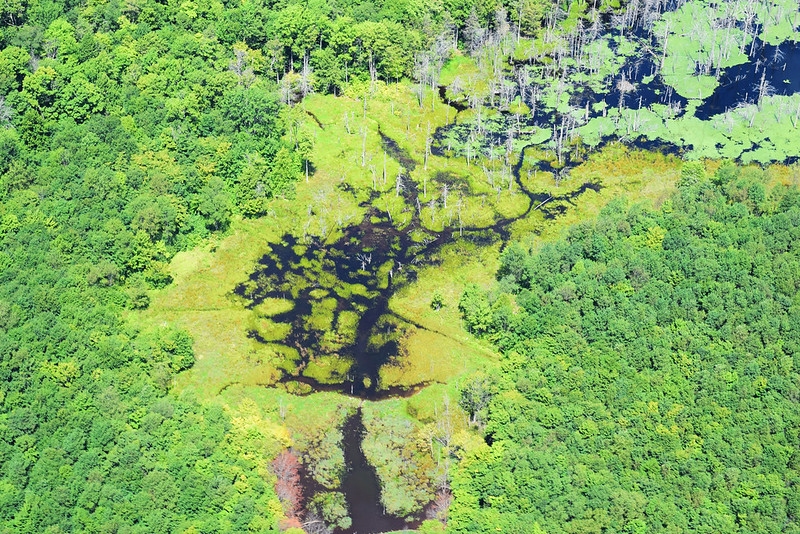 https://www.fractracker.org/a5ej20sjfwe/wp-content/uploads/2020/09/FreshwaterEcosystems-1.jpg
534
800
FracTracker Alliance
https://www.fractracker.org/a5ej20sjfwe/wp-content/uploads/2025/09/2025-Wordmark-Logo.png
FracTracker Alliance2023-09-12 09:30:272023-09-13 14:54:13Pennsylvania Watersheds at Risk: Water Supply Decline
https://www.fractracker.org/a5ej20sjfwe/wp-content/uploads/2020/09/FreshwaterEcosystems-1.jpg
534
800
FracTracker Alliance
https://www.fractracker.org/a5ej20sjfwe/wp-content/uploads/2025/09/2025-Wordmark-Logo.png
FracTracker Alliance2023-09-12 09:30:272023-09-13 14:54:13Pennsylvania Watersheds at Risk: Water Supply Decline Photo by Kirsi Jansa
https://www.fractracker.org/a5ej20sjfwe/wp-content/uploads/2023/03/download.jpg
809
1214
Erica Jackson
https://www.fractracker.org/a5ej20sjfwe/wp-content/uploads/2025/09/2025-Wordmark-Logo.png
Erica Jackson2023-03-01 14:04:172023-03-01 14:04:17Worth Protecting: A photo album by Better Path Coalition and FracTracker Alliance
Photo by Kirsi Jansa
https://www.fractracker.org/a5ej20sjfwe/wp-content/uploads/2023/03/download.jpg
809
1214
Erica Jackson
https://www.fractracker.org/a5ej20sjfwe/wp-content/uploads/2025/09/2025-Wordmark-Logo.png
Erica Jackson2023-03-01 14:04:172023-03-01 14:04:17Worth Protecting: A photo album by Better Path Coalition and FracTracker Alliance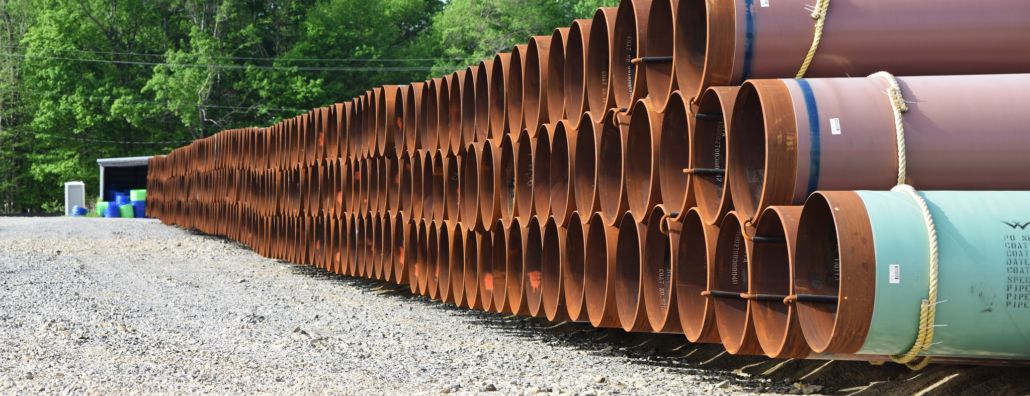 https://www.fractracker.org/a5ej20sjfwe/wp-content/uploads/2021/03/TAuch_Transportation-RoverPipeline_Construction-EnergyTransferPartners-Woodsfield_OH_May2017.jpg
576
1500
Karen Edelstein
https://www.fractracker.org/a5ej20sjfwe/wp-content/uploads/2025/09/2025-Wordmark-Logo.png
Karen Edelstein2022-11-30 17:50:122024-01-22 16:03:23A Contentious Landscape of Pipeline Build-outs in the Eastern US
https://www.fractracker.org/a5ej20sjfwe/wp-content/uploads/2021/03/TAuch_Transportation-RoverPipeline_Construction-EnergyTransferPartners-Woodsfield_OH_May2017.jpg
576
1500
Karen Edelstein
https://www.fractracker.org/a5ej20sjfwe/wp-content/uploads/2025/09/2025-Wordmark-Logo.png
Karen Edelstein2022-11-30 17:50:122024-01-22 16:03:23A Contentious Landscape of Pipeline Build-outs in the Eastern US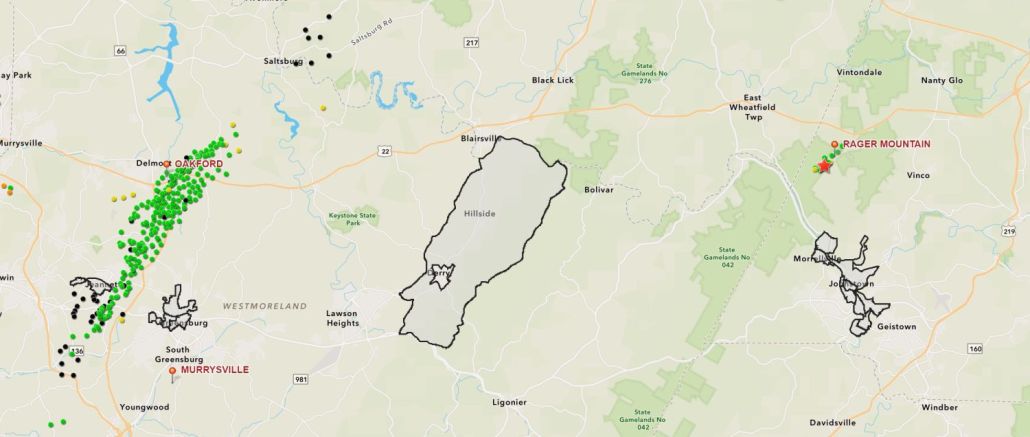 https://www.fractracker.org/a5ej20sjfwe/wp-content/uploads/2022/11/Rager-Mountain-Feature.jpg
636
1500
Erica Jackson
https://www.fractracker.org/a5ej20sjfwe/wp-content/uploads/2025/09/2025-Wordmark-Logo.png
Erica Jackson2022-11-30 14:12:222023-02-03 13:50:48Major Gas Leak Reveals Risks of Aging Gas Storage Wells in Pennsylvania
https://www.fractracker.org/a5ej20sjfwe/wp-content/uploads/2022/11/Rager-Mountain-Feature.jpg
636
1500
Erica Jackson
https://www.fractracker.org/a5ej20sjfwe/wp-content/uploads/2025/09/2025-Wordmark-Logo.png
Erica Jackson2022-11-30 14:12:222023-02-03 13:50:48Major Gas Leak Reveals Risks of Aging Gas Storage Wells in Pennsylvania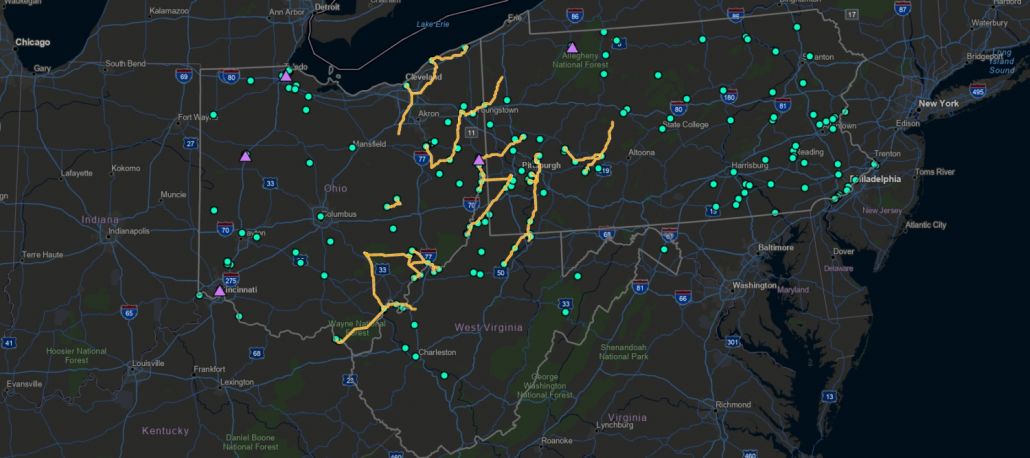 https://www.fractracker.org/a5ej20sjfwe/wp-content/uploads/2022/06/CCSHFeatureImage.jpg
667
1500
Guest Author
https://www.fractracker.org/a5ej20sjfwe/wp-content/uploads/2025/09/2025-Wordmark-Logo.png
Guest Author2022-06-23 15:29:312022-06-30 12:30:43An Insider Take on the Appalachian Hydrogen & CCUS Conference
https://www.fractracker.org/a5ej20sjfwe/wp-content/uploads/2022/06/CCSHFeatureImage.jpg
667
1500
Guest Author
https://www.fractracker.org/a5ej20sjfwe/wp-content/uploads/2025/09/2025-Wordmark-Logo.png
Guest Author2022-06-23 15:29:312022-06-30 12:30:43An Insider Take on the Appalachian Hydrogen & CCUS Conference https://www.fractracker.org/a5ej20sjfwe/wp-content/uploads/2022/06/TAuch_Infrastructure-OilRefinery_DowntownToledo-ToledoOil-LucasCounty-OH_Lighthawk_Sept2021.jpg
667
1500
Matt Kelso, BA
https://www.fractracker.org/a5ej20sjfwe/wp-content/uploads/2025/09/2025-Wordmark-Logo.png
Matt Kelso, BA2022-06-21 15:46:522024-06-18 10:53:27Does Hydrogen Have a Role in our Energy Future?
https://www.fractracker.org/a5ej20sjfwe/wp-content/uploads/2022/06/TAuch_Infrastructure-OilRefinery_DowntownToledo-ToledoOil-LucasCounty-OH_Lighthawk_Sept2021.jpg
667
1500
Matt Kelso, BA
https://www.fractracker.org/a5ej20sjfwe/wp-content/uploads/2025/09/2025-Wordmark-Logo.png
Matt Kelso, BA2022-06-21 15:46:522024-06-18 10:53:27Does Hydrogen Have a Role in our Energy Future? https://www.fractracker.org/a5ej20sjfwe/wp-content/uploads/2021/08/Bitcoin-feature.jpg
667
1500
Karen Edelstein
https://www.fractracker.org/a5ej20sjfwe/wp-content/uploads/2025/09/2025-Wordmark-Logo.png
Karen Edelstein2021-08-02 17:05:372022-01-04 10:48:28The world is watching as bitcoin battle brews in the US
https://www.fractracker.org/a5ej20sjfwe/wp-content/uploads/2021/08/Bitcoin-feature.jpg
667
1500
Karen Edelstein
https://www.fractracker.org/a5ej20sjfwe/wp-content/uploads/2025/09/2025-Wordmark-Logo.png
Karen Edelstein2021-08-02 17:05:372022-01-04 10:48:28The world is watching as bitcoin battle brews in the US https://www.fractracker.org/a5ej20sjfwe/wp-content/uploads/2021/05/Pennsylvania-conventional-wells-feature.jpg
667
1500
Erica Jackson
https://www.fractracker.org/a5ej20sjfwe/wp-content/uploads/2025/09/2025-Wordmark-Logo.png
Erica Jackson2021-05-27 17:57:282025-04-11 17:29:29Pennsylvania Conventional Well Map Update
https://www.fractracker.org/a5ej20sjfwe/wp-content/uploads/2021/05/Pennsylvania-conventional-wells-feature.jpg
667
1500
Erica Jackson
https://www.fractracker.org/a5ej20sjfwe/wp-content/uploads/2025/09/2025-Wordmark-Logo.png
Erica Jackson2021-05-27 17:57:282025-04-11 17:29:29Pennsylvania Conventional Well Map Update https://www.fractracker.org/a5ej20sjfwe/wp-content/uploads/2019/08/EQT-Tioga-Wide-7.gif
300
800
Shannon Smith
https://www.fractracker.org/a5ej20sjfwe/wp-content/uploads/2025/09/2025-Wordmark-Logo.png
Shannon Smith2020-06-29 11:04:372021-04-15 14:16:43Testimony to PA DEP on Control of Methane & VOC Emissions from Oil and Natural Gas Sources
https://www.fractracker.org/a5ej20sjfwe/wp-content/uploads/2019/08/EQT-Tioga-Wide-7.gif
300
800
Shannon Smith
https://www.fractracker.org/a5ej20sjfwe/wp-content/uploads/2025/09/2025-Wordmark-Logo.png
Shannon Smith2020-06-29 11:04:372021-04-15 14:16:43Testimony to PA DEP on Control of Methane & VOC Emissions from Oil and Natural Gas Sources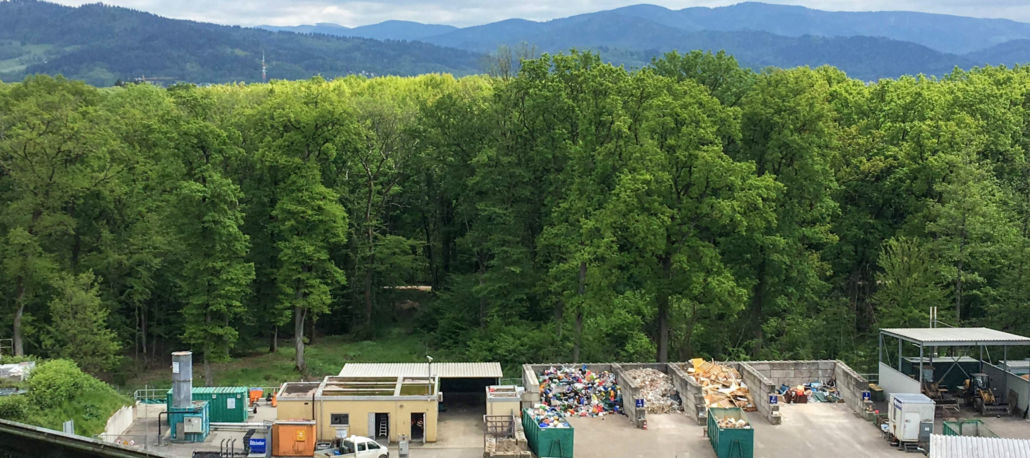 https://www.fractracker.org/a5ej20sjfwe/wp-content/uploads/2019/11/IMG_5312-1-scaled.jpg
666
1500
Erica Jackson
https://www.fractracker.org/a5ej20sjfwe/wp-content/uploads/2025/09/2025-Wordmark-Logo.png
Erica Jackson2019-11-24 13:59:482021-04-15 14:55:35The Circular Economy: What it means for Fracking and Plastic
https://www.fractracker.org/a5ej20sjfwe/wp-content/uploads/2019/11/IMG_5312-1-scaled.jpg
666
1500
Erica Jackson
https://www.fractracker.org/a5ej20sjfwe/wp-content/uploads/2025/09/2025-Wordmark-Logo.png
Erica Jackson2019-11-24 13:59:482021-04-15 14:55:35The Circular Economy: What it means for Fracking and Plastic https://www.fractracker.org/a5ej20sjfwe/wp-content/uploads/2019/05/Plastic-Climate-1.png
512
1024
Erica Jackson
https://www.fractracker.org/a5ej20sjfwe/wp-content/uploads/2025/09/2025-Wordmark-Logo.png
Erica Jackson2019-05-16 11:39:262021-04-15 14:56:31The Hidden Costs of a Plastic Planet
https://www.fractracker.org/a5ej20sjfwe/wp-content/uploads/2019/05/Plastic-Climate-1.png
512
1024
Erica Jackson
https://www.fractracker.org/a5ej20sjfwe/wp-content/uploads/2025/09/2025-Wordmark-Logo.png
Erica Jackson2019-05-16 11:39:262021-04-15 14:56:31The Hidden Costs of a Plastic Planet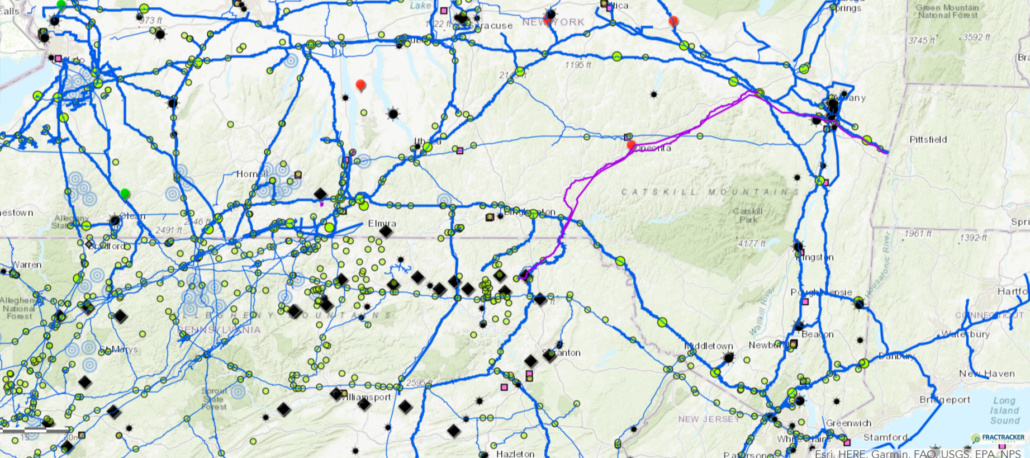 https://www.fractracker.org/a5ej20sjfwe/wp-content/uploads/2019/04/YouAreHereMap2.png
667
1500
Guest Author
https://www.fractracker.org/a5ej20sjfwe/wp-content/uploads/2025/09/2025-Wordmark-Logo.png
Guest Author2019-04-24 15:49:052021-04-15 14:56:34Release: The 2019 You Are Here map launches, showing New York’s hurdles to climate leadership
https://www.fractracker.org/a5ej20sjfwe/wp-content/uploads/2019/04/YouAreHereMap2.png
667
1500
Guest Author
https://www.fractracker.org/a5ej20sjfwe/wp-content/uploads/2025/09/2025-Wordmark-Logo.png
Guest Author2019-04-24 15:49:052021-04-15 14:56:34Release: The 2019 You Are Here map launches, showing New York’s hurdles to climate leadership![]()
216 Franklin St, Suite 400, Johnstown, PA 15901
Phone: +1 (717) 303-0403 | info@fractracker.org
FracTracker Alliance is a 501(c)3 non-profit: Tax identification number: 80-0844297