Do you want to help prevent pollution from Marcellus Shale Development in your community? Our visual assessment training provides information on permit tracking, air and water pollution, using FracTracker, safety, and filing a complaint with DEP.
When: May 19, 2011 from 6:00 to 9:00 PM Where: Bridgeside Point Building, 100 Technology Drive, Pittsburgh, PA 15219
For more information about the training, please contact Veronica with Mountain Watershed Association: 724-455-4200 (ext. #4), veronica@mtwatershed.com. Learn more about the project here.
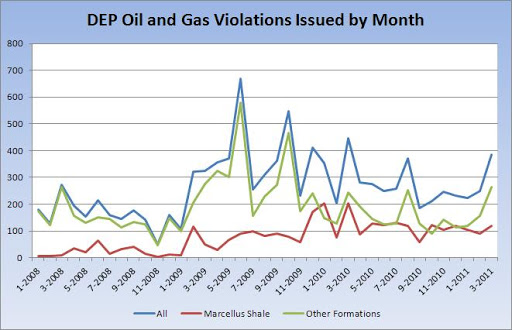
Changes Over TimeEvery time I think about the number of violations issued by the Pennsylvania Department of Environmental Protection (DEP) Bureau of Oil and Gas Management, I am struck on the one hand by the sheer magnitude of them–last year, the DEP issued 2,704 violations(1), a number that everyone would like to see go way down in the years ahead. On the other hand, at least that means the DEP is paying attention. It is with this spirit that I delved into the numbers, hoping to find patterns either in time or space.
The DEP has only occasionally issued more Marcellus Shale violations per month than for other combined oil and gas formations.
The monthly issuance of violations is surprisingly erratic in a industry that is accelerating drilling activity steadily, especially for the Marcellus Shale. Once we look at the data on an annual basis, though, a clearer picture begins to emerge.
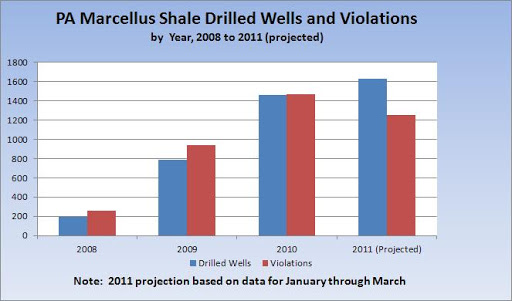
Based on a projection from the first quarter of 2011, this year will be the first year with more new Marcellus Shale wells drilled than DEP violations issued.
The number of drilled Marcellus Shale wells in Pennsylvania has been growing rapidly since the first well was drilled in 2006. Violations have been on the rise as well, but if the projections for 2010 hold true, there will actually be fewer violations this year than last year, despite the fact that there will be more Marcellus wells drilled. Again, due to the erratic nature of violations issued per month, such a projection should be taken with a grain of salt. On the other hand, it does fit with the long term trend of Marcellus Shale violations issued per wells drilled for the same calendar year.
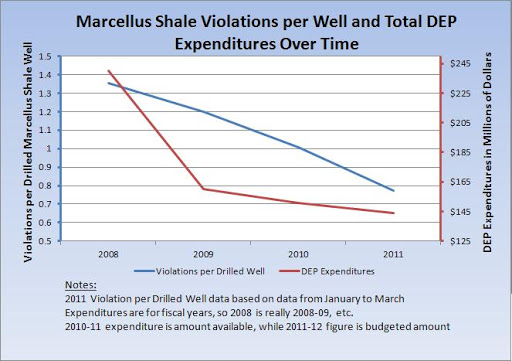
The number of Marcellus Shale violations per well has been decreasing over time, as has the budget of the Pennsylvania Department of Environmental Protection.
This graph is an attempt to look into the issue of whether the trend of decreasing violations per well might be due to DEP budget(2) issues rather than an overall increase in compliance by the industry. While this graph does not answer the question, it does lend the notion credibility.
Variance by DEP Region
Although there are six DEP regions, the Bureau of Oil and Gas is active out of three of them: the Northwest Regional Office (NWRO), the Southwest Regional Office (SWRO), and the North Central Regional Office (NCRO). All oil and gas activity in other portions of the state are included with the NCRO, giving them by far the largest territory to cover.
Violations per Well
Marcellus Shale violations per well by issuing DEP region. Click on the map for a larger, dynamic view.
The NCRO issued more than three times as many violations per Marcellus Shale well in 2010 than either of the other two regional offices. This is despite having the largest territory, and, as it turns out, the heaviest Marcellus Shale workload (3).
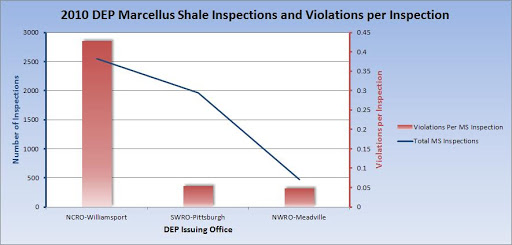
Violations per Inspection
DEP workload by region.
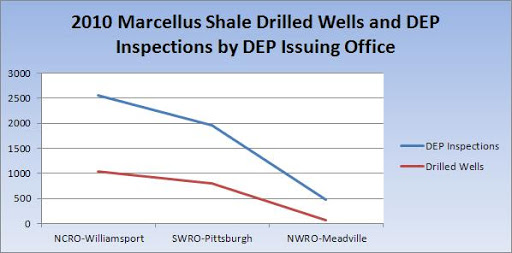
Number of Marcellus Shale inspections and wells drilled in 2010 by DEP Region.
Each DEP Oil and Gas Region had at least twice as many inspections as new drilled wells for the Marcellus Shale in 2010.
Marcellus Shale violations per inspection by issuing DEP region. Click the image for a larger, dynamic view.
The North Central Regional Office issued over eight times as many violations per inspection for Marcellus Shale wells as either of the other two DEP offices in 2010, despite the heaviest Marcellus Shale inspection workload.
Enforcement
The NCRO issued more than twice as many enforcement actions per inspection for Marcellus Shale wells than either the SWRO or NWRO in 2010.
As a quick review of the numbers for the Marcellus Shale from 2010, the NCRO compares to the other regions by issuing more than:
Three times as many violations per well
Eight times as many violations per inspection
Two times as many enforcement actions per inspection
The DEP briefly entertained the notion of centralizing violations and enforcement actions of Marcellus Shale wells. One wonders whether the end result would have been to reduce the vigilance of the NCRO, or whether the SWRO and NWRO would be instructed to catch up with their sibling. Indeed, either course of action could occur, even without Secretary Krancer’s direct approval of such actions.
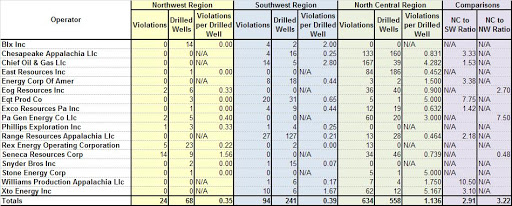
Operators Active in Multiple Regions
Although the violation and enforcement numbers of the NCRO above are already convincing, there is another variability that could potentially skew the data: drilling operators. Some of the better operators in terms of violations per well such as Consol and Range Resources are active primarily in the SWRO’s jurisdiciton. Could it be that the NCRO just has more bad apples than the other two regions?
To answer this, I narrowed the list of Marcellus Shale operators from wells drilled in 2010 to those active in more than one region, the results of which are below.
There were 17 drilling operators that drilled Marcellus Shale wells in more than one DEP oil and gas region in 2010.
Even when we limit the field to the eleven operators active in the NCRO and one of the other districts, we once again see that the North Central Regional Office issued about three times as many violations per well as did the others.
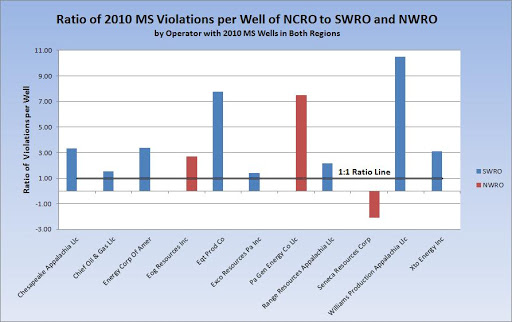
Drilling operators with at least one 2010 Marcellus Shale well in the NCRO as well as either the SWRO or NWRO. Seneca Resources is the only instance where there were fewer violations issued in the NCRO than elsewhere.
It seems difficult to imagine that the geology in the NCRO jurisdiction is really that much more challenging to work with than the rest of the state. Short of that, I cannot speculate on a reason for the consistently stark contrast in violation and enforcement patterns other than to suggest that the North Central Regional Office is run with a culture of vigilance that is unmatched by their counterparts in the Southwest and Northwest.
The goal should be for the industry to achieve a greater level of compliance with Pennsylvania’s environmental laws, not to see a greater number of violations. At the same time, every person deserves to know that he or she is being aggressively protected from an industry that can be very dangerous and polluting. Undoubtedly, there is a lot that goes into the inspection process beyond the issuance of violations and enforcement actions, and the numbers can only go so far in providing a description of events on the ground. Nonetheless, those numbers are striking and consistent in showing a North Central Regional Office that takes a no-nonsense approach to its efforts of regulating the Marcellus Shale industry, at least as compared to either the Southwest Regional Office and Northwest Regional Office.
I would have rather compared violations to the Bureau of Oil and Gas budget, but it is not separated in that fashion within the budget reports.
The NCRO does have the smallest overall workload, but this blog is focused on the Marcellus Shale.
https://www.fractracker.org/a5ej20sjfwe/wp-content/uploads/2025/09/2025-Wordmark-Logo.png00Matt Kelso, BAhttps://www.fractracker.org/a5ej20sjfwe/wp-content/uploads/2025/09/2025-Wordmark-Logo.pngMatt Kelso, BA2011-05-04 11:04:002020-07-21 10:37:57Issuance of PA Marcellus Shale Violations Over Time and by DEP Region
Part 1 – Integrative Decision Making for Farmers & Land Owners
May 17: Jefferson County; May 18 McKean County; May 19 Allegheny County; May 20 Greene County – 10:00am – 3:30pm
Farmers and rural landowners are a key group impacted by the Marcellus Shale gas development, as they continue to steward their land in the complicated environment of Marcellus Shale gas play.
PASA, with funding from the Colcom Foundation, has developed a series of action-oriented trainings throughout western Pennsylvania to help farmers, rural land owners, and other citizens make informed, holistic decisions, understand legal issues, and engage in environmental monitoring and local organizing efforts related to Marcellus Shale Gas issues within their communities.
In the first workshop of this series, Byron Shelton, Holistic Management Educator, farmer, rancher and owner of Landmark Decisions in Buena Vista, Colorado, will guide participants in learning a reasoning process that will help them establish a unique farm/rural land steward goal and make decisions to move them toward that goal. This decision-making process integrates the needs of the people that are involved, the economics of the situation, and the environment.
Over the course of the day, participants will develop their own farm or land-based goal. They will then test potential choices and actions to measure how these decisions move them toward their intended goal. While participants may consider the impacts and potentials of Marcellus Shale development in light of their overall goals, these tools are applicable to a much broader scope of decisions and choices – all of which involve ultimate movement toward the unique goal of the farm, landowner, family, or business situation.
Cost:
Registration Fee: $45 per farm/family
PASA Members: Free
For more information and to register online: Click Here
About Byron Shelton: Byron Shelton, a Holistic Management Certified Educator, and rancher in Buena Vista, Colorado, is the owner of Landmark Decisions which provides facilitation and decision-making training in Whole Farm Planning using Holistic Management™ Financial Planning, Ecosystem Processes Management, Grazing Planning and Monitoring, and Land Planning in family, business, agricultural, natural resource, and community settings.
https://www.fractracker.org/a5ej20sjfwe/wp-content/uploads/2025/09/2025-Wordmark-Logo.png00FracTracker Alliancehttps://www.fractracker.org/a5ej20sjfwe/wp-content/uploads/2025/09/2025-Wordmark-Logo.pngFracTracker Alliance2011-04-29 13:47:002020-07-21 10:37:57PASA Marcellus Shale Choices Workshop Series
On April 19, a well being hydraulically fractured by Chesapeake Energy suffered a blowout, or a loss of control of the wellhead, releasing thousands of gallons of hydraulic fracturing fluid onto the ground and into nearby Towanda Creek. Actions by officials at the county, state, and federal levels show some frustration with the drilling operator over this incident.
Chairman of the Bradford County Commissioners Mark W. Smith wrote an open letter to Governor Tom Corbett, in which he addresses the perfunctory well permitting process, well water spoilage and declining property values. He also points out the strains that the industry places on the local communities:
I continue to see our county, townships, and boroughs struggle with complex issues of development with no financial or logistical support from the Commonwealth. Emergency responders, volunteers, state and local police and dispatchers are working at a break neck pace to respond to immense traffic accident increases, well site accidents, and other related issues.
At the state level, the Pennsylvania Department of Environmental Protection (DEP) has already issued violations for the incident, as well as demanding explanations of certain aspects of the massive leak and spill. Chief among those is why Chesapeake elected to bring in well control specialists Boots and Coots, which took 12 hours to arrive on the scene, when there were other well control specialists available much closer. (For some dramatic well disaster footage, see Boots and Coots’ promotional video.)
The US Environmental Protection Agency is also getting involved, demanding complete information about the incident in this open letter to Chesapeake CEO Aubrey McClendon. EPA Regional Administrator Shawn M. Garvin explains the twofold nature of request:
We want a complete accounting of operations at the site to determine our next steps in this incident and to help prevent future releases of this kind.
Chesapeake Energy officials are also concerned, suspending all post-drilling activities in the Marcellus, including hydraulic fracturing, until the nature of the spill is fully undestood. The linked article gives no indication of a time frame for that review.
In 2010, Bradford County had 280 Marcellus Shale violations issued, with 386 Marcellus wells drilled in the same period. That works out to an average of three violations issued for every four wells drilled in the county.
Oil and gas violations in Bradford County, PA in 2010. Please click the gray compass rose and double carat (^) to hide those menus.
Earlier this month, I examined 2010 oil and gas violation data for Pennsylvania on a summary level. Now I’m going to focus just on Marcellus Shale wells, and from the perspective of trying to determine the extent that drilling operators and location have on the likelihood of increased violations for any given well.
There are a number of ways in which this could be done. Although I am interested to see if the number of wells drilled in an area or by a drilling operator has a noticeable effect on violations, I have limited both investigations to 10 or more Marcellus Shale wells, both to avoid the erratic results of small sample sizes, and because the large number of results tends to make for crowded data displays.
Violations are only for 2010, both because it is current, and with 1,544 records, it is sufficiently large to make some generalizations about. As for wells, I decided to go for all drilled Marcellus Shale wells rather than just the 2010 wells, because wells that were spudded between 2006 and 2009 might well be included on the violations list. Also, the overall number of wells is a handy way to gauge the relative weight of a given operator or county on the industry as a whole.
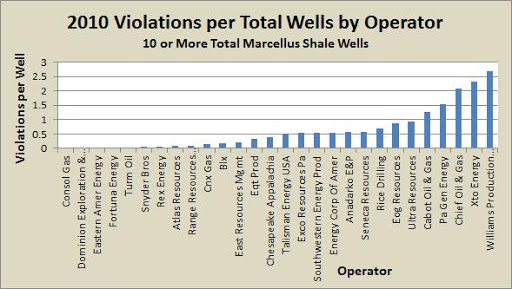
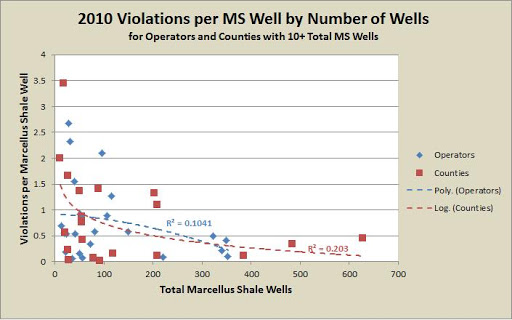
2010 Marcellus Shale (MS) violations per total MS well, for counties with 10 or more MS wells.
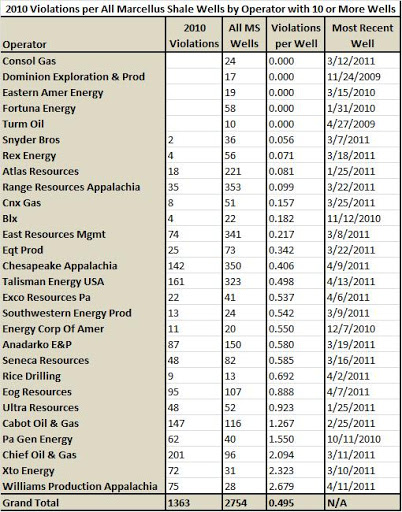
2010 MS violations per total MS well, for operators with 10 or more MS wells.
There are, of course, a number of issues once we start looking at the data in detail. One of the biggest challenges is that many of these wells change hands, or else the companies that drill them change hands or are no longer active in the Marcellus Shale drilling industry in Pennsylvania. For example, in a previous analysis, I noted that Turm Oil had a large number of violations per well, and now they had none at all. I checked to see when their most recent well was drilled, and found my answer:
List of operators with 10 or more MS wells, with 2010 violations, frequencies per well, and the date of the most recent well drilled
Turm Oil hasn’t drilled a Marcellus well in almost two years. Looking at the chart above, Turm and Dominion don’t really belong in this analysis, and Eastern American and Fortuna may not for 2011. These four operators account for everyone with 10 or more total Marcellus Shale wells and no violations in 2010 except for Consol—kudos to Consol!
Does the number of wells impact violations?
Clearly, there is a tremendous range of violations per well, both in regards to who the operator is, as well as where the well is located. My hypothesis going into this analysis was that the more wells an operator drilled or the more wells drilled in a county, the fewer violations per well there would be.
I had several reasons for suspecting this to be the case. First of all, think of what must be done for a drilling operation without violations being issued. The site must be carefully placed, in accordance with all applicable regulations. The site must be prepared, taking into account all ground disturbing regulations. Then you have to drill through thousands of feet of rock, making sure that there is a structurally sound casing and cementing job to prevent gas migrations. Then there is the horizontal drilling, and the hydraulic fracturing. All along the way, not a drop of fracing fluid, diesel fuel, brine, or really anything else can touch the ground or enter Pennsylvania’s waters in any way. And when the drilling is done, the site must be restored in a timely fashion. And those are just a few of the regulations that the drilling operators agree to when they undertake drilling operations in Pennsylvania.
Let’s face it—that’s a lot to achieve. In order to consistently come in and out of a site with a clean record has got to take some practice. I’ve heard from industry sources that Marcellus Shale wells cost about $5 million to drill, so to do it right without cutting corners clearly takes significant resources as well.
In addition to all of that, a county level map of Marcellus Shale violations per well shows that the counties which produce the most Marcellus Shale gas wells are not the ones with the highest number of violations per well.
Map showing Marcellus Shale violations per county. Counties outlined in red have 100 or more Marcellus Shale wells. Click the gray compass rose and double carat (^) to hide those menus.
So is there then any correlation between the number of wells drilled and the violations issued? Let’s take a look (1).
The equations for the trendlines were calculated by Excel, and I selected the ones with the highest R-squared values. I was surprised that the best fit for operators was a convex polynomial. In the graph above, there is indeed a cluster of operators with between 300 and 400 wells, and with about 0.5 violations per well or less, but on the other end of the spectrum, the violations per well are spread far apart. There are so many operators big and small with around 0.5 violations per well or less that it seems some other factors must be at play for all of the operators that exceed that value by a significant margin. Perhaps not everyone will achieve zero violations like Consol did in 2010, but it doesn’t seem reasonable that Williams Production Appalachia should have more than twice the amount of violations as Range Resources Appalachia, despite having only 8 percent of the number of wells as the gas extraction giant.
The correlation was a bit stronger for the counties than for the operators. I’m not entirely sure what factors are at play here, other than perhaps having a crew that is well familiar with the geology of the region and all the specific challenges associated with that. Again though, that doesn’t seem to explain why Wyoming County would have 3.44 violations for every Marcellus Shale well, while those in Washington county can only expect a violation for less than one well out of eight drilled.
[photo removed]
Again, I’m sure that the way this analysis was set up had an effect on some of these numbers, and Wyoming is certainly a smaller sample size than Washington. I also don’t want to infer that there aren’t problems when large operators drill in well established portions of the Marcellus Shale. What’s more, while over 1,500 Marcellus Shale violations in a year is a huge number, it likely doesn’t account for all of the actual incidents, just the ones that the DEP can demonstrate, apparently beyond a shadow of a doubt (2). And even in the best scenario, there are significant impacts upon the land and neighboring residents near the well site.
I am suggesting, however, that there are companies that need to do better in their efforts to comply with laws designed to protect Pennsylvanians from pollution and other deleterious effects of oil and gas drilling. Excuses that environmental regulations are too strict don’t hold water, as their competitors are closer to compliance, sometimes dramatically so.
In order for Excel to be able to calculate all of the various regression lines, counties and operators with zero violations per well had to be excluded from this analysis.
I have personally talked to numerous residents who feel that their well water was spoiled by gas operations on neighboring lands. A common theme in their complaints is that the DEP places the burden of proof on residents that their wells were not spoiled before drilling operations began–an almost impossible situation for the residents to predict and be proactive about.
https://www.fractracker.org/a5ej20sjfwe/wp-content/uploads/2025/09/2025-Wordmark-Logo.png00Matt Kelso, BAhttps://www.fractracker.org/a5ej20sjfwe/wp-content/uploads/2025/09/2025-Wordmark-Logo.pngMatt Kelso, BA2011-04-21 10:57:002020-07-21 10:37:55PA Marcellus Shale Violations by Operator and County
Reposted from the Department of Environmental Protection website:
HARRISBURG — At the direction of Governor Tom Corbett, acting Department of Environmental Protection Secretary Michael Krancer today called on all Marcellus Shale natural gas drilling operators to cease by May 19 delivering wastewater from shale gas extraction to 15 facilities that currently accept it under special provisions of last year’s Total Dissolved Solids (TDS) regulations.
“While the prior administration allowed certain facilities to continue to take this wastewater, conditions have changed since the implementation of the TDS regulations,” Krancer said. “We now have more definitive scientific data, improved technology and increased voluntary wastewater recycling by industry. We used to have 27 grandfathered facilities; but over the last year, many have voluntarily decided to stop taking the wastewater and we are now down to only 15. More than half of those facilities are now up for permit renewal. Now is the time to take action to end this practice.”
Below is a snapshot creating by John Detwiler using FracTracker’s DataTool. It shows the wastewater treatment facilities mentioned in DEP’s ‘voluntary’ advisory of April 19, 2011. The larger the star, the greater the facility’s permitted wastewater flow (mgd).
To close the legend on the left, click the compass.
https://www.fractracker.org/a5ej20sjfwe/wp-content/uploads/2025/09/2025-Wordmark-Logo.png00Matt Kelso, BAhttps://www.fractracker.org/a5ej20sjfwe/wp-content/uploads/2025/09/2025-Wordmark-Logo.pngMatt Kelso, BA2011-04-19 15:59:002020-07-21 10:37:55DEP Calls on Natural Gas Drillers to Stop Giving Treatment Facilities Wastewater
The Center for Healthy Environments and Communities has received a lot of inquiries regarding the various reports that CHEC’s director, Conrad Dan Volz, DrPH, MPH, is leaving the University of Pittsburgh Graduate School of Public Health. This is indeed true, but many of the reports are misleading as to why and what this means for FracTracker. Since Dan’s decision inevitably affects CHEC and FracTracker, we thought it best to post a blog discussion about it.
What’s next for Dan Volz?
PopCity, a fantastic and local e-magazine and website, recently interviewed Dan on the subject after hearing the news that he is not renewing his faculty contract at GSPH, and therefore can no longer serve as the director of CHEC. Here are some of the excerpts from their discussion:
Are you walking away from the concerns you’ve been raising about Marcellus Shale drilling and the dangers it poses to our health and the environment?
Not at all. My intention is to be more of an advocate for public health around the issue of Marcellus Shale.
I am leaving the university to work on these greater questions. It’s time that someone rose up and spoke out about environmental policy and how it’s not only playing out in Southwestern Pennsylvania, but the world…
Will you continue your work with FracTracker?
This has yet to be worked out. I’m leaving the university. FracTracker is a tool for citizens and environment organizations, as well as the industry and government, to look at the potential impacts of this process. It is managed by CHEC. The software license is owned by the Foundation for Pennsylvania Watersheds… Certainly I will be participating as a citizen can on FracTracker. I may have a more formal arrangement in the future.
This article has been archived and is provided for reference purposes only.
April 7 and 8th marked the University of Pittsburgh Graduate School of Public Health’s annual academic poster competition for students to highlight their research and public health practice.
On the day of the Deans Day awards ceremony, April 15th, Samantha received the Rosenkranz Award for the project judged to be the most significant contribution to the public health field, as well as the overall Dean’s Day third place award in the doctoral category. Drew received the EOH Keleti Award for environmental excellence. Congratulations to Sam and Drew, as well as all of the Dean’s Day award winners.
https://www.fractracker.org/a5ej20sjfwe/wp-content/uploads/2015/12/CitSci-Event-Feature.jpg400900FracTracker Alliancehttps://www.fractracker.org/a5ej20sjfwe/wp-content/uploads/2025/09/2025-Wordmark-Logo.pngFracTracker Alliance2011-04-18 12:15:002020-07-21 10:37:542011 Deans Day Awards
2011 Marcellus Shale drilled wells (green circles) and permits issued (red stars). For a larger, dynamic view, please click the image. All Marcellus Shale permits issued (red circles) and drilled wells (green circles). Please zoom in for a closer look in the denser portions of the map.
Sometimes it seems like the oil and gas industry is in an awfully big hurry. They are in a hurry to get the mineral leases, presumably because if they don’t, some other operator will. They are in a hurry to get their drilling permits from the Department of Environmental Protection (DEP)–already this year, the DEP has issued 979 permits from the Marcellus Shale formation alone. And sometimes they are in a hurry to get the drill in the ground. Sometimes, however, they are not.
This does not mean that I think the 444 Marcellus Shale wells that have been spudded (time when the drill first hits the ground) so far this year is a small number. After all, today is just the 104th day of the year, which means that on average, almost 4.3 Marcellus Shale wells are started every single day. That’s a lot of industrial activity, and yet it reflects well under half of the 9.5 Marcellus Shale permits that DEP secretary Michael Krancer signs off on every day.
The longer term trends are similar: Of the 6,092 Marcellus Shale wells with active permits(1), 2,574 have been drilled. That represents about 42 percent, meaning that the 45 percent clip for 2011 is actually running a bit ahead of schedule. All of this brings a couple questions to mind:
Why does the oil and gas industry get more than twice as many permits as they are able to drill?
What’s the lag time for drilling once the permit is in hand?
I’m still scratching my head over the first one. I have been told that the siting and permitting processes are so involved and expensive that once the permit is in hand, the industry will drill the site, but the numbers don’t seem to reflect that as being fully true. Certainly, the 107 oil and gas drilling rigs available in Pennsylvania right now is a limiting factor in how many wells are drilled, but that doesn’t explain why the permitting process is years ahead of the drilling queue.
As for how long it takes to drill once a permit has been issued, there are means of answering that question. First, I matched the permits data to the spuds data using the wells’ unique API numbers, finding 2,804 matches for 2,574 distinct wells (2)(3). The second step was to subtract the number of days between the spud date and the permit date to determine the lag time for those permits which have been drilled, and where API numbers did match up. Let’s take a look at the results:
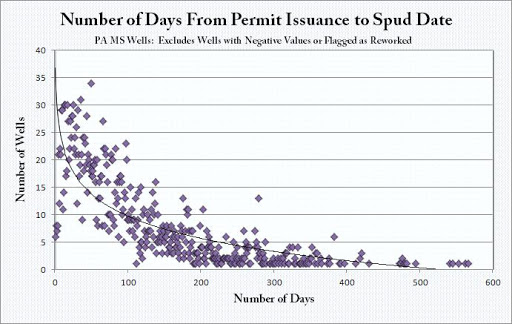
Number of days between permit issuance and spud (initial drilling) date.
Some of the 39 wells marked as “reworked” may not have originally been Marcellus Shale wells, so they were not included in the chart above. In addition, there were two negative values, for which it would appear that well was drilled before the permit was issued. I am assuming those are attributable to clerical error, and those wells were not included in the chart above (4).
Number of days from permit issuance to spud date for Marcellus Shale wells. Please click the “i” and then a map feature for more information. Please click the gray compass rose and double carat (^) to hide those menus.
Overall, the value ranges from -86 to 2,274 days, with an average turnaround time of just over 100 days. If we omit the outliers discussed above, the values range from 1 to 566 days, with an average of just under 99 days.
After looking at these results, I am surprised by the vast range, and beyond the number of available rigs, I can only speculate as to what factors go into determining this. It also seems remarkable that there are wells that can get the equipment in place, the site prepared, and the drill in the ground the very next day after the permit was issued. And yet, for all of that celerity, sometimes it takes well over a year to start churning dirt.
This data comes from the DEP’s Operators With Active Wells Inventory section of their Reports page. What I called “active permits” are actually “active wells” according to the DEP. These include all wells for which the permit has been issued but have not yet been plugged. This would include wells that hav not been drilled, thus my distinction.
Both datasets had some duplication of well numbers. All records that were exact duplicates were removed, meaning that the remainder had at least slight variances in one or more columns.
I should mention that the number of matches to the permits list means that there are 93 mismatches between the two datasets. In theory, all of the drilled wells should be on the permit report, but for now, let’s take the 97% match rate and move forward.
All values are included in the posted dataset, and therefore the DataTool map.
https://www.fractracker.org/a5ej20sjfwe/wp-content/uploads/2025/09/2025-Wordmark-Logo.png00Matt Kelso, BAhttps://www.fractracker.org/a5ej20sjfwe/wp-content/uploads/2025/09/2025-Wordmark-Logo.pngMatt Kelso, BA2011-04-14 14:07:002020-07-21 10:37:54How Long Between MS Permit Issuance and Drilling in PA?
This page has been archived. It is provided here for historical purposes.
We at the Center for Healthy Environments and Communities would like to congratulate and recognize the incredible efforts of our colleagues at Cornell University for their recent research study published in Climate Change Letters, entitled “Methane and the greenhouse-gas footprint of natural gas from shale formations.” Led by Dr. Robert Howarth, the study sought to determine the effect that natural gas drilling in shale formations has on the atmosphere over a 20-year period.*
Methane gas, the major component of natural gas, has been promoted by some entities as a greener energy alternative than the use of coal because it burns cleaner. Results of this recent Cornell study, however, indicate that the methane emissions that result from the natural gas industry may result in a greater greenhouse gas footprint than other forms of energy extraction. This is partially due to the fact that methane is a very potent greenhouse gas.
From a researcher’s perspective, accurate and up-to-date data regarding the amount of methane gas that escapes during the life cycle of natural gas drilling is difficult to access – if it exists at all. To better-understand how natural gas drilling in shale formations will affect public health and the environment, especially as this industry develops, we must continue to conduct peer-reviewed research like the most recent Cornell study. Full Report
* A criticism of this study has been the shorter, 20-year time span they used to analyze the data. This approach was taken because methane does not stay in the atmosphere as long as other greenhouse gases like carbon dioxide.
https://www.fractracker.org/a5ej20sjfwe/wp-content/uploads/2025/09/2025-Wordmark-Logo.png00FracTracker Alliancehttps://www.fractracker.org/a5ej20sjfwe/wp-content/uploads/2025/09/2025-Wordmark-Logo.pngFracTracker Alliance2011-04-13 15:51:002020-07-21 10:37:54Cornell study assessed climate change impact of natural gas drilling