New Feature Announcement: Geocoding of address data on FracTracker’s DataTool

Archived

This page has been archived. It is provided for historical reference only.

By Josh Knauer – Rhiza Labs

Rhiza Labs is proud to announce the addition of an important new feature to its Rhiza Insight tool (the program that powers FracTracker’s DataTool): geocoding. Users are now able to import a spreadsheet of street addresses within Rhiza Insight, and the tool will automatically assign a latitude/longitude for each valid address. This means you can now create a maps of customers or members, or any other set of locations that are important to you. This feature is currently limited to US-based locations for the time being.

Here’s exactly how this feature works. Let’s say you have a spreadsheet of addresses that you would like to see on a map. In this case, I have a spreadsheet of the addresses of non-profit organizations in Santa Fe, NM, along with their assets, revenue and expense numbers (btw, we got this data from the nice folks at Socrata):

Read more »

What’s the Big Deal with FracTracker’s Snaphots?

Archived

This page has been archived. It is provided for historical reference only.

A picture might be worth a thousand words for most purposes, but when you are talking about spatial data, pictures are sometimes the only way to explain things. This goes well beyond the simple question of where things are, and into the realm of how things relate to one another. Fundamentally, what makes the snapshots on FracTracker’s DataTool so important is their ability to answer questions that users have about the oil and gas industry, and to share those results with everyone else.

So what kinds of questions can be answered with a FracTracker snapshot?

Comparative Analysis
Are the ozone monitoring stations going to detect Marcellus Shale activity? Marcellus Shale Wells and Ozone Monitoring Stations [link removed]

Finding Locations
Have there been any oil and gas violations near where I live? Pennsylvania DEP violations by well type [link removed]

Multiple Datasets
What is the extent of the Marcellus Shale gas industry when you cross state lines? Marcellus Shale: Drilled sites in PA and Approved Permits in WV [link removed]

Satellite Imagery
What does a full brine pit look like? Full Pit Near Evans City, PA [link removed]

How accurate are the location data on FracTracker? Well Site Closeup Near Evans City, PA [link removed]

Understanding Impacts
It seems like there is gas drilling activity everywhere. Are some locations more affected by the industry than others? Total Violations by County, Utah [link removed]

Investigating the US gas drilling boom video

Archived

This page has been archived. It is provided for historical reference only.

[media removed]

Complements of Nadia, EARTHWORKS. This video is being shown widely in Britain, as Europe moves into shale gas exploration (involving the investment of U.S. companies).


Recap of the GSPH Shale Gas Conference (Afternoon)

Archived

This page has been archived. It is provided for historical reference only.

If you were unable to attend the University of Pittsburgh Graduate School of Public Health’s all day conference, Health Effects of Shale Gas Extraction: What is known, and what can we predict?, here is a recap of the afternoon sessions for you provided by CHEC’s staff.
Program | Morning Summary | Afternoon Summary (below) | Presentation Videos | Survey Results

“Air Quality Monitoring Strategies”

Robert Field, PhD, a research scientist at the University of Wyoming’s Department of Atmospheric Science, spoke about factors leading to the creation of wintertime ozone in Sublette County, Wyoming. The sudden appearance of the phenomenon was surprising to residents, since ozone is usually an urban problem during the summertime. Dr. Field examined the link between the ozone production and the natural gas industry in the state.

The conditions to create ozone are known, and include the presence of ozone precursors, sunlight, and other atmospheric conditions. Rural Wyoming made for a convenient laboratory to determine the scope of the contribution of the gas industry, because unlike Pennsylvania, it was not already present in the air from other industrial activities. Dr. Field indicated that the Wyoming Department of Environmental Quality has already been using the information to predict days favorable to the creation of ozone, and has even worked to prevent it by asking operators to limit their polluting activities on those days.

Responding to questions from the audience, Dr. Field indicated that environmental conditions in Pennsylvania are less favorable for wintertime ozone in particular, although ozone in the summer remains a concern.

“Addressing Combined Effects of Air Pollution and Social Stressors Exposures on Health in Communities Affected by Natural Gas Fracturing”

Jane Clougherty, MSc, ScD, a new faculty member of the University of Pittsbrugh’s Graduate School of Public Health, presented Friday on her previous work concerning air monitoring in New York City and the culmination of indirect impacts to various users. Dr. Clougherty’s work focused on air pollution monitoring schemes, needs and assumptions of air monitoring for multiple-source emissions.

Passive ambient air monitoring can produce powerful data if strong variability is present, as well as numerous monitoring locations. The focus of her talk was not to demonstrate how monitoring could be implemented in or around gas extraction sites, but was to provide a case study to encompass impacts across communities and regions and how stress can relate to these various levels. Indirect or non-primary effects, social stressors, and potentially synergistic social-environmental effects, can certainly apply to the Marcellus Shale boom. Health research has indicated that chronic stress can affect the immune, endocrine, and respiratory systems, and even susceptibility to the common cold. Dr. Clougherty implied very well that the indirect effects of a new industry – such as natural gas extraction – can among other impacts, lead to stressed social interactions. These types of interactions include increases in:
  • heavy construction,
  • truck and vehicular traffic,
  • noise,
  • services demanded, and
  • potential changes in community coercion and composition.

Her research and others have suggested that social stressors combined with pollution exposures may act synergistically by altering an individual’s susceptibility.

Dr. Clougherty proposed that in addressing impacts such as those posed by this industry, we must look at all of the affected users. Her examples included the end users in the New York City limits. City officials have proposed regulations to ban the use of lower quality heating fuels, stating that just 1 percent of NYC buildings account for about 87 percent of the pollution attributed to the combustion of these oils. Regulations would encourage cleaner burning sources, such as natural gas. This could positively affect pollution levels in these areas, specifically Manhattan, though upfront costs remain an issue. This example demonstrates a positive end user effect for the people of NYC, that Dr. Clougherty claims must be added to the impacts equation. However, she also stresses this is not panacea for energy consumption; renewable energy should be the focus.

Understanding social-environmental interactions is a complex and entangled field of study. It is crucial that researchers like Dr. Clougherty are working on these issues and are asking provocative questions while proposing multi-factorial grand perspectives.

“Short-Term Air Quality Impacts from Marcellus Shale Operations in Southwest PA”

Chief of the Pennsylvania Department of Environmental Protection’s (PA DEP) Air Quality Monitoring Division, Nick Lazor, addressed the Department’s efforts to conduct short term air quality sampling near Marcellus Shale drilling operations. The PA DEP sampled five counties in Southwestern PA using an array of gas chromatography and mass and infrared spectroscopy instruments to assess concentrations of ambient (outdoor) air target pollutants.

Preliminary data indicates methane, propane, ethane, and benzene were present at Marcellus Shale compressor sites. Additionally, methyl-mercaptan was detected above odor threshold, while carbon monoxide, carbon dioxide, and ozone were not detected above National Ambient Air Quality Standards. The PA DEP recognizes the importance of this initiative and plans to evaluate further monitoring efforts after a comparative analysis between all five sites has been concluded.

“Use of Health Impact Assessment to Help Inform Decision Making Regarding Natural Gas Drilling Permits in Colorado” (Roxana Witter, MD, MSPH; John Adgate, PhD; and Jim Rada)

Previously, Samantha Malone wrote a blog post about their presentations after attending the American Public Health Association conference in Denver, CO this year. Check it out!

“Spatial Data Infrastructure for Evaluating the Health Impact of Gas Well Drilling in North Texas”

David Sterling, PhD, CIH is the Director or the Division of Environmental and Occupational Health at the Saint Louis University School of Public Health. Dr. Sterling knows Texas because he is from Texas and there are issues in Fort Worth, Texas due to the development of the Barnett Shale. Over-development has resulted in close proximity of drilling and wells to homes, elementary schools, other buildings, and other populated locations. Conducting retrospective (after-the-fact) exposure analyses on these types of locations can provide starting points for hypotheses.

Drilling in the Barnett Shale has occurred since the 1970s, and in densely populated areas, including Denton, Tarrant, and Johnson counties since 1999. There are over 16,000 wells in these counties, 26,000 wells in the Barnett shale and other shales, and 20,000 permitted wells. Current issues involve encroaching proximity. High benzene levels have been measured in Dish, TX, and other locations such as on an organic goat farm.

The Texas Commission on Environmental Quality (TCEQ) maintains monitoring website for air emissions but more information and the development of a spatial data infrastructure is necessary for air and hydro (water) models. The data collection also needs to be reported, made visual, and have transparency. One of the many research goals should be to connect this data with health outcomes. Data challenges in the Barnett region include gathering good population estimates, information on how many wells are contaminated, and getting hold of malleable data. And finally, Dr. Sterling emphasized the need for this information to be available for decision makers.

“Research Methods and Results of the Baseline Socioeconomic Study of the Impact of Marcellus in Pennsylvania”

Teri Ooms is the Executive Director of The Institute for Public Policy and Economic Development. Ms. Ooms recently undertook a project to assess the current social and economic conditions relating to gas well development in the Marcellus Shale formation in Pennsylvania, with the goal of obtaining baseline data for future longitudinal assessment of subsequent community changes that occur in Appalachian counties. The study consisted of a survey of Marcellus residents and interviews with key informants (elected and appointed leaders, representatives of human service and educational agencies, and civic organizations) in five Pennsylvania counties (Lackawanna, Luzerne, Westmoreland, Greene, and Susquehanna) and five counties in other shale-rich states (Texas and Arkansas). This study was conducted to gather and assess the perceptions of current and future economic, social, and environmental impacts associated with large scale natural gas development.

Of the many study results that Ms. Ooms discussed, people living in the Marcellus region generally knew very little about the nature and development of the industry. Few people actually sought out objective information from authoritative sources. Many felt that as a result of the industry coming into PA, the quality of their natural environment and drinking water would worsen, while employment options and training would improve. Ms. Ooms noted there was tension within communities because of varying lease and royalty rates and tension when there is a separation between land ownership and mineral rights (called a “split estate”). Most participants supported a severance tax in PA, and almost all of them agreed that if a severance tax is enacted, some of the money should be allocated for local government expenses.

Results from Texas and Arkansas both indicated that people felt there were strong economic benefits to drilling. The separation of land and mineral rights has also created tension in those states. Participants have seen education programs change to help local people obtain industry jobs. Other problems identified by those participants are similar to those highlighted by PA participants. You can find out more about the Institute and its study here.

“How Should We Think About the Economic Consequences of Shale Gas Drilling?”

Susan Christopherson, PhD is an economic geographer whose research and teaching focus on economic development, urban labor markets, and location patterns in service industries, particularly the media industries. According to Dr. Christopherson’s presentation, the southern tier of New York state is already experiencing the impact of the Marcellus Shale boom. Truck traffic has increased and land values are rising, even though drilling is located in Pennsylvania and still excluded from New York. Money is coming into these areas and those surrounding areas with active drilling, but certain questions need to be answered, including: “What is the cost? For what period? What jobs will be created? What are the long-term outcomes?”

In order to appropriately address these questions, the factors that influence the pace and scale of drilling must be determined. These can include transportation costs, industry competition, regulatory capacity and requirements, taxes, and shortages. Current policy is projecting a boom and bust cycle from the shale gas drilling industry. The drilling cycle is “front-end” loaded, to drill as quickly as possible while Pennsylvania does not have a severance tax. Fifty percent of the total gas produced by a well is extracted within the first year, and production beyond five years is uncertain. The repetitive short-term process of drilling multiple wells must be considered, which means the majority of jobs are only temporary. Also, Dr. Christopherson advised analyzing the spending patterns for landowners who have received lease money. Large sums, rather than multiple disbursements, have the potential to be splurged.

The total cost to the communities has not been fully realized. Funding for schools and roads are currently the only area where there is any leverage from established policy. The boom and bust cycle will strain local economic systems. After the bust, communities are left with too many schools, police, teachers, and services without a population and funds to support them. Responsible economic development comes from population growth, income growth, and economic diversity. In gas-producing counties, incomes actually grow more slowly. Evidence from western states shows less economic diversity and decreased ability for alternative investments in counties with drilling. On the other hand, economies in Texas grow when drilling and gas production expands in other states, because Texas is center for executive operations of the natural gas industry and therefore has the highest paying jobs. Plans to prevent accelerated, short-term production cycles need to be proposed. Policy does matter! Communities need to be savvy to industry activity and plans. Local economies need to capture all available revenues, ensure remediation, and set up tax systems.

Conversation with participants about the gaps in the science and future directions from the afternoon speakers

Conrad Dan Volz, DrPH, MPH was the moderator for the afternoon sessions. Due to time restrictions, audience questions and research gaps are being requested in a follow up survey. Would you like to contribute your own comments about the conference? If so, fill out this survey. [link removed]

Conference Summary Blog Post Contributors

FracTracker Data Index Now Available on the Blog

Archived

This page has been archived. It is provided for historical reference only.

Over the last few months we have received a lot of requests for the datasets on FracTracker’s DataTool to be organized in an index. After a lot of hard work by our data manager, Matt Kelso, and tedious HTML work by me, your wish has been granted. There is now a new page on the blog called the “Data Index” that lists all of the major data categories available on the DataTool, as well as a few key datasets that are often requested by registered users. (Catchy, I know.) We’ll try to keep it as up-to-date as we can, but please let us know by commenting on this post below if there is something you still just can’t find.

Is there a Link between Earthquakes and Shale Gas Drilling?

Archived

This page has been archived. It is provided for historical reference only.

By Samantha Malone, MPH, CPH – Communications Specialist, CHEC, GSPH; DrPH Student, GSPH

While we don’t typically post about earthquakes on FracTracker’s blog, as public health professionals, we should be prepared for such incidents. Apparently, various towns have reported unusual seismic activity near shale gas drilling operations. For example, Residents in Guy, Arkansas are experiencing “swarms” of earthquakes – sometimes at rates of three to four a minute. While this isn’t the first time in history that the town, which sits in the middle of a tectonic plate in the Fayetteville Shale, has had an earthquake, residents cite the natural gas industry as the cause. (The deputy director of the Arkansas Oil and Gas Commission sees circumstantial evidence related to the deep well injection that is occurring there, as well.) The true trigger of these minor earthquakes is the focus of researchers from the University of Memphis and the Arkansas Geological Survey.

A quick Internet search shows that similar speculations about the link between the natural gas industry and earthquakes have been voiced in West Virginia, Texas, and several other states experiencing an influx of deep well injection (a liquid waste disposal system). Is there really a connection between the two? Do the geologic formations that make shale gas drilling possible have higher rates of earthquakes naturally? (Probably not in PA based on the hazard map produced by the USGS.)

The map below from the DataTool shows all of the shale gas plays in the continental U.S. By clicking on the “i” in the gray toolbar and then on a pink region, you can inspect each play. Just click “view” when the pop-up box appears to learn more.
[map removed]

Presently, we do not have drilling data from the Fayetteville Shale on FracTracker. If any person / organization has already obtained this information and would like to share it, we invite you to upload it onto FracTracker’s DataTool (Registration is required on our site, but at least it is free.)

Here is a quick list of articles from Google Scholar about induced seismicity if you’re interested, and a really interesting documentary website about people who live and work in shale gas plays across the U.S.

Recap of GSPH’s Shale Gas Conference (Morning)

Archived

This page has been archived. It is provided for historical reference only.

If you were unable to attend the University of Pittsburgh Graduate School of Public Health’s all day conference, Health Effects of Shale Gas Extraction: What is known, and what can we predict?, here is a recap of the morning sessions for you provided by CHEC’s staff.

Program | Morning Summary (below) | Afternoon Summary | Presentation VideosSurvey Results

“Health and Safety Considerations in the Extraction of Fossil Fuels”

Bernard Goldstein, MD is a professor in GSPH’s Department of Environmental and Occupational Health, as well as the school’s past dean. Dr. Goldstein started off the conference with a discussion about the need for public health, government, and industry to use proper risk communication techniques when discussing risk of natural gas drilling with the public. For example, if the industry had openly discussed the ingredients of the fluid used to hydraulically fracture the shale and the purposes of those ingredients when hydraulic fracturing was first used, for example, it would have prevented a significant amount of [often times] unnecessary fear regarding the fact that the exact composition of each company’s well stimulation mixture is proprietary (a trade secret).

Additionally, Dr. Goldstein called for public health to conduct prospective research on the potential public health impacts of shale gas drilling, because it is difficult to make connections retrospectively (looking back).

He also noted that Pennsylvania is at disadvantage when it comes to our public health workforce (the folks with the expertise and know-how to look out for the welfare of PA residents). – Only 6 of 67 counties in PA have a public health authority, and we have the smallest workforce in this field of any state in the U.S. In essence, “PA is a third world country in relation to its inadequate public health workforce.”

“Inorganic Geochemistry of Marcellus Shale Hydrofracturing Waters”

Carl S. Kirby, PhD began his presentation by defining the terms “slick water” and “frack-water”, since the chemistry of each is so different. Slick water consists of water, proppant, and slicking agents that are pumped down into the drilled well. Frack water identifies the liquids returning up to the surface after hydrofracturing has been completed. This liquid includes the slick water, as well as a concentration of brine water from within the well. The concentration of brine is largely irregular, and depends upon the geochemistry of the drilled strata, and the amount of time the slick water remained in the well bore, before returning as frack water. The extent of dissolution of salts/brines in the frack water is a major concern, since the current treatments of frack water do not provide an assurance that these chemicals can be removed from the frack water. Therefore, the options for frack water are storage, recycling and reusing, transporting the frack water to be treated at specialized facilities, or reinjection. Much of the frack water goes to Ohio where it is injected into deep wells – a method the industry calls a “closed loop.”

The chemical characteristics of frack water are dominated by high TDS, specifically: Na, Ca, Cl, Ba, Sr, and low concentrations of Mg, SO4. The frack water is radioactive, and has a pH in the 5-8 range, which is rather neutral. A Durov diagram was presented to show the signature of anions and cations. Some frack waters are also 1/3 solids. The volume of flowback frack water is very high at first and then slows down while salinity is thought to increase dramatically with time, although there is currently not enough data to confirm the increasing salinity. The radioactivity was investigated; the gross alpha is typically due to radon gas, which is short-lived. The gross beta on the other hand is of higher concern, as it typically signifies radium, which remains particulate-bound.

Technologies are available to characterize certain aspects of the drilling, fracking, and production phases of natural gas production. Hydro-geological modeling with the geochemical program PhreeqC has been conducted by Dr. Kirby’s work group. Modeling results indicate that the main source of iron (Fe) is pyrite, while the main source of barium (Ba) is from organic acids. Other techniques are also available to help prevent environmental degradation. Using conductivity to investigate leaks in the frack water infrastructure is a possibility, but one would have to be careful when interpreting changes in surface water quality. In particular, conductance is non-specific, and there is also the potential for lack of mixing in surface water such that the monitors miss the event.

“Trace Metal Chemistry of the Marcellus Shale”

Tracy Bank, PhD discussed the chemistry of the Marcellus, beginning with the geology of the formation. Shale is a sedimentary (meaning deposition) rock type consisting of a fine-grained composition of a mixture of minerals. Though mostly clay minerals exist, metals species can exist in varying amounts. The Marcellus Shale is considered a black shale that was formed in relatively deep waters, devoid of oxygen. Trapped decaying matter in and around these areas nearly 400 million years ago lent to the conservation of natural gas, oil, and coal. Conditions that conserve organic matter also favor the conservation of redox sensitive metals such as; iron, zinc, molybdenum, and uranium.

The solubility of metals, meaning the ability to form a homogeneous solution or become mobilized with water (solvent) for instance, is partly dependent on the amount of oxygen, amount of pressure, and availability of a solvent. Dr. Bank’s research focused on the solubility of uranium, and in her presentation on Friday, she explained that the solubility of uranium is dependent upon redox conditions. Also the concentrations of uranium, for instance, are higher where there are higher levels of total organic carbon, and higher levels of natural gas is certainly what industry is seeking. Redox reactions, in short, describe the changing of a molecule’s oxidation number, commonly in the form of a gain or loss of electrons.

Dr. Bank presented that the shale layer and rock formations thousands of feet underground, are surely lacking oxygen, and thus are in a reducing redox state. When large amounts of pressure and water are introduced into these underground formations by fracing, the oxidation states and reducing conditions can be altered leading to the mobilization of uranium, iron, and zinc. This can and does happen naturally to rock layers exposed to weathering, as it does in the Marcellus Shale outcrops. Dr. Bank’s previous work, focused on Superfund sites containing relatively much higher levels of uranium and other radioactive contamination. Interesting to note, that in those projects – to clean contaminated areas – the bioremediation efforts focus on creating reducing redox conditions; the opposite of what fracing induces.

“Unconventional Gas Extraction in Legacy, Energy Production Landscapes: Uncertainties in History, contamination, and Interactions”

Dan Bain, PhD, assistant professor in the Department of Geology and Planetary Science at the University of Pittsburgh addressed the correlation of Southwestern Pennsylvania’s legacy landscapes and natural gas extraction. An important public health concern is the potential for the interaction of varying water compositions used in the Marcellus Shale production process and mobilization (or movement) of metals through legacy surface sediment i.e. sediment resultant from the effects of coal mining on the region. According to Dr. Bain, sediment drives most chemical interactions at the water-sediment interface. Therefore, it is critical to continue to monitor ground and surface water for increases in metal content. The mobilization of sodium is of particular concern to riparian ecosystems.

As coal mining left its imprint on the region, gas extraction from Marcellus Shale will undoubtedly leave another set of legacy sediment types. Dr. Bain proposes that continued research regarding comprehension of flood plains and near surface bed rock is necessary to appropriately model possible outcomes from movement of industry specific waters through legacy sediment.

“Water Management Challenges in Marcellus Shale Gas Production”

John Veil presented information based on his work funded by the U.S. Department of Energy. First, background information about shale gas and how it is developed was presented. The types of gas exploration include coal bed methane, conventional on-shore and off-shore, gas associated with crude oil, unconventional on-shore, and net imports. Mr. Veil stated that the contribution of shale gas is bound to expand. Shale is located in many places in US, and the most significant are the: Barnett (Texas), Fayetteville (Arkansas), Antrim Shale (Michigan), Haynesville (Louisiana), Marcellus (Northeast U.S.), and Woodford (Oklahoma). There are also shales located in Canada, the Horn River Shale in British Columbian, and Nontney Shale in British Columbia and Alberta. The steps in the shale gas extraction process include: gaining access to the gas through property leasing or acquisition, searching for natural gas, preparing the site, drilling the well, preparing a well for production (includes hydraulic fracturing), and finally gas production and water management.

Mr. Veil then elaborated on water issues:

  • During site preparation, storm water runoff should be considered from all land areas disturbed during construction, which includes following proper sediment control practices and stabilizing exposed surfaces (generally prepared with gravel). Different operators follow different degrees of storm water management.
  • Water is also necessary for the drilling fluids and can range from 1 million gallons in the Haynesville Shale to 60,000 gallons in the Fayetteville Shale. The amount of water depends on the types of drilling fluids used and the depth and horizontal extent of the wells. The Marcellus Shale drilling volume falls near the lower end of this range at 800,000 gallons per well. Drilling waste is then sent to lined pits.
  • Hydraulic fracturing is another major water issue. The water needed for a single well in the Marcellus region may require 1 to 5 million gallons. Individual well volumes of water are generally not a critical issue, but collectively can be important within a region. Sources of water can be a stream, river or lake, ground water well, impoundment created by the producer, and a public water supply. Pipelines or tanker trucks (more often) can deliver water to the site. Water is then deposited in impoundments or tanks.

Fracturing (or stimulation) of the well, involves pumping large volumes of water, sand, and additives under high pressure into the well in stages. This process is monitored in real-time, recording the pressures and temperatures during each stage. After fracturing is complete, there is a period of time where water will flow back to the surface in two stages. First, there is the large volume of “flow back fluids” that return to the surface in the first few hours or days, typically collected into pits or ponds. Some larger sites collect flow back fluid in brine tanks where it is filtered and reused to fracture other wells. The second stage is when the “produced water” returns to the surface, slowing in volume over time. This low flow is stored in tanks and picked up by tanker trucks. Collected water must be removed from site by tank truck and hauled off site to commercial disposal wells or waste water treatment plants. Injection wells are another method of disposal. Commercial injection wells are not viable solutions in PA, but there are several in Ohio, causing high truck traffic back and forth between the states.

Mr. Veil discussed how much water would be needed in a high production year. He stated that it is hard to predict the maximum number of wells, but that the report by the United States Geological Survey (USGS), goes back to the year 2005 and does accurate measurements. The totals for the three states of PA, WV, and NY are about 25 millions of gallons/day. The total water withdrawal is 7,457 million gallons per day annually, which means that less than 1% of the total water supply is used. That means there is ample water in the Marcellus region for well drilling, but water needs and considerations will differ according to geographic location and the season.

“Long-Term and Cumulative Assessment of the Impact of Marcellus Shale Drilling”

Michel Boufadel, Ph.D., P.E., Chair of the Department of Civil and Environmental Engineering from Temple University, spoke about factors leading to the movement and retention of flowback water in his presentation. Dr. Boufadel indicated that this can happen from the bottom of the well up during injection and fracturing, as well as from the ground down in the case of pit leaks.

Although the typical Marcellus Shale well is 7,000 feet deep, the earth is highly fractured, and when the flowback water is injected or hydraulically fractured at pressures up to 10,000 psi (pounds per square inch), it is possible for this water to migrate up thousands of feet, depending on the connectivity of the faults and joints.

The other method for flowback water migration is the possibility of pit spills. Dr. Boufadel stressed that most current models are inadequate, because they do not account for the high density of the brine. Because of this, the flowback water tends to seep deeper in the ground than fresh water would, and remain in the aquifers longer. In addition, shallow sensors may not be able to detect the contamination for years.

Conversation with participants about the gaps in the science and future directions from the morning speakers

Radisav Vidic, PhD, PE was the moderator for the morning sessions. Dr. Vidic did an exceptional job guiding the speakers and discussions with the audience, despite the tensions present. The first part of this session involved summarizing the morning’s presentations.  During the second part of his session, participants were given the opportunity to ask questions and provide their input on what seems is missing from the repository of shale gas research.

Questions and Research Gaps Identified by the Audience:

  • Translation of data to information is important. We need to assemble cohorts (research groups) to gather background information in order to guide proper risk communication.
  • Companies dealing with “frac water” (the fluids produced after wells are stimulated) are promising that their water purification techniques can produce potable water and salt (e.g. for deer licks). What is the quality of the water coming out of these plants? Is the salt safe for animal consumption or use on the roads during wintertime? How should the components of the treated fluids that their systems claim to be able to filter out be handled?
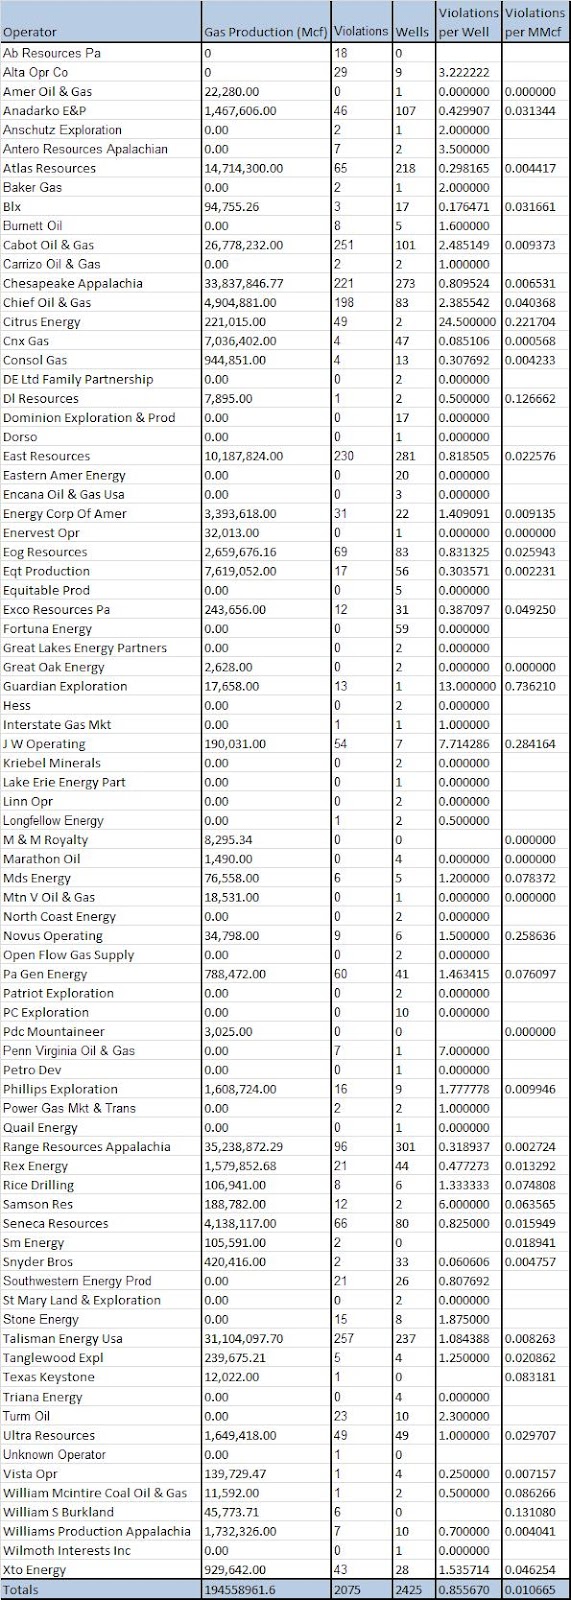
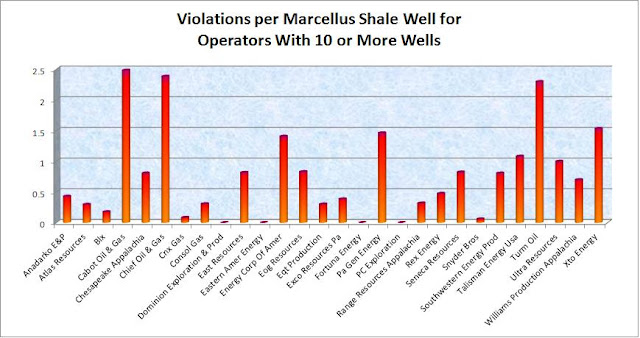
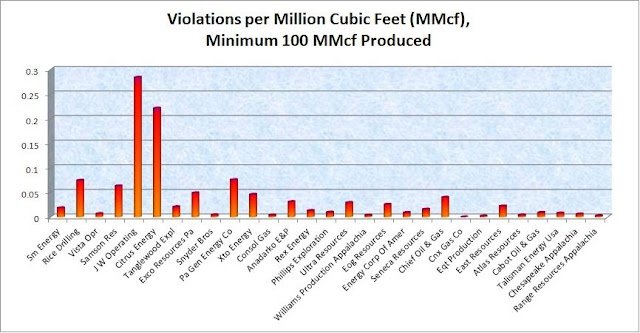
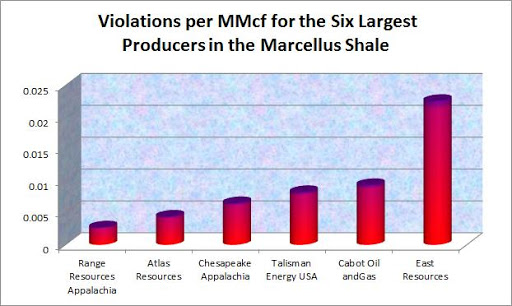
  • Secretary Hanger of the PA DEP has referred to drilling companies as A, B, C students, meaning that some are better than others. Regardless, all of the companies have caused violations in PA.
  • The time between peer review and addressing community concerns is too much. Additionally, people have trouble understanding what peer reviewed research actually says anyway.
  • Has anyone calculated the amount of carbon dioxide we’ve put into the atmosphere from these operations collectively from the beginning of the process to the end?
  • Would you like to contribute your own comments about the conference? A link to the survey will be available soon.

Conference Summary Blog Post Contributors

  • Charles Christen, DrPH, MEd
  • Kyle Ferrar, MPH
  • Shannon Kearney, MPH, CPH
  • Matt Kelso
  • Samantha Malone, MPH, CPH
  • Drew Michanowicz, MPH, CPH

Collaborative online resources from the EARTHWORKS summit

Archived

This page has been archived. It is provided for historical reference only.

On Saturday, CHEC presented at the EARTHWORKS People’s Oil and Gas Summit 2010 in Pittsburgh, PA. Of the many fantastic presentations and information made available, we would like to provide some links from the presentations that were a part of the technology panel in which Samantha Malone and Chuck Christen participated:

  • The view from above – John Amos, SkyTruth and their Oil Spill Tracker Project
  • FracTracker – Samantha Malone and Chuck Christen, Center for Healthy Environment and Communities, University of Pittsburgh Graduate School of Public Health – Register on FracTracker’s DataTool to upload and download data related to shale gas drilling and make maps of that data online.
  • ExtrAct tools – Chris Csikszentmihalyi, Center for Future Civic Media, MIT
    MIT extrAct tools: WellWatch, Landman Report Card, and their News Positioning System

Marcellus Shale Violations by Drilling Operator

Archived

This page has been archived. It is provided for historical reference only.

DEP violations for Marcellus Shale gas wells, January 1, 2007 through September 30, 2010.

With updated Marcellus Shale violation, production, and well data for Pennsylvania on our DataTool, it is now possible to determine which of the drilling operators are the best and worst corporate citizens.


Pennsylvania Marcellus Shale Violations Data by Operator. Please note that for gas production values, Mcf refers to thousands of cubic feet, while MMcf means millions of cubic feet.

Although it runs the risk of being overwhelming, I wanted to provide our readers with the ability to browse the full list of data that I have assembled. It is too easy to think of the natural gas industry as a homogeneous entity in terms of their impact on the environment and communities, but in reality, different drillers have different track records. It is important to have the ability to judge each company separately, and now we have means of doing so.

Each of the three assembled categories above are based on the most complete information that we have, but I should note that they are not from the same time frame. The Marcellus Shale production data is from July 1, 2009 through June 30, 2010; the violations were issued between January 1, 2007 and September 30, 2010; and the wells column contains all spudded Marcellus wells from 2006 through November 3, 2010. Since all operators are evaluated the same way, I did not feel it was necessary to limit this review to data to the small period of time when these three sets were overlapping (1).

Clearly there is tremendous diversity in how many violations per well each company has. The top three offenders in this category–Cabot Oil and Gas, Chief Oil and Gas, and the somewhat ironically named Turm Oil–all have an average of over two violations per well. Referencing the chart above, Cabot and Chief have moderately high numbers of wells, and Turm has just a handful (2). Among the companies with over 200 Marcellus Shale wells, Range Resources and Atlas both have fewer than one violation per three wells, Chesapeake and East Resources both have a violation for about eight out of ten wells, and Talisman averages over a violation per well.

The number of violations per well is perhaps the most straightforward analysis of how seriously drilling operators treat their responsibilities to the rest of us, but it does not account for variances in the wells themselves. If you browse at the production data, clearly some of these wells are Thoroughbreds, while others are mules. One could therefore make the argument that the high producing wells are “worth” the extra violations that they might incur, because the production might equal that of several other less difficult ones. And, whether or not that is is the case, comparing violations to production instead of the number of wells acts as a sort of cost/benefit analysis of what these drilling companies have to offer Pennsylvania.

The top violators in this category are JW Operating with over 0.28 violations per million cubic feet (MMcf) and Citrus Energy with more than 0.22 violations per MMcf. Among the operators that produced at least 100 million cubic feet (3) of natural gas, the next closest is 0.08 violations per MMcf. There are six operators in the state that produced at least 10 billion cubic feet (Bcf) from Pennsylvania’s Marcellus Shale in the given time frame, and all of them have violations per MMcf values under 0.025.


Violations per MMcf for all opoerators producing at lest 10 Bcf from the Marcellus Shale in Pennsylvania between July 1, 2009 and June 30, 2010.

Although all of these six values are well below the worst offenders (4), there is still quite a range of values, with East Resources committing over eight times as many violations per MMcf as Range Resources. While the largest drilling operators are more likely to have the resources to conduct their business properly, it is clearly more a priority for Range Resources and Atlas than for the rest of the pack.

1. There probably are some effects related to time that are reflected in the data. For example, if a well transfers hands from one operator to another, violations and production for the same well would be attributed to different operators.

2. This chart includes only those with a minimum of ten wells in order to make a more manageable display. This had the added effect of removing some of the outliers, such as Citrus Energy’s 24.5 violations per well. Some operators have violations but no wells. Perhaps they are subcontractors, but I have no information on that at this time.

3. As above, this cutoff was made for manageability of the chart display, and also trims outliers with low sample sizes.

4. Also, all but East Resources are below the statewide average of 0.01 violations per MMcf.

FracTracker Visualizes Violations of the Pennsylvania Oil and Gas Act by Congressional District

Archived

This page has been archived. It is provided for historical reference only.

By: C. D. Volz, DrPH, MPH

John Dawes of the Environmental Integrity Project put up a very useful dataset onto FracTracker’s DataTool showing the geographical location of congressional districts. I have visualized this dataset along with locations of violations of the PA Oil and Gas Act across the state. One can get further information on each congressional district and the violations in them by clicking on the “i” button and then on the map to see details. Some of these violations are especially serious and include brine and wastewater entering the surface waters of the Commonwealth of Pennsylvania. These pollution events can certainly have an effect on downstream municipal water sources-individually and collectively.