Florida’s Geographic and Geologic Challenges
By Maria Rose, Communications Intern, FracTracker Alliance
FracTracker has received numerous emails and phones calls wondering about unconventional drilling activity in Florida. Part of the concern related to fracking in the Sunshine State stems from Florida’s unique geographic and geologic characteristics, including a variety of environmental, geologic, and social issues that make drilling a very different challenge from other states. This article provides a brief compilation and explanation of those issues.
Everglades & Big Cypress National Preserve
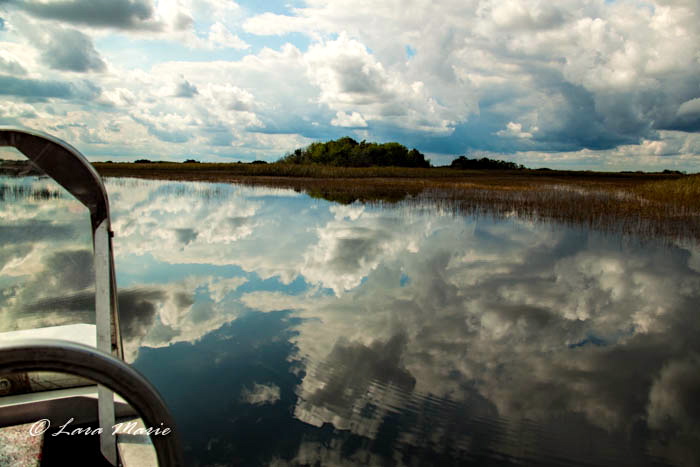
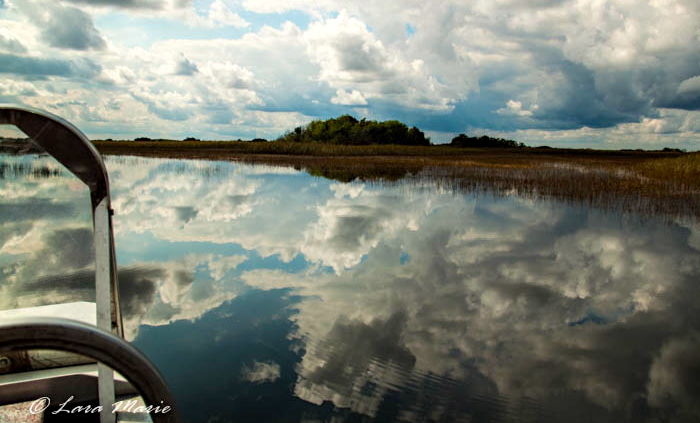
FL Everglades. Photo: Lara Marie Rauschert-Mcfarland, 2013.
Florida is home to the Everglades and the Big Cypress National Preserve, two locations that have a unique climate, assortment of wildlife, and diversity of fauna. Drilling has occurred in Southwest Florida since the 1940s,2 but it has been contained to traditional vertical drilling, until recently. The transition to more extreme methods of extraction, such as acid or hydraulic fracturing, may have more severe consequences on the fragile environment. The current rules and regulations in place are specific to vertical drilling, not focused on the distinct risks of fracking.2
Citizens have expressed concern that more drilling, and more extreme drilling, may contaminate regional groundwater and disrupt the habitat of the animals in the area. The endangered Florida panther is one species of particular concern; there are plans to drill close to the Florida Panther National Wildlife Refuge on the western edge of the Everglades. Drilling requires a host of preparation and set up, including clearing out areas, building roads, and seismic testing for underground reserves. Both animals and the environment can be disturbed or destroyed by these processes, whether it is from accidental spills from drilling, clearing out forested areas, or road traffic.3
Currently, there are 350,000 acres in southwest Florida leased for seismic testing to determine what areas underground have the most promising oil reserves: 115,00 acres in the greater Everglades by the company Tocala for dynamite blasting, and 234,510 acres in the Big Cypress National Park by Burnett Oil Co., for testing with “thumper trucks”.3 Thumper trucks drop heavy weights on the ground and use the vibrations to estimate oil reserves there. These weights have the potential to fracture the crust over porous limestone formations that hold aquifers, where people get their drinking water.4
References and Resources
- Senator Nelson on Drilling
- Florida Halts Fracking Near Everglades
- Concern Over Plans to Drill for Oil in the Everglades
- Senator Nelson Prevents Oil Drilling in Southwest Florida
Water
The natural gas drilling industry requires large amounts of water to frack wells, using approximately four million gallons of fresh water per well.4 The water becomes extremely saline from the elements that mix with the water and earth underground. This fluid will also contain frac fluid chemicals added by the industry – some of which are toxic.3 After the drilling process is complete, the resulting waste must then be treated and disposed of properly either via deep well injection sites, limited reuse, recycling, and/or landfills. The potential for contamination of underground aquifers or aboveground mixing with freshwater sources is an important risk to consider.2
Florida has an already sensitive relationship with water. Being so close to the ocean, Florida often bears the brunt of natural disasters such as hurricanes and heavy storms, which all pose threats to freshwater sources above ground. There is also a high water table in Florida that lies directly under and very close to the Sunniland Basin, a layer of fossil fuel rich rock that is of interest to drillers. Drilling in the area, if done hastily, could contaminate a very important fresh water source.1
References and Resources
- Legislators Prepare for Potential Fracking in Florida
- Drilling for Natural Gas Jeopardizes Clean Water
- Environment America-Fracking By the Numbers
- Oil and Gas Extraction and Hydraulic Fracturing
- EPA Oil and Gas Production Wastes
Tourism
For Dr. Karen Dwyer, a concerned citizen of Collier County, the issue of parks and water also ties in to one of Florida’s most important industries: tourism. As Dwyer sees it, if what draws crowds to the state is diminished — the natural beauty of the Everglades and beaches and water — then tourism will falter. The communities impacted by the 2010 BP Gulf Oil Spill can attest to this fact. Small Florida towns near drilling activity that rely on the income generated by tourism could fall into obscurity.
“People rely on touristy things here,” Dwyer said. “If people aren’t going to come here, we’re going to be a ghost town. If we have a huge accident, we’re not going to have [tourism anymore].”1
Reference:
- Interview with Dr. Karen Dwyer, Wednesday June 11th.
Karst Formations

Karst geologic formations visible near spring. Photo: Richard Gant
In addition to the unique environmental landscape, need for water, and dependence on tourism, Florida also has a vulnerable geology. The majority of the rock formation underground is made up of sand and limestone, which erodes and dissolves easily both above and below ground from exposure to rainwater. This feature causes karst formations in the rock, leading to sinkholes and fractures in the ground. There is some concern that the drilling processes required to access the gas might disturb the already sensitive environment and cause more stress or damage in areas already affected by sinkholes. Karst geology also has potential for increased aquifer contamination; if the ground is extremely porous, then water — and therefore, other chemicals and radioactive materials — may move through the ground more easily than in other geologies and contaminate water sources.
References and Resources:
Demographics
Environmental justice can be a challenge that accompanies oil and gas drilling at times, defined as the inequitable distributions of environmental burdens. In Florida, we see a potential example of environmental justice, as the drilling completed thus far has dominantly affected low-income communities such as Collier County. Collier County has a large proportion of older, retired families, as well as younger families that may hold multiple jobs and relatively low incomes. In these communities, people are less resistant to the introduction of large, new industries that promise economic growth, since opportunities for such economic stimulation are rare. Similarly, people are less resistant to these issues simply because they may not have enough influence or understanding to reject such risky industries. It is clear then, that impoverished or under-stimulated communities often have to deal with the repercussions – environmentally, economically, and socially – of industry presence more than in places where people can afford and know how to repel industries that may pose environmental risks.
References and Resources
Demographics content originated from interview with Pamela Duran, Monday June 30th.