Fracturing wells and land cover in California
By Andrew Donakowski, Northeastern Illinois University
Land cover data can play an important role in spatial analysis; satellite or aerial imagery can effectively demonstrate the extent and make-up of land cover characteristics for large areas of land. For fracking analysis, this can be used to explore important spatial relationships between fracking infrastructure and the area and/or ecosystems surrounding them. Working with FracTracker, I have compiled data concerning land cover classifications and geologic rock areas to examine areas that may be particularly vulnerable to unconventional drilling – e.g. fracking. After computing the makeup of land cover type for each geologic area, I then mapped locations of known fracking wells for further analysis. This is part of FracTracker’s ongoing interest in understanding changes in ecosystem services and plant/soil productivity associated with well pads, pipelines, retention ponds, etc.
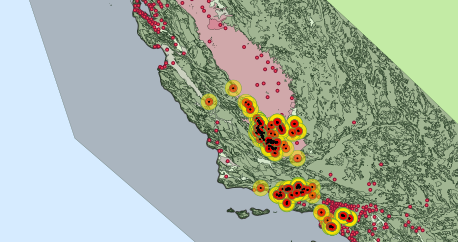
Developed
First, by looking at the Developed areas (below), we can see that, for the most part, hydraulic fracturing is occurring relatively far from large population areas. (That is to say, on this map we can see that these types of wells are not found as often in areas where population density is high (<20 people per square mile) or a Developed land cover classification is predominate as they are in areas with a lower Develop land cover percentage). However, we can also see that there is quite a large cluster of fracking wells in the southern portion of the state, and many cities fall within 5 or 10 mi of some wells. While there may not be an immediate danger to cities that fall within this radius, we can see that some areas of the state may be more likely to encounter the effects of fracking and its associated infrastructure than others.
Forested
Next, the map depicting Forested land cover areas is, in my opinion, the most aesthetically groovy of the land cover maps; the variations in forested areas throughout the state provide a cool image. By looking at this data, we can see that much of California’s forested land lies in the northern part of the state, while most fracking wells are located in the south and central parts of the state.
Cultivated
To me, the most interesting map is the one below showing the location of fracking wells in relation to Cultivated lands (which includes pasture areas and cropland). What is interesting to note is the fertile Central Valley, where a high percentage of land is covered with agriculture and pasture lands (Note: The Central Valley accounts for 1% of US farmland but 25% of all production by value). Notably, it is also where many fracking wells are concentrated. When one stops to think about this, it makes sense: Farmers and rural landowners are often approached with proposals to allow drilling and other non-farming activities on their land. Yet, it also raises a potential area for concern: A lot of crops grown in this area are shipped across the country to feed a significant number of people. When we consider the uncertainties of fracking on surrounding areas, we must also consider what effects fracking could have beyond the immediate area and think about how fracking could affect what is produced in that area (in this case, it is something as important as our food supply.)
The Usefulness of Maps
Finally, as previously mentioned, mapping the extent of these land coverage can be useful for future analysis. Knowing now the areas of relatively large concentrations of forested, herbaceous, and wetland (which can be highly sensitive to ecological intrusions) areas can be good to know down the line to see if those areas are retreating or if the overall coverage is diminishing. Additionally, by allowing individuals to visualize spatial relationships between fracking areas and land coverage, we can make connections and begin to more closely examine areas that may be problematic. The next step will be: a) parsing forest cover into as many of the six major North American forest types and hopefully stand age, b) wetland type, and c) crop and/or pasture species. All of this will allow us to better quantify the inherent ecosystem services and CO2 capture/storage potential at risk in California and elsewhere with the expansion of the fracking industry. As an example of the importance of the intersection between forest cover and the fracking industry we recently conducted an analysis of frac sand mining polygons in Western Wisconsin and found that 45.8% of Trempealeau County acreage is in agriculture while only 1.8% of producing frac sand mine polygons were in agriculture prior to mining with the remaining acreage forested prior to mining which buttresses our anecdotal evidence that the frac sand mining industry is picking off forested bluffs and slopes throughout the northern extent of the St. Peter Sandstone formation.
A Quick Note on the Data
Datasets for this project were obtained from a few different sources. First, land cover data were downloaded from the National Land cover Classification Database (NLCD) from the Multi-Resolution Land Character Consortium. Geologic data were taken from the United States Geologic Survey (USGS) and their Mineral Resources On-Line Spatial Data. Lastly, locations of fracking wells were taken from the FracTracker data portal, which, in turn, were taken from SkyTruth’s database. Once the datasets were obtained, values from the NLCD data were reclassified to highlight land-coverage types-of-interest using the Raster Calculator tool in ArcMap 10.2.1. Then, shapefiles from the USGS were overlaid on top of the reclassified raster image, and ArcMaps’s Tabulate Area tool was used to determine the extent of land coverage within each geologic rock classification area. Known fracking wells downloaded from FracTracker.org were added to the map for comparative analysis.
About the Author
Andrew Donakowski is currently studying Geography & Environmental Studies, with a focus on Geographic Information Systems (GIS), at Northeastern Illinois University (NEIU) in Chicago, Ill. These maps were created in conjunction with FracTracker’s Ted Auch and NEIU’s Caleb Gallemore as part of a service-learning project conducted during the spring of 2014 aimed at addressing real-world issues beyond the classroom.


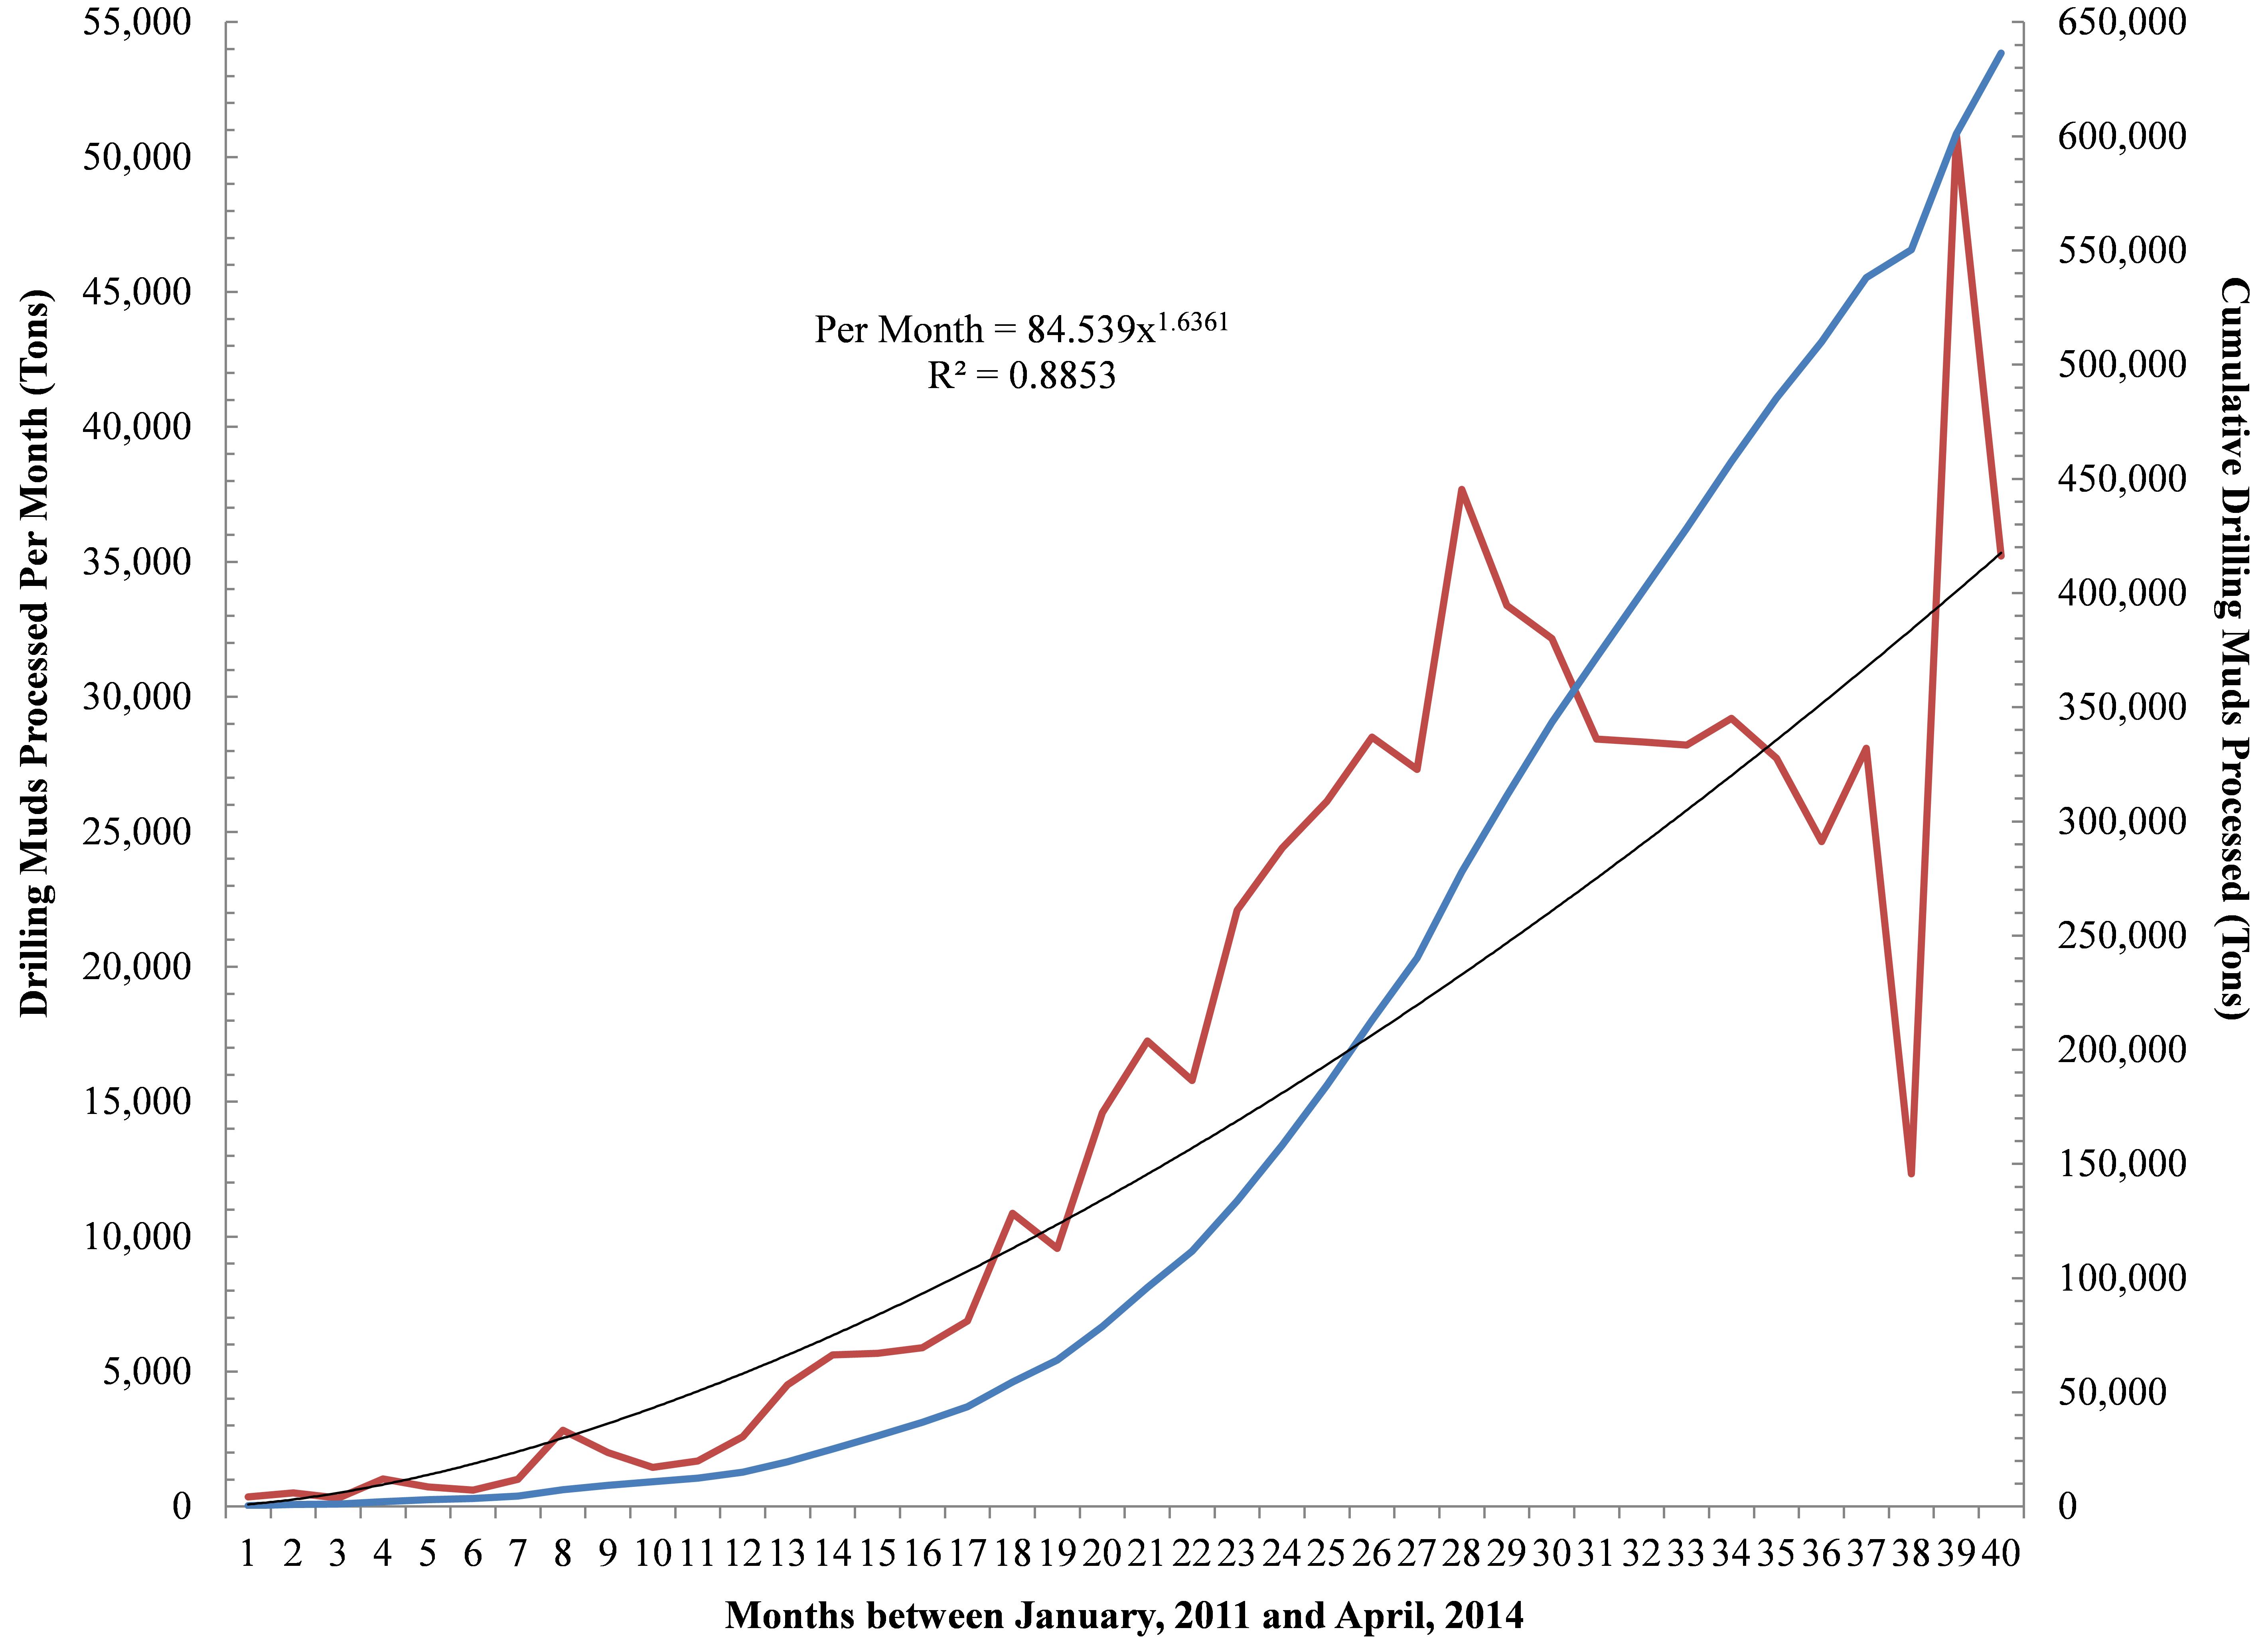

 The use of hydraulic fracturing for natural gas extraction has greatly increased in recent years in the Marcellus Shale. Since the beginning of this shale gas boom, water resources have been a key concern; however, many questions have yet to be answered with a comprehensive analysis. Some of these questions include:

 By Brook Lenker, Executive Director, FracTracker Alliance