The majority of FracTracker’s posts are generally considered articles. These may include analysis around data, embedded maps, summaries of partner collaborations, highlights of a publication or project, guest posts, etc.

Insights on Southwestern Pennsylvania Data Center Proposals
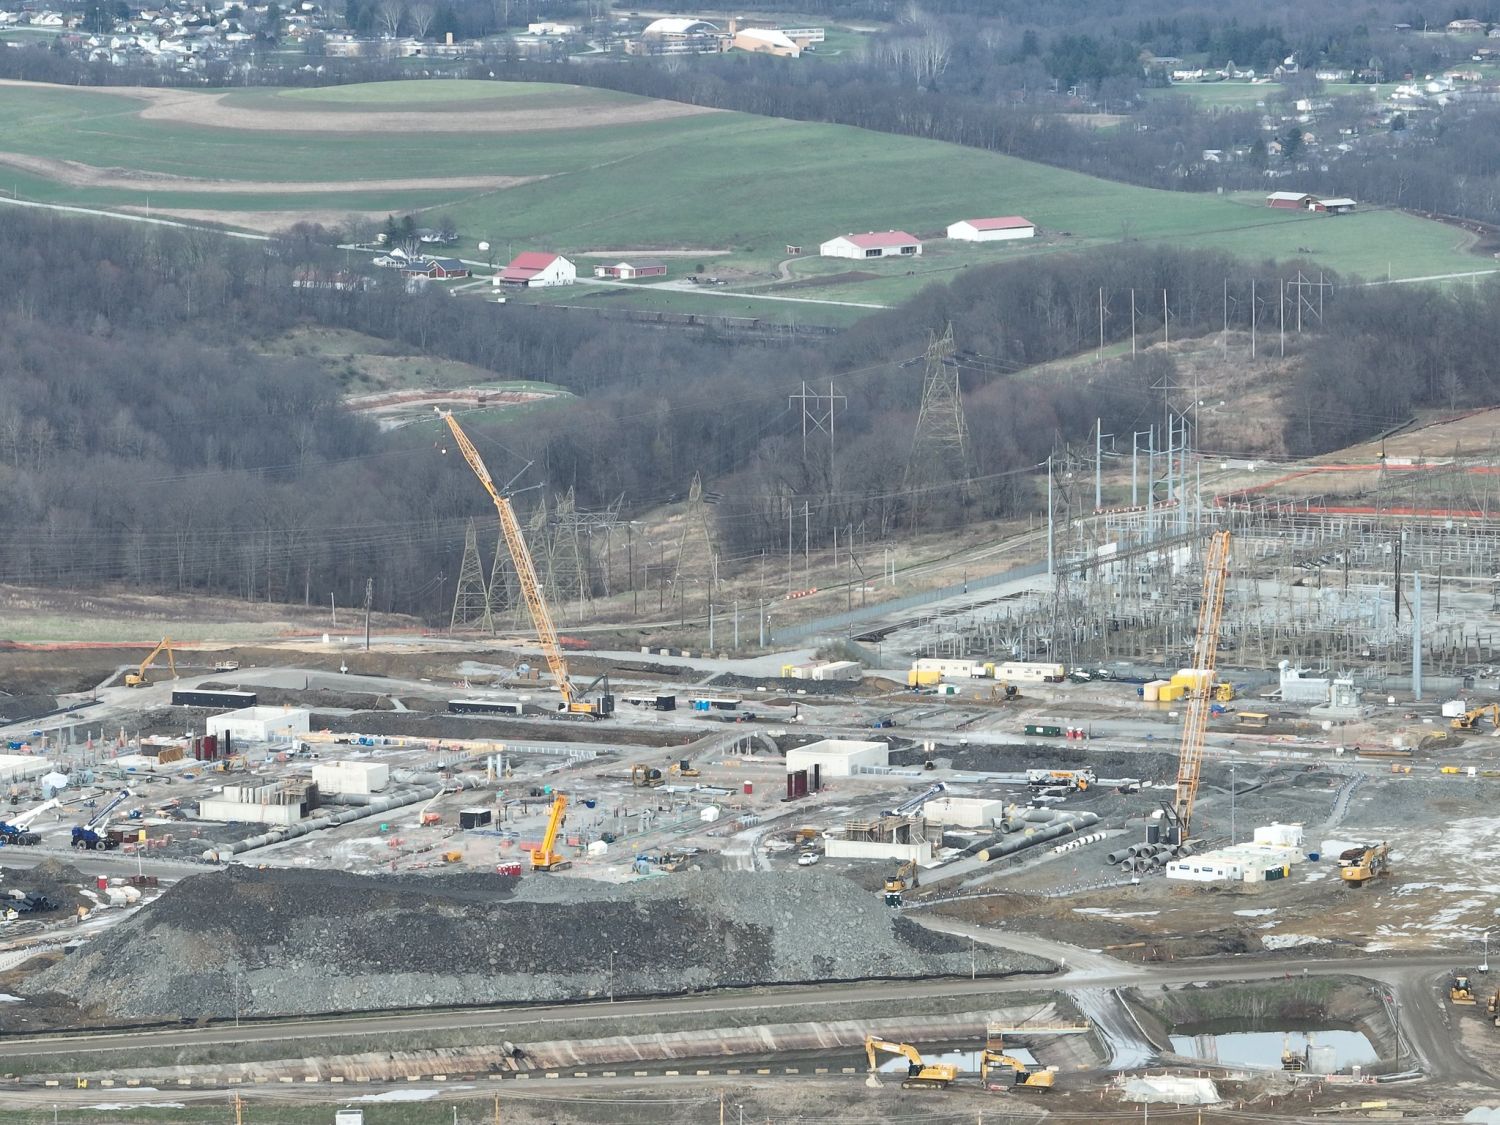
Aerial view of cranes, foundations, and a substation under construction at the Homer City Energy Campus, with farms and houses on the hills behind.

Insights on Southwestern Pennsylvania Data Center Proposals

What FracTracker’s 2026 Data Stewardship Sprint found across 12 proposals in six counties

Construction at the Homer City Energy Campus gas plant, Indiana County, PA, April 1, 2026. Photo: Kyle Ferrar, FracTracker Alliance (Flickr).

Introduction

Since mid-2025, FracTracker researchers have identified 12 data center proposals across six Southwestern Pennsylvania counties. If projects with disclosed power plans reached their highest stated capacities, they would add about 12.5 GW of gas-fired generation. Running around the clock, that would consume the same amount as roughly three-quarters of the electricity Pennsylvanians used in 2024. Many proposals target communities already shaped by fossil-fuel infrastructure and legacy industrial pollution. Residents in these communities frequently face limited access to clear, trustworthy project information while dealing with compressed approval timelines and technical, hard-to-navigate decision-making processes. These proposals put residents’ air quality, water resources, public health, and community future at stake.

During a nine-week Data Stewardship Sprint in summer 2026, FracTracker trained four Pittsburgh-based student interns to investigate proposed data center developments and produce information that communities could use in local decisions. The Data Stewardship Sprints researched 12 data center proposals across Allegheny, Washington, Westmoreland, Beaver, Greene, and Indiana counties. Each intern was assigned 3-4 data center targets. The team attended public meetings, filed Right-to-Know requests, reviewed permits, researched ordinances and zoning designations, mapped potentially affected community resources and ecological sites, and spoke with residents to get their side of the story.

What is a data center, and why should communities care?

A data center is a facility filled with computer servers and related equipment that stores, processes, and transmits digital information. Traditional data centers support services such as websites, streaming, cloud storage, and financial services. The current wave of data centers are specifically designed for artificial intelligence. Unlike traditional data centers, which were smaller and had comparatively modest electricity demands, AI data centers are major industrial developments. Generative AI requires a different computing architecture, where large clusters of specialized graphics processing units (GPUs) train models that then respond to user requests. These chips draw substantially more electricity and produce more heat than conventional servers. A decade ago, data centers consumed less than 2% of the electricity used by the United States. By 2028, the Lawrence Berkeley National Laboratory expects data centers' electricity consumption to grow to between 6.7% and 12% of U.S. electricity use by 2028, equivalent to the electricity use of up to 55 million American homes.

AI-oriented hyperscale campuses concentrate computing equipment at an unprecedented scale. The International Energy Agency reports that the power density of AI servers increased elevenfold between 2020 and 2025, and the IEA expects a further fourfold increase by 2027. A single advanced server rack, roughly the size of a large refrigerator, may soon require as much power at peak operation as dozens of homes. Training, reasoning, image and video generation, and continuous modeling use can create large, rapidly changing electrical loads. Consequently, these campuses may require hundreds or thousands of megawatts (MW) of reliable, round-the-clock power, substantial amounts of water for cooling, and new transmission lines, substations, backup generators, power plants, pipelines, and other supporting infrastructure. This means their effects can extend far beyond the property boundaries where they are built.

For communities, the important questions include: How will the data center be powered? How much water will it use? Who will pay for necessary infrastructure and power upgrades? What protections will govern noise, toxic emissions, light pollution, stormwater discharge, emergency response, and future expansion?

The environmental impacts of AI data centers include industrializing rural land, air pollution, high water use, noise, and light pollution. Because many data center proposals depend on fossil fuel infrastructure, they prevent communities from transitioning to cleaner energy sources. Large data center campuses can occupy hundreds or thousands of acres, replacing farmland, forests, and natural areas. Data centers also produce constant light pollution and noise pollution comparable to a jackhammer or jet engine running at all hours of the day. The long-term impacts of both light and noise pollution include hearing loss, stress, insomnia, cardiovascular problems, and decreased quality of life.

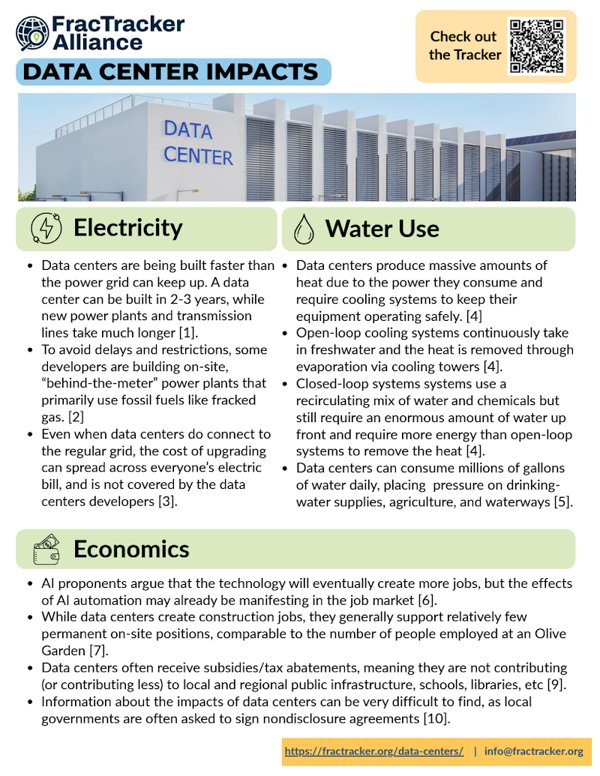
In many instances, data centers are being built faster than the power grid can keep up. A data center can be built in 2-3 years, while new power plants and transmission lines can take much longer. To skip a lengthy regulatory process, developers have started building their own on-site “behind-the-meter” power plants, many of which rely on fracked gas. This can raise air-quality and community-health concerns for nearby residents. Burning fracked gas directly or indirectly for data center energy produces carbon dioxide, which exacerbates climate change, while gas extraction, transportation, and use releases methane and contributes to local air and water pollution that harms frontline communities. Increased fracking to meet this new demand for gas means more water use, more pollution, more toxic waste, and more health impacts for frontline communities. And even when data centers do connect to the regular grid, the cost of upgrading the grid can spread across everyone’s electric bill. Large new electricity loads can also affect grid reliability, leading to blackouts.

While data center developers promise local jobs, economists studying AI automation warn of potential job losses across the broader economy. The effects of AI automation may have already shown up in the job market for young workers entering the workforce for the first time, with recent college graduates facing a 6% unemployment rate compared to 4% across the whole workforce. At the same time, data center operators and developers present data centers as job creators that contribute to local economies. To date, little evidence shows that data centers have a positive impact on net jobs created. While data centers create construction jobs, they generally support relatively few permanent on-site positions, comparable to the number of employees employed at an Olive Garden. This problem is exacerbated as many data centers receive subsidies/tax abatements, meaning they are not contributing (or contributing less) to local and regional public infrastructure, schools, libraries, and other community resources. Additionally, information about economic, energy, and environmental impacts can be difficult to find, as local governments are often asked to sign NDAs by data center operators looking to develop in their area.

Finally, AI data centers produce massive amounts of heat because of the power they consume, and therefore require cooling systems. Liquid-based cooling systems can fall into two categories: open-loop (evaporative) systems and closed-loop systems. Open-loop systems continuously take in freshwater to absorb heat, then release it into the atmosphere through evaporation via cooling towers. Closed-loop systems use a mix of water and cooling chemicals to remove heat through technologies such as heat exchangers. Both systems can require millions of gallons of potable (drinkable) water, which puts pressure on local drinking water supplies, agriculture, and waterways. Closed-loop systems are often advertised as the more environmentally friendly option since they reuse the same liquid for cooling, though they require more energy to operate than evaporation-based methods. When accounting for water used to produce that extra energy, closed loop cooling systems may require even more water than the evaporative cooling systems. The up-front water input for closed-loop systems is still substantial, and the water cannot be recirculated in perpetuity. Closed-loop systems also use glycol, corrosion inhibitors, PFAS, and other treatment chemicals, and improper storage, leaks, or disposal can then create soil and water contamination risks. Water-use estimates should distinguish total system capacity, daily consumption, and the amount ultimately discharged or evaporated.
Why is Southwestern Pennsylvania attractive to data center developers?

Southwestern Pennsylvania offers several attractive features that appeal to data center developers. The region has relatively inexpensive land, access to major fiber-optic routes, abundant water resources, and proximity to population and business centers in the eastern United States. It also contains former coal plants, mines, steelmaking properties, and other large industrial brownfield sites that are zoned for industrial use and may already have transmission connections, substations, pipelines, and water access.

The underlying Marcellus and Utica shale formations are another major factor. Fracked gas supplied more than 40% of the electricity used by U.S. data centers in 2024. Pennsylvania is the nation's second-largest fracked gas-producing state, and proposed local data centers plan to tap the region’s fracked gas for power generation, directly through behind-the-meter generation, or indirectly through increased power grid needs. The consequences of a data center buildout reliant on fracked gas will extend throughout the supply chain, requiring additional fracked wells, pipelines, compressor stations, power plants, and other heavy industry related to extraction. This new infrastructure will bring pollution and negative health effects to communities living near data centers, midstream infrastructure, and the extraction itself. Because air pollution, watersheds, energy infrastructure, and electricity markets do not stop at municipal boundaries, regulators must evaluate the cumulative effects of these projects across the entire region.

The novelty and complexity of hyperscale data centers challenge local regulation and oversight. Many Pennsylvania municipalities do not define data centers in their zoning codes, leaving officials to evaluate large energy and industrial projects under rules written for warehouses or industrial facilities. Developers may seek variances or approvals before municipalities can adopt project-specific standards. Limited disclosure compounds this problem. Nondisclosure agreements and fragmented permitting records can prevent residents and local officials from evaluating energy demand, water use, pollution, public costs, and proposed tax incentives before decisions occur.

Southwestern PA Data Centers

Through Data Stewardship Sprints, FracTracker worked with community organizations in four southwestern Pennsylvania communities to research active proposals and provide maps, permit records, and other information for local decision-making. Some proposals are moving quickly through the approval process, while others remain proposals or land advertisements with limited public information. We researched all known data center proposals and projects in Allegheny, Beaver, Westmoreland, Indiana, Washington, and Greene Counties and chose to focus on Homer City Energy Campus, Springdale Dynamo Data Center, Upper Burrell Data Center, and Project Phoenix for further in-depth research.

Map of Allegheny, Beaver, Greene, Indiana, Washington, and Westmoreland counties with 12 numbered data center proposals.
Proposed data centers in Southwestern Pennsylvania. Source: FracTracker Alliance.

Indiana County

Indiana County, a rural county with roughly 83,000 residents in Southwestern Pennsylvania, is now at the center of massive energy buildout. The former Homer City Generating Station is being redeveloped into Homer City Energy Campus. This $10+ billion 4.5 GW fracked gas-fired power plant will be one of the largest of its kind, on a campus of about 3,200 acres (approximately five square miles). This is enough to power an estimated 3.75 million homes1. The power plant may supply a sprawling Amazon data center.

In addition, the county may soon serve as an electric transmission junction, with the proposed Buttermilk Falls substation adding two new 765 kilovolt (kV) transmission lines (the highest voltage tier used in North America) that connect the region to the broader PJM grid as part of the Kammer-Juniata Transmission Project. The $1.7 billion project (Proposal 237) would run 220 miles from West Virginia into Pennsylvania. Though the project is not built to serve Homer City specifically, PJM has justified it based on statewide data center growth broadly. PA's Office of Consumer Advocate (OCA) criticized PJM for failing to account for Homer City's own 4.5 gigawatts of already-announced capacity when calculating the necessity of the transmission line. The proposal itself has drawn formal objections from state regulators over an inadequate public comment window, from the OCA over an estimated $9 billion in ratepayer-funded costs, and from The Nature Conservancy over its route cutting through corridors of Appalachian wildlife migration.
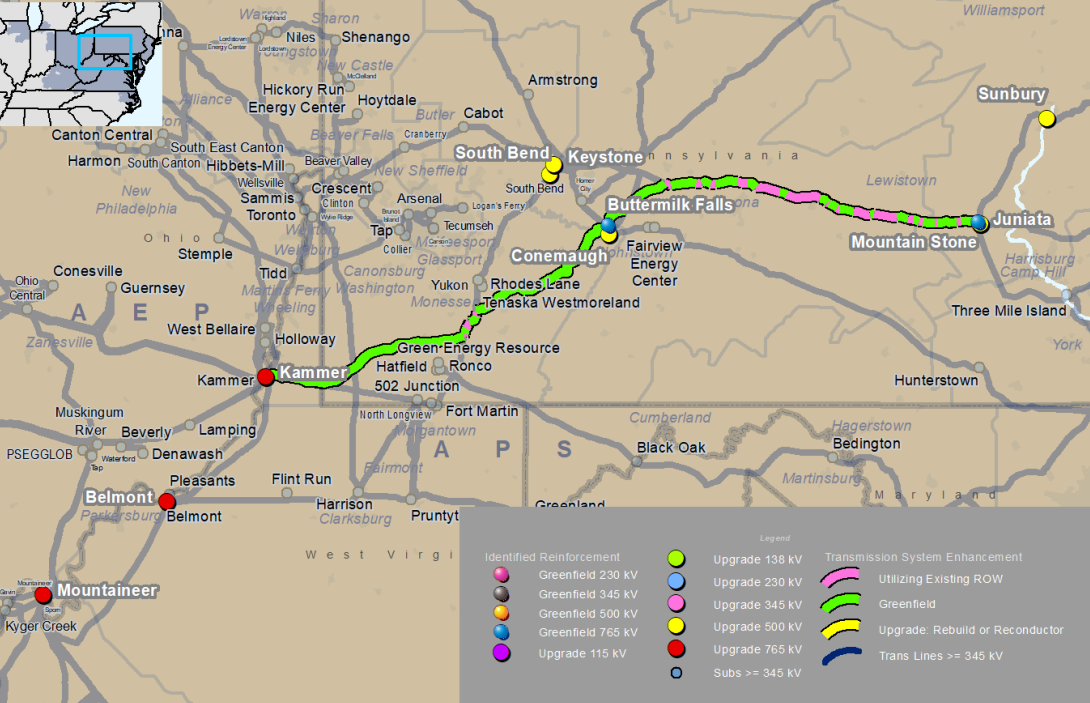
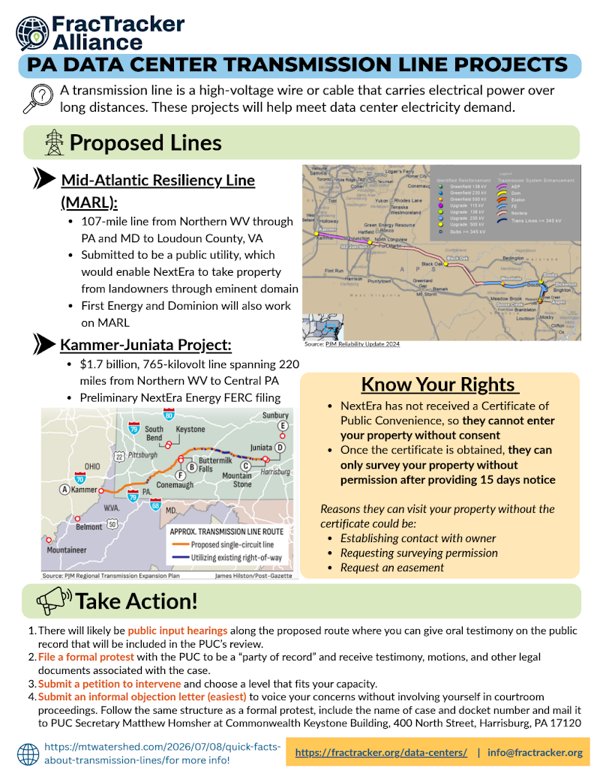
PJM map of the proposed 765 kV Proposal 237 route connecting the Kammer, Buttermilk Falls, and Mountain Stone substations.
Proposal 237's proposed 765kV route, connecting the Kammer, Buttermilk Falls, and Mountain Stone substations. Source: PJM, 2026 RTEP report, p. 166.

Table 1. Data Centers in Indiana County, PA

Name and addressStatusStakeholdersPower
Homer City Energy Campus
1750 Power Plant Rd, Homer City, PA 15748
Under constructionHomer City Redevelopment (developer)
Kiewit (contractor)
AWS (possible tenant)
4.5 GW, behind-the-meter gas and grid connection
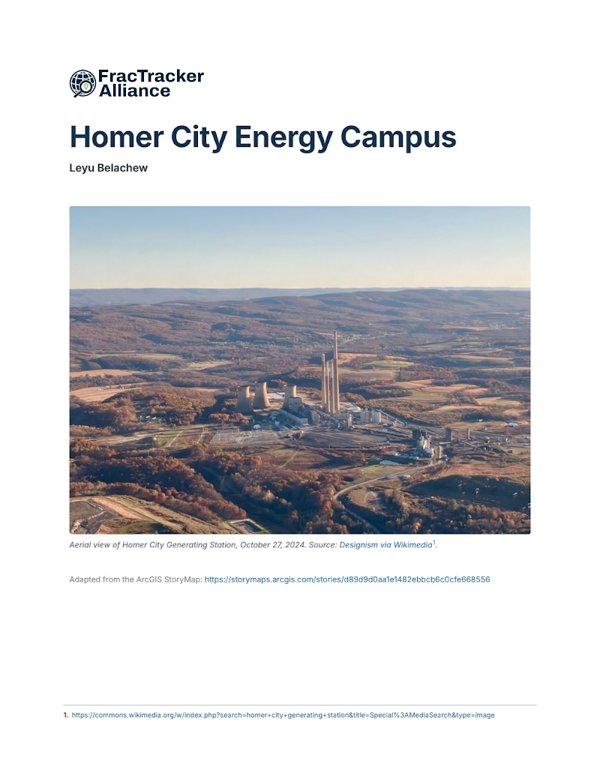
Cover of the Homer City Energy Campus site packet

Homer City Energy CampusUnder construction · 4.5 GW, behind-the-meter gas and gridResearch by Leyu BelachewSite packet (PDF) · Story map in a new tab

Explore the Homer City Energy Campus story map

Allegheny and Westmoreland Counties

With a population of 1.22 million, Allegheny County is Pennsylvania's second-largest county. In addition to Pittsburgh, Allegheny County includes 96 boroughs, 29 townships, and 3 home-rule municipalities. The region has been shaped by the rise and fall of local industry. Allegheny County’s population has declined sharply in the last couple of decades of the 20th century. Unsurprisingly, smaller industrial towns faced the heaviest losses because they could not adapt to the 21st-century economic landscape the way a larger city like Pittsburgh could.

Westmoreland County is significantly smaller, at slightly under 350,000 residents. Unlike Allegheny County, its population has declined much more slowly over the last century. Regardless, the county’s population has dropped by almost 9,700 over the last seven years.

The proposed Dynamo DC data center in Springdale Borough and TECfusions’ proposed Keystone Connect Data Center in Upper Burrell are only about five miles apart, despite being in different counties. Developers identified both former industrial properties as attractive sites because they already have industrial zoning and access to energy infrastructure. The former Cheswick Generating Plant in Springdale also offers a legacy grid connection.

Table 2. Data Centers in Allegheny and Westmoreland Counties, PA

Name and addressStatusStakeholdersPower
Springdale Dynamo Data Center
151 Porter St, Springdale, PA 15144
Permits under reviewAllegheny DC Property Co (developer)up to 330 MW, grid connection
Upper Burrell Keystone Connect Data Center
100 Technical Dr, New Kensington (Upper Burrell), PA 15068
Permit review complete, partially operationalTECfusions (developer), TensorWave (tenant)up to 3 GW, behind-the-meter gas and grid connection
Cover of the Springdale Dynamo Data Center site packet

Springdale Dynamo Data CenterPermits under review · up to 330 MW, grid connectionResearch by Weronika PrzedworskaSite packet (PDF) · Story map in a new tab

Explore the Springdale Dynamo Data Center story map
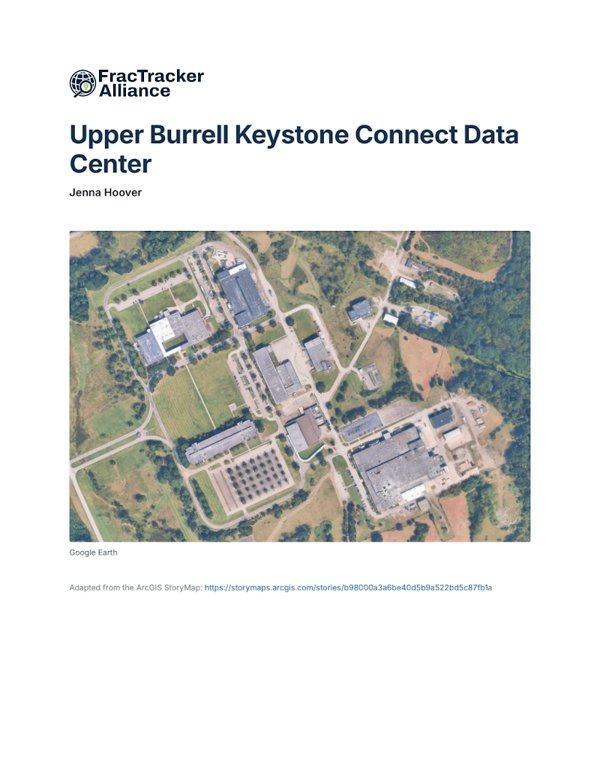
Cover of the Upper Burrell Keystone Connect Data Center site packet

Upper Burrell Keystone Connect Data CenterPartially operational · up to 3 GW, gas and gridResearch by Jenna HooverSite packet (PDF) · Story map in a new tab

Explore the Upper Burrell Keystone Connect Data Center story map

Beaver County

Beaver County was once dominated by the steel industry that took advantage of the Ohio River running through the center of the County. The decline of the steel industry left the County with many brownfield sites, polluted air and water, and a struggling economy. The county is made up of many municipalities and cities with small populations. The two largest cities are Aliquippa, with 9,079 residents, and Beaver Falls, with 9,005 residents. Midland Borough is home to 2,293 people, 1,852 live in Big Beaver Borough, and a mere 159 people in Shippingport. Twenty-three percent of Beaver County’s population is 65 or older (3.4% higher than the PA average) and 19% are under 18 (0.7% lower than the PA average), with these populations being especially vulnerable to effects from pollution. The county's employment rate is 59.7% (0.6% lower than the PA average).

To stimulate the economy and bring jobs to the area, the County has tried to attract developers from many industries to its various brownfield sites. One of these developers was Shell, which opened their ethane cracker plant in 2022 and has been engaged in ongoing legal battles for exceeding its emissions levels. Pollutants like those emitted from the Shell plant have been linked to various adverse health effects, including heart disease, asthma, and cancer. Four proposed or expanding data centers are in Beaver County, three of which are in environmental justice areas: Switch Pitt Race, the Aliquippa Data Center Land Advertisement, and Big Digital Energy Midland. A data center sited at the former Bruce Mansfield Power Plant, dubbed “Project Phoenix,” is already under construction in Shippingport.

Table 3. Data Centers in Beaver County, PA

Name and addressStatusStakeholdersPower
Aliquippa Data Center
71 Woodlawn Road, Aliquippa, PA 15001
Land advertisementFive 9s Digital496 MW, behind-the-meter gas and grid connection
Project Phoenix
100 Church Ln, Shippingport, PA 15077
Permits under review, under constructionAligned Data Centers (developer)2 GW, behind-the-meter power, provided in part by solid oxide fuel cells
Switch Pitt Race Data Center
201 Penndale Road, Wampum, PA 16157
Permits under reviewSwitch LTD (developer)Uncertain, Grid connection
Big Digital Energy Midland
950 Railroad Ave, Midland, PA 15059
Operating (expanding)Big Digital Energy, Inc. (operator)120-144 MW, grid connection
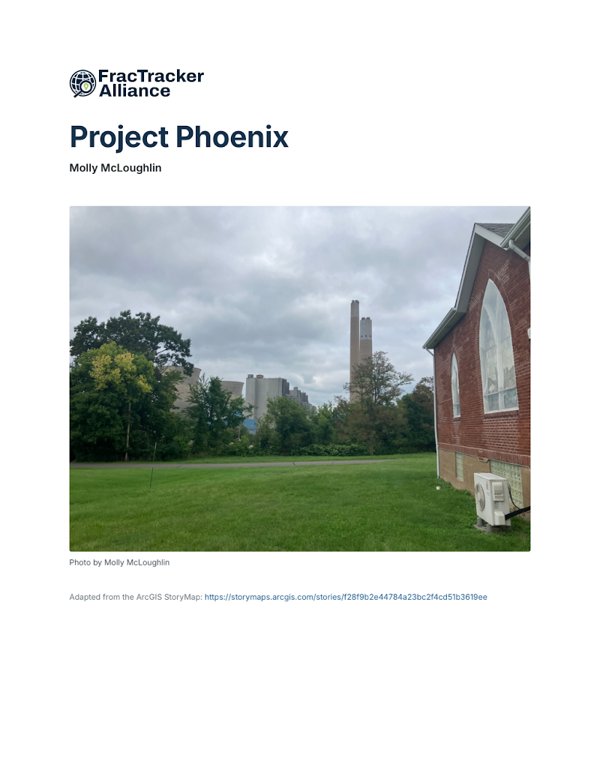
Cover of the Project Phoenix site packet

Project PhoenixUnder construction · 2 GW, behind-the-meter powerResearch by Molly McLoughlinSite packet (PDF) · Story map in a new tab

Explore the Project Phoenix story map

Switch Pitt Race Data Center

Switch, a Nevada-based data center operator, announced plans in April 2026 for a three-building, 382-acre campus at the former Pittsburgh International Race Complex in Big Beaver Borough. The racetrack opened in 2002 as BeaveRun Motorsports Complex, and in 2011 Jim and Kathy Stout purchased the track, renaming and investing more than $15 million for it to grow into a regional motorsport hub. Two weeks before the racetrack's closure was announced in 2025, the borough amended its zoning ordinance to permit data centers under “Special Regulations.” The Borough formally advertised public hearing for September 16, 2025, to consider two ordinances together: Ordinance 245, amending the Zoning Ordinance and Zoning Map, and Ordinance 246, amending the Borough’s Local Economic Revitalization Tax Assistance (LERTA). The racetrack was purchased for $50 million in March of 2026 by Wampum I, LLC, a subsidiary of Switch.

The full Preliminary Land Development application for the Switch data center is available on Big Beaver’s website. Documents describing the plans Switch provided to Beaver County were obtained through a FracTracker submitted Right-to-Know request provided here. The plans describe three data center buildings, an electrical substation, a FirstEnergy switching station, and six permanent stormwater ponds discharging to unnamed tributaries of the Beaver River.

Timeline

  • 2002Site opens as BeaveRun Motorsports Complex
  • Sept 16, 2025Borough Council approves Ordinance 245
  • Oct 1, 2025Track closure announced
  • Dec 2025Save Pitt Race formalizes as nonprofit (3RMPS)
  • March 4, 2026Land sold to Wampum I, LLC
  • April 2026Switch publicly announces plans for the site
  • June 2, 2026Switch holds press-barred, police-guarded town hall
  • June 29, 20263RMPS holds counter town hall
  • July 9, 2026Switch formally filed a development application
  • Aug 27, 2026First public review of proposal at the Planning Commission Meeting
Satellite map of the former Pittsburgh International Race Complex with the sold parcels outlined in red.
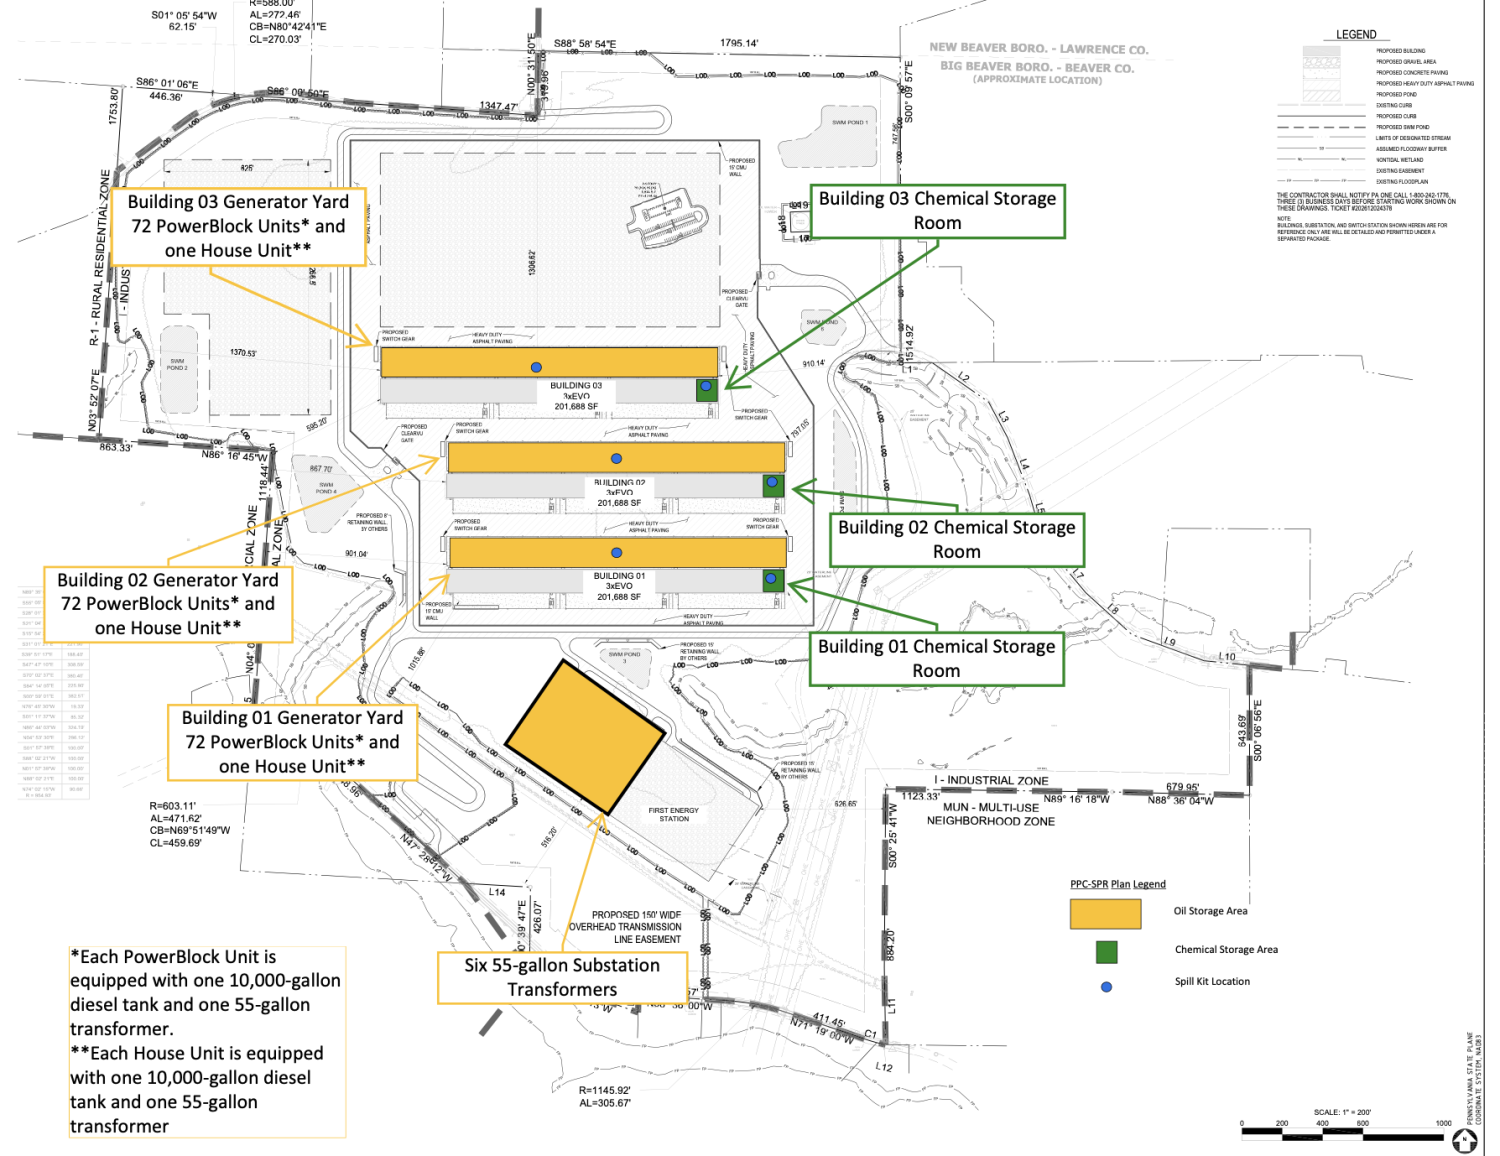
Developer site plan for the Switch data center showing three buildings, generator yards, and chemical storage rooms.
Parcel sale 53-103-0389.000 and 53-103-0391.000 (top); developer schematic (bottom). Sources: Atwell Appendix E pg 34 Overall Site Plan, other plans available at Atwell Preliminary Plan Set.

Data centers fall under Big Beaver Borough’s Ordinance 245’s Special Regulations category, which stipulates a 50-acre minimum tract, 100-foot setback, 75 dBA noise limit, and unrestricted 24/7 operation. Residents have argued that this framework is too permissive for a project of Switch’s scale and have pushed for a stricter Conditional Use classification instead. Switch’s application has proposed drawing water from the existing Beaver Falls Municipal Authority rather than on-site wells (said to be capped). Daily operational demand is projected at around 9,000 gallons per day across the buildings, covering typical daily use, fire service, and dust control during construction, as well as the initial fill and flush of the closed-loop cooling system. Switch states it will be coordinating with the Municipal Authority to avoid disruption. More specifically, involving stormwater, proposed detention and infiltration ponds are being designed to treat site runoff and preserve flow-path characteristics similar to those of existing conditions. On sewer capacity, the project proposes connecting to existing on-site sewer infrastructure, with each building expected to host no more than 120 occupants per day, for a maximum of 2,400 gallons per day, per building.

Map of the Switch site boundary with an existing 345 kV transmission line crossing it.
The project plans to access an existing 345kV transmission line already on-site via a new FirstEnergy switch station. Sources: U.S. Electric Power Transmission Lines and FracTracker Alliance.

On roadways, the project proposes three access points: the existing Penndale Road entrance, the Eagle Rock Road driveway, and a new connection to Fairlane Blvd to handle increased traffic during construction. A full traffic study has yet to be completed. On earthwork and site stability, the preliminary plan set outlines three stages of the Erosion & Sediment Control plan. The preliminary geotechnical report states that there will be three stages of the Erosion & Sediment Control plan. The site itself contains undocumented, uncontrolled fill left over from the property’s prior use as a racetrack. Additionally, historic strip-mined areas from 1952 directly affect portions of the proposed development, including the northwestern cut slope, the western flat pad, and the western end of building 3, as well as the switching station and substation embankment slopes. Where mine spoils are located beneath buildings or sensitive infrastructure, the report indicates that ground improvement or deep foundations will be necessary, and embankments over spoils will require more robust draining.

The proposed site sits within a designated Environmental Justice Area under PennEnviroScreen, with a Final Score in the 94th percentile and a Pollution Burden score in the 97th percentile. Two standout indicators are traffic (95.5th percentile) and toxic air emissions (92.1st percentile), with hazardous waste and storage sites ranking in the 95.2nd percentile and mining concerns in the 89.3rd. Cancer sits at the 89.8th percentile, disability at 87.2nd percentile, and heart disease at 82.1st percentile.

Residents have raised concerns over noise, light pollution’s effect on wildlife, and water contamination. It has also been argued that the project does not fit with the area’s rural character. The proposal will affect a floodway, wetlands, and Stockman Run, which is listed in the Beaver County Natural Heritage Inventory. The company’s modeled highest level of noise falls under the Borough’s legal limit, between 44.8 and 55.6 dBA. Many are skeptical that the 80-100 permanent jobs projected at buildout or the 1,500 - 2,000 construction jobs over a two-year period will offset the loss of a venue that drew thousands on race weekends. Organized opposition has sustained. The advocacy group 3RMPS formed within weeks of the closure announcement, and a broader petition to repeal Ordinance 245 has drawn over 700 signatures.

Aliquippa Data Center Land Advertisement

Aliquippa Data Center Campus is a data center site proposed by Five 9s Digital. It is located at 71 Woodlawn Road, at the former J&L Steel brownfield site in Aliquippa, PA.

Satellite map of the former J&L Steel parcels along the Ohio River in Aliquippa.
Parcels encompassing the J&L Steel site in Aliquippa, PA. Sources: Five 9s Digital and FracTracker Alliance.

Plans describe behind-the-meter power with two 248 MW gas power plants on site, totaling 496 MW, which would supply the data center. The proposal site is 86 acres, with an additional 15 acres adjacent to it for a dedicated substation. Plans include one 250,000 sq ft data center building, expandable to a second floor that would increase the size to 500,000 sq ft. This data center would utilize water from the adjacent Ohio River for cooling.

Importantly, these plans are only outlined in a slide deck by Five 9s Digital, a national data center investment, consulting, brokerage, and development advisory firm. This deck claims approval from the Pennsylvania Public Utility Commission for the behind-the-meter power, but no record of this could be found. Overall, there seems to be little action taken to move these plans forward. The site itself is not owned by Five 9s Digital but rather Beaver County Corporation for Economic Development. The City of Aliquippa Council submitted and voted on a resolution to rezone the parcel to allow data center development, but the outcome is unknown. In the same slide deck, they proposed a second site in Aliquippa proximate to the one on Woodlawn Rd. However, even less has been done to show that this is in progress, as the land is still owned by Bet-Tech International (formerly LTV Steel).

Big Digital Energy Data Center

Big Digital Energy is an operating crypto mining data center run by Big Digital Energy, Inc. (formerly Mawson Infrastructure Group). It is located at 950 Railroad Ave in Midland, PA, at another brownfield site formerly owned by J&L Steel in Midland. This site is right across the Ohio River from the Shippingport Project Phoenix site. The data center has at least 120 MW of capacity, which may be expanded to 144 MW. An SEC 10-K form filed in April 2024 indicates that this data center utilizes grid power and air cooling. The parcel that the data center sits on is owned by Jewel Acquisition LLC, who also owns a parcel between the existing site and the river. Additionally, in the same slide deck describing the Aliquippa sites from Five 9s Digital, a potential data center site is also listed in Midland up the road from the Mawson Data Center on 234 acres. This potential site is on parcels owned by Jewel Acquisition LLC and Midland LP. It is unclear at this time whether/how the existing data center will expand geographically or whether the Five 9s Digital site proposal is in any way connected to the existing Big Digital Energy site.

Satellite map of the Big Digital Energy site and other Midland parcels along the Ohio River.
Existing Big Digital Energy Midland data center site and other Midland parcels owned by Jewel Acquisition LLC and Midland LP. Source: Five 9s Digital, Beaver County Geo Hub, and FracTracker Alliance.

Washington and Greene Counties

Washington County was carved from a western portion of Westmoreland County in the 1700s and is home to universities, three county parks, and fourteen school districts. It has an extractive history including coal and natural gas, and is the most fracked county in Pennsylvania. In 2004, Pennsylvania’s first Marcellus shale gas well was drilled in Washington County. As of 2026, more than 2,200 fracked wells have been drilled in Washington County. The County population is around 210,000, with a median household income of nearly $79,000. Major pipelines, including Energy Transfer’s Revolution Pipeline, run through portions of the county, which makes it an attractive site for data center development. Washington County has four data center proposals and pre-proposals: Starpointe Industrial Park Data Center, Fort Cherry Development District, Champion Data Center Land Advertisement, and Zediker Station Data Center. Residents in Washington County have responded strongly to the data center buildout, with Hanover Township and South Strabane preemptively updating their ordinances to include data centers and heavy turnout at conditional use hearings.

Greene County is a rural community located in the southwestern corner of Pennsylvania, bordered by West Virginia to the south and the Monongahela River to the east. It is home to 33,885 people living across the county’s 578 square miles, with a median household income of over $68,000. It is an agricultural area with a university and a long-standing energy hub and technology center. Project Hummingbird is the only data center development in the County so far.

Table 4. Data Centers in Washington and Greene Counties, PA

Name and addressStatusStakeholdersPower
Project Hummingbird
Alicia Road, Greensboro, PA 15338
ProposedEssential Utilities, International Electric Power of Pittsburgh (power provider)Up to 910 MW, behind-the-meter gas
Starpointe Industrial Park Data Center
Starpointe Blvd, Burgettstown, PA 15021
Permits under reviewPrime Data Centers LLC (developer)450 MW, behind-the-meter gas
Fort Cherry Development District
Fort Cherry Road, McDonald, PA 15057
Under constructionImperial Land Corporation (developer), Liberty Energy (power provider), Range Resources (power provider)Uncertain, behind-the-meter gas
Champion Data Center
near Pittsburgh International Airport, Robinson Township, PA 15057
Land advertisementNext Generation Land Company (developer)Uncertain
Zediker Station Data Center
off Zediker Station Rd, South Strabane Township, PA 15301
Land advertisementCNX Resources (land owner), Jones Lang LaSalle (marketing and leasing)500-700 MW, behind-the-meter gas

Project Hummingbird

Project Hummingbird is a proposed data center campus on the former Robena Mine brownfield site in Monongahela Township, Greene County, PA. International Electric Power (IEP) is leading the project, with plans for a total 910 MW build-out using on-site fracked gas power. Power sources include two Siemens H-class turbines that will power both the data center and the surrounding grid via the Ronco substation and the GMTJSA lines at Cabbage Flats, paired with a 1,820 MWh battery storage system for peak hours and backup generation. Developers cite a direct dedicated pipeline with up to 160,000 MMBtu/day capacity, sourced from Utica and Marcellus Shale under a firm 10+ year contract.

IEP has broken the development down into five phases:

  1. Reclamation grading and installation of domestic wet utilities (water and sewer to serve Sites 1 and 2)
  2. Construction of the water intake and treatment facilities, on-site power plant, and electric substation at Site 1
  3. Temporary internal power supply to the initial data center facilities on Site 2
  4. Construction of data center buildings on Site 2
  5. Ongoing reclamation activities west of Whitley Creek

No data center tenant has been explicitly identified, and only Phase 1 (site reclamation) of 5 has been approved by the Greene County Planning Commission as of December 2025. The behind-the-meter power plant and the data center itself are still up for review.

IEP site plan for the Robena megasite showing the dedicated power plant and development sites.
Source: IEP.

At the December 17, 2025, Planning Commission meeting, residents raised concerns about the risks associated with reclamation and data center operations. Because the site sits on former mine land, subsidence is high-risk, and the land remains in DEP's mine subsidence insurance program. The reclamation plan, in particular, calls for roughly 40,000 cubic yards of fill, partly within a floodplain, requiring formal FEMA review. IEP points to their three months of core sampling and planned pilings as a mitigation approach. Additionally, the project seeks to raise the site’s power island by an average of about 16 feet. There is also the question of who’s financially responsible for reclamation of the site. A 2021 DCED-commissioned redevelopment playbook (under Section 6.1.1) for the Robena site reference a state-held reclamation bond of $7 million is posted by CONSOL Energy to guarantee reclamation is completed, otherwise CONSOL remains liable. The bonds are only released once an approved post-mining land use application goes through, however it is unclear whether that figure still reflects the current situation five years later.
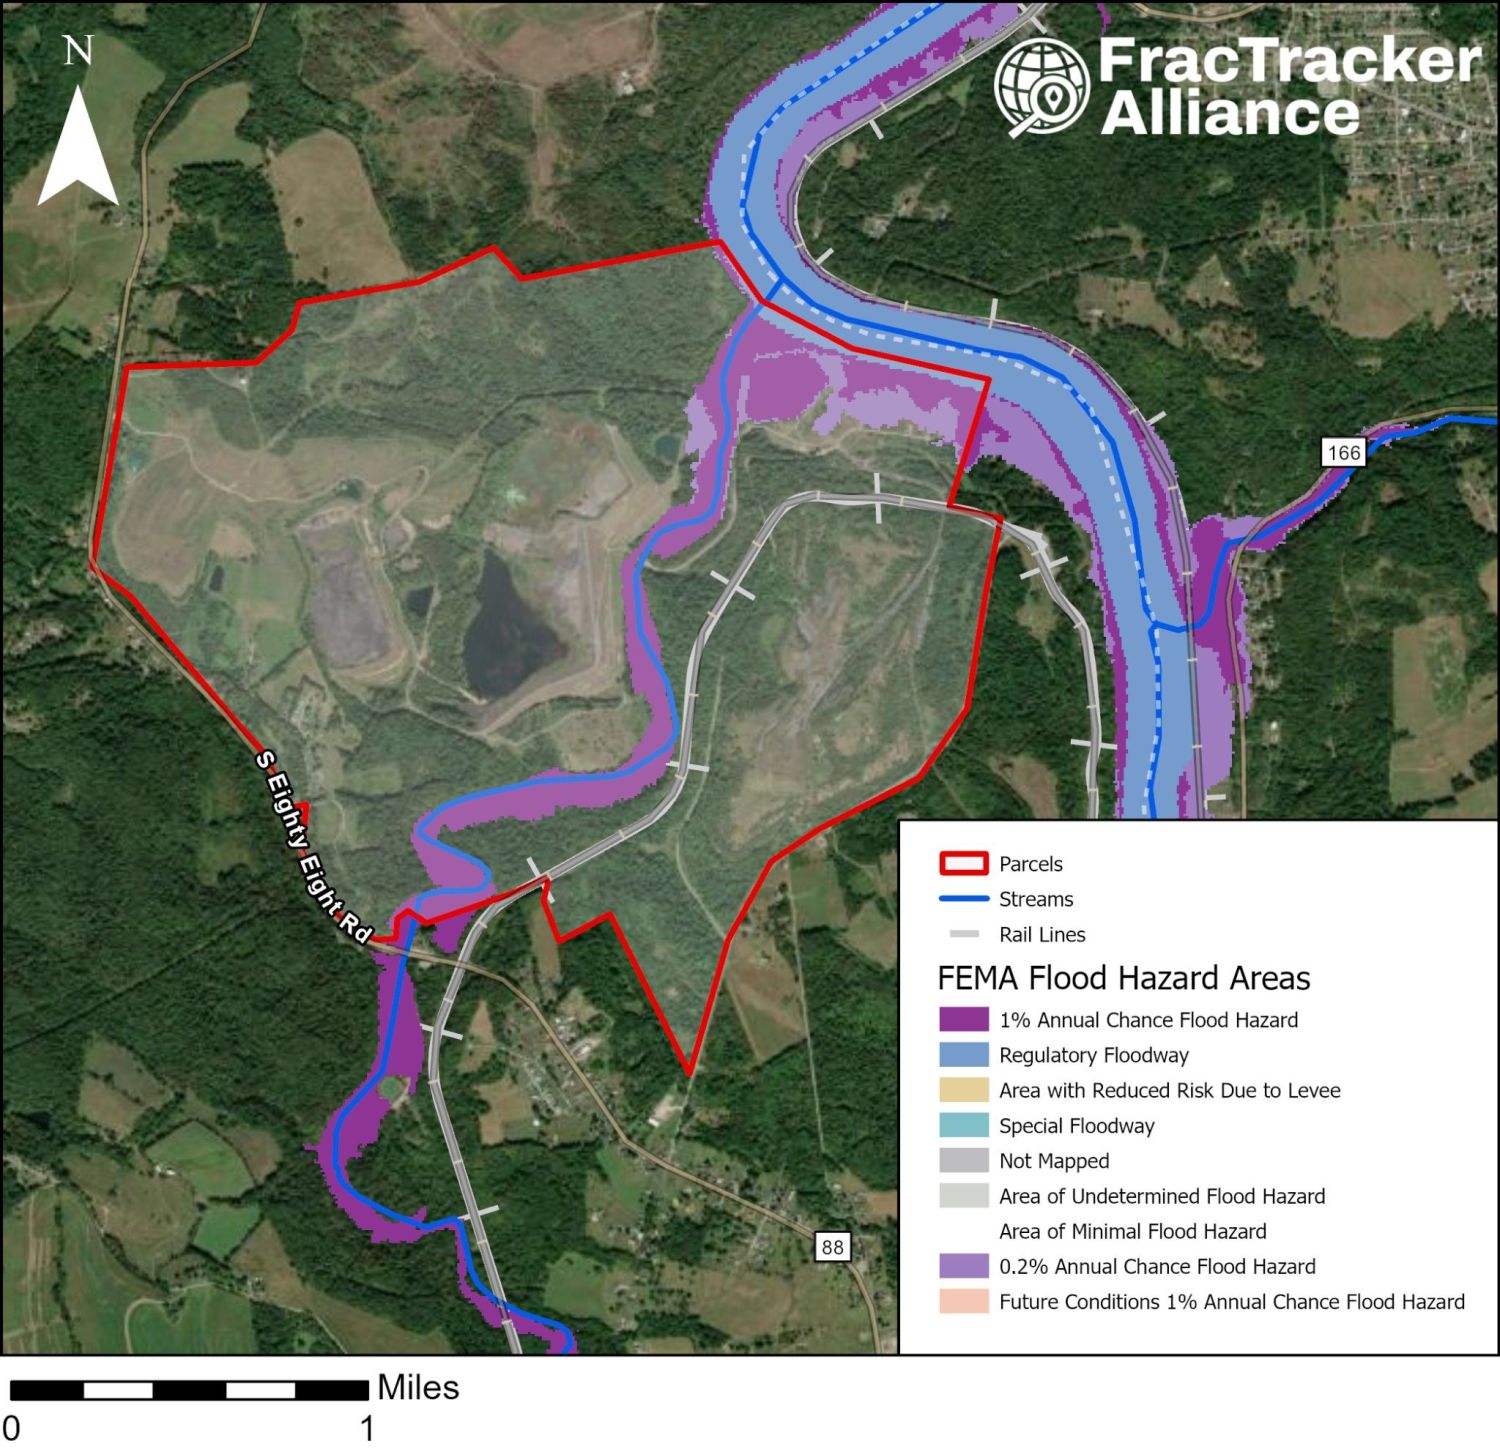
FEMA flood hazard map of the Project Hummingbird site along the Monongahela River and Whitley Creek.
The Project Hummingbird site is adjacent to the Monongahela River and is bisected by Whitley Creek, making it susceptible to floods. Source: FEMA Flood Map and FracTracker Alliance.

The site’s plan to use battery storage, in particular zinc-bromide Z3 batteries produced by EOS, also poses risks. At the same Planning Commission meeting in December, a resident testified during public comment that its safety data sheet flags it as toxic to aquatic life. Two documented off-gassing or spillage incidents were cited at that same meeting as having occurred at EOS’s own facility in the past two years, including a November 2025 incident at EOS’s Turtle Creek, PA facility. So far, IEP has only committed to future “diking and secondary containment,” without finalizing a plan.

For cooling, the proposal specifies an open-loop cooling system using water sourced from the Monongahela River. In IEP’s site packet, they advertise 18 million gallons per day of water capacity through a partnership with Essential Utilities/Aqua America. This estimate describes contracted capacity rather than daily use. In addition, residents have raised concerns about existing cancer-causing chemicals already in the river, and whether PFAS could be heated and vented to the atmosphere during cooling. A resident also cited that the local fire company has no ambulance service, and no funding, equipment, or training commitment has been made on record for a project at this scale. Residents also raised questions of Fayette EMS’s response times and level of care after an incident with a neighbor.

The Alicia community sits within a DEP-designated environmental justice area, in roughly the highest-risk 6% of communities nationally. This reflects a burden tied to the area’s history of coal mining and gas drilling. Community response and pushback have been organized primarily through the Center for Coalfield Justice (CCJ), which hosted a public meeting soon after the project’s announcement. Later, CCJ published a negotiations outline for residents, highlighting demands for local hiring, land buyout, and a share fund. Separate Community Benefit Agreements (CBAs) are in motion: one is being drafted by Township Supervisors in partnership with IEP, and another by Alicia residents.

Notably, Greene County has no county-wide zoning. It is important to recognize that though Hummingbird’s land use application states it does not intend to construct any single structure over 625 square feet, this can be misleading when taking into account proposed data centers and inconsistencies with the county’s SALDO. In looking at the full permitting chain, Township Supervisors stated the following review order: federal and state agencies, the county planning commission, the Greene County Conservation District, then the township’s engineer and solicitor will review road, stormwater, sewage, floodplain, and Universal Building Code compliance. Regarding zoning, Monongahela Township itself is not a zoned community, so it has no legal authority on the fronts of approval or disapproval for the location of proposed construction.

Fort Cherry Development District

The Fort Cherry proposal features a multi-tenant industrial park, flex logistics space, and high-density data center facilities. Imperial Land Corporation is the land developer while Liberty Energy Inc and Range Resources – Appalachia, LLC are partners in the onsite power generation agreement. Phase One of development was recently completed and includes three pad-ready development sites. The plant would start with modular 25 MW gas-fired blocks and could scale to 1 GW or more on the roughly 875-acre site. The power source will be fracked gas, and the data center will utilize a closed-loop water cooling system. The next development stages will include extension of critical roadways and traffic infrastructure and installation and connection of site utilities, including water, sewage, stormwater management, and gas lines.

Map of the Fort Cherry site between Midway and McDonald, surrounded by well pads, compressor stations, and pipelines.
Imperial Land Corporation schematic of the Fort Cherry Development District build-out phases.
Data center site sandwiched between the urban areas of Midway and McDonald and surrounded by fracked wellpads, compressor stations, and pipelines including the Falcon and Revolution (top); developer schematic (bottom). Sources: Imperial Land Corporation, Washington County General GIS Viewer, PA DEP Air Quality Permit Report, and FracTracker Alliance.

Timeline

  • March 2025Initial planning and infrastructure context advanced for the broader site in Robinson Township, Washington County.
  • April 2025Liberty Energy Inc., Imperial Land Corporation, and Range Resources announced a partnership to build an on-site, modular gas-fired plant starting at 25 MW with the potential to scale up to 1 GW to support future data center tenants.
  • October 2025The site has secured $7,700,400 through Pennsylvania's PA SITES program, consisting of a $5,175,000 grant and a $2,525,400 loan awarded to the Imperial Land Corporation for phases two and three of development.
  • Spring 2026Ongoing development between the corporate partnership and prospective anchor data center tenants while infrastructure preparations progress.

Starpointe Industrial Park Data Center

Starpointe Industrial Park is a data center development proposal site in Hanover Township, PA. The developer is Prime Data Centers LLC. The private land sale was negotiated between ALTIAN and Independence Excavating with little input or oversight from the Washington County Council on Economic Development. The hyperscale 450 MW proposal describes seven one-story buildings (1,500,000 sq ft) on 800 acres utilizing a closed-loop water cooling system.

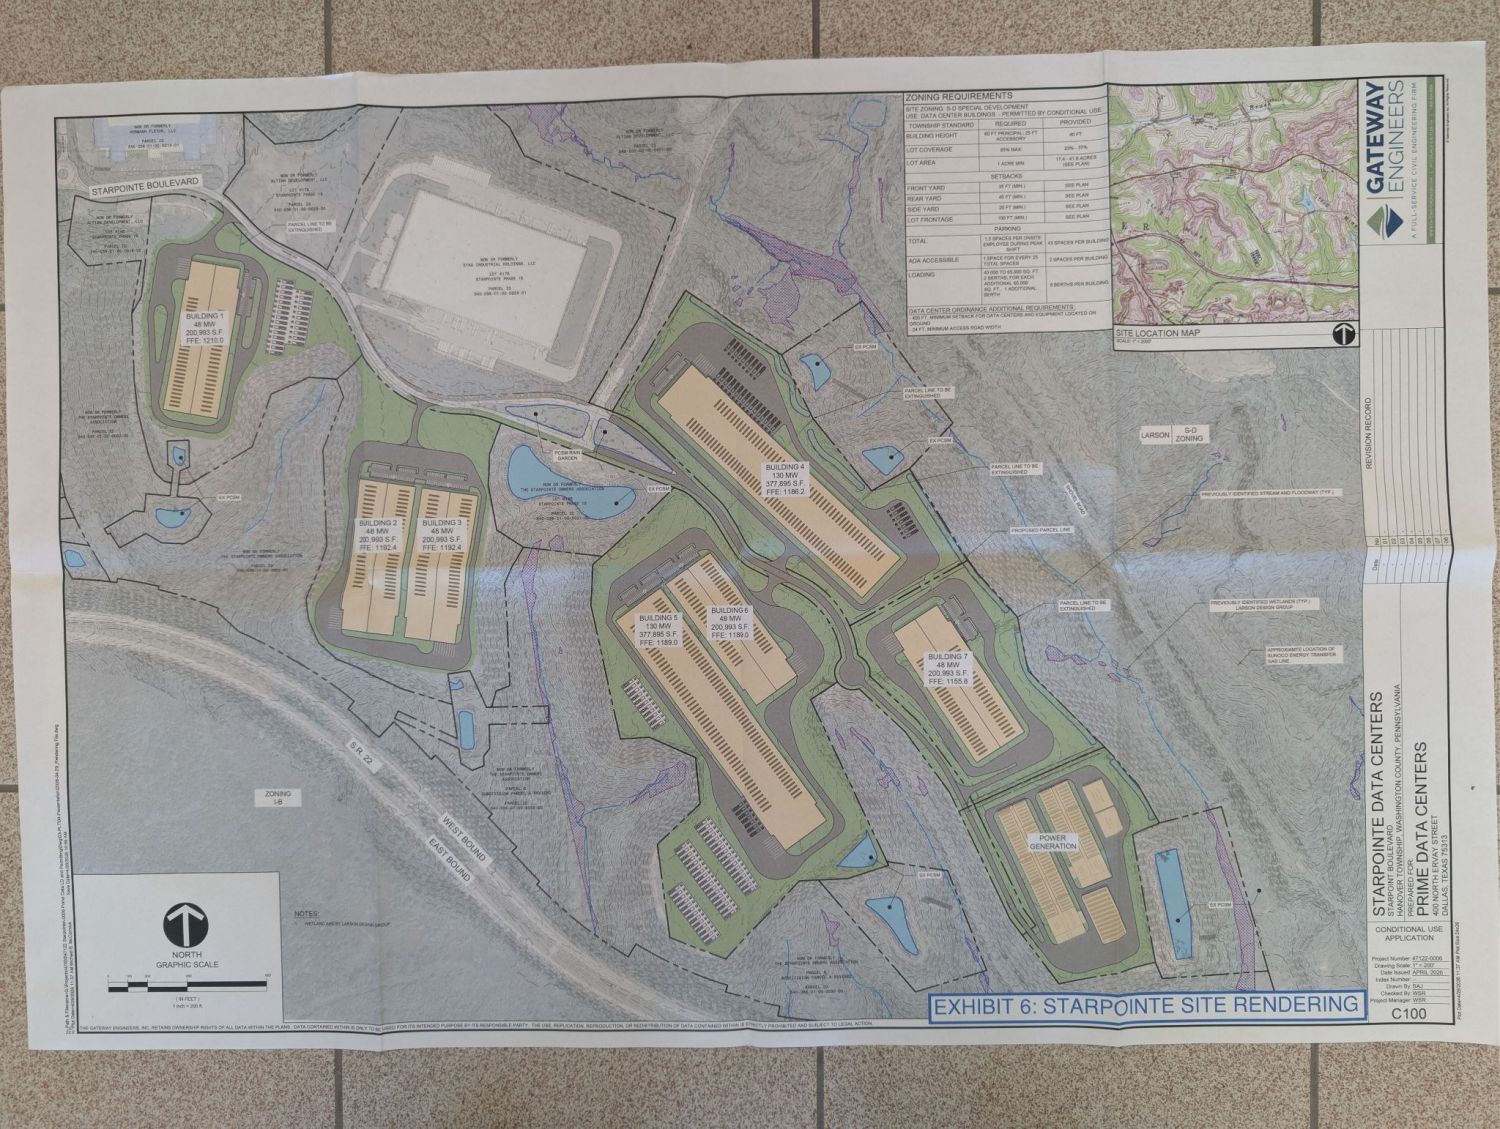
Map of the Starpointe data center parcels near the Revolution and Rover pipelines.
Photograph of the printed Starpointe site rendering from the conditional use application.
Proximity of the data center site to the Revolution and Rover Pipelines (top); data center schematic (bottom). Source: Prime Data Centers via Protect Burgettstown.

Timeline

  • Early Spring 2026Conditional use applications dated and submitted to the township.
  • June 2026Prime Data Centers presented their plans at a Planning Commission Meeting. They discussed their conditional use applications for data centers and a power generation facility in Starpointe. The Township engineer provided a review letter and shared comments on the sound study and utility connections, and Prime indicated willingness to comply.
  • August–September 2026Conditional use hearings (August 5, continued to August 31; further sessions September 21–30)

During Phase 1, the data center buildings would encompass more than 1.5 million square feet within the S-D and I-B zoning district. The site already has an NPDES permit for wastewater discharge. A separate conditional use application has been submitted for the behind-the-meter gas generation. The site will use fracked gas from the Energy Transfer-owned Revolution Pipeline via the Rover Pipeline.

Photograph of a printed rendering of the proposed Starpointe power plant.
Power plant rendering from the conditional use application submitted to Hanover Township. Sources: Washington County General GIS Viewer, RTK request visit to Hanover Township Municipal Building, also available here: Prime Data Centers via Protect Burgettstown.

The data center is about 1 mile from The Pavilion at Star Lake and the Pepsi Cola Roadhouse, two popular music venues that many people visit. Hanover Community Park also falls within this 1-mile buffer, and Hillman State Park is about 2.5 miles away.
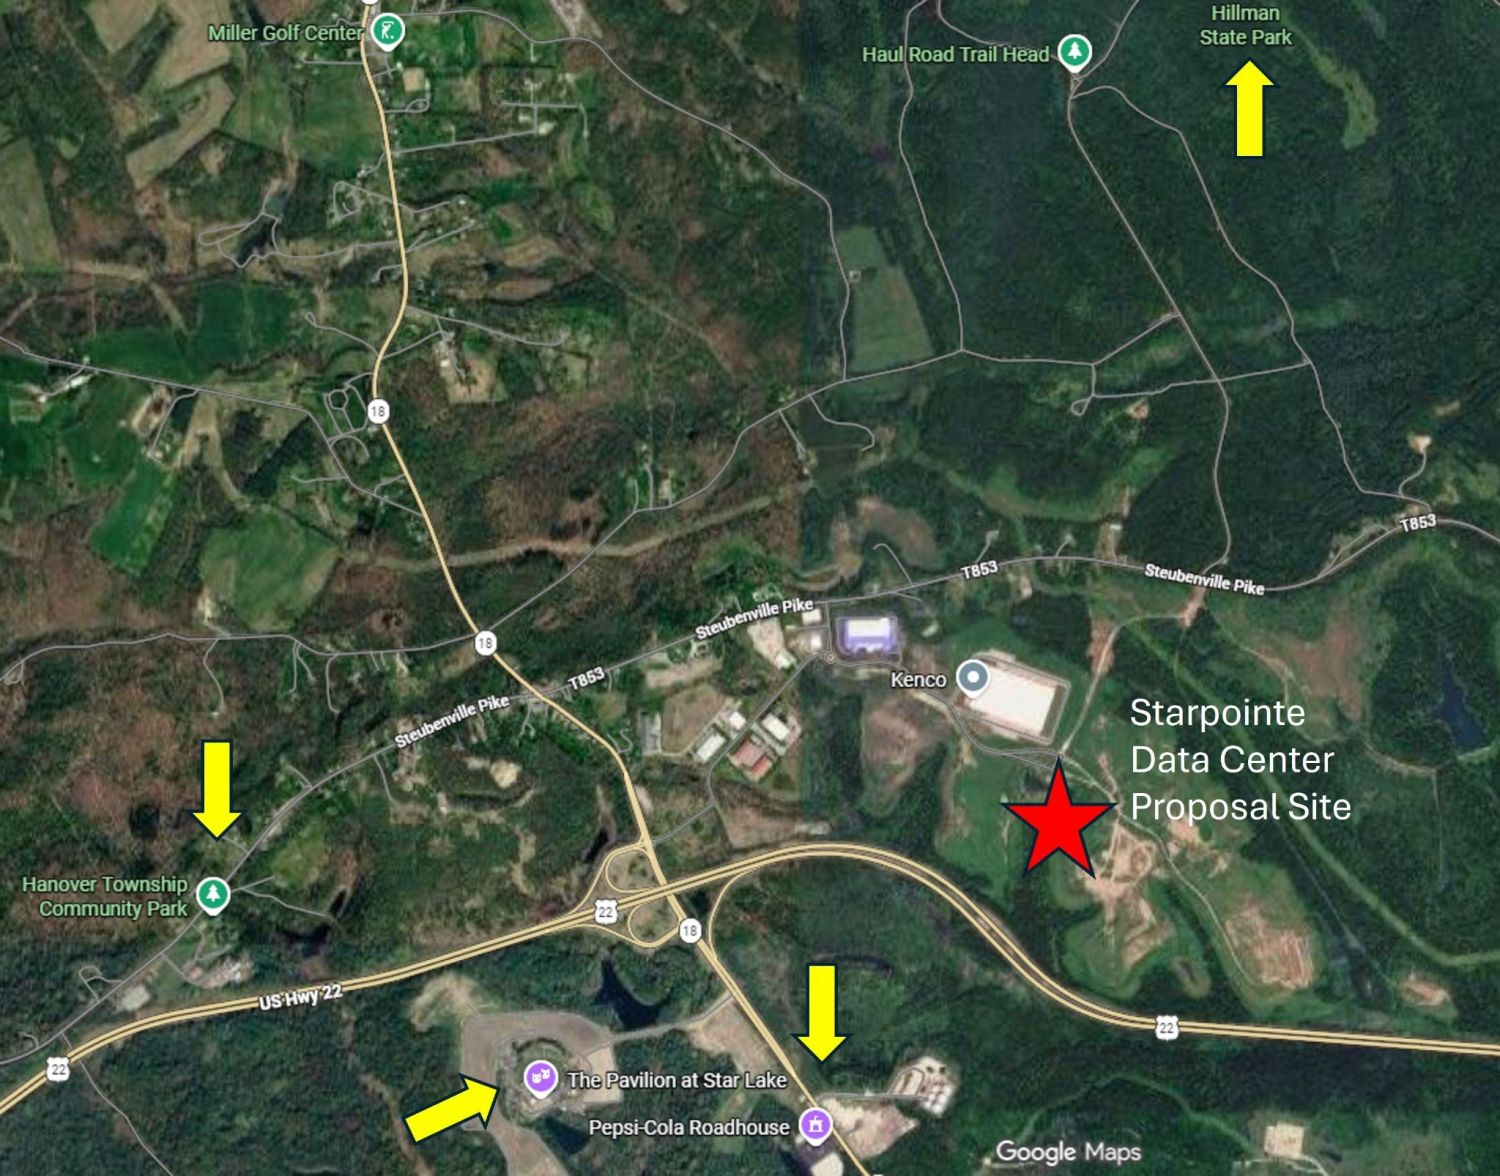
Google Maps view of community sites near the Starpointe proposal, including Star Lake, Hanover Community Park, and Hillman State Park.
Community sites near the Starpointe Data Center. Source: GoogleMaps.

There has been strong community pushback against the data center development, as evident by the widespread use of yard signs and the high turnout at the conditional use hearing. The yard signs include Protect Burgettstown resources (including this petition). The ordinance in place for Hanover Township (enacted March 30, 2026) addresses noise pollution, vibration, light pollution, water usage, decommissioning, emergency plans, environmental monitoring, air quality, waste management, and community benefit agreement, though some question whether it is protective enough.
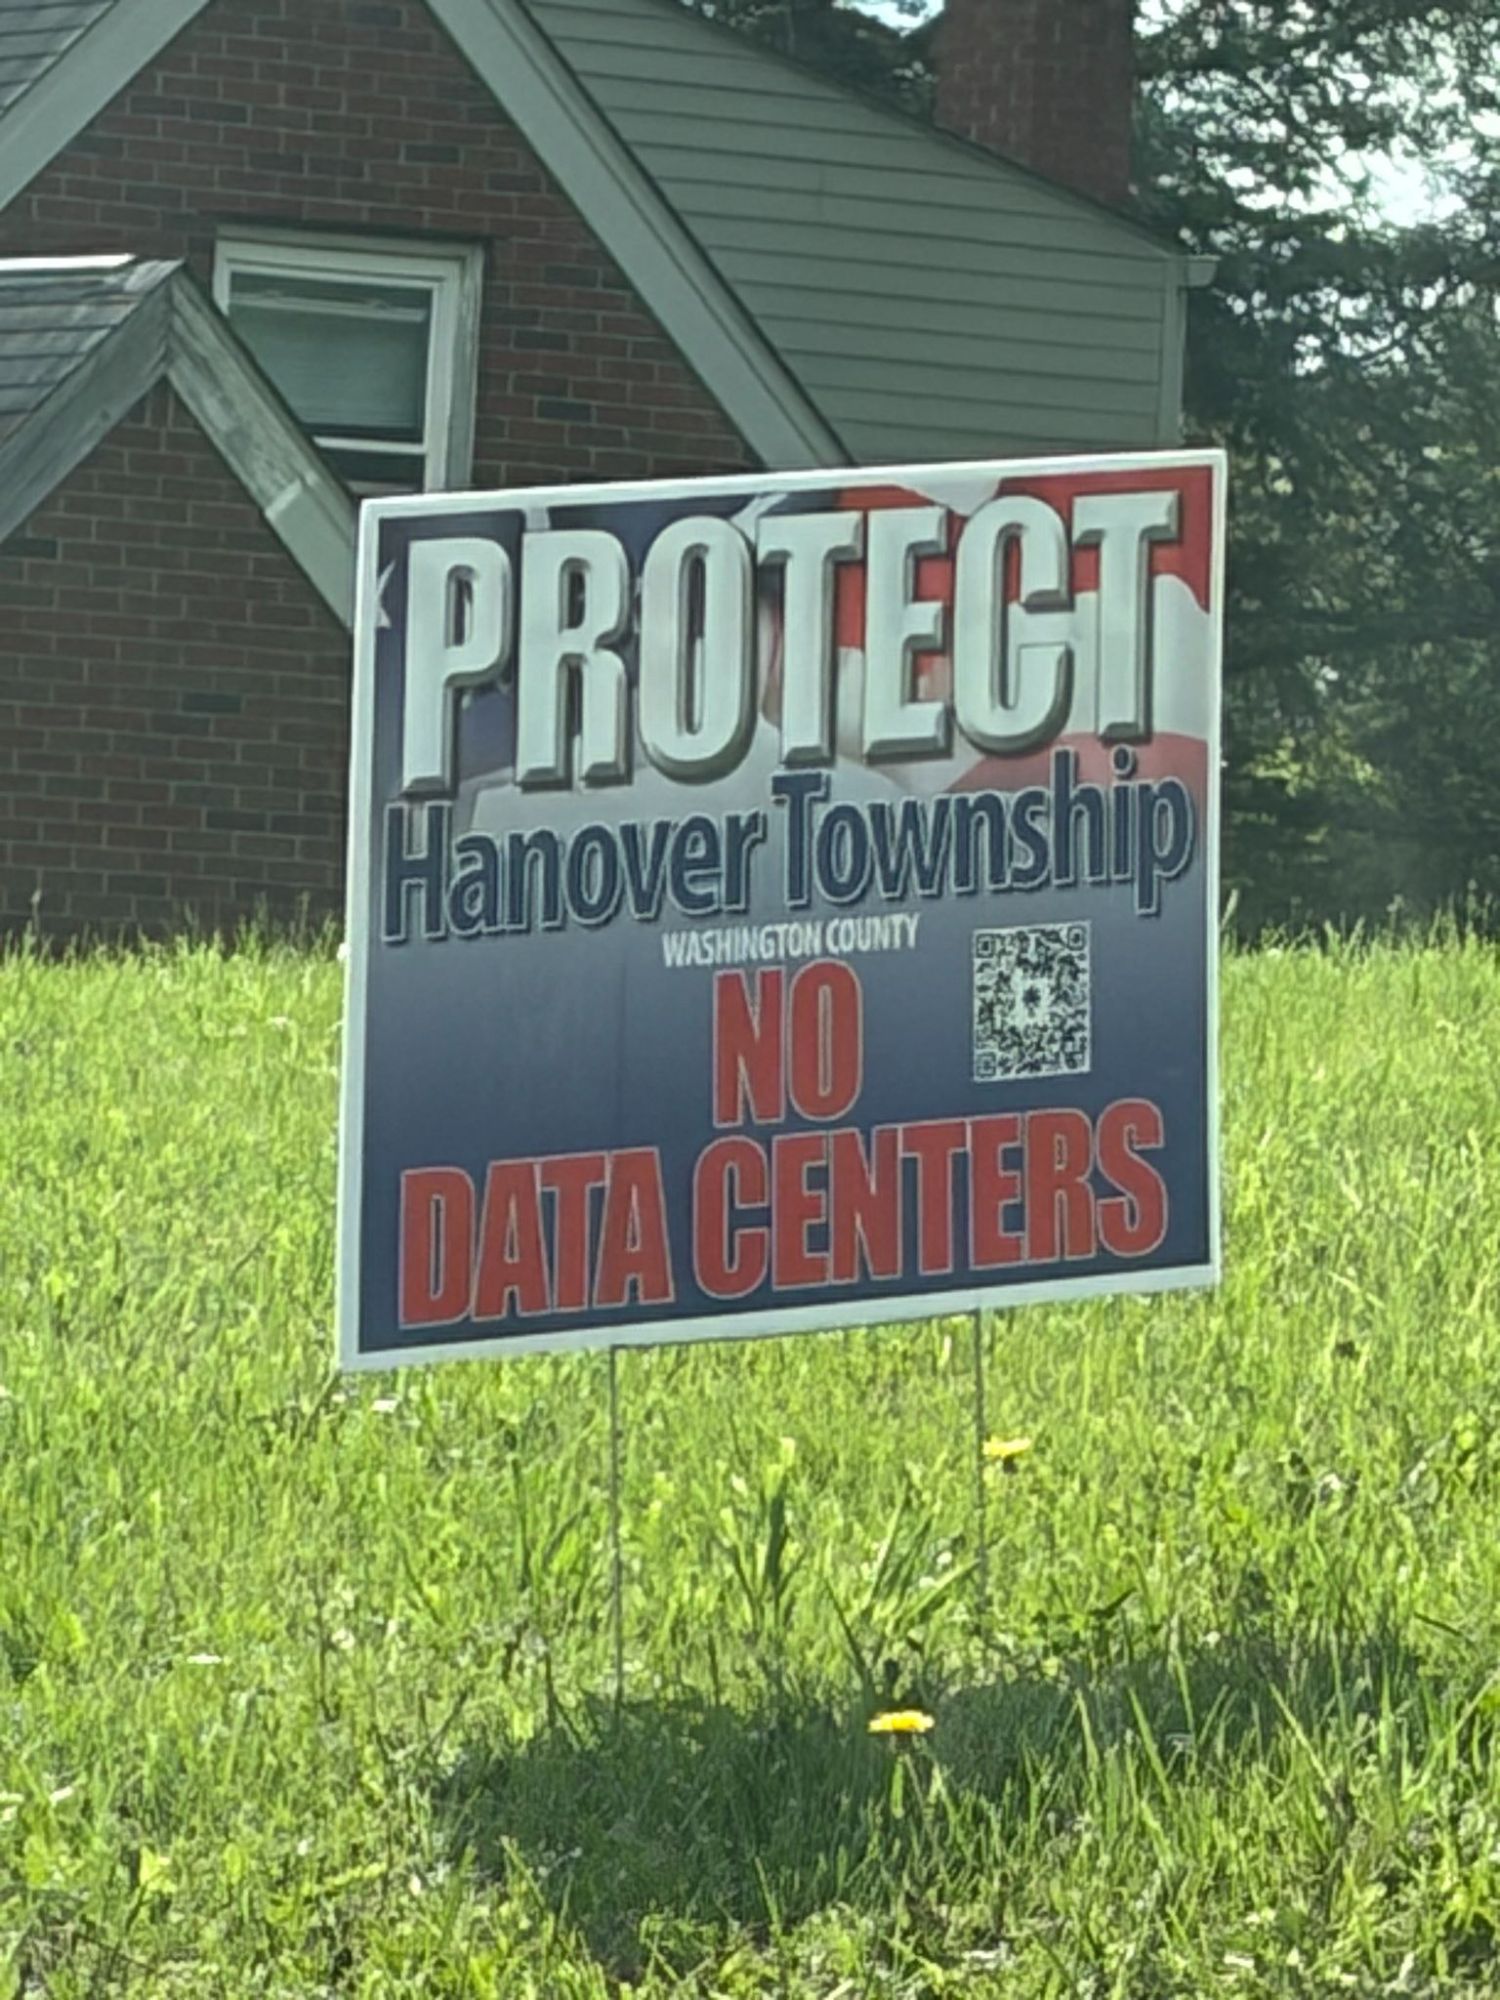
Yard sign reading "Protect Hanover Township: No Data Centers."
Yard sign in Hanover Township. Source: Jenna Hoover.

Zediker Station Data Center Land Advertisement

In the late 1800s in South Strabane Township, the Zediker family ran a farm on 1,200 acres of land in Washington County. In the 1900s, Robert Zediker donated a portion of the farm to the Baltimore & Ohio Railroad. The Meadow Land and Zediker Station opened on May 14, 1904, and ran between Meadow Lands and Manifold Mine (a 1.72-mile stretch of track crucial for the transportation of coal in Western Pennsylvania during that time period). CNX Resources currently owns the site, and they are interested in developing a hyperscale AI data center there with Jones Lang LaSalle (JLL).
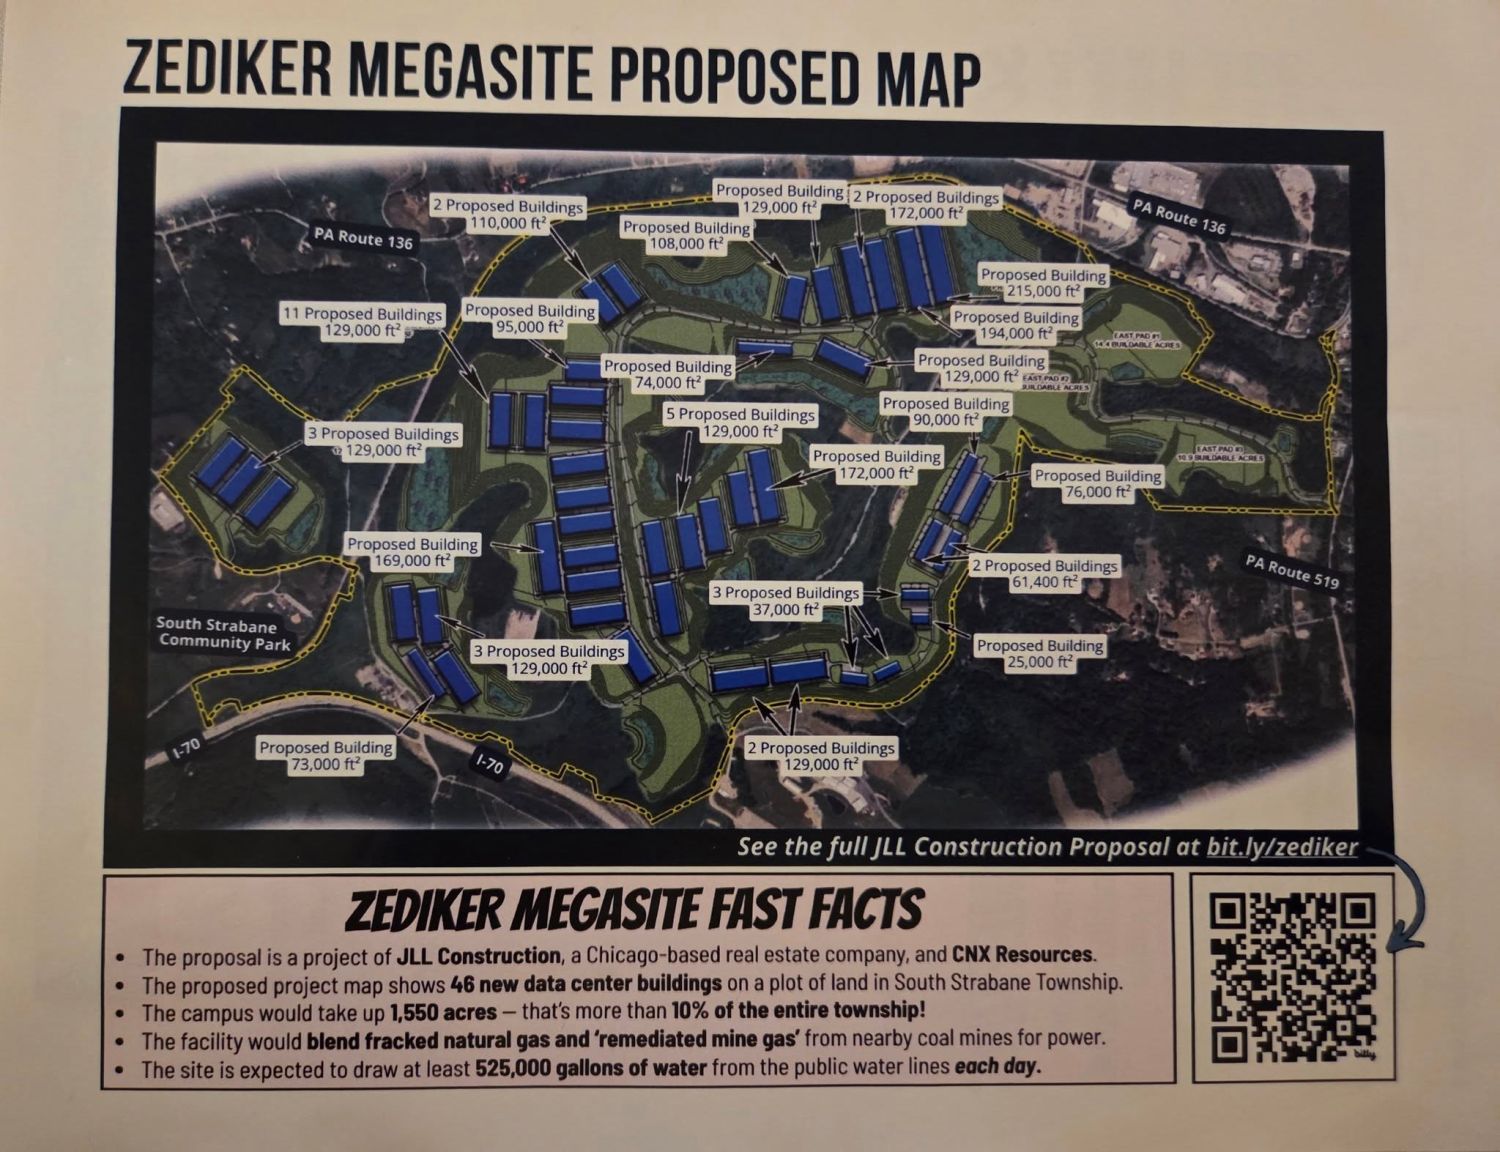
Flyer titled "Zediker Megasite Proposed Map" showing dozens of proposed data center buildings.
Site schematic of the Zediker Data Center obtained from a Facebook post. The original bit.ly site no longer seems to be active.

Timeline

  • October 20, 2025Real estate firm JLL and owner CNX Resources announce plans to market the 1,400-to-1,500-acre Zediker Station property in South Strabane Township as a carbon-neutral hyperscale data center site.
  • December 2025South Strabane Township begins discussing preliminary draft zoning rules to regulate potential high-tech infrastructure.
  • February 10, 2026South Strabane Township officially releases its draft data center zoning framework for public review.
  • March 3, 2026The Allegheny Conference releases an economic impact analysis.
  • March 19, 2026The Planning Commission recommended that supervisors approve the proposed data center and setback rules despite pushback from CNX representatives calling the restrictions exclusionary.
  • June 9, 2026The South Strabane Township Board of Supervisors votes unanimously to adopt the data center ordinance. Under the ordinance, any data center proposal must include the latest water-conservation technology, including closed-loop systems to reduce demand on public water.

The site is proposed as “carbon-neutral” through the utilization of remediated mine gas. RMG is waste methane captured from coal mine ventilation systems. Township leaders are currently drafting a third ordinance governing fossil fuel power generation. The site has access to CSX and Norfolk Southern rail lines, is near FirstEnergy Corporation electrical infrastructure, and plans to access onsite and nearby fracked wells to supply 500-700 MW of power. The Allegheny Conference on Community Development conducted an economic impact analysis for the hypothetical data center on Zediker Station Road, promising economic output, jobs, and tax revenue. CNX Resources and JLL provided these figures.
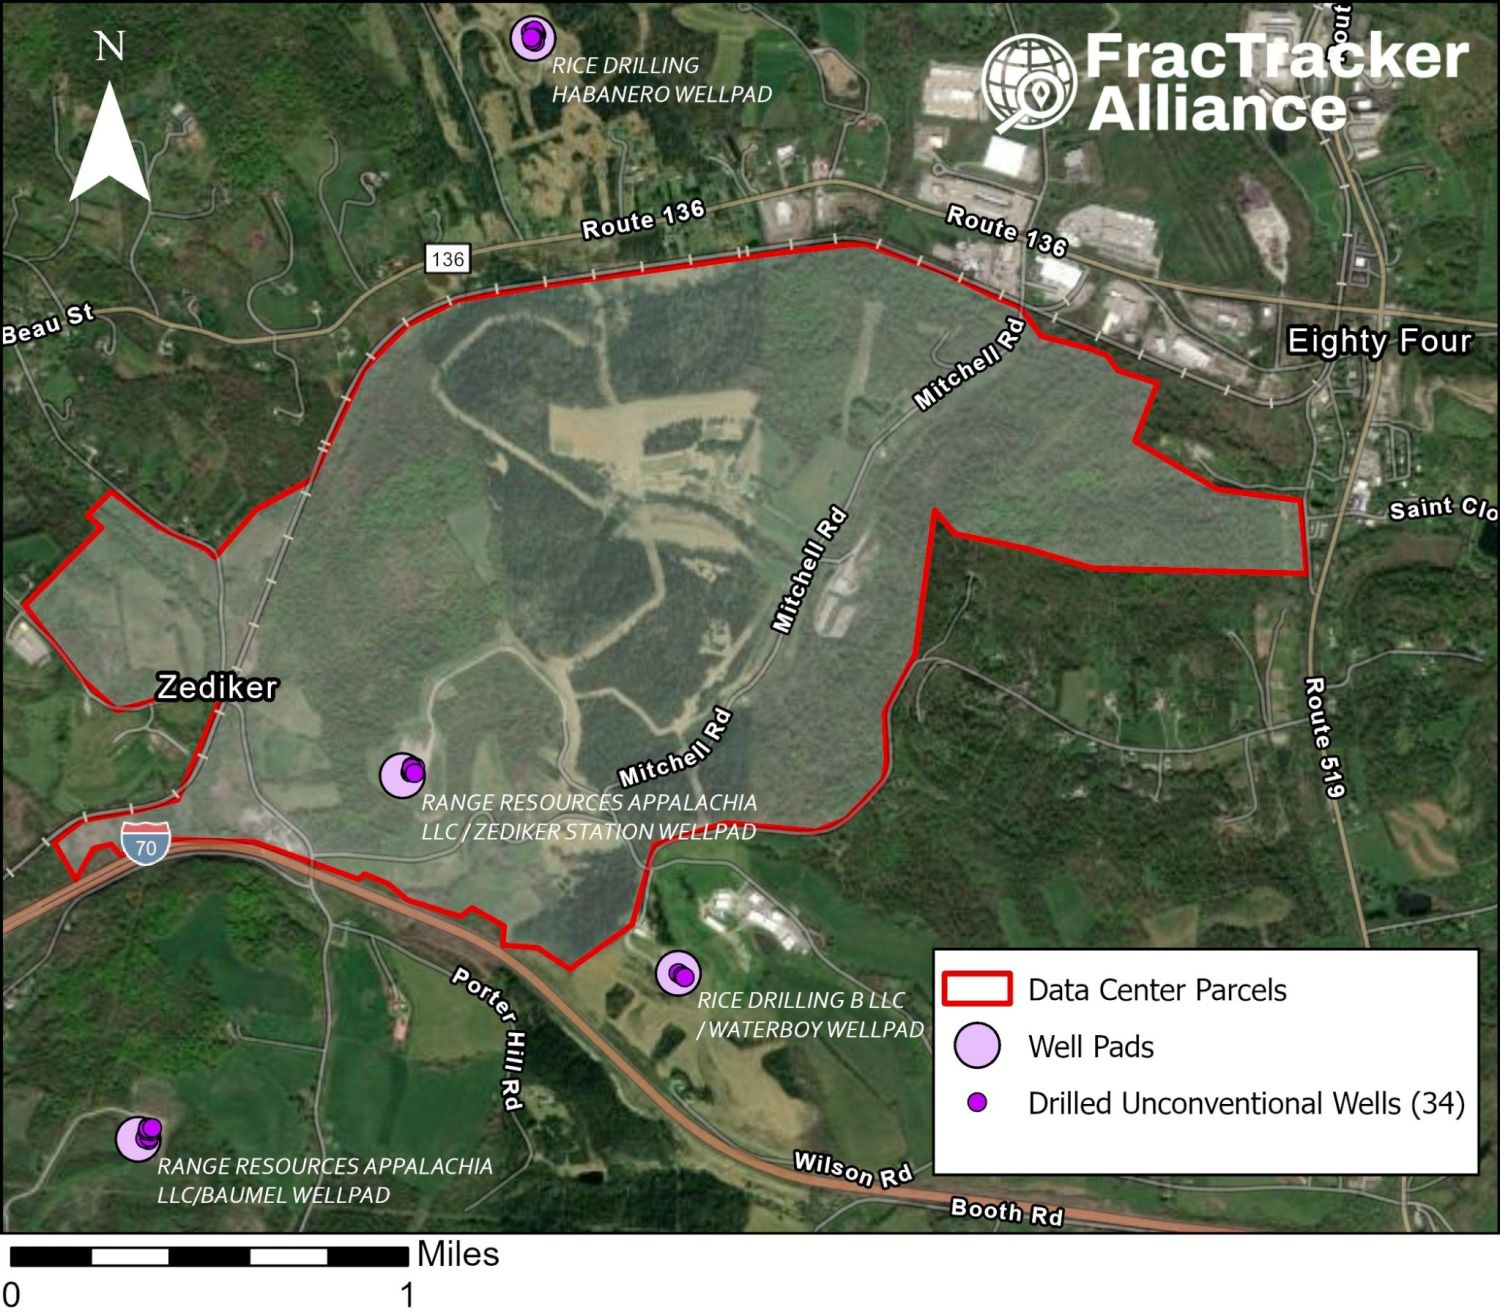
Map of the Zediker Station site with nearby well pads and 34 drilled unconventional wells.
The Zediker data center proposal site is in close proximity to four well pads with 34 drilled fracked wells and is bordered by rail lines. Sources: Washington County General GIS Viewer, PA DEP Unconventional Well Locations, and FracTracker Alliance.

In an interview, a resident from the community stated: “First of all, we’re concerned, really, about changing the character of the community here. I’m concerned about electricity rates going up, water rates going up, noise, light…”. Additionally, Commissioner Electra Janis made a statement saying: “It’s really just not fair to the residents to put that [data center] in there. It does deserve development, but not that type of development”. A community petition is seeking 1,000 signatures from concerned citizens.
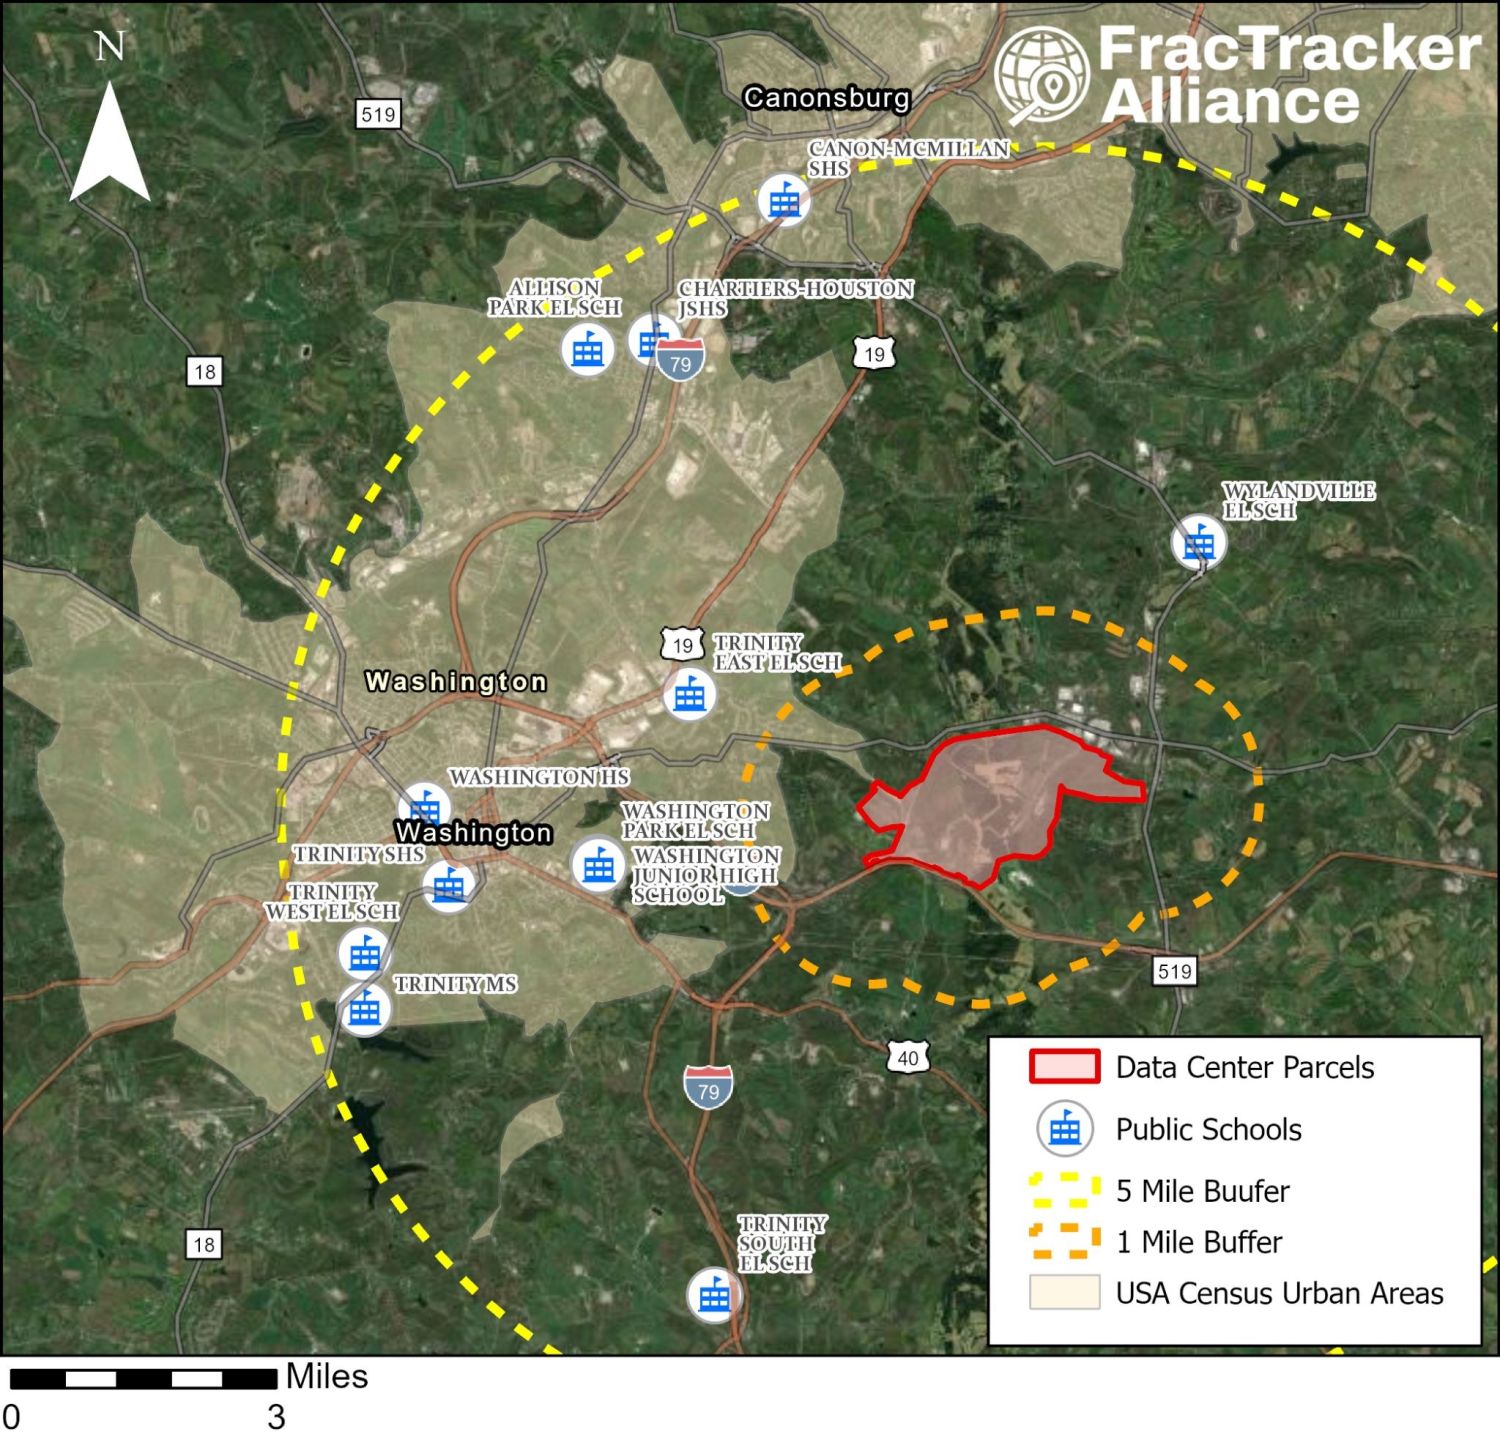
Map of public schools and the City of Washington within 5 miles of the Zediker site.
Within 5 miles of the Zediker data center proposal site sit the City of Washington and a dozen schools. Source: former Homeland Infrastructure Foundation-Level Data (HIFLD) from the Department of Homeland Security and FracTracker Alliance.

Champion Data Center Land Advertisement

In March 2026, Next Generation Land Company CEO Brian Patten posted on LinkedIn, advertising the Champion Data Center Campus: a 1,039 acre parcel of brownfield land in McDonald. Next Generation Land Company operates by purchasing potential data center sites, securing permits and power capability, and selling them to clients. Champion Processing, Inc. purchased the land in November 2020. Selling points include access to major gas pipelines (allegedly 2 on-site and 4 others within 3 miles) and 5 GW of natural gas generation capacity (upgradeable to 16 GW). Additionally, existing grid connections could allow up to 315 MW of power. The feasibility of these claims is not provided.

Satellite map of the Champion data center parcel in Washington County.
Source: Washington County General GIS Viewer and FracTracker Alliance.

The site sits on the Beech Hollow slate pile, the largest collection of coal waste "East of the Mississippi". This may relate to the advertisement’s mention of “carbon-negative power” at $0.012 per kWh, which claims that on-site vacuum pyrolysis would turn coal waste into sustainable energy. Vacuum pyrolysis derives energy from agricultural waste. Additionally, the area is a potential Keystone Opportunity Zone, offering significant tax benefits for up to ten years. Notably, the site is seven miles away from the Fort Cherry Junior-Senior High School. The site and adjacent areas, such as parts of Smith Township, are designated Environmental Justice Areas under PennEnviroScreen. The census block group has a population of 1,147 and ranks in the 98.7th percentile for pollution burden and the 73.5th percentile for asthma diagnoses.


Discussion

Across the twelve proposals we tracked in Allegheny, Beaver, Greene, Indiana, Washington, and Westmoreland counties, several patterns emerged. We noticed that many of the developments took advantage of spaces left over by former industries, spaces associated with many years of pollution, community harm, and environmental impacts. It was also difficult to find details about the specifics of the developments, especially descriptions of how developments might provide benefits to the communities they mean to share. Finally, we saw a good deal of uncertainty. The extent to which Southwestern PA will be reshaped into a data center landscape still remains to be determined.

Legacy industrial sites

Nearly every proposal we researched is sited on an industrial brownfield. The Homer City Energy Campus occupies what was once Pennsylvania's largest coal plant, Project Phoenix is planned on the retired coal-fired Bruce Mansfield Power Plant, and the Springdale Dynamo Data Center is sited on the former coal-fired Cheswick Generating Plant. In Beaver County, both the Aliquippa land advertisement and the operating Big Digital Energy facility in Midland sit on former J&L Steel property. Project Hummingbird would be built on the former Robena Mine, and the Champion advertisement sits on the Beech Hollow (Champion) coal refuse pile.

Brownfield sites are typically close to transmission interconnections, substations, rail access, pipeline rights-of-way, and water access. At Homer City, the developer explicitly retained the retired coal plant's PJM grid interconnection rights. These sites also have industrial zoning in place, which is appealing since rezoning can be a hard-fought battle that can stop a project from moving forward. Additionally, these sites are difficult to remediate and return to productive use, making proposals difficult to turn away. However, redevelopment often does not erase pollution, but instead builds on top of it.

Siting in environmental justice communities

Sites shaped by the region’s extractive history are, unsurprisingly, located in vulnerable communities with disproportionate existing environmental exposure burdens and high rates of existing health problems. To identify such communities and ongoing legacies of environmental harm, the DEP designates certain places environmental justice areas. All of the data centers that we researched, except for Upper Burrell’s Keystone Connect, Project Phoenix, Starpointe Industrial Park Data Center, and the Zediker Station Data Center, are located in environmental justice communities.
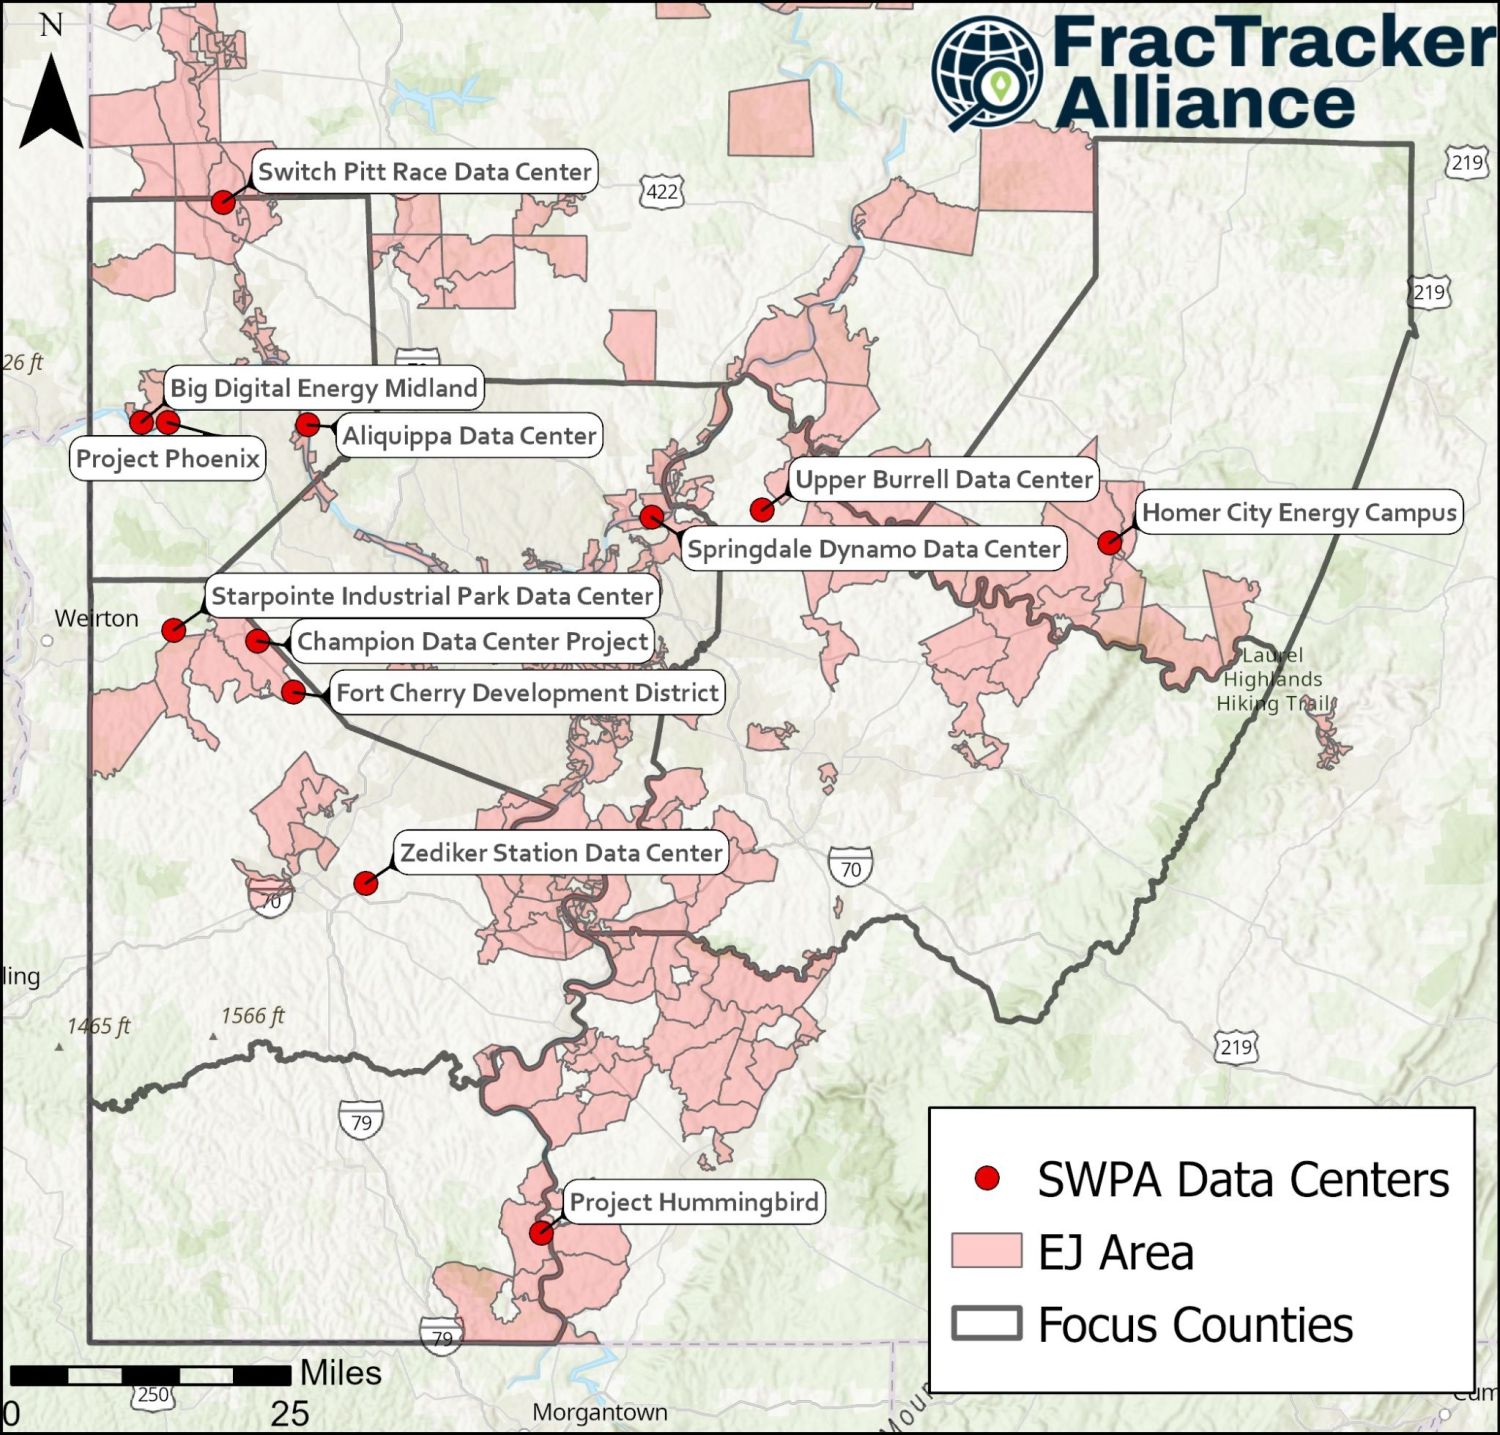
Map of the 12 Southwestern Pennsylvania data center sites and DEP environmental justice areas.
Two-thirds of the data centers we studied are proposed in environmental justice (EJ) areas. Source: PennEnviroScreen and FracTracker Alliance.

Fracked gas buildout

The abundant fracked gas in southwestern PA has made it an attractive location for data center proposals. Nine of the twelve projects we researched feature behind-the-meter power generation. Homer City, Upper Burrell’s Keystone Connect, and Project Phoenix each plan 2 gigawatts (2,000 MW) or more of behind-the-meter generation. Project Hummingbird plans 910 MW, and Fort Cherry’s power partners say its plant could scale up to 1 GW. EQT, a major fracked gas company, is contracted to supply gas to Homer City and a gas plant Frontier planned at the Bruce Mansfield site, now Project Phoenix. Range Resources will supply gas to the Fort Cherry Development District, and CNX Resources owns the property at the Zediker Station site and would likely supply the remediated mine gas that the project advertises. Only Springdale’s Dynamo Data Center, Switch Pitt Race, and Big Digital Energy Midland plan to rely on the grid.

If all the proposals were built to their highest estimated capacities, more than 12.5 GW of new fracked gas-based electricity generation would be added to the region, not counting the three land advertisements at Aliquippa, Zediker Station, and Champion. To put this number in perspective, Pennsylvania used an average of about 16 GW in 2024, so this new generating capacity, if run continuously, would equal roughly three-quarters of the electricity used in the entire state. Such a buildout would mark a dramatic expansion of Pennsylvania’s fossil fuel industry, with impacts of a build out this size extending well beyond the property lines of the data centers. Additional fracked wells, gathering lines, compressor stations, and transmission will be needed to support the extraction, transport, and utilization of the gas.

Air quality concerns and cumulative pollution burden

The region stands to experience a notable decrease in air quality if these data centers and associated power generation become a reality. Air quality impacts are expected from data center back-up generators, onsite behind the meter generation, and indirect emissions from the increased fracking and power plant operation that will be needed to support grid connected facilities. These emissions can also have a considerable climate impact.

Burning gas emits toxins including nitrogen oxides (NOx), carbon monoxide, volatile organic compounds (VOCs), particulate matter (PM) 2.5, sulfur dioxide, and formaldehyde. These pollutants can increase asthma and respiratory problems, heart disease and stroke, and contribute to negative birth outcomes and cancer. Diesel backup generators are a particular concern as these units can emit 200-600 times more nitrogen oxides (NOx) than a natural gas power plant producing the same amount of energy. This effect is compounded when several data centers cluster in one area, like we are seeing in Beaver County and Washington County. The cumulative effects on air quality that are expected from this buildout merit evaluation and consideration, instead of the project-by-project assessment that is conducted for permits and other approval processes.

Unclear economic benefits

Developers often promise communities jobs and revenue in exchange for sharing their neighborhoods with loud industrial complexes. These benefits were one of the least documented parts of the proposals we reviewed. The most detailed economic analysis we saw was the Allegheny Conference on Community Development's study for Zediker Station, which projected $552 million in total economic output, 2,364 jobs, and millions in tax revenue. Where we could find data estimating job creation, we saw high numbers of construction jobs compared to a modest number of permanent positions. For example, Switch Pitt Race developers project around 100 permanent jobs compared to 2,000 construction jobs, and Homer City developers project 1,000 permanent jobs compared to 10,000 construction jobs. Due to the highly specialized nature of the work, many of these positions will be filled by traveling workers, not local residents. Homer City developers even plan to build temporary RV parks to house construction workers. Meanwhile, public money has already been dedicated to several projects, including Upper Burrell's Keystone Connect project and the Fort Cherry Development District.

Local control difficulties

Across the four projects we researched most closely, local control has been tested and has failed in several ways. In Springdale, the borough had no ordinance addressing data centers, so the developer could apply for project approval under a provision of the borough code covering uses "not specifically listed as permitted or conditional." The borough Council approved the conditional use permit over sustained public opposition because the Council members did not believe they could lawfully refuse. Upper Burrell enacted a 180-day curative amendment to update its local ordinances, but because the proposal had already been submitted, TECfusions’ Keystone Connect was grandfathered in. Shippingport had an ordinance addressing data centers, but Aligned requested eight variances from those limits and received seven. In Indiana County, the County's Subdivision and Land Development Ordinance (SALDO) is the only land-use tool available, and it is being amended to add data-center provisions while Amazon is in discussions with Homer City Energy Campus developers simultaneously and has submitted an application before the update is complete.

Lack of transparency

Information for many of the projects we researched was scant or difficult to obtain. The public learned of Amazon’s discussions with Homer City Redevelopment through a Right-to-Know request. At Project Phoenix, we were unable to find permits advertised by the State in the PA Bulletin and their former fast-track site. In a FracTracker submitted Right-to-Know request, it was revealed that Beaver County Commissioners told residents via email that they had no say in data center development because the county has no countywide zoning, while the same officials were receiving information directly from the developers of Project Phoenix and the Switch Pitt Race Data Center. For Starpointe, when we asked for the conditional use applications we were told that the only way to view them was to go to the Township building in person. Transparency failures are clear throughout the region, and residents are justifiably angry.

Executive Order 2026-05 – Protecting Pennsylvania Consumers from Data Center Impacts

On August 18, 2026, Governor Shapiro released Executive Order 2026-05: Protecting Pennsylvania Consumers from Data Center Impacts.

The order builds on the Governor’s Responsible Infrastructure Development (GRID) Standards, released May 27, 2026. GRID asks developers to meet standards in four areas:

  1. Energy affordability: Developers must show how electricity demand will be met without forcing costs onto ratepayers.
  2. Transparency and community engagement: Developers must provide adequate information on project scale, peak demand, outreach plans, public engagement, and disclosures.
  3. Workforce and economic development: Developers must make concrete commitments on jobs, workforce development, and community benefits.
  4. Environmental protection: Developers must address water usage, energy use and emissions, expected emission levels, and remediation measures tied to construction and operation.

Requirements for local approval, reporting requirements for water and energy usage, the prohibition of NDAs, and the removal of projects from the PA Fast Track program are all positive steps to regulate the explosion of activity we’ve seen over the past year. The Data Center Permit Tracker released by the state is also a positive transparency step, which helps clarify which projects are actually in real conversations with the Commonwealth about development. However, the requirement of meeting the GRID standards introduced in May stipulates that “Developers must agree to build, bring online, or buy incremental electric capacity needed to meet new energy demand while paying the full cost of the capacity.” Nine out of the twelve data center proposals in our region are co-located with some form of behind-the-meter power, and further expansion of fracked gas will keep residents breathing polluted air and worsen the climate crisis. Furthermore, putting restrictions on data center developments does not address the more important question of whether or not these developments can exist in a responsible way that truly avoids impacts to Pennsylvanians. Therefore, the executive action stops short of the deeper reform that Pennsylvania needs.
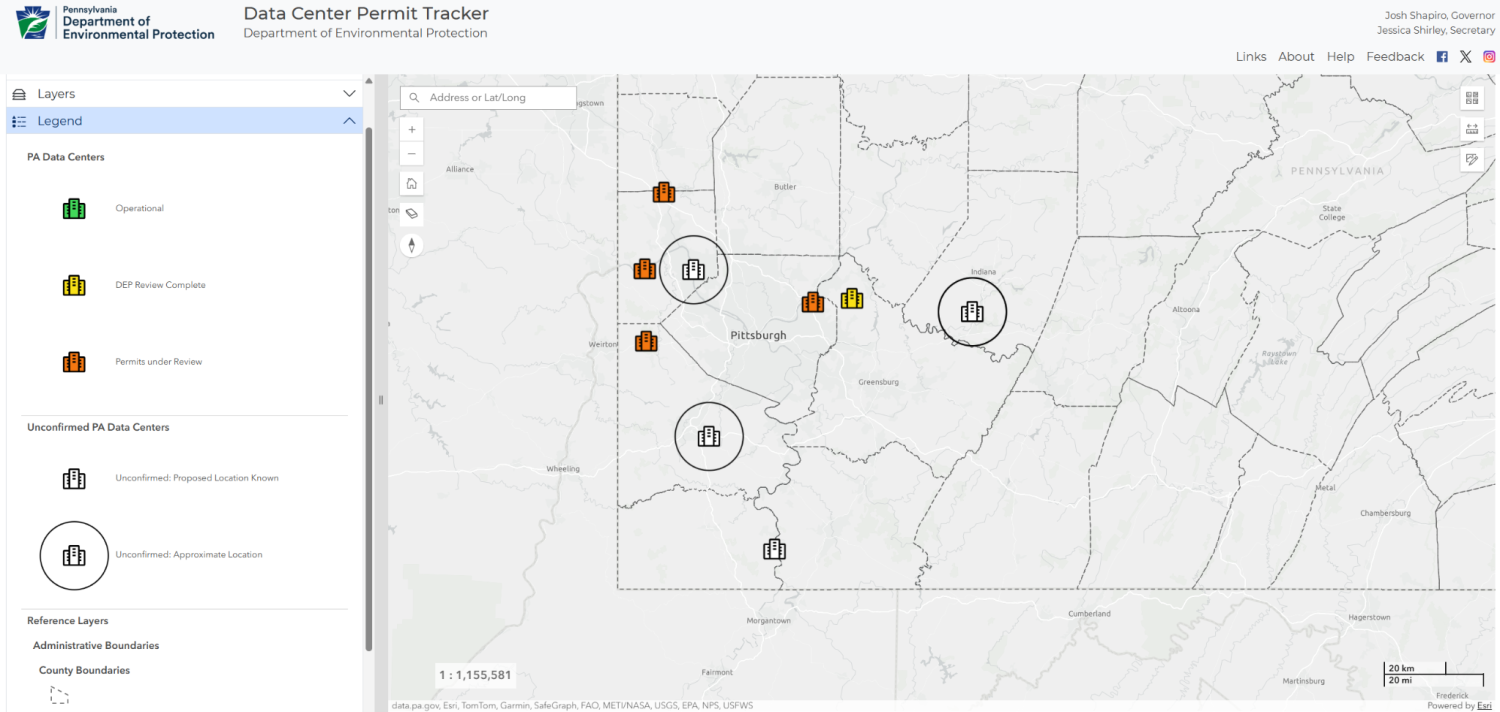
Screenshot of the PA DEP Data Center Permit Tracker map of Southwestern Pennsylvania.
State defined statuses for SWPA data centers. Source: PA DEP Data Center Permit Tracker, August 2026.

Uncertainty

Importantly, many proposals may not come to fruition. A clear example is the McKees Rocks Data Center proposal. In 2023, SunCap Property Group purchased a 72-acre brownfield site on the former Pressed Steel Car Company plant near McKees Rocks. At the time, SunCap also applied for several forms of state aid, including PA SITES and Redevelopment Assistance Capital Program grants. These grants were obviously meant to be used to remediate the area for industrial use; specifically, $6,000,000 in PA SITES funding was awarded for “acquisition of land along the rail spur, soil screening and disposal, rail spur reconstruction, stormwater controls, utility relocation, sewer line replacement and remediation.” Although SunCap did not explicitly propose plans for a data center, it urged the Stowe Township zoning board to amend its zoning regulations to allow data centers in industrial sites. In December 2025, Stowe Township commissioners voted to approve the change, which would have allowed SunCap to build a data center in its industrial-zoned Pressed Steel Car Company plant. Given this information, many local newspapers such as PublicSource and WESA began reporting on a proposed data center in the area. In addition to official media coverage, Facebook posts rallying protest against the data center gained traction. On August 11, 2026, concerned residents attended a Stowe Township Board of Commissioners meeting, only to be told that news of a data center resulted from a miscommunication between the township and its people. Commissioners cited a lack of electronic infrastructure and written notices as the cause of the confusion. Regardless of earlier zoning changes, SunCap had not proposed building a data center on the property and was now considering a warehouse instead.

Conclusions

The story surrounding major regional data center developments in southwestern Pennsylvania exemplifies different important aspects of data center developments that we are seeing across the country, including behind-the-meter power buildout, the rallying of community voices and power, the use of moratoriums to buy time to update local ordinances, and lack of developer and local government transparency. Over the summer of 2026, our Data Center interns filed Right-to-Know requests, attended local government meetings, and searched for whatever documentation was available for the twelve data center projects and proposals in southwestern PA. Across projects, we saw similar patterns, including behind-the-meter power generation reliant on fracked gas, siting on brownfields in environmental justice areas, and a lack of transparency about crucial project details.

Homer City Energy Campus, Springdale Dynamo Data Center, Upper Burrell’s Keystone Connect Data Center, and Project Phoenix in Beaver County are projects that stood out as being well underway. Three of the other data centers are only land advertisements at this point, and details and final approvals for many sites are still pending. Local people are pushing back hard against these data centers with a ferocity rarely seen before. A few years ago, southwestern PA was slated to have a host of petrochemical ethane crackers constructed, and in the end only one was built. The data center buildout may play out the same way. Sharing our region with twelve or more data centers is not inevitable.


Learn More

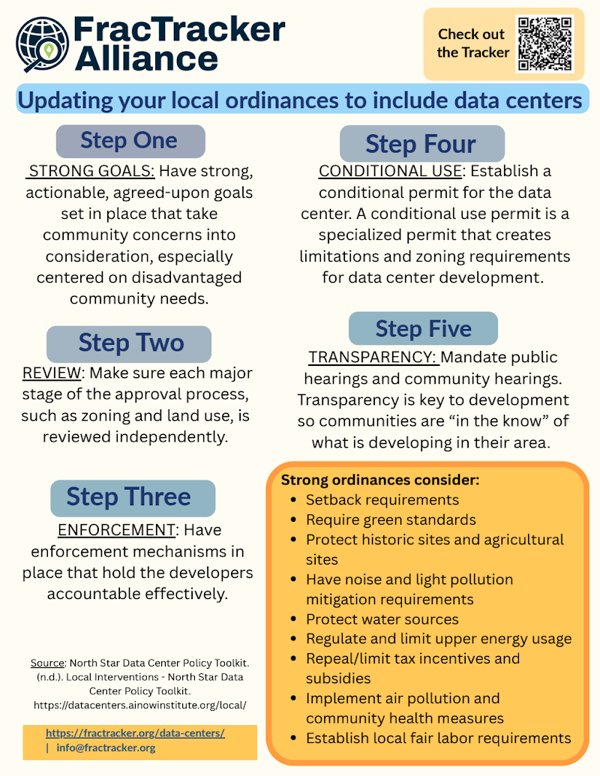
Fact Sheets and Site Packets

Notes

  1. According to the U.S. Energy Information Administration (EIA), the average U.S. home uses 10,500 kWh/year. Thus, 1 MW of continuous generation capacity is equivalent to approximately 834 homes powered. ↩

About this report: This report was researched and written during FracTracker Alliance’s summer 2026 Data Stewardship Sprint by Data Center Research Interns Leyu Belachew, Weronika Przedworska, Jenna Hoover, and Molly McLoughlin, with Data Center Fellow Mia Glover and Ohio River Valley Coordinator Katie Jones.

Filed underData Centers
Stay informedFracTracker Newsletter
Support our work

FracTracker Alliance helps communicate the risks of oil and gas and petrochemical development to advance just energy alternatives that protect public health, natural resources, and the climate.

By contributing to FracTracker, you are helping to make tangible changes, such as decreasing the number of oil and gas wells in the US, protecting the public from toxic and radioactive chemicals, and stopping petrochemical expansion into vulnerable communities.

Your donations help fund the sourcing and analysis of new data so that we can keep you informed and continually update our resources.

Please donate to FracTracker today as a way to advocate for clean water, clean air, and healthy communities.

Donate now
Rising Incidents, Lax Oversight: Ohio Oil and Gas Incidents, Inspections, and Enforcement 2015–2025

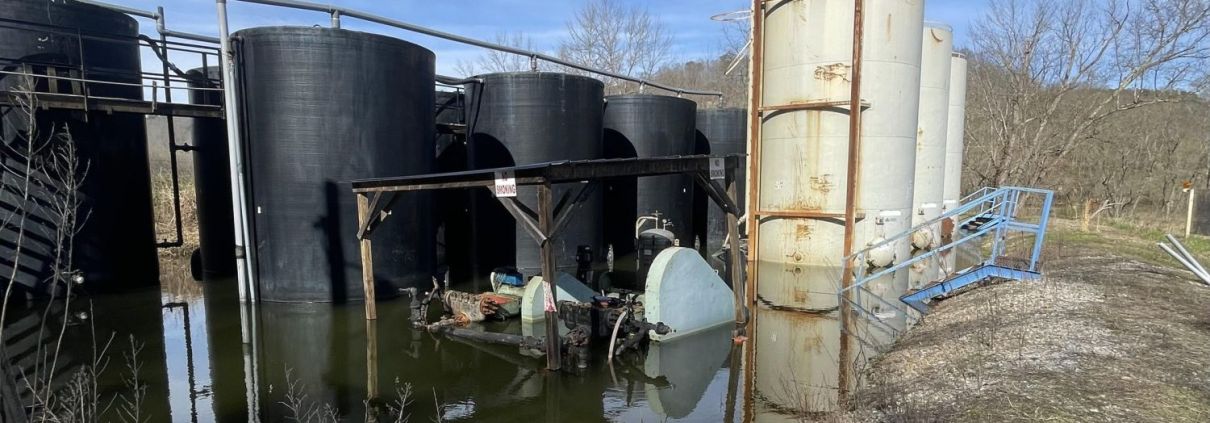
Storage tanks at the Frost well, a Class II injection well site in Athens County, Ohio, standing in pooled water.

Rising Incidents, Lax Oversight

Ohio Oil and Gas Incidents, Inspections, and Enforcement, 2015–2025

Storage tanks at the Frost well, a Class II injection well site in Athens County, Ohio. Photo: Roxanne Groff, 2024.
Download the full report

Overview

Ohio’s oil and gas incident records document spills, leaks, equipment failures, and other potentially harmful events.1 These incident reports should help the public understand where these incidents occur, the risks to safety, health, and the environment, and how regulators and operators respond. But FracTracker Alliance’s analysis of Ohio Department of Natural Resources records from 2015 through 2025 found that, even as ODNR has improved some aspects of its data collection, major gaps remain. Incident classifications are often unclear, key details are buried in narrative descriptions, and records do not consistently show whether an event led to inspection, cleanup, enforcement, or corrective action. These gaps are particularly notable amid growing problems with oil and gas wastewater disposal, including releases and oil and gas wastewater migration associated with injection wells. However, one thing is clear: incidents are increasing in frequency on an annual basis. Without an understanding of the severity and complexity of these increasing oil and gas incidents, the public and policymakers may be lulled into a false sense of complacency and may be less likely to address serious problems until they threaten to become a crisis.

Key Findings

  • 2,529 oil and gas incidents were recorded in Ohio from 2015 through 2025.
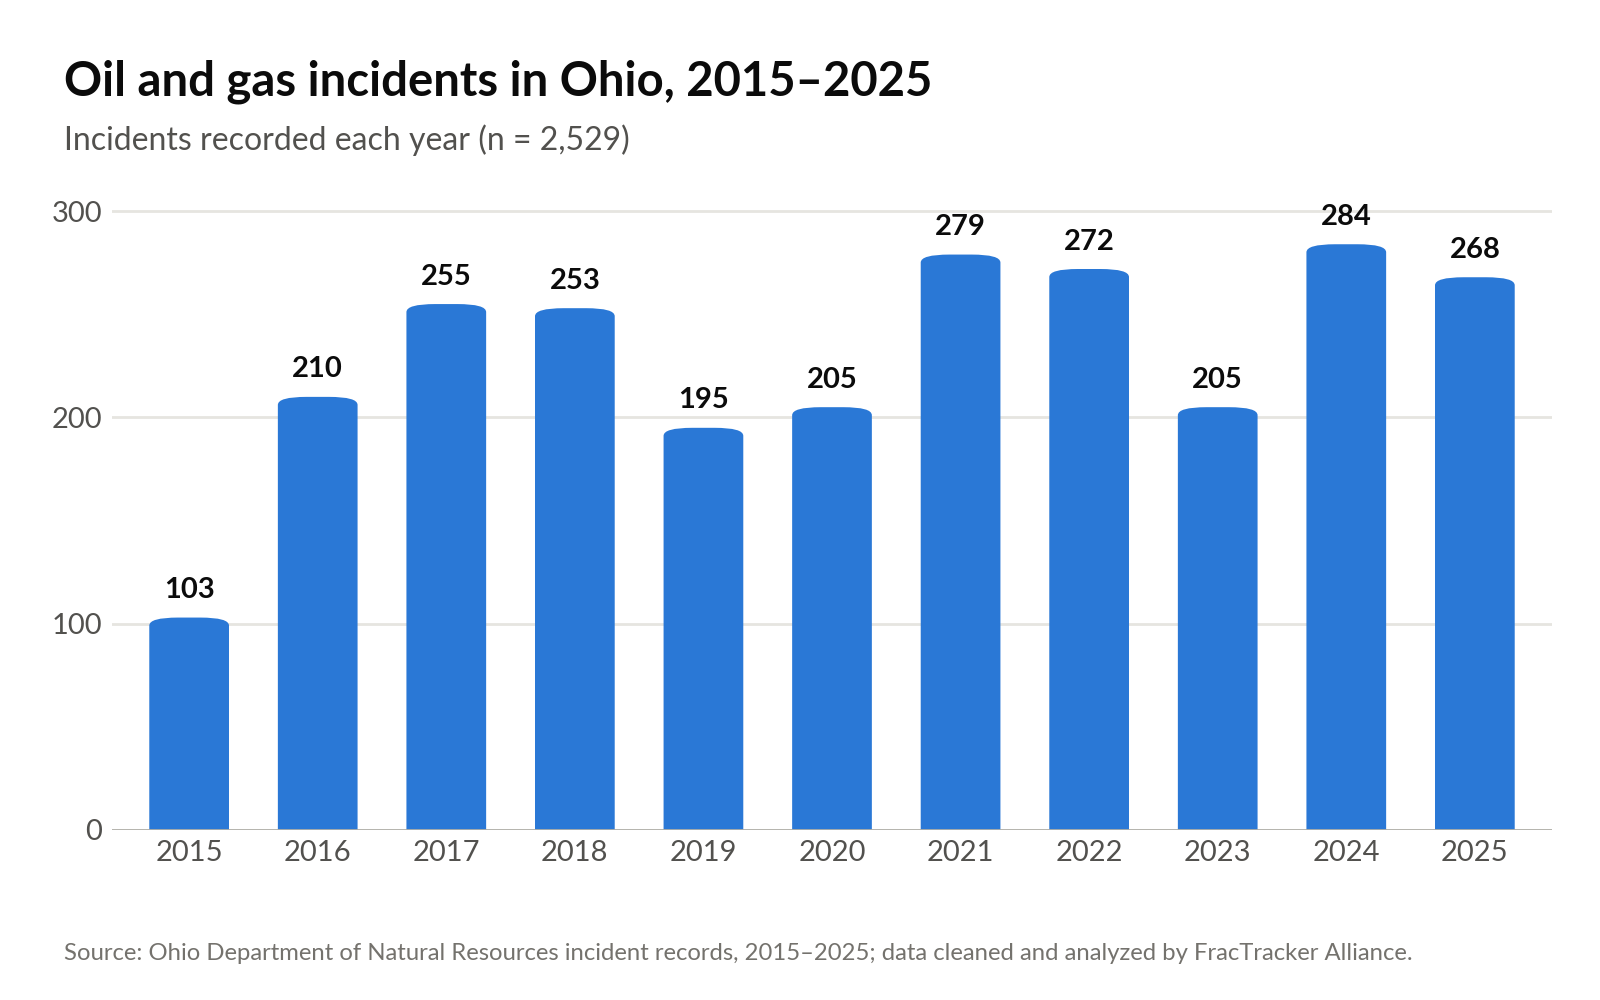
  • Incidents are generally increasing, rising from 103 in 2015 to 268 in 2025, despite year-to-year variation.
  • Persistent problems with poor incident classification and fragmented descriptions make it difficult to determine what happened, the severity of the incident, and how it was resolved.
  • Our analysis shows that there is a lack of consistency in inspections, enforcement, and follow-up on the part of ODNR when wells have incidents or violations.
  • ODNR’s inspection capacity appears insufficient for consistent and meaningful oversight. Roughly 25 inspectors are responsible for Ohio’s 96,000 wells.

Our Previous Analysis

This analysis builds on FracTracker’s 2024-2025 series, Data Gaps: A Critical Examination of Oil and Gas Well Incidents in Ohio. That work began after the president of the Ohio Oil and Gas Association stated publicly in 2023 that Ohio had experienced only one or two oil and gas incidents affecting environmental health and public safety during the previous decade. The statement prompted longtime Ohio activist and founder of the Daily Accident Report, Jenny Morgan, to request incident records from the Ohio Department of Natural Resources (ODNR) Division of Oil and Gas Resource Management (DOGRM).

The records2 told a very different story. After combining and cleaning ODNR’s annual spreadsheets, FracTracker identified approximately 2,000 incidents from 2015 through 2023. The analysis also found substantial problems with the data itself. Location information was frequently missing or inaccurate, incident classifications often failed to reflect the full nature of an event, and important details were buried in narrative descriptions. Roughly 100 records could not be included in the original map and analysis because their location information was too incomplete. Activist Jenny Morgan continued to dig into this important issue by creating the “Daily Accident Report,” a project documenting Jenny’s deep dives into specific incidents.

This updated analysis extends the dataset through 2025 and examines not only how incidents are recorded, but what the records show about the response that follows. ODNR has improved some aspects of its data collection, including location information, event types, and general consistency. But the expanded dataset exposes persistent problems with incident classification and raises broader questions about inspections, remediation, enforcement, and operator accountability. In many cases, the records still do not provide a clear path from the initial report of an incident to its eventual resolution.

What the Data Now Shows

Map of Ohio oil and gas incidents, 2015-2025. Open the full-screen map.

Number and Types of Incidents

One of the most notable trends in the data is an increase in incidents over the years of analysis. Since 2015, the number of incidents has generally gone up (Figure 1). Given the number of toxic substances associated with oil and gas wells, these incidents create the potential for communities and environments alike to be harmed.

Column chart of Ohio oil and gas incidents per year, 2015 to 2025, rising from 103 in 2015 to 268 in 2025, with a peak of 284 in 2024.
Figure 1. Oil and gas incidents by year, 2015-2025 (n = 2,529). Source: Ohio Department of Natural Resources incident records; data cleaned and analyzed by FracTracker.

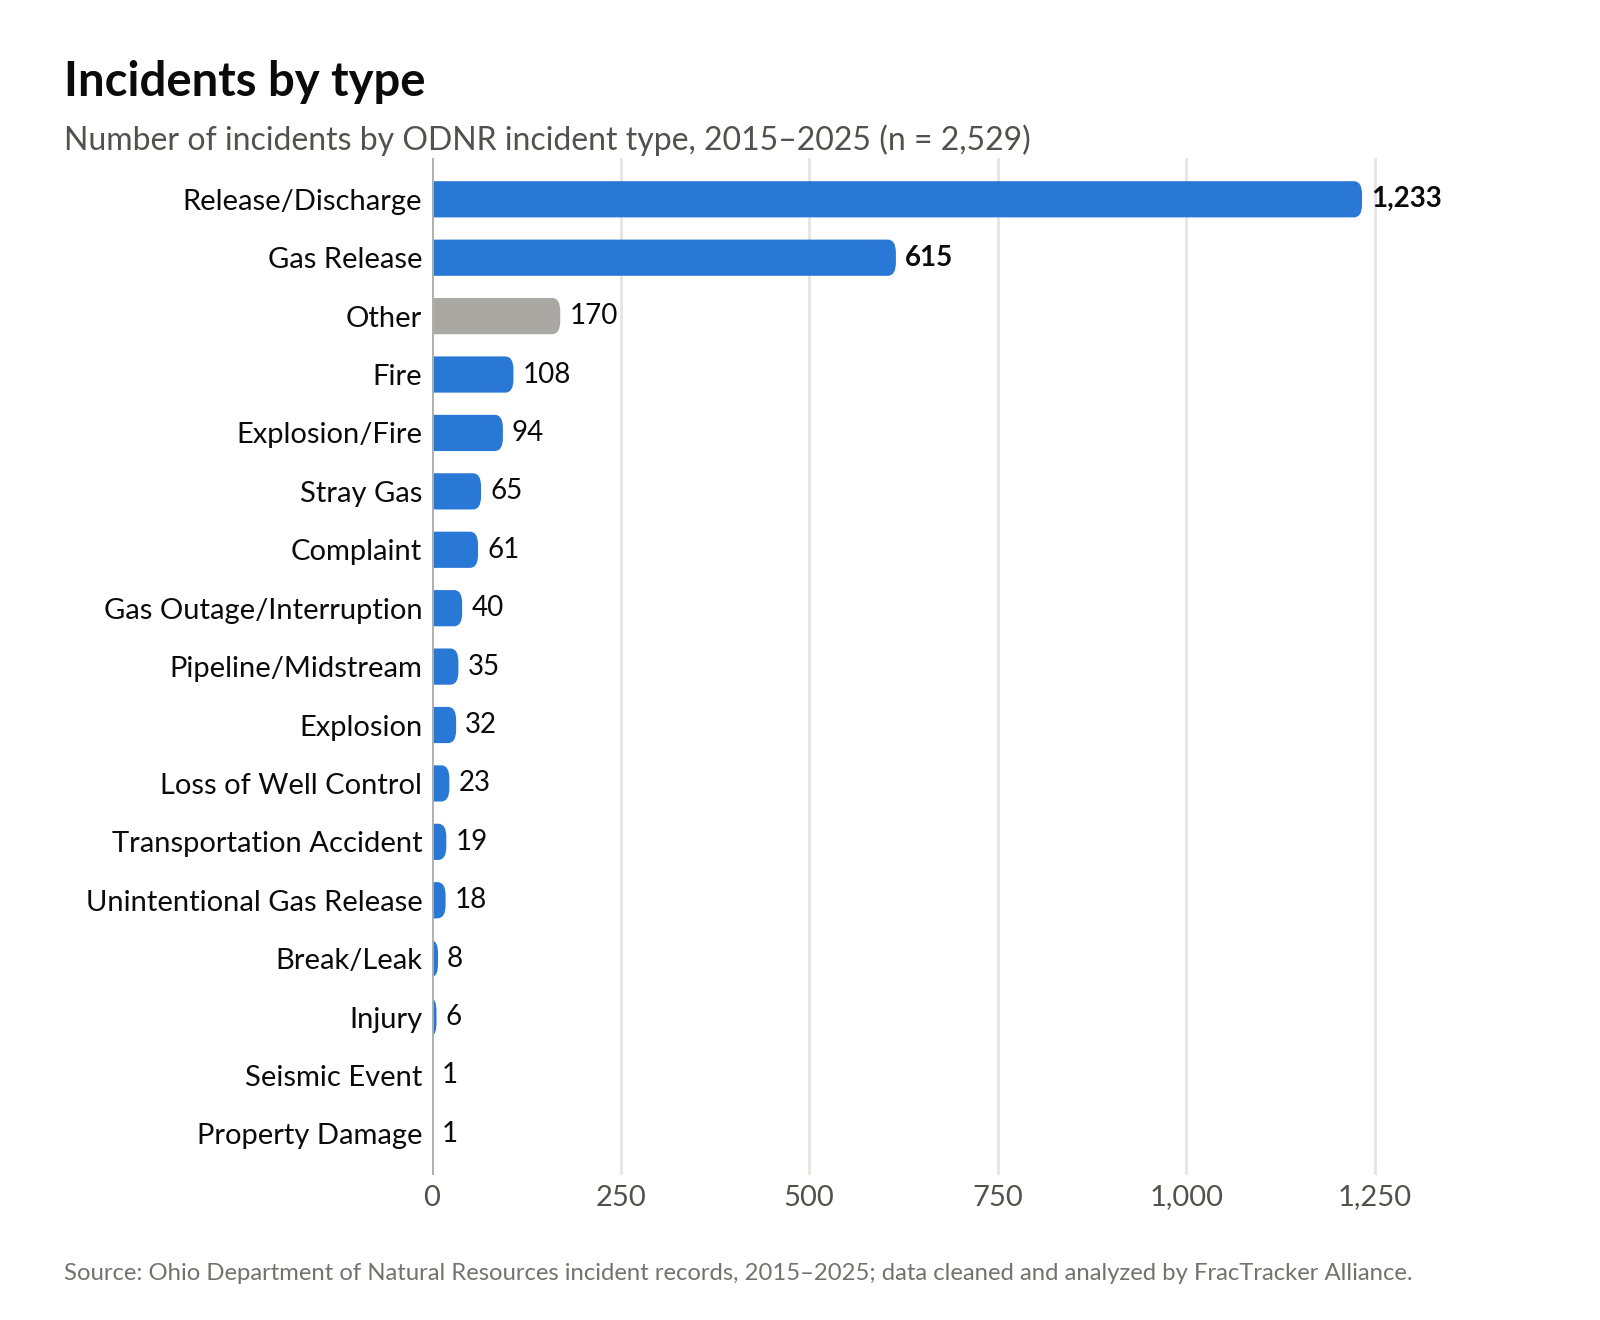
Consistent with our original analysis, the majority of incidents remain as unspecified releases and discharges (Figure 2), followed by gas releases. Some examples of such incidents include:

ODNR incident recordNo. 2017025
CountyMonroe CountyIncident typeRelease/DischargeODNR classificationMajorLevel 2 of 5
DiscoveredJan 29, 2017ClosedFeb 16, 2017Days open18
OperatorJohn Burkhart Unregistered wellProduct releasedOil (Crude)Quantity reported40 BBLS
SummaryA release/discharge in Monroe County where a “property owner drained tank into Clear Fork Little Muskingum River on 1/28/17,” releasing 40 barrels of crude oil onto the land, constituting a “major” event classification.
ODNR incident recordNo. 2025080
CountyCarroll CountyIncident typeRelease/DischargeODNR classificationMinorLevel 4 of 5
DiscoveredMar 29, 2025Closed—Days openStill open
OperatorOWS Acquisitions Co LLCProduct releasedOil, Refined Sheen on Water FRQQuantity reported900
SummaryA “minor” release of 1,000 gallons of crude oil mischaracterized in the data as water. Wyatt #1, operated by OWS Acquisition, released crude oil into a ditch which then entered an unnamed tributary to Sandy Creek. OWS attempted to remediate the release by removing the crude oil and contaminated soil. This remediation and a subsequent repair of the well were allowed to occur while parts of production resumed, despite the noted impact to land and water in Carroll County.
ODNR incident recordNo. 201500102
CountyJefferson CountyIncident typeGas ReleaseODNR classificationModerateLevel 3 of 5
DiscoveredOct 28, 2015ClosedNov 16, 2015Days open19
OperatorHistoric WellProduct releasedNatural GasQuantity reportedUnable to estimate
SummaryDespite being categorized as a moderate gas release, this incident is described as “Report of gas odor” with no estimation of how much gas was released in Jefferson County.

Because of the dispersed, short-lived, and difficult-to-capture nature of gas releases, incidents involving the discharge of gas go unquantified in the data reporting, leaving little clarity about the volumes of gas released. Under Ohio’s incident-reporting requirements, a release of any amount of gas is reportable when it results from a blowout, an uncontrolled pop-off valve in an urban area, or otherwise threatens public safety. Authorized controlled flaring and certain other controlled releases are excluded from these reporting requirements. Liquid releases are more likely to have estimated volumes in reports, but those estimates are still often incomplete. Among the 2,373 records in which the “estimated quantity” field was populated, 797 records listed the quantity as “unknown” or “unable to quantify. Other records only provided poor estimates like “>32 barrels”. In addition, some records show a discrepancy between the amount released reported in the “estimated quantity released” field and the “brief description” field, suggesting that the reporting of incidents could still be improved. It is difficult to estimate how many of these records with discrepancies exist due to the sheer number of records. It is important for ODNR to improve reporting systems in order for the public to understand the full extent of these releases because oil and gas-related fluids, particularly oil and gas wastewater,3 could contain toxic PFAS and high levels of radioactivity.

Horizontal bar chart of incidents by type, 2015 to 2025; release/discharge (1,233) and gas release (615) lead.
Figure 2. Oil and Gas incidents by type, 2015-2025 (n = 2,529). Source: Ohio Department of Natural Resources incident records; data cleaned and analyzed by FracTracker.

Authorized Activity and Classification of Incidents

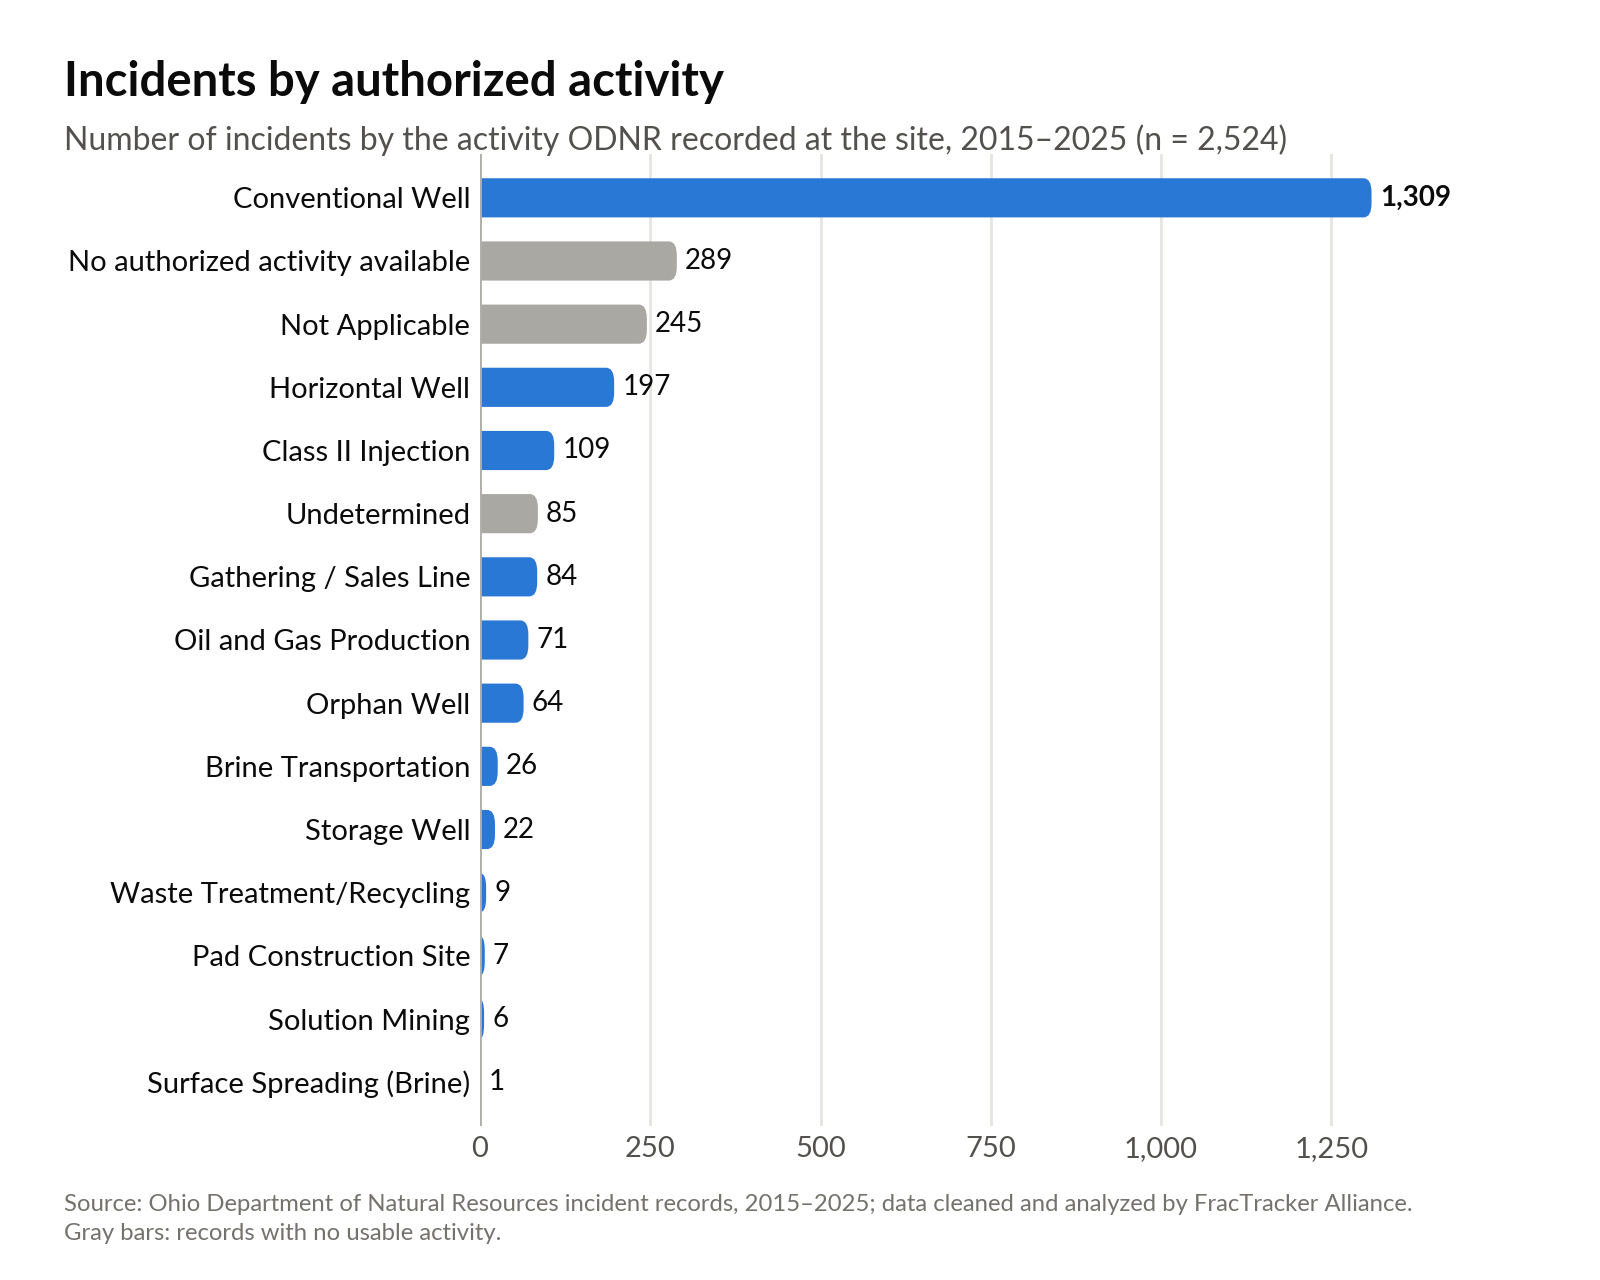
A large majority of incidents occur at “conventional” wells (Figure 3), a label that is likely to lead to confusion due to the lack of a definition of the word “conventional” in Ohio’s Oil and Gas code, and competing definitions in other prominent sources. In contrast, Ohio’s code defines a horizontal well as one drilled for oil or gas production in which the wellbore reaches a horizontal or near-horizontal position in the Point Pleasant, Utica, or Marcellus formation and the well is stimulated. “Stimulated” often means that the well has been hydraulically fractured. Hydraulic fracturing, or fracking, is a well-stimulation process in which fluid is injected under pressure to fracture underground rock formations. “Horizontal,” “directional,” and “near horizontal,” describe the path of the wellbore. Horizontal drilling and hydraulic fracturing are commonly used together in shale development, and such wells are commonly called “unconventional.”

Taken together, this terminology might suggest that “conventional” wells are any wells that are not “unconventional” or any wells that do not combine horizontal drilling and hydraulic fracturing. However, Ohio’s Oil and Gas code does not make this distinction. The United States Environmental Protection Agency (U.S. EPA), in its 2016 report on fracking and drinking water defined the difference between conventional and unconventional as related to the type of formation rather than to the type of technology used to extract oil or gas. “Conventional oil- and gas-bearing rock formations,” U.S.EPA wrote, “are often described as ‘permeable’ and tend to have many large, well-connected pore spaces that allow fluids to move within the rock formation. Unconventional oil- and gas-bearing rock formations do not exhibit these characteristics.” The U.S. EPA made clear that both conventional and unconventional wells could be fractured and that, in recent years, there had been increased production of oil and gas from unconventional formations (see page 1-3, including footnote 1, and page 3-1). Similarly, one of the world’s leading hydraulic fracturing companies, Schlumberger, notes in its Energy Glossary that the definition of “unconventional” has changed over time, but “[a]t present, the term is used in reference to oil and gas resources whose porosity, permeability, fluid trapping mechanism, or other characteristics differ from conventional sandstone and carbonate reservoirs. Coalbed methane, gas hydrates, shale gas, fractured reservoirs, and tight gas sands are considered unconventional resources.” Like U.S. EPA’s definition, Schlumberger’s characterization focuses on the nature of the formation, not the method of extraction.

On the other hand, the U.S. Energy Information Administration (EIA) defines the difference between “conventional” and “unconventional” in part based on the technology used to produce oil and gas. “Conventional production generally means that crude oil and natural gas flow to and up a well under the natural pressure of the earth,” the EIA wrote. “Unconventional production requires techniques and technologies to increase or enable oil and natural gas production beyond what might occur using conventional production techniques.” Because Ohio law does not define “conventional,” it is unclear whether ODNR is applying any of the three definitions listed above or defines “conventional” and “unconventional” in a different way.

Conventional Does Not Equal Safer

As a result, ODNR’s use of the term “conventional well” in this dataset should not be read as a precise description of a well’s age, orientation, depth, or stimulation history. Some wells categorized as conventional may be vertical and older, and some may also have been hydraulically fractured, but are still distinct from horizontal wells. The “well phase” column within the data indicates that some incidents occurring on conventional wells happened during “completion/stimulation,” suggesting that conventional wells in this dataset may reference fracking activities. The dataset also includes “oil and gas production” as one of the categories of activity, or “authorized activity” as it is called in the data. It is unclear how that category differs from the conventional and horizontal well categories or whether it includes incidents associated with well stimulation. ODNR used the category from 2016 through 2022, but it does not appear in the more recent records.

Labeling oil and gas wells as “conventional,” without defining the term, may lead some people to inaccurately assume that incidents at these wells pose less of a risk to the public. This assumption may stem, in part, from the fact that most oil and gas production in Ohio and the U.S. now comes from unconventional wells, using the definitions listed above. And it is these unconventional operations that have received most of the attention in recent years regarding pollution impacts. But because Ohio does not define “conventional,” the label does not indicate whether an incident associated with it poses less risk.

A separate regulatory distinction may reinforce the perception of the relative safety of “conventional” wells. In 2016, U.S. EPA issued a rule prohibiting water from onshore unconventional oil and gas wells from being disposed of in Publicly Owned Treatment Works (POTWs). POTWs typically collect wastewater from homes and businesses and send it to sewage treatment plants. U.S. EPA defined unconventional oil and gas resources as “crude oil and natural gas produced by a well drilled into a shale and/or tight formation (including, but not limited to, shale gas, shale oil, tight gas, and tight oil).” Wastewater from conventional wells was not covered by the rule.

However, in U.S. EPA’s 2016 report on fracking and drinking water, the agency wrote that “[p]roduced water generated from unconventional reservoirs is reported to be similar to produced water from conventional reservoirs in terms of TDS [total dissolved solids], pH, alkalinity, oil and grease, TOC [total organic carbon], and other organics and inorganics.” Produced water, as U.S. EPA defined it in its 2016 report, is wastewater. Therefore, it is unclear whether wastewater from conventional wells is significantly different than wastewater from unconventional wells. And it is possible that incidents at either conventional or unconventional wells involving wastewater could pose pollution risks. These uncertainties and the lack of a definition for conventional wells in Ohio’s Oil and Gas code means that Ohioans should not assume that incidents at “conventional” wells are safer than those at other types of wells.

Horizontal bar chart of incidents by authorized activity; conventional wells account for 1,309 of 2,524 incidents.
Figure 3. Incidents by authorized activity, excluding five records with no authorized activity listed. 2015-2025 (n=2,524). Source: Ohio Department of Natural Resources incident records; data cleaned and analyzed by FracTracker.

In addition to qualifying incidents by the authorized activity at a given incident site, ODNR also uses an incident classification matrix to categorize the severity of reported incidents (Figure 4). The matrix considers both the reported consequences of an incident and the agency’s assessment of whether the release or hazard is contained or under control. Because those judgments may be made before the full extent of an incident is known, the classification can reflect the initial perception of control and impact rather than the event’s ultimate severity. An incident may therefore be classified as minor when it appears to have been contained quickly or to have caused limited harm, while incidents perceived as uncontrolled or more consequential receive a higher classification.

ClassificationIncident criteria
Information Only
Level 5 incident
Normal conditions. DOGRM involvement only. Controlled and stabilized in less than 4 hours. Follow-up by DOGRM within 24 to 48 hours. Little to no resource needs. Does not exceed reportable quantities with nominal public safety or environmental impact.
Minor
Level 4 incident
Normal conditions. May/may not involve other agencies. Controlled and stabilized in less than 4 hours. Limited deployment within 2 hours. Little to no resource needs. Exceeds reportable quantities with minimal public safety or environmental impact.
Moderate
Level 3 incident
Increased Readiness Conditions. One to three agencies involved due to regulatory authority. Controlled and stabilized in less than 12 hours. Immediate deployment with extended operational phase(s). Additional resources needed. Exceed reportable quantities with considerable public safety or environmental impact.
Major
Level 2 incident
Escalated Response Conditions. Multiple agency involvement and coordination. Uncontrolled impact will take 12 to 24 hours to contain hazard(s). Immediate deployment with extended operational phase(s). Additional resources needed. Exceeds reportable quantities with sizeable public safety or environmental impact.
Severe
Level 1 incident
Emergency Response Conditions. Multiple agency involvement and coordination. Uncontrolled impact will take 24 hours or more to contain hazard(s). Immediate deployment with extended operational phase(s). Additional resources needed. Exceeds reportable quantities with significant public safety or environmental impact.
Figure 4. The incident classification matrix for Ohio oil and gas incidents. 2025. Source: ODNR Emergency Operations & Response Master Incident Data Tracking (MIDT), Recreated by FracTracker Alliance.

Moderate, major, and severe incidents have seemingly decreased over time (Figure 5), but descriptions of minor incidents are not convincing as “minor”. Incident 201600072, which occurred in 2016, was classified as minor and described as “Static electricity from overhead power lines caused a conventional well’s tank to explode.” The explosion of the EnerVest-operated tank released 59 barrels4 (2,478 gallons) of crude oil and 5 barrels (210 gallons) of oil and gas wastewater. Because this event was classified as minor, it may indicate that there were few impacts to the environment, or that the incident was contained quickly. However, the records indicate this incident was open for four days, leading to questions about the accuracy of the classification. It is unclear if the incident was “open” due to prolonged discharge or if remediation and follow-up took multiple days, but more information is needed to determine if “minor” was an appropriate classification.

As concerning as the incident classification itself is, prior to the incident, the well had not been inspected for 12 years according to Ohio’s Oil and Gas Database, also referred to as RBDMS. After the explosion in 2016, the well was inspected in 2017, 2019, and twice in 2024, suggesting that inspections may increase after incidents, but are generally inconsistent. None of the following inspections made mention of the explosion. Records also indicate that in 2020, EnerVest sold the associated well to OWS Acquisitions, but this change in ownership did not prompt any additional inspections. While Ohio law does not appear to mandate inspections upon every ownership transfer, the absence of one was notable given the well’s incident history.

ODNR incident recordNo. 201600072
CountyColumbiana CountyIncident typeExplosionODNR classificationMinorLevel 4 of 5
DiscoveredApr 22, 2016ClosedApr 27, 2016Days open4
OperatorEnerVest Operating LLCProduct releasedOil (Crude)Quantity reported59 bbl, 5bbls brine

Incident 201600072 is not the only example of potential mischaracterizations of well incidents. Another “minor” incident is incident 2025018, which involved an unknown quantity of oil and gas wastewater released from a well while it was being plugged through an orphan well program. ODNR’s records state that the well had been “flowing overnight with no well control in place” and was located in a 100-year floodplain. Both the duration of the release and potential scale suggest this incident’s severity was misclassified by the agency’s own criteria, especially considering that in the “Estimated Quantity Released” field, the volume listed was “Brine >42 US Gal. in 24 hrs,” a reportable quantity if the oil and gas wastewater was released into the environment. Conflicting information within the data (e.g., both the note of an “unknown quantity” and “Brine >42 US Gal. in 24 hrs” within the same incident record) makes it difficult to understand how much was actually released and if the incident should be considered “minor”. Inspection reports show that after this incident, the well was not inspected until 9 months later, when the orphaned well restoration was complete, meaning the amount of oil and gas wastewater released may still be unknown. These two examples above are not outliers; other records in incident data follow similarly concerning patterns of mischaracterization.

Two-panel chart of incidents per year by classification: minor incidents ranged from 69 to 157 per year, while moderate, major, and severe incidents fell from 33 in 2015 to 6 or fewer per year since 2019.
Figure 5. Declines in moderate, major, and severe incidents, 2015-2025. Source: Ohio Department of Natural Resources incident records; data cleaned and analyzed by FracTracker.

Events by County

Given the pattern of mischaracterized incidents, it’s worth examining where incidents are concentrated. Stark and Noble counties have the highest counts of incidents, with each county recording about 130 incidents (Figure 6). These counties both have a moderately high number of wells, but according to FracTracker records, they do not have the largest number of total wells. Incidents in these two counties follow the general trend of the data; releases at conventional wells dominate the incidents within these counties.

Horizontal bar chart of the 25 Ohio counties with the most incidents; Stark (133) and Noble (129) lead.
Figure 6. Incidents by county, 2015-2025 (n=2,529). Source: Ohio Department of Natural Resources incident records; data cleaned and analyzed by FracTracker.

Incident Durations

Incident durations may also be cause for concern. In this analysis, FracTracker Alliance defines “duration” as the time, in days, between incident discovery date and closure date as noted in the records. According to the records, many incidents were “closed” or addressed within the same day (Figure 7). Closure is not defined in the Ohio Administrative Code that dictates emergency response and tracking, but likely refers to completing any follow-up to an incident, like field response, remediation, documentation, or another administrative milestone. Many of the incidents that were addressed within a day were incidents classified as less severe, that is, those classified as “information only,” “agency assist,” “agency referral,” and “minor” (Figure 8). However, despite many less severe incidents being closed within the same day, 486 incidents took over a month to close, and 249 records from as far back as 2018 remain open, or without a closure date today. These open records could be a reflection of the time it takes to fully remediate sites, a gap in documentation and data entry, or the Oil and Gas Management Division’s lax philosophy on addressing violations, where the “Division seeks to return the regulated community to compliance at the lowest level of enforcement possible”. Public confidence in ODNR’s response would be improved by enforcement that is clearly commensurate with the severity of the incident.

Column chart of days from discovery to closure: 1,007 incidents closed the same day, 486 took more than a month, and 249 remain open.
Figure 7. Duration of incidents before closure, 2015-2025 (n=2,529). Source: Ohio Department of Natural Resources incident records; data cleaned and analyzed by FracTracker.
Grouped column chart of average and median days to close by incident classification; major incidents averaged 629 days with a median of 66.5.
Figure 8. The average and median durations of closed/addressed incidents, 2015-2025 (n = 2,529). Source: Ohio Department of Natural Resources incident records; data cleaned and analyzed by FracTracker.

As with the previous FracTracker analysis on the topic, the “Brief Description” field continues to be the most comprehensive attribute in understanding incidents. The field often describes equipment failure found during routine inspections and maintenance, as well as landowner notification of leaks, spills, and odors. The field also sometimes details the inspector’s actions, follow-up, or communication around an incident. The “Brief Description” field also highlights shortcomings in the dataset’s other categories. It more frequently quantifies volumes of products released than the other data columns, and gives additional context that reveals discrepancies in incident classification.

Oil and Gas Wastewater Disposal in Injection Wells, Transportation, and Road Spreading

How injection wells work

The waste is not stored in an empty subterranean tank or cavern; it enters the pore spaces of permeable rock within the injection zone. Injected fluids move through pore spaces in the receiving formation. If a well is improperly constructed or operated, if natural fractures already exist, if a high volume of injected fluids creates fractures, if improperly plugged wells are present, or if there is no porous and permeable reservoir, trapping mechanism, or impermeable seal to prevent fluid flow, fluids can migrate outside the permitted injection zone.

A note on terms. This report uses “oil and gas wastewater” to describe the combination of naturally occurring toxic saltwater and flowback and chemicals incorporated to that water during the fracking process. Oil and gas wastewater is sometimes referred to as “brine” or “produced water,” in different contexts. These are distinct terms with distinct meanings but are often utilized interchangeably.

Incident reports related to transportation, disposal, storage, and spreading of oil and gas wastewater also raise significant tracking and response issues. Oil and gas companies inject oil and gas wastewater into underground formations through wells classified as Class II under the Safe Drinking Water Act’s Underground Injection Control program. FracTracker and Buckeye Environmental Network have previously collaborated to map some of Ohio’s more concerning injection wells.

Spills, leaks, and other releases of oil and gas wastewater can cause significant damage to the environment. In 2018, in Pickaway County, documented in incident 2018188, a routine inspection found a “brine kill area and leak of brine occurring from a pin hole size leak.” Further inspection notes that over 1 bbl (42 gallons) of oil and gas wastewater was released from the pinhole leak, raising questions about how long the leak continued before detection. Similarly, another incident states, “UIC inspector arrived on site for routine inspection and observed three separate kill area (sic) around the surface brine storage facility indicating a release of brine. Containment dike had approximately 10″ of brine and some oil in it.”

Issues involving oil and gas wastewater were not just limited to under-addressed leaks. They were also characterized by descriptions of oil and gas wastewater hauler accidents and potential unreported accidents. Examples include incident 2018220, which states “Tanker accident caused 20bbl of production brine released into a creek. OEPA DNR Wildlife informed. There was no recovery due to fast waters.” and incident 2018187, described as “Former employee reported underreporting of releases to the OneCall alleged release(s) have occurred in containment.” Numerous oil and gas wastewater truck rollovers and releases are described in the data, bringing up questions around the safety of transportation of oil and gas wastewater. Nine incidents directly reference “brine kill” or an area of vegetation that is or has been dying due to oil and gas wastewater releases to that area. The fact that such a phrase is well-documented in the records indicates the seriousness with which incidents involving oil and gas wastewater should be considered.

ODNR incident recordNo. 2021011
CountyWashington CountyIncident typeRelease/DischargeODNR classificationMinorLevel 4 of 5
DiscoveredJan 20, 2021ClosedApr 2, 2021Days open72
OperatorDeeprock Disposal Solutions LLCProduct releasedBrine >42 US Gal. in 24 hrsQuantity reported23 Barrels

Despite improvements in data collection, such as consistent field usage and better organization since our previous report, it continues to be difficult to properly evaluate the data. Incident 2021011 describes an issue with the Heinrich Unit #2 well owned by DeepRock Disposal Solutions LLC. The incident was described as “Visited site to determine if incident can be closed out. Operator hauled out the contaminated soil and filled in all the trenches. They also put down seed and straw.” There is no description of the incident that created the contaminated soil. It is unclear if this incident’s original description has been overwritten, and no other record in the incident data is attributed to this well’s name or API number, a unique numeric identifier assigned to each oil and gas well.

The only other incident associated with DeepRock within the incident data is incident 2024282, which could have created contaminated soil but is attributed to a different well. The description reads as follows:

ODNR incident recordNo. 2024282
CountyWashington CountyIncident typeRelease/DischargeODNR classificationMinorLevel 4 of 5
DiscoveredDec 22, 2024Closed—Days openStill open
OperatorDeeprock Disposal Solutions LLCProduct releasedBrine >42 US Gal. in 24 hrsQuantity reportedunk
ODNR brief description (as recorded)“Dave Casto (DeepRock) reported a brine release occurred at their site on December 22. 2024 at approximately 5:00PM. The brine release is reported to have consisted of between five and eight barrels that resulted from a defect in a check valve on the wellhead of the well named Helen F Hall (SWIW #7) 1-19. A portion of the brine was released outside of secondary containment and impacted land and a nearby intermittent drainage. Deeprock utilized absorbent material in an attempt to prevent migration of brine further into the environment on the evening of December 22, 2024. UIC Inspector Kyle Newbrough was notified of the release and visited on December 23, 2024. On site, Inspector Newbrough worked with Deeprock to construct containment and remediation measures. EOR Coordinator Nathan Lane visited the site to ensure the release was stabilized, leading edge controlled, and remediation is underway.”

Another incident involved DeepRock but was not associated with DeepRock in the incident data. In incident 2021015, oil and gas wastewater shot from a production well at 42 gallons a minute (Figure 9) in Noble County in 2021. The source of the oil and gas wastewater was nearby wells where DeepRock was injecting oil and gas wastewater, according to a later Chief’s Order by ODNR. However, the incident data assigns the incident to the well at which the blowout occurred, named Ohio Power Gant #17-69, operated by Genesis Resources LLC.

This assignment of the incident to Genesis Resources LLC, rather than DeepRock, is not just a difficulty for those exploring the data. While it is reasonable to tag the location of this incident as occurring at the Ohio Power Gant #17-69 well, initially attributing the cause of the incident solely to the operator Genesis Resources may not only make searching for more information on a highly publicized incident difficult, but also may have implications for ensuring proper enforcement and mitigation related to the incident. Prior to the incident, ODNR had ordered Ohio Power Gant #17-69 to be plugged, but Genesis Resources had not done so. DeepRock’s injection wells were suspended, but the state held Genesis Resources responsible for the cost of remediation, an issue that is now the subject of a lawsuit from Genesis Resources’ insurance agency. Additionally, since its suspension, DeepRock has been fighting to reopen the wells and has most recently appealed the Chief’s Order to remain shut down to the Ohio Oil and Gas Commission. Concerningly, the seat of this commission that represents the public is vacant during this appeals process.

ODNR photo of oil and gas wastewater spraying from the Ohio Power-Gant #17-69 well in Noble County, January 2021.
Figure 9. A photo of incident 2021015, 2021. Source: Public records request to ODNR for incident photo log for Ohio Power-Gant #17-69.

Enforcement

The records indicate a few channels through which regulators discover, or are notified of, incidents. Sometimes, inspectors identify incidents during routine inspections. Incidents have also been called in by well operators or emergency services near a given well. Many records indicate that landowners, not well operators, are the ones spotting leaks and flagging when remediation efforts were not completed successfully. Additionally, some incidents are reported through Ohio EPA’s emergency response program. Although Ohio EPA (OEPA) is not the primary regulator of the oil and gas industry, they do assist ODNR when pollutants leave a given well pad, enter waterways, or threaten public drinking water. This shared response can make it difficult to determine responsibility for the follow-up and long-term inter-agency oversight regarding incidents. OEPA notes that a significant portion of the incidents they respond to deal with releases of petroleum products. They also note that the responsible party for many incidents is the operator itself, who is also often responsible for the cost of clean-up. With only around 25 oil and gas inspectors in ODNR and roughly 15 coordinators for Ohio EPA’s Emergency Response program, efforts by the state regulatory agencies to prevent and remediate incidents may be limited in nature by logistical factors such as caseload and time spent with a given case.

An analysis conducted by FracTracker for this report found that the 25 inspectors at ODNR are responsible for roughly 96,000 active wells, not including wells that are plugged or abandoned. Using Ohio’s RBDMS system, FracTracker was able to access the duration of inspections and average the amount of time inspectors have spent on inspections in recent years. Reviewing only current inspectors leads us to conclude that it would require, on average, roughly 664 work days per inspector to review all the active wells in the state. This means that it would take inspectors in the state over two-and-a-half work years to return to a given well. While this average is helpful for understanding that ODNR inspectors are overall overburdened, some inspectors are especially overburdened. For example, one inspector is responsible for roughly 1,500 wells, all contained within Harrison County. Another inspector is responsible for all wells in 26 counties, which total around 24,000 wells. This roughly estimated inspector burden does not take into account the responsibility of ODNR inspectors to examine and regulate more inactive well types.

Unrealistic inspector workloads have practical consequences for how frequently wells are inspected and how problems are identified. Buckeye Environmental Network has documented many instances in which an inspection was both necessary and not completed. One such example is that of the Kris-Mar 1 oil and gas production well located in Washington County, in Marietta, Ohio. In 2019 and 2020, oil and gas wastewater was suspected to have migrated from a neighboring wastewater injection well and bubbled out of conventional production wells near Kris-Mar 1. Although ODNR had been notified of issues with neighboring production wells, it did not inspect Kris-Mar 1 until 2021, at which point the well had not been in production since 2018. The 2021 inspection cited a violation for failure to post notification, which is the required signage identifying the well name, operator, and emergency contact information, and gave the operator 10 days to remedy it. Nearly a year passed before the next inspection, which found the same posting violation still unresolved and noted “an old release in the area.” By the following inspection in 2023, the well was actively leaking and had destroyed surrounding vegetation, as documented in the inspection reports and in incident 2023100. Each of these earlier visits had been spent revisiting the same unaddressed violation, a pattern that continued to shape ODNR’s response after the fact. What followed the leak was a years-long process of compliance notices and requests to remove contaminated soil, with inspections becoming more frequent but the well still struggling to reach full compliance long after the leak was first observed. This means that inspectors had to spend a significant amount of time attempting to bring this well into compliance, visiting the site a total of 20 times between May 2023 and October 2025. This incident record has not yet been closed. Perhaps at least some of the pollution and the time-consuming regulatory efforts could have been avoided had ODNR’s inspector been able to inspect Kris-Mar 1 sooner and more regularly.

An additional question as to why this well was leaking also remains. Wells in this area have been suspected by oil and gas producers and advocates to be leaking due to nearby wastewater injection wells, including DeepRock’s American Growers #1 well, 1,120 feet away from the Kris-Mar 1 well. Cumulative subsurface pressure from injection wells receiving millions of gallons of oil and gas wastewater in Southeast Ohio is possibly resulting in migration of the waste fluids into these conventional wells, leading to increasing pressures at the conventional wells and releases into the environment, such as what has occurred at the Kris-Mar 1. At the time of writing this analysis, these suspicions were made more tangible after ODNR announced the voluntary cessation of operations for four injection wells in Washington County, Ohio. In recent years, disposal zones in Southeastern Ohio have produced “unprecedented migration of brine [wastewater],” according to ODNR. The ODNR should immediately investigate instances when there is suspected migration of oil and gas wastewater, rather than taking a “wait and see” approach.

Beyond the thousands of production wells in Ohio, ODNR has sited 232 active or permitted Class II Injection Wells throughout the state. A different set of four inspectors are responsible for the inspection of these wells. These inspectors not only have the major undertaking of being responsible for 50+ wastewater injection wells, but they also cover a vast geographical area. One inspector is reportedly responsible for counties including Holmes, Tuscarawas, Perry, and Washington, a non-contiguous area that spans over 2,000 square miles.

This high inspector burden, paired with the potential remediation costs or fines operators may incur for reporting incidents, means the onus of reporting is seemingly left to landowners and residents who may have oil and gas wells on and around their land. The option for citizens to report incidents they see is vital; citizen reporting means more eyes on the incidents and more trust between citizens and the regulators that serve them. However, the current reliance on citizen reporting undermines regulatory accountability, relieving operators of their fundamental obligation to ensure well safety.

ODNR’s website describes an escalatory approach for enforcement, ranging from informal to more formal measures, depending on the nature of violations. However, FracTracker separately requested records for “nonappealable Material and Substantial violations from 2000 to 2025,” that is, violations with formal enforceable action through Ohio’s oil and gas code. FracTracker Alliance undertook a small, separate analysis of these violation records since 20195, and found that very few violations have addressed incidents, spills, or pollution events. For example, the widely publicized 2021 DeepRock Disposal incident resulted in Chief’s Order 2023-02 suspending the wells of concern, but did not result in any additional fines, violations, or further enforcement action. As stated earlier in this report, DeepRock Disposal is currently attempting to reopen those injection wells that were problematic.

In a similar manner, a report conducted by Buckeye Environmental Network on the Redbird #4 wastewater injection well, whose oil and gas wastewater migration led to the flooding of 28 conventional production wells, documented another case of ODNR’s inability or unwillingness to pursue enforcement. Production well owners who noticed fluid in their wells contacted ODNR directly to report the incident. Inspectors, after waiting half a year and only after being prompted by a state representative-brokered meeting, discovered high pressures and oil and gas wastewater migration as far as five miles away from the wastewater injection well of concern. These concerns were not noted in the incident data, and did not result in a violation. Instead, Redbird Development LLC, the operator of Redbird #4, was allowed to submit voluntary changes to their operations and permits, plug only some of the geologic formation, and resume operations.

Rather than violations reflecting on-the-ground safety and pollution-related concerns and liabilities, violations are instead issued for administrative issues, like failing to report production amounts or failing to maintain liability insurance (Figure 10). Other Chiefs’ orders that appeared semi-regularly in the records were revocations of injection and plugging requests, but these records did not strongly indicate that any safety, health, or environmental incidents were considered in these plugging and revocation orders. When violations that could involve civil penalties are not pursued, ODNR forgoes potential revenue for Ohio and weakens financial deterrents against non-compliance that poses a risk to public health and the environment. While these plugging and revocation efforts are steps in the right direction, there is a need to better link incidents with accountability and enforcement.

Scanned 2019 ODNR Chief's Order, an example of a non-appealable material and substantial violation.
Figure 10. An example of a non-appealable material and substantial violation. 2019. Source: Public records request made to ODNR-DOGRM in 2025 by FracTracker.

Suggestions for Improvement of Incident Tracking and Enforcement

In order for the public to evaluate risks to their drinking water and health associated with oil and gas companies operating, or proposing to operate, in their communities, incident data must be more accessible. Accessible data allows residents, reporters, and regulators to quickly determine whether a company has a history of incidents or violations or if multiple violations have been issued regarding a particular type of well, such as wastewater injection wells. However, part of making data accessible includes having shared definitions of terms. If terms like “incident,” “conventional well,” and “closure date” were defined either in Ohio’s oil and gas code or within a separate data dictionary associated with the records, the public understanding of such events would be bolstered. Where Ohio’s definitions differ from definitions used in federal data or by other states, those differences should be made clear.

FracTracker commends ODNR for their improvements in data reporting, but there is still a distinct need for better protocols to address issues related to wells. As a starting point, Ohio Revised Code §1509.041 requires non-appealable material and substantial violations to be posted to ODNR’s website. To conduct this analysis, FracTracker Alliance had to submit a public records request to obtain this data, which did not appear on the dedicated webpage. At the time of finalizing this analysis, this information appears on the Orders by the Chief database, which aggregates all legal directives related to oil and gas in Ohio. The Chief’s Orders are not consistently displayed on the website, leading to gaps in regulatory transparency. In addition, records are only available starting in July of 2010. There is a need for distinction between these databases and webpages, consistent updates, and better transparency within these information systems. Additionally, ODNR’s RBDMS database, which contains oil and gas inspections by well in addition to well records on completion, permits, and production, while information-rich, is inaccessible to a majority of residents. It could be made more accessible to the public by having more frequent and timely updates and by linking it to accessible training on how to query and utilize the database. The database currently exists on Microsoft Access, which can be inaccessible due to its difficulty to use and paid licensing requirements. By moving the database to a different format, like SQLite, the public may have an easier time exploring the information available. This shift would also benefit ODNR; Microsoft Access has a 2-gigabyte size limit that the RBDMS system has outgrown, splitting the well history and well tables across two files the state tracks and undermining the purpose of a relational database.

Ohio law authorizes civil penalties for oil and gas violations, but ODNR’s DOGRM does not appear to have authority to impose those penalties directly through an administrative order. Instead, the division chief must request that the Ohio attorney general bring a civil action to recover penalties under Ohio Revised Code §1509.33. ODNR can independently use other enforcement tools, including compliance orders, permit suspensions, bond forfeiture, and referrals for injunctive relief. However, the absence of fines may make such notices, particularly the compliance orders, easy to disregard. Relatedly, in 2015, following a citizen’s petition filed by Buckeye Environmental Network and others, the U.S. EPA evaluated ODNR’s Underground Injection Control program. U.S. EPA said that they recommend implementing fines to hold bad actors accountable. To date, we are not aware of any instances of ODNR using the attorney general’s office to issue fines for companies violating Ohio’s injection well laws. This approach to enforcement may have allowed companies to avoid meaningful consequences for repeated violations.

FracTracker Alliance and Buckeye Environmental Network also recommend a smaller inspector-to-well ratio, so that wells are inspected with the regularity required to avoid oil and gas pollution events, leaks, and spills, otherwise referred to as “incidents”. Because of the length of time it takes for ODNR to inspect and address potential incidents and violations, more formal enforcement actions should be taken for long-running violations and incidents. In practice, these actions could include fines for any long-standing or unremediated violation or incident. In addition, violations or contamination events should result in an immediate stop-work order until the issue is remediated. This action would once again be bolstered by treatment of incidents as material and substantial violations, addressed with formal enforceable action through Ohio’s oil and gas code, rather than as separate tracking and enforcement measures.


Appendix A. Oil and Gas Wastewater Glossary

“Brine,” “Produced Water,” and “Oil and Gas Wastewater” are often used interchangeably, but come from different industry, legal, and regulatory contexts. To clarify, in this report we use “oil and gas wastewater” to encapsulate many terms that reference the often salty water that is brought above ground during extraction activities. This wastewater may be reused or injected back underground.

“Produced water” may be the term that most closely matches our definition of “oil and gas wastewater” but is not used by Ohio regulators or legislators, and may connote a substance that is not harmful. By using “oil and gas wastewater,” we aim to highlight the potential dangers of the fluids involved in extraction.

TermSource / used byMeaning
BrineOhio’s Oil and Gas Code Definitions (1509.01-U)“All saline geological formation water resulting from, obtained from, or produced in connection with exploration, drilling, well stimulation, production of oil or gas, or plugging of a well.”
Produced WaterU.S. EPA“The fluid brought up from the hydrocarbon-bearing strata during the extraction of oil and gas, and includes, where present, formation water, injection water, and any chemicals added downhole or during the oil/water separation process.” Produced water is often re-used in oil and gas extraction via practices like Enhanced Oil Recovery.
Oil and Gas WastewaterU.S. EPA, Sierra Club, FracTracker Alliance, and Buckeye Environmental NetworkNaturally occurring saltwater that is already toxic, combined with flowback (fluids, sands, or hydrocarbons that return to the surface during fracking) and chemicals added during the extraction process. This wastewater may or may not be reused for further extraction, or injected underground.

Sources and More Information

FracTracker’s work on this analysis

Other sources

FracTracker Alliance. (n.d.). National Oil & Gas Well inventory portal. FracTracker Wells Portal. https://wells.fractracker.org/

Glabicki, Q. (2026, July 29). In Ohio, toxic wastewater is bubbling up out of the ground – The New York Times. The New York Times. https://www.nytimes.com/2026/07/29/climate/ohio-fracking-water-injection-wells.html

How much shale (tight) oil is produced in the United States? – frequently asked questions (FAQs) – U.S. Energy Information Administration (EIA). U.S. Energy Information Administration (EIA). (n.d.). https://www.eia.gov/tools/faqs/faq.php?id=847&t=6

Injection Wells | Ohio Department of Natural Resources. Ohio Department of Natural Resources. (n.d.). https://ohiodnr.gov/business-and-industry/energy-resources/injection-wells

Kington, D. (2026, February 19.). Lawsuit: Fracking waste company should pay for 2021 disaster. Athens County Independent. https://athensindependent.com/deeprock-fracking-waste-lawsuit-2/

Kington, D. (2026, September 17). Operator fights to reopen Injection Wells linked to disaster. Athens County Independent. https://athensindependent.com/deeprock-appeal-noble-county-injection-wells/

Klenke, G. (2025, January). Data gaps: A critical examination of oil and gas well incidents in Ohio. FracTracker Alliance. https://www.fractracker.org/2025/01/data-gaps-a-critical-examination-of-oil-and-gas-well-incidents-in-ohio/

Morgan, J. (n.d.). The Daily Accident Report-Ohio Oil & Gas. Facebook. https://www.facebook.com/profile.php?id=61560490386193&fbclid=IwY2xjawUjtrJleHRuA2FlbQIxMABwZG9mAWJyaWQRMUNaUWh1b0hFandWVlNEOHVzcnRjBmFwcF9pZBAyMjIwMzkxNzg4MjAwODkyAAEeOfiF2H8RYrQ1MtE_3pdzxPiGHKfT7UsUcSbvUiddUnG1hNTn2Qb7zU5wvFw_aem_xrdKMrnCWo8oqLGw-74_DQ

Nobel, J. (2025, March 24). Radioactive Shadow Workers | The treatment of oil and gas field waste is a dirty industry’s dirtiest secret. Sierra Club. https://www.sierraclub.org/sierra/2025-1-spring/feature/radioactive-oil-gas-shadow-workers

Ohio Department of Natural Resources. (2018, September 27). Incident guide (Reprint). https://dam.assets.ohio.gov/image/upload/ohiodnr.gov/documents/oil-gas/resources/IncidentGuide_RePrint%20FINAL%209272018.pdf

Ohio Department of Natural Resources – Division of Oil and Gas Resources Management. (2026, January 13). Risk Based Data Management System (RBDMS) inspection records for Kris Mar #1 (API Well No. 341672508400). State of Ohio. https://drive.google.com/file/d/1p2WERwDPnHJIwGKE6pU_0s9YtVHa9Ulb/view?usp=drive_link

Ohio Department of Natural Resources – Division of Oil and Gas Resources Management. (2026, July 20). CSI BIA package for “No change” filing for oil and gas definitions, permits, simultaneous operations, prevention of pollution and contamination, and safety rules. https://dam.assets.ohio.gov/image/upload/ohiodnr.gov/documents/oil-gas/rules/CSI_BIA_Package.pdf

Ohio Department of Natural Resources, Division of Oil and Gas Resources Management. (2024, October 28). Chief’s Order No. 2024-470: Arrowhead Road Services No. 1 (SWIW #27) Well API #34-167-2-9771-0000. State of Ohio. https://drive.google.com/file/d/1me8JvFj-pwTRJu7egzvhxtsY0I6QnjVv/view

Ohio Department of Natural Resources – Division of Oil & Gas Resources Management. (2021, January 25). Incident photograph log: Ohio Power-Gant #17-69 follow-up (Incident No. 2021015, API Well No. 34121232160000). https://drive.google.com/file/d/1j_S8vXkZGLOko5WzzrAkVzGgwCK49QMX/view

Ohio Department of Natural Resources — Division of Oil and Gas. Oil & Gas Commission.(n.d.). https://ohiodnr.gov/business-and-industry/municipalities-and-public-entities/commissions-and-councils/oil-gas-commission

Ohio Department of Natural Resources. (n.d.). Oil & Gas Inspections and enforcement. Resources. https://ohiodnr.gov/business-and-industry/energy-resources/required-inspections-and-enforcement/oil-gas-inspections-enforcement

Ohio Department of Natural Resources. (n.d.). Oil & Gas Well database. https://ohiodnr.gov/business-and-industry/energy-resources/well-information/featured-content-3

Ohio Department of Natural Resources. (n.d.). Public Database of Non-Appealable orders for Violations. https://ohiodnr.gov/rules-and-regulations/rules-and-regulations-by-division/oil-and-gas/public-database-of-non-appealable-orders-for-violations

Ohio Environmental Protection Agency. (n.d.). Emergency response. https://epa.ohio.gov/divisions-and-offices/emergency-response

Oil and Gas Production in Ohio. Ohio Legislative Service Commission. (2024, October). https://www.lsc.ohio.gov/assets/organizations/legislative-service-commission/files/oil-and-gas-production-in-ohio-october-2024.pdf

Orders by the Chief. Ohio Department of Natural Resources — Division of Oil and Gas. (n.d.). https://ohiodnr.gov/wps/portal/gov/odnr/discover-and-learn/safety-conservation/about-ODNR/oil-gas/oil-gas-resources

Physicians for Social Responsibility. (2022, September). Fracking with forever chemicals in Ohio. https://psr.org/wp-content/uploads/2022/09/fracking-with-forever-chemicals-in-ohio.pdf

Physicians for Social Responsibility. (2023, October). Compendium of scientific, medical, and media findings demonstrating risks and harms of fracking (9th ed.). https://psr.org/wp-content/uploads/2023/10/fracking-compendium-9.pdf

Ramsay, V. (2025, November 26). A decade of danger: Why ODNR is allowing Deeprock to restart suspended injection wells near Washington County water sources?. Buckeye Environmental Network. https://benohio.org/a-decade-of-danger-why-odnr-is-allowing-deeprock-to-restart-suspended-injection-wells-near-washington-county-water-sources/

Ramsay, V. (2026, July 14). Sixteen months of organizing. Four Wells shut down. Buckeye Environmental Network. https://benohio.org/sixteen-months-of-organizing-four-wells-shut-down/

Reed, B. (2026, July 2). Ohio Department of Natural Resources investigates leaking injection well, six years later the problem has gotten worse. Buckeye Environmental Network. https://benohio.org/ohio-department-of-natural-resources-investigates-leaking-injection-well-six-years-later-the-problem-has-gotten-worse/

Schlumberger. (n.d.). Unconventional resource. Energy Glossary. https://glossary.slb.com/en/terms/u/unconventional_resource

Section 1509.01: Division of oil and gas resources management – oil and gas definitions. Section 1509.01 – Ohio Revised Code | Ohio Laws. (n.d.). https://codes.ohio.gov/ohio-revised-code/section-1509.01

Section 1509.041: Database listing final nonappealable orders issued for violations to be accessible to public. Section 1509.041 – Ohio Revised Code | Ohio Laws. (n.d.). https://codes.ohio.gov/ohio-revised-code/section-1509.041

Section 1509.33: Civil penalties. Section 1509.33 – Ohio Revised Code | Ohio Laws. (n.d.). https://codes.ohio.gov/ohio-revised-code/section-1509.33

State of Ohio. (n.d.). Rule 1501:9-8-01: Definitions. Rule 1501:9-8-01 – Ohio Administrative Code | Ohio Laws. https://codes.ohio.gov/ohio-administrative-code/rule-1501:9-8-01

U.S. energy information administration (EIA). (n.d.). U.S. shale natural gas production has declined so far in 2024. Today in Energy. https://www.eia.gov/todayinenergy/detail.php?id=63506

U.S. Environmental Protection Agency. (n.d.-c). Oil and Gas Extraction Effluent Guidelines. https://www.epa.gov/eg/oil-and-gas-extraction-effluent-guidelines

U.S. Environmental Protection Agency. (n.d.-c). Unconventional Oil and Gas Extraction Effluent Guidelines. https://www.epa.gov/eg/unconventional-oil-and-gas-extraction-effluent-guidelines

U.S. Environmental Protection Agency, Region 5. (2015, September 8). Safe Drinking Water Act underground injection control program periodic program review: Ohio Class II (Final Report). https://drive.google.com/file/d/1ykPsxGbcD77zYM4THg-XhcP39awiRcEv/view

U.S. Environmental Protection Agency. (2016) Hydraulic Fracturing for Oil and Gas: Impacts from the Hydraulic Fracturing Water Cycle on Drinking Water Resources in the United States (Final Report). U.S. Environmental Protection Agency, Washington, DC, EPA/600/R-16/236F. https://cfpub.epa.gov/ncea/hfstudy/recordisplay.cfm?deid=332990

U.S. Environmental Protection Agency. (2016, June 28). Effluent limitations guidelines and standards for the oil and gas extraction point source category. Federal Register. https://www.federalregister.gov/documents/2016/06/28/2016-14901/effluent-limitations-guidelines-and-standards-for-the-oil-and-gas-extraction-point-source-category

U.S. Environmental Protection Agency. (2020, May). Summary of input on oil and gas extraction wastewater management practices under the Clean Water Act. U.S. Environmental Protection Agency, Washington, DC, EPA-821-S19-001. https://www.epa.gov/sites/default/files/2020-05/documents/oil-gas-final-report-2020.pdf

Washington County produced water investigation. Ohio Department of Natural Resources — Division of Oil and Gas. (n.d.-b). https://ohiodnr.gov/discover-and-learn/safety-conservation/about-ODNR/oil-gas/oil-gas-resources/washington-county-investigation

WOSU Public Media. (2023, September 20). The state of fracking in Ohio [Radio broadcast]. In All sides with Anna Staver. https://www.wosu.org/show/all-sides-with-ann-fisher/2023-09-20/the-state-of-fracking-in-ohio

Zuckerman, J. (2024, May). Fracking waste wells owned by an Ohio senator are leaking. The state paid $1.3 million to clean it up. Cleveland.com. https://www.cleveland.com/open/2024/05/fracking-waste-wells-owned-by-an-ohio-senator-are-leaking-the-state-paid-13-million-to-clean-it-up.html

Notes

  1. The term “incident” is undefined by the Ohio Department of Natural Resources and Ohio Oil and Gas Code, but used throughout this report to reflect the records request and associated responsive data. ↩
  2. Data for this analysis was requested and received in three tranches. The first set of data requested, which included incidents from 2014 through early September of 2023 was requested by Jenny Morgan and received in early 2024. The second set of data requested included records from the last part of 2023 through April of 2025, and was requested by Jenny in January of 2025 and received in May of 2025. The final data set included all of 2025 records, and was requested by FracTracker in February of 2026 and received in March of 2026. ↩
  3. This report uses “oil and gas wastewater” to describe the combination of naturally occurring toxic saltwater and flowback and chemicals incorporated to that water during the fracking process. Oil and gas wastewater is sometimes referred to as “brine” or “produced water,” in different contexts. These are distinct terms with distinct meanings but are often utilized interchangeably. For a more extensive description of these terms, see Appendix A. ↩
  4. Barrels is abbreviated as “bbls” in the records ↩
  5. While FracTracker received all Chief’s orders records from 2000-2025, Chief’s orders records from before 2019 were not systematically reviewed for the small, separate analysis and may be reviewed for future work. ↩

Acknowledgments: Special thanks to Anton Krieger, Becca Pollard, Roxanne Groff, and Bev Reed of Buckeye Environmental Network, whose review, on-the-ground knowledge of Ohio’s injection wells, and photographs shaped this report.

Stay informedFracTracker Newsletter
Support our work

FracTracker Alliance helps communicate the risks of oil and gas and petrochemical development to advance just energy alternatives that protect public health, natural resources, and the climate.

By contributing to FracTracker, you are helping to make tangible changes, such as decreasing the number of oil and gas wells in the US, protecting the public from toxic and radioactive chemicals, and stopping petrochemical expansion into vulnerable communities.

Your donations help fund the sourcing and analysis of new data so that we can keep you informed and continually update our resources.

Please donate to FracTracker today as a way to advocate for clean water, clean air, and healthy communities.

Donate now
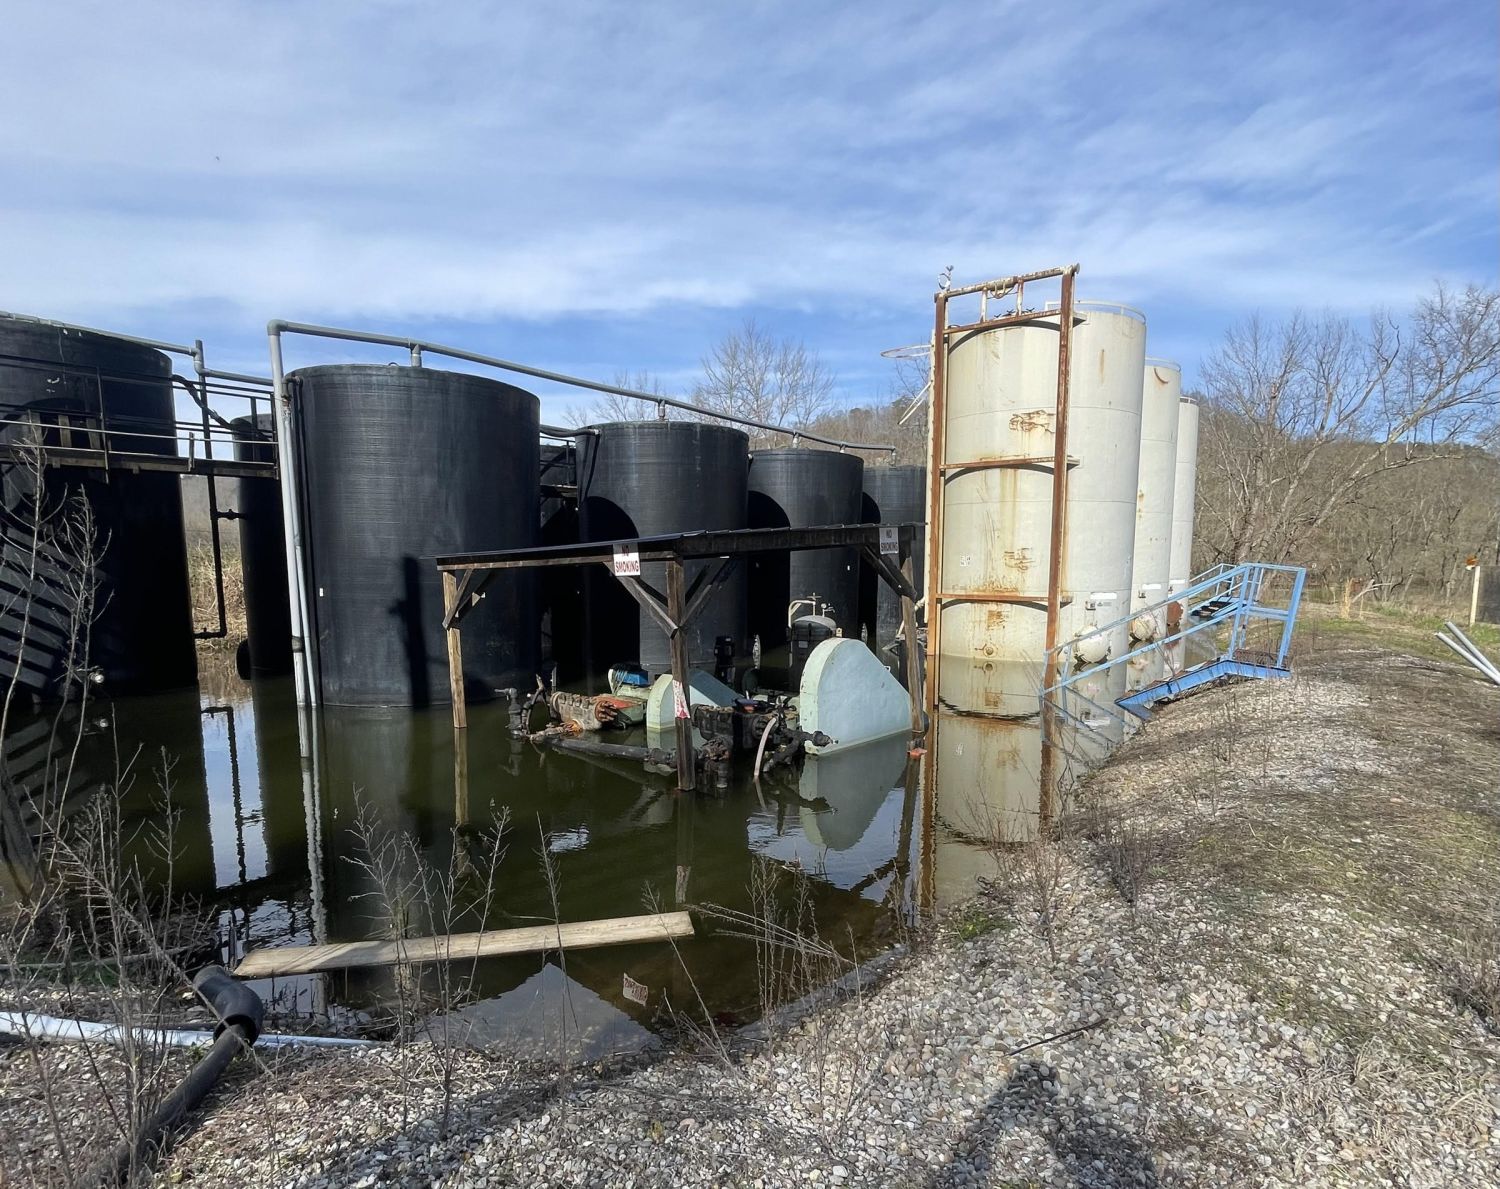
Texas Continued Data Center Permitting after the Governor’s Pause

On September 21, 2026, Governor Abbott wrote a letter directing the Texas Commission on Environmental Quality (TCEQ) “to halt all permits sought by data centers.” He framed this pause as an attempt to give ERCOT, the Public Utility Commission of Texas and the Texas Water Development Board time to review the impact of data centers on the Texas grid and existing water resources. He also wrote that “no other state agency shall move forward with regulatory approvals related to data centers until this information is acquired.”

However, working closely with Public Citizen, FracTracker reviewed TCEQ’s records and found that the agency continued moving data center projects forward: mailing public notices for major-source air permit applications, advancing applications through review, issuing air emission-limit certifications, and approving construction stormwater coverage. Since September 21, TCEQ has continued reviewing applications and issuing approvals that allow data center development to proceed.

Governor’s order

Amidst an unprecedented national build-out of data centers and related fossil fuel infrastructure, Texas is the country’s largest market for new data center development. The scale and speed of the build-out have few historical precedents, placing immense pressure on regulators, the Texas grid and water resources, and the communities where these projects are proposed. As the Governor stated in his September 21 letter, the pause was intended to ensure “Texans’ natural resources and way of life are protected.” Abbott’s concern about the negative impacts of data center development marks a shift from his earlier wholehearted embrace of development. On November 14, 2025, he celebrated Google’s data center investments in Texas, stating: “Texas is the epicenter of AI development, where companies can pair innovation with expanding energy.”

Over the past several months, Abbott has publicly changed his position. On August 3, 2026, he directed the Public Utility Commission and ERCOT to audit all data centers advancing through ERCOT’s interconnection process, including their projected electricity and water use, on-site generation, tax incentives, ownership and community impacts. On September 14, he directed the Texas Water Development Board to enforce water-use reporting requirements and partner with ERCOT on the audit. On September 21, he issued his directive to TCEQ and said he would work with the Legislature to eliminate financial incentives for data centers.

The Governor’s letter to TCEQ ordered the pause in three ways:

  • TCEQ was directed “to halt all permits sought by data centers.”
  • TCEQ was directed “to pause the issuance of all permits related to data center projects until ERCOT completes its review.”
  • More broadly, “no other state agency shall move forward with regulatory approvals related to data centers until this information is acquired.”

On October 14, responding to FracTracker’s request for clarification, TCEQ stated that the agency “has paused the issuance of all air and water permits and authorizations related to the construction or development of infrastructure directly supporting data centers while ERCOT completes its comprehensive grid and community impact audit.”

When FracTracker asked whether applications could still move through review without a final approval, TCEQ responded: “Companies can submit applications, but their applications will not advance through the review process.”

That response made TCEQ’s stated position clear: a pause on both the review and issuance of data center permits and authorizations. A review of the agency’s own records found something else.

Map of Texas showing TCEQ actions on data center projects between September 21 and October 16, 2026: 7 air emission certifications issued, 11 construction stormwater coverages approved, 14 gas plant or generator applications fast-tracked or assigned to an engineer, and 3 major-source air permit notices mailed after the order. Sites cluster around Dallas–Fort Worth, Austin–San Antonio, Houston, Abilene and West Texas.
Figure 1. TCEQ actions after the September 21 pause. Public-notice mailings, construction stormwater approvals, air emission-limit certifications and applications advancing through review. See the accompanying spreadsheet for dates, permit records and qualifications about data-center connections.

What the records show

Our review of permitting activity found four kinds of TCEQ actions after September 21: public-notice mailings, stormwater authorizations, air emission-limit certifications and applications continuing to advance through review. Taken together, these actions do not signal an agency trying to pause.

Public Citizen found three preliminary-decision notices for major-source air permit applications that TCEQ mailed on September 22, the day after the Governor’s order. The notices concern VoltaGrid’s ABI-1 plant serving Vantage’s data center campus in Shackelford County, Nexus’s self-powered data center in Hubbard, and NRG Prairie Energy Center in Hill County. The public-notice process continued: VoltaGrid’s notice was published September 23 and Nexus’s September 24. Publication starts the 30-day public-comment period. Given the Governor’s order, people could reasonably have assumed that permitting had stopped while deadlines were actually continuing. That could mean people miss their opportunity to comment or request a public meeting or contested case hearing.

FracTracker also found eleven construction stormwater records with approvals after September 21. These include large hyperscale data centers like Caldwell Valley Technology Park in Caldwell County, Crusoe’s Abilene campus and EdgeConneX’s Cedar Creek campus. All three received new coverage. New coverage removes a required regulatory barrier for clearing, grading and excavation. In other words, these authorizations allow data center construction to proceed. They may not be the only approvals a project needs, but without the required stormwater coverage, that work cannot legally begin.

TCEQ told FracTracker that companies could submit applications, but their applications would not advance through review. We found that this was not the case. In our review, FracTracker found 14 applications for gas plants and generators serving data centers or supporting their construction that continued through review after September 21. An example is Edged Dallas’s generator registration. This permit was filed and expedited on October 6, with an engineer assigned one day later and initial review completed by October 9. Instead of a pause on review, TCEQ has moved forward in their review process, in many cases expediting review. While this is not the same as issuing permits, it certainly appears to violate the Governor’s order that “no other state agency shall move forward with regulatory approvals related to data centers” until the PUC, ERCOT and the Texas Water Development Board complete their reviews.

As further evidence of the regulatory process continuing as normal amidst the pause, FracTracker also identified seven emission-limit certifications that TCEQ’s database recorded as “issued” after the order. These company-submitted certifications establish enforceable emissions limits under separate air authorizations. One, for Decennial’s SA01 Data Center in San Antonio, was recorded October 16, two days after TCEQ told FracTracker it had paused authorizations.

What counts as infrastructure supporting a data center?

TCEQ said its pause included infrastructure “directly supporting data centers.” Reading the permits, how the agency interprets that phrase is open to question.

On October 8, TCEQ approved construction stormwater coverage for LCRA’s Misty substation in Caldwell County. LCRA describes the $111.6 million project as serving Bluebonnet Electric Cooperative’s load. Tract, the developer of Caldwell Valley Technology Park, has a facility-design agreement with Bluebonnet for an initial 360 MW in 2028, and a proposed 1,500 MW gas plant associated with Tract lists Misty as its connection point. That points to infrastructure being built to support data centers. Nothing in the stormwater record calls it a data-center project.

LCRA’s financial statements explain that transmission costs are shared across electricity consumers in ERCOT. Infrastructure built to serve data centers can therefore affect other people’s electricity bills. We have not yet established how Misty’s full cost will be divided. FracTracker is reviewing these transmission upgrades as well. For this report, the question is how TCEQ decides which of them fall under the pause.

We see a similar question with Maverick Lodge, a 4,000-bed workforce camp for data-center construction. Haskell County Ventures filed a gas-generation application to power the camp, which TCEQ expedited October 14 and assigned to an engineer October 16. A pause on infrastructure supporting data centers needs to account for the larger set of projects being filed as part of that build-out.

Lack of transparency around data center development

Identifying which permits corresponded to data centers was particularly challenging. Applicants might be separate power companies, contractors or LLCs whose names reveal little about the campuses they serve. At FracTracker, we compared the permits with our database of data-center locations. SMS Horizon EC1, for example, filed for a plant at the same road corner as Poolside’s proposed campus in Pecos County. The LLC also shared a name with an LLC associated with the Poolside data center. The location suggests a connection, but we have not found a document tying the two together.

What we need is a clear public database connecting each campus to its owners, related LLCs, power plants, water infrastructure, permit numbers and review status. Texas could follow the example of Pennsylvania, which has a centralized Data Center Permit Tracker. Residents should be able to see which projects are being proposed and what infrastructure is being built to serve them.

Recommendations

Data-center developments moving through permitting despite the Governor’s order show why Texas needs a statewide moratorium. A moratorium would give Texans more time to study the impacts of this build-out. ERCOT, the PUC and the Texas Water Development Board need time for cumulative-impact studies, regional analyses of proposed data-center clusters and long-term planning. Local communities need more opportunities to participate in decisions about land use and data-center development.

TCEQ needs to comply with its stated pause on reviewing applications and issuing authorizations for data centers and the infrastructure supporting them. That includes expedited review, air certifications and stormwater coverage. It should also extend or reopen the affected comment periods so people have a full opportunity to comment after the pause ends. People who reasonably thought permitting had stopped should not lose their chance to participate.

TCEQ should explain any failures to pause review and permitting. TCEQ’s compliance update to the Governor is due today, October 19. This compliance update should be made available to the public. If it does not address the discrepancies we found, TCEQ should produce an addendum giving a public accounting of how it advanced permitting after September 21 and what it will do to prevent that from continuing.

Records and sources

We checked records through October 16, 2026. Dates and sources are linked in the accompanying spreadsheet.

Additional sources include the Governor’s September 21 letter, TCEQ’s construction general permit and public guidance, TCEQ’s emails to FracTracker, and TCEQ’s permit and public-notice records. This report benefited greatly from the collaboration with Public Citizen, who identified additional air, water and major-source permits that our own search did not find, which we then reviewed and included here.

Stay informedFracTracker Newsletter
Support our work

FracTracker Alliance helps communicate the risks of oil and gas and petrochemical development to advance just energy alternatives that protect public health, natural resources, and the climate.

By contributing to FracTracker, you are helping to make tangible changes, such as decreasing the number of oil and gas wells in the US, protecting the public from toxic and radioactive chemicals, and stopping petrochemical expansion into vulnerable communities.

Your donations help fund the sourcing and analysis of new data so that we can keep you informed and continually update our resources.

Please donate to FracTracker today as a way to advocate for clean water, clean air, and healthy communities.

Donate now

Meet the 2026 Sentinels: Lois Malvo, Zulene Mayfield, Qiyam Ansari, Eboni Neal Cochran, and Karen Feridun.

Announcing the 2026 Community Sentinel Award Recipients

Announcing the 2026 Community Sentinel Award Recipients

Meet the 2026 Sentinels: Lois Malvo, Zulene Mayfield, Qiyam Ansari, Eboni Neal Cochran, and Karen Feridun.

Let’s celebrate the Sentinels together

Join us in New Orleans or virtually as we celebrate this year’s Sentinels!

Thursday, November 12, 2026
5 – 10 PM CT
New Orleans, LA (location provided after registering)
In person + virtual attendance on Zoom

FracTracker Alliance is excited to invite you to attend the 2026 Community Sentinel Awards for Environmental Stewardship, hosted in partnership with Halt the Harm Network to honor individuals from across the United States who demonstrate extraordinary courage and commitment in their efforts to protect their communities from environmental injustice.

Established in 2015, the Sentinel Award recognizes the pivotal role of individuals championing change on the front lines of the environmental movement. The award specifically honors those who work to stop the harms of the fossil fuel industry on their communities and their environment.

This year marks the 11th Community Sentinel Award for Environmental Stewardship. The recipients will be honored at a live award ceremony on November 12, 2026 in New Orleans, Louisiana. Each winner will receive a $1,000 award and recognition of their unwavering commitment to the environmental justice movement.

Meet Our Community Sentinels

22 individuals were nominated for the 2026 Community Sentinel Award. Of those, 20 agreed to be listed publicly.

Meet this year’s recipients:

Portrait of Zulene Mayfield

Zulene Mayfield (she/her)

2026 Community Sentinel

Location: Chester, Pennsylvania
Organization: Chester Residents Concerned for Quality Living (CRCQL)

Zulene was born, raised and educated in Chester. She is a family-oriented person who enjoys the comfort of a large and loving family, and it was that love of family that led her to join a group of residents concerned about what was being billed as the Westinghouse trash-to-steam plant. She was the youngest of the group and the only woman of color. She became chairperson of Chester Residents Concerned for Quality Living (CRCQL) in 1993, a year after the group formed.

CRCQL has defeated numerous waste processing facilities, shut down the nation’s largest processor of infectious medical waste, and successfully sued a sewage treatment and sludge burning plant, resulting in increased EPA and DEP fines. It also filed a Title VI lawsuit against the DEP alleging a discriminatory practice of issuing permits in Chester, the first of its kind in the nation, and its actions led Pennsylvania to create the Office of Environmental Justice.

Zulene helped form Campus Coalition Concerning Chester (C4) at Swarthmore College, has served on the National Environmental Justice Advisory Committee (NEJAC), and advises C4 and CRCQL’s Choices Environmental Youth Leadership Group. She is now leading her community and its allies in mobilizing against Penn America LNG, a proposed liquefaction facility that would be the largest LNG facility on the East Coast.

Portrait of Eboni Neal Cochran

Eboni Neal Cochran (she/her)

2026 Community Sentinel

Location: Louisville, Kentucky
Organization: Rubbertown Emergency ACTion (REACT)

Eboni is a wife and retired homeschool mom of one, who has three adult bonus children and six grandchildren.

She is Co-Director of Rubbertown Emergency ACTion (REACT), a grassroots organization of residents living near or at the fence lines of Rubbertown chemical facilities and other industries that cause environmental injustice. She has worked with the organization since 2003, educating community members and decision makers and pushing for reduced exposure to toxic chemicals.

REACT works for strong laws to stop toxic air pollution, protection of residents in a leak, fire or explosion at an industrial facility or railcar, and full disclosure of information on the impact of industrial facilities.

Eboni is also founder and executive director of the West Louisville Math and Science Project, which builds math, science and literacy skills among children within the African diaspora and their families.

Portrait of Qiyam Ansari

Qiyam Ansari (he/him)

2026 Community Sentinel · Emerging Leader Award

Location: Homestead, Pennsylvania
Organization: Valley Clean Air Now (VCAN)

Qiyam is the Executive Director of Valley Clean Air Now (VCAN), an environmental justice nonprofit fighting for clean air in Pennsylvania’s Mon Valley, home to U.S. Steel’s Clairton Coke Works. A community organizer rooted in the region, he has worked since 2019 to help residents hold industrial polluters accountable and assert their right to clean air under Pennsylvania’s Environmental Rights Amendment.

With Clean Water Action, he led the campaign that won Pittsburgh’s plastic bag ban, helped secure EPA rule changes that reduced toxic emissions from coke oven batteries through fenceline benzene monitoring, and spearheaded a Community Health Assessment with the Agency for Toxic Substances and Disease Registry.

He has raised more than $4.5 million for grassroots groups in Allegheny County and serves on the Allegheny County Air Pollution Control Advisory Committee.

Portrait of Karen Feridun

Karen Feridun (she/her)

2026 Community Sentinel · Community Choice Award

Location: Berks County, Pennsylvania
Organization: Better Path Coalition and No False Climate Solutions PA

Karen is a Pennsylvania-based activist and co-founder of two statewide coalitions, the Better Path Coalition and No False Climate Solutions PA. Her work in the anti-fracking movement began in 2010 when she founded Berks Gas Truth, and she went on to co-found Pennsylvanians Against Fracking and serve on the national steering committees of Americans Against Fracking and the Stop the Frack Attack Network. In 2022 and 2023, she was the lead organizer of the Pennsylvania Climate Convergence in the state capital. Her work spans local, regional, national and international levels, and she has written and spoken on these issues in The Huffington Post, Daily Kos and The Hill, and at a COP21 side event, the DNC platform committee meeting in Orlando, the National Geographic Society and New York’s Society for Ethical Culture. In 2020, she was invited by The Philadelphia Inquirer to argue in favor of banning fracking, opposite then–Lt. Gov. John Fetterman, who argued against a ban.

Portrait of Lois Malvo

Lois Malvo

2026 Community Sentinel

Location: Lake Charles, Louisiana
Organization: Fisherville Environmental Action Now

At 80 years young, Lois Malvo has spent more than four decades standing up for her community, guided by an unwavering faith in God and a deep commitment to justice. A longtime advocate in Southwest Louisiana, Lois has confronted environmental threats, racism, poverty, and inequity while working to protect the health and dignity of her neighbors. She has spoken before state representatives in Baton Rouge and at the U.S. Capitol, and has shared her community’s concerns with KPLC-TV, American Crest TV, and other media outlets. Lois successfully challenged the rezoning of Rice Mill from residential to industrial and opposed a pipeline near an elementary school. She also fought a proposed duplex on a landfill on St. Mary’s Drive, helping residents move to cleaner, safer housing. Through Fisherville Environmental Action Now (FEAN), founded after toxic chemical train derailments affected her family and community, Lois continues to educate and mobilize residents. Her work reflects her belief in spiritual warfare, compassion, unity, and protecting God’s people and creation.

The program will bring together music, art, and celebrations that honor our communities and their accomplishments.

In-person seating is limited, so reserve your seats as soon as possible! Can’t join us in New Orleans? Register to attend the virtual program.

Let’s celebrate the Sentinels together

Join us in New Orleans or virtually as we celebrate this year’s Sentinels!

Thursday, November 12, 2026
5 – 10 PM CT
New Orleans, LA (location provided after registering)
In person + virtual attendance on Zoom

Congratulations to all the 2026 nominees

  • Alyssa Portaro — LA
  • Bryce Payne — PA
  • Catherine “Cat” Adams — OH
  • Cheyenna “Chey” Morgan — OK
  • Deirdre Nieves — MI
  • Diana Mireles — CA
  • Eboni Neal Cochran — KY
  • Elizabeth “Beth” Vild — OH
  • James Hiatt — LA
  • Jasmine Bernard — TN
  • Joanie Steinhaus — TX
  • Junior Walk — WV
  • Karen Feridun — PA
  • Karina Samuel — FL
  • Lani Wean — WV
  • Lois Malvo — LA
  • Qiyam Ansari — PA
  • Tabitha Tripp — IL
  • Yvonne Taylor — NY
  • Zulene Mayfield — PA

Thank you to our 2026 judges

  • Andrea Pierce, Deputy Director of Programming, Michigan Environmental Justice Coalition; 2024 Community Sentinel Award winner
  • Natasha DeJarnett, PhD, MPH, BCES, Assistant Professor, University of Louisville, Department of Medicine
  • Jennifer Hadayia, MPA, Executive Director, Air Alliance Houston
  • Mike Schade, Senior Director of Programs and Strategy, Toxic-Free Future

Thank You to Our Sponsors & Partners

Large Sponsors

Sponsors

Partners

Allies

Community Supporters

Sponsorship made possible through the generous support of the Beyond Petrochemicals campaign.

Drilling rig on a CNX (Consol Energy) fracking pad beyond a cattle pasture in Noble County, Ohio.

CNX’s Expanded Radiation Monitoring and Disclosure Fall Short

Drilling rig on a CNX (Consol Energy) fracking pad beyond a cattle pasture in Noble County, Ohio.

CNX’s Expanded Radiation Monitoring and Disclosure Fall Short

Ted Auch, 2017. Courtesy of FracTracker Alliance.

Download this press release

FOR IMMEDIATE RELEASE

September 18, 2026

Contact: Shannon Smith, FracTracker Alliance, smith@fractracker.org, (814) 449–0659

CNX’s Expanded Radiation Monitoring and Disclosure Fall Short

FracTracker calls for comprehensive radiation testing and enforceable public reporting requirements across Pennsylvania’s oil and gas industry

PITTSBURGH, PA— Since CNX and Gov. Josh Shapiro launched their “Radical Transparency” partnership in 2023, FracTracker Alliance has repeatedly challenged its broad safety claims and reliance on voluntary company disclosure. CNX’s newly announced radiation monitoring and disclosure program raises the same concerns: limited monitoring cannot establish safety, and voluntary commitments cannot replace enforceable requirements. 

FracTracker Alliance supports comprehensive monitoring of radioactive materials in oil and gas waste. CNX’s announcement includes third-party collection of ambient gamma data and public disclosure of radiation surveys of waste leaving its sites. However, ambient gamma monitoring alone cannot identify or characterize the full range of radioactive contaminants or potential exposure pathways, and CNX’s own 2024 Comprehensive Radiation Protection Plan describes a broader suite of radiation-protection measures.

In its own February 2024 Comprehensive Radiation Protection Plan, analyzed in FracTracker’s Not-So-Radical Transparency report, CNX identified “drill cuttings, production water, flow-back solids/sludge, and pipe scale” as potential sources of radioactive material. CNX’s 2024 plan also notes the relevance of surveys of alpha and beta radiation, radon monitoring, airborne radioactive-particle sampling, and laboratory analysis of water and solid waste. Radical transparency entails a clearer explanation of why this “expanded” radiation monitoring falls short of the more comprehensive monitoring described in the 2024 plan. 

Equally concerning is the continued reliance on voluntary company commitments for radiation monitoring and disclosure, rather than enforceable requirements that apply consistently across Pennsylvania’s oil and gas industry. This leaves the company itself with substantial control over what gets measured and ultimately is made public. The limitations of voluntary industry disclosure are illustrated by the controversy around CNX’s water-testing program at its NV110 well site. A 2023 agreement said post-drilling water results would be made public when participating landowners approved their release, yet the site was later archived before all opted-in results were published. CNX subsequently said those results were not posted because the pre-drill samples preceded the Radical Transparency program and did not provide the baseline it wanted for comparison. The Center for Coalfield Justice notes this appears nowhere in the signed forms, calling it “changing the rules in the middle of the game.” Whatever the explanation, the episode demonstrates the problem with making public-health information dependent on a company’s voluntary disclosure program rather than a clear, enforceable disclosure requirement.

FracTracker’s recent report on Pennsylvania’s fracking waste highlights radioactive hazards and gaps in existing waste disclosure. Pennsylvania operators are required to submit Form 26R reports describing residual waste streams, including periodic chemical analyses. A collaborative Right-to-Know effort by Earthjustice, Ohio Valley Allies, WildEarth Guardians, and FracTracker obtained roughly 400,000 pages of previously difficult-to-access records. FracTracker’s analysis found chemical tests documenting very high concentrations of radioactive and other hazardous contaminants in some Pennsylvania oil and gas wastes. One wastewater sample from a Chesapeake-operated well pad in Bradford County contained a combined 9,890 picocuries per liter of radium-226 and radium-228—nearly 2,000 times EPA’s drinking-water limit. Measurements of external gamma radiation can provide useful information, but they are not a replacement for laboratory testing that identifies which radionuclides are present and at what concentrations.

In the past, CNX has stirred controversy by using the Radical Transparency program to claim that unconventional natural gas development is “safe and inherently good for the communities” it operates in. These claims, which have been publicly challenged by scientists, fly in the face of a robust scientific literature that documents clear associations between unconventional oil and gas development and adverse health outcomes. By introducing this narrow radiation monitoring program, CNX is not presenting the comprehensive evidence that would be required to fully assess the risks that radioactivity poses to public health. Such a narrow presentation of data and dismissal of a substantial body of scientific evidence documenting associations between unconventional oil and gas development and adverse health outcomes is neither radical nor transparent. FracTracker calls for comprehensive, enforceable radiation testing and disclosure requirements across Pennsylvania’s oil and gas industry, including alpha and beta testing of surface contamination, radon monitoring, and laboratory measurement of radioactive contaminants in liquid and solid waste. Such an effort should be led by the agencies responsible for protecting the health of Pennsylvanians. 

“We’ve been calling attention to gaps in monitoring for years, so yes, collecting more data is a good thing,” said Shannon Smith, Executive Director of FracTracker Alliance. “But CNX monitoring itself does not answer the larger public health questions, and it certainly does not make the company the authority on whether its operations are safe. Governor Shapiro should be investing in independent public health research and enforceable oversight instead of relying on a fracking company to monitor itself and then use its own data to make sweeping claims about public safety.”


###


FracTracker Alliance is a 501(c)(3) nonprofit that maps, analyzes, and communicates the risks of oil, gas, and petrochemical development. To learn more, visit fractracker.org or connect with us @FracTracker.

Aerial view of a lined water impoundment and two storage tanks at a Seneca Resources site in Clearfield County, Pennsylvania, surrounded by autumn forest.

Tracking Pennsylvania’s Oil and Gas Waste in 2025

Overview

  • Pennsylvania’s oil and gas wells reported generating 72.6 million barrels of liquid waste and over 825,000 tons of solid waste in 2025, with unconventional wells, which comprise less than 15% of the state’s inventory, accounting for 98.6% of liquids and 99.8% of solids.
  • Nearly 50,000 conventional wells reported production but no waste at all, raising significant concerns about Oil and Gas operators exploiting gaps in the DEP’s reporting requirements. 
  • FracTracker and its partners worked together to obtain and analyze approximately 400,000 pages of required chemical-disclosure records, documenting high concentrations of radioactive and other hazardous contaminants in some Pennsylvania oil and gas waste.
  • Much of the reported “disposal” is really transfer. Waste ends up in processing facilities, temporary storage, and landfills that leach, leaving the public to grapple with the burden of living near toxic, often radioactive, waste long after the state stops tracking it. 

Introduction: The Price of Production

Pennsylvania produced over 7.8 trillion cubic feet of gas in 2025, a vast sum that is roughly equal to 16% of U.S. production and more than 5% of global production.   

Along with production comes enormous quantities of waste – over 825,000 tons of solid waste and 72.6 million barrels (3 billion gallons) of liquids that need to be disposed of, according to the Pennsylvania Department of Environmental Protection’s waste data.  As a point of comparison, the solid waste reported by oil and gas operators in Pennsylvania in 2025 alone weighs more than 2.2 Empire State Buildings.  To get a sense of the volume of liquid waste, take a trip to Niagara Falls on a typical day, watching 757,500 gallons of water go over the falls every second, or take the boat ride for a more immersive experience.  After watching for 67 minutes, you’ll see the equivalent amount of water as the waste fluids that were generated last year by Pennsylvania O&G wells.

Pennsylvania Oil and Gas Waste in 2025. Open the full map.

The vast amount of O&G waste that comes with this scale of production is an enormous management problem in Pennsylvania, and beyond.

Where that waste ends up matters for workers, nearby communities and the environment. Oil and gas wastes can contain high concentrations of salts, hydrocarbons, metals, naturally occurring radioactive materials and other contaminants. Workers who handle, transport, process or dispose of these wastes may be exposed to hazardous chemicals, gases or radioactive materials, while spills, leaks or improper treatment and disposal can contaminate soil, groundwater and surface water and create risks for ecosystems and public health. Accurate waste reporting is therefore a basic safeguard: regulators, workers and the public need to know how much waste is being generated, what it contains, where it is going and how it is being managed in order to identify potential exposures, enforce waste-management requirements and understand which communities and facilities are bearing the burden of the industry’s waste.

In this article, we will take a closer look at some details of this process, including the different categories of waste, differences between waste streams from conventional and unconventional wells, a de facto waste reporting loophole for conventional operators, brine spreading, where the waste goes, and some example reports that include detailed chemical analyses revealing the high toxicity of liquid and solid waste.

Defining the Waste: Solids vs. Liquids

In the introduction, we discussed the two units that O&G waste is reported on in Pennsylvania – solid and liquid.  This is a useful shorthand to encompass the waste stream, as there are 18 different categories of waste type that appear on DEP’s waste reports. 

Waste TypeResidual Waste Code (RWC) DescriptionBarrelsPct. of Liquid WasteTonsPct. of Solid Waste
Basic Sediment (in Barrels) RWC 807Sediment from Production Storage – sediment from storage of marketable oil and gas product. Does not include sediment from oil and gas-related wastewater storage.1,3860.00%
Drill Cuttings (in Tons) RWC 810Drill Cuttings – oil and gas drill cuttings. [Rock encountered by the drill bit during boring]706,64985.63%
Drilling Fluid Waste (in Barrels) RWC 803Drilling Fluid Waste – oil and gas drilling mud, other drilling fluids other than fracturing fluid and spent lubricant. [Reported in barrels]272,4180.38%
Drilling Fluid Waste (in Tons) RWC 803Drilling Fluid Waste – oil and gas drilling mud, other drilling fluids other than fracturing fluid and spent lubricant. [Reported in tons]4,5070.55%
Filter Socks (in Tons) RWC 812Filter Socks – Filters, filter socks and other media used to filter any oil and gas-related wastewater. Does not include filter socks mixed with RWC 804 for disposal purposes. Except where filter socks are mixed with RWC 804 and coded as RWC 804, mixed loads of RWC 812 with other waste for disposal purposes, such as drill cuttings, will be coded as RWC 812.690.01%
Other Oil & Gas Wastes (in Barrels) RWC 899Other Oil and Gas Wastes – all remaining oil and gas wastes other than those already covered under existing RWCs. Includes containment water. Does not include rainwater that is collected in a containment area that has not been mixed with residual waste. [Reported in barrels]1,862,5092.56%
Other Oil & Gas Wastes (in Tons) RWC 899Other Oil and Gas Wastes – all remaining oil and gas wastes other than those already covered under existing RWCs. Includes containment water. Does not include rainwater that is collected in a containment area that has not been mixed with residual waste. [Reported in tons]14,7971.79%
Produced Fluid (in Barrels) RWC 802Produced Fluid – includes flow-back, brine and any other formation fluids recovered from the wellbore. Flow-back is defined as fracturing/stimulation fluids, including any colloidal and suspended solids within the fluid, recovered from the wellbore after injection into the wellbore. [Reported in barrels]70,294,32796.80%
Produced Fluid (in Tons) RWC 802Produced Fluid – includes flow-back, brine and any other formation fluids recovered from the wellbore. Flow-back is defined as fracturing/stimulation fluids, including any colloidal and suspended solids within the fluid, recovered from the wellbore after injection into the wellbore. [Reported in tons]54,6326.62%
Servicing Fluid (in Barrels) RWC 808Servicing Fluid – oil and gas production well maintenance/work over fluids, oil/water-based mud and foam and well cellar cleanout waste after drilling operations have been completed. Does not include well cellar cleanout waste covered under existing RWCs, well cellar fluids that are recycled/reused, or rainwater that is collected in a well cellar that has not been mixed with a residual waste. [Reported in barrels]129,0080.18%
Servicing Fluid (in Tons) RWC 808Servicing Fluid – oil and gas production well maintenance/work over fluids, oil/water-based mud and foam and well cellar cleanout waste after drilling operations have been completed. Does not include well cellar cleanout waste covered under existing RWCs, well cellar fluids that are recycled/reused, or rainwater that is collected in a well cellar that has not been mixed with a residual waste. [Reported in tons]1,7830.22%
Soil Contaminated by Oil & Gas Related Spills (in Barrels) RWC 811Soil Contaminated by Oil and Gas-related Spills – soil contaminated by spills of RWCs 802, 803, 805, 807, 808, 809 and 810. Soil contaminated by spills of RWC 804 will be coded using RWC 804. Soil contaminated by spills of RWC 812 will be coded using RWC 812. [Reported in barrels]20.00%
Soil Contaminated by Oil & Gas Related Spills (in Tons) RWC 811Soil Contaminated by Oil and Gas-related Spills – soil contaminated by spills of RWCs 802, 803, 805, 807, 808, 809 and 810. Soil contaminated by spills of RWC 804 will be coded using RWC 804. Soil contaminated by spills of RWC 812 will be coded using RWC 812. [Reported in tons]20,4402.48%
Synthetic Liner Materials (in Tons) RWC 806Synthetic Liner Materials – includes well site liners, liners used in pits or other approved storage structures, freshwater impoundments, centralized impoundments, or used in conjunction with primary containers.6,4860.79%
Unused Fracturing Fluid Waste (in Barrels) RWC 805Unused Fracturing Fluid Waste – oil and gas fracturing/stimulation fluid waste and fracturing sand waste that has not been injected into a wellbore.40,6310.06%
Unused Fracturing Fluid Waste (in Tons) RWC 805Unused Fracturing Fluid Waste – oil and gas fracturing/stimulation fluid waste and fracturing sand waste that has not been injected into a wellbore.2240.03%
Waste Water Treatment Sludge (in Barrels) RWC 804Wastewater Treatment Sludge – sludge and solids generated during the processing of any oil and gas-related wastewater including any sediment generated during storage of oil and gas-related wastewater. Mixed loads of wastewater treatment sludge with other waste for disposal purposes, such as filter socks (RWC 812), will be coded as RWC 804. [Reported in barrels]15,0860.02%
Waste Water Treatment Sludge (in Tons) RWC 804Wastewater Treatment Sludge – sludge and solids generated during the processing of any oil and gas-related wastewater including any sediment generated during storage of oil and gas-related wastewater. Mixed loads of wastewater treatment sludge with other waste for disposal purposes, such as filter socks (RWC 812), will be coded as RWC 804. [Reported in tons]15,6231.89%
Total Result72,615,367100.00%825,209100.00%

Table 1: O&G waste by type in 2025. Waste data was downloaded from Pennsylvania DEP on June 16, 2026. Waste type descriptions from Pennsylvania DEP, with FracTracker comments in square brackets.

The 70,294,327 barrels of produced fluids represents 96.8% of the volume of all of the liquid waste reported by Pennsylvania operators.  For solids, drill cuttings accounted for 85.6% of the mass, weighing in at 706,649 tons.   Both waste types carry a heavy contaminant load, mostly from naturally occurring but toxic components that had previously been locked away deep in the earth’s crust.

DEP has changed how it classifies these categories of oil and gas waste numerous times in recent years.  Because of these frequent changes in DEP classifications, any analysis of waste types from year to year should be conducted with significant attention to these details.  In the 2018 rules, for example, produced fluids were categorized as Residual Waste Code (RWC) 802, while fracturing fluid waste, including the fluid that comes up in the first 30 days of operation that has a higher proportion of injected chemicals (frequently called flowback fluid) was classified as RWC 805. See pages 22-23 of the 2018 reporting manual for more details.  With the 2022 rules, both waste types are now reported together under RWC 802.  Several changes were made to the list of RWC codes in 2016, as well.  

In comparison, aggregating the data by the units of measure, with tons representing solid waste and barrels representing liquid waste is a straightforward concept that holds steadily from year to year, making it a convenient metric to work with. Reducing the number of categories makes understanding other aspects of waste, such as transportation and disposal methods, less chaotic to talk about as well.

At the same time, it must be stated that from the point of view of data analytics of oil and gas waste, this level of detail is really an embarrassment of riches when compared to other states.  Places like Ohio and West Virginia only include a “water” column in their production data, with no mention of leftover fracking chemicals, drilling mud, tank sediments, pond liners, or other waste streams.  Pennsylvania’s detailed reporting makes meaningful public analysis possible, and highlights the need for residents living in other states to demand similar levels of transparency from their own regulators.  

Conventional vs. Unconventional Sources

Pennsylvania classifies oil and gas wells as either conventional or unconventional.  While both types of wells are usually fracked, unconventional wells use dramatically more fluid – while a conventional well might use tens of thousands of gallons of water per well, an unconventional operation frequently will use tens of millions of gallons per well.  

On the production side of the equation, FracTracker quantified the outsized nature of Pennsylvania’s unconventional wells.  With around 14.6% of the total inventory, those wells contributed more than 99% of the state’s gas and condensate totals, and about 14.5% of the state’s oil, roughly proportional in that last category to the number of wells it represents.  Let’s see how the numbers stack up for waste.

CategoryWell CountLiquid (Barrels)Liquid per Well (Barrels)Percent LiquidSolid (Tons)Solid per Well (Tons)Percent Solid
Conventional23,6621,016,05942.91.4%1,2630.10.2%
Unconventional12,81671,599,3085,586.798.6%823,94664.399.8%
All Wells36,47972,615,3671,990.6100.0%825,20922.6100.0%
Table 2: 2025 Conventional vs. unconventional waste totals for Pennsylvania.  Waste data was downloaded from Pennsylvania DEP on June 16, 2026.

We can see that unconventional wells are once again in the driver’s seat for Pennsylvania’s waste stream, accounting for 98.6% of the state’s liquid waste by volume and 99.8% of the solid waste by mass.  This certainly makes sense, given the immense scale of the unconventional operations, as discussed above.  Additionally, most of the new drilling activity is unconventional, and one would expect increased waste streams with newer wells, including higher volumes of waste fluids to accompany the higher production levels, as well as the presence of drill cuttings.  

Because of these variables, it’s worth taking the per well values on Table 2 with a splash of brine, especially on the solids side —older wells won’t contribute any drill cuttings, for example.  But the mean values still give a sense of the differing scales of conventional and unconventional wells.  Conventional wells average 42.9 barrels of liquid waste and 0.1 tons of solid waste per year, while their unconventional counterparts average 5,587 barrels and 64.3 tons

Nonreporting Conventional Wells

Another eye-opening item on Table 2 is that it only includes data from 23,662 conventional wells.  As a point of comparison, the production report from the same time period and subset includes data from 79,836 wells, or almost 3.4 times as many.  This situation is worth a closer look.

CategoryProduction Report – All WellsProduction Report – Wells Reporting ProductionWaste Report – All WellsWaste Report – Wells Reporting WasteDifference (P-W: All Wells)Difference (P-W: Reporting Production or Waste)
Conventional79,83671,74323,66223,19856,17448,545
Unconventional13,69112,70912,81612,801875-92
All Wells93,52784,45236,47835,99957,04948,453
Table 3: Counts of wells appearing on the Pennsylvania production and waste reports for 2025. Production data was downloaded from DEP on March 21, 2026 and waste data was downloaded on June 16, 2026. Well counts are determined by the number of unique API permit numbers present on aggregated reports for the calendar year.

While there were 56,174 fewer conventional wells listed on the waste report than were on the production report for 2025, a little more nuance is merited here.  Operators sometimes have reasons for not producing (it could be shut-in, an injection well, etc.), so it is also worth looking at the number of wells that report any non-zero values on these reports.  There are still about 3.1 times as many conventional wells on the production report than the waste report for this variable, for an overall difference of 48,545 wells.

Note that this waste reporting phenomenon does not seem to be an issue with unconventional wells.  Our data actually show 92 more wells on the unconventional waste reports than on the production reports in instances where non-zero values are counted.  This is likely explained by the fact that the download date of our waste data is almost three months after when the production data was obtained, and DEP does accommodate stragglers in these reports.  

To our mind, the sharp contrast between the percentage of conventional and unconventional wells that submit data to the waste reports requires some sort of explanation.  In fact, O&G wells are known to frequently “water out,” a phenomenon where the ratio of waste fluids to hydrocarbons increases over time.  Authors of a 2024 publication on the topic looked at data from more than 153,000 wells in 18 different plays.  This didn’t include data from Pennsylvania, however, noting:

Because of apparent widespread irregularities with water production data from Pennsylvania, we did not include the Marcellus Formation in our analyses.

Conventional operators not reporting data to DEP is not a new problem.  In late 2022, DEP released a report detailing some of the compliance issues with operators of conventional wells, specifically calling out failures to submit reports for waste as one of the common themes.  

Over the past five years, DEP’s OOGM has identified significant non-compliance with laws and regulations in the conventional oil and gas industry, particularly regarding improper abandonment of oil and gas wells, as well as reporting requirements for hydrocarbon and waste production and mechanical integrity assessments 

Governor’s Lapsing Statement Report, December 29, 2022

However, on Table 3 (page 8) of that report which shows the top violations for conventional wells between 2017 and 2021, you can see that there were 1,827 administrative violations issued for failure to report annual production or status reports, and 722 more were issued a similar violation with slightly different wording, most likely representing an adjustment to the phrasing over the five-year period.  However, we don’t see the lack of waste reporting on this top 10 list.

It turns out that there is a good reason for this.  While operators need to report production or explain their lack of reporting, the same is not true of waste reporting.  When I asked about the tens of thousands of fewer wells on the waste report in an email correspondence, DEP Mineral Resources Program Specialist Paul Howard explained the discrepancy:

A comment is required when production is not reported, but a comment is not required when only production is reported and no waste. To identify a violation, there would need to be some other indication that waste was generated but not reported.

Paul Howard, Mineral Resources Program Specialist, Pennsylvania DEP

So while not reporting production or explaining non-production with a comment is a violation, the same is not true of waste.  Without applying the same reporting standard in an industry where non-compliance is already rampant, it seems like DEP would need to be extraordinarily lucky to stumble across these “other indications” of unreported waste generation.  

Brine Spreading

One way DEP might be able to find omissions in waste reporting is by taking a closer look at waste disposal methods, particularly brine spreading.  In 2024 testimony before the Pennsylvania House Environmental Resources & Energy Committee, DEP explained that the department used to allow the practice of spreading oil and gas liquid waste on roadways for dust suppression and de-icing, but banned the practice for waste from unconventional wells in 2016. With respect to waste from conventional wells, the picture is less clear. DEP has supported a statutory ban of road-spreading brine from conventional wells and claims it will not authorize the practice in the face of concerns that contaminants will reach the waters of the Commonwealth. Whether the practice is actually illegal, however, remains untested.

In DEP’s discussion of the issue, the language reads as both clunky and purposeful.  For example, in the opening paragraph, the testimony reads: 

As noted below, road spreading of brine is currently not an authorized practice in Pennsylvania and DEP has the authority to take enforcement action in instances where it becomes aware of spreading that violates the laws or regulations that DEP implements.

Pennsylvania DEP testimony, House Environmental Resources & Energy Committee, 2024

A non-authorized practice is not the same as a banned practice. There may be no legal mechanism by which DEP will authorize brine spreading, but that does not mean that DEP considers the practice to be illegal. Other than the proximity of the words, there is no actual indication that the enforcement actions for violations actually apply in this situation.

A bit later, the testimony states:

In 2017, the DEP discontinued the practice of authorizing brine use for dust suppression purposes under the guidance document. Since that time, the DEP has not authorized the use of brine as a dust suppressant under the 1998 guidance document or the Commonwealth’s Oil and Gas Act. 

Pennsylvania DEP testimony, House Environmental Resources & Energy Committee, 2024

Once again, we have very specific language where the Department asserts that it “discontinued the practice of authorizing” the use of this waste, but here, it mentions only dust suppression, and omits any reference to brine spreading for deicing purposes.

Also discussed is the issue of coproduct determination, which is essentially a process that would indicate that an apparent waste product is no longer considered to be waste:

A coproduct determination, which shall be made in accordance with § 287.8 (relating to coproduct determinations), only applies to materials that will be applied to the land or used to produce products that are applied to the land….A material meeting these requirements does not require a waste permit for the use of the material, but the laws and regulations regarding the protection of water quality still apply to its use.

Pennsylvania DEP testimony, House Environmental Resources & Energy Committee, 2024

This could be interpreted as a sizable loophole in the waste reporting requirements. Would a determination that brine is a coproduct (and therefore not a waste product at all) apply retroactively to the point of production, exempting the operators of 48,545 conventional wells from reporting their waste totals, so long as it was used in such a manner?

Interestingly, the testimony goes on to state that DEP reached out to each of the 26 operators who reported disposing of waste via brine spreading on Pennsylvania roads in 2021.  Two of these said that brine spreading was reported in error, 13 said that they would stop the practice, “Two operators responded with information that did not constitute a valid coproduct determination,” and nine more simply didn’t reply.  

In 2026, despite DEP’s testimony of “discontinued the practice of authorizing” brine spreading, we hear continued reports of the ongoing use of the practice. Perhaps the real lesson learned by operators was simply not to report such usage, so as not to be hassled by the Department. 

Destination and Disposal

Oil and gas development generates both liquid and solid wastes that must ultimately be reused, processed or disposed of. Liquid waste such as produced water may be reused in the development or hydraulic fracturing of other wells, sent to facilities for processing or treatment, or disposed of in underground injection wells. Solid wastes, including drilling wastes, may be sent to processing or permitted disposal facilities such as landfills. The waste reports are intended to track these movements from the well where the waste was generated to the destination and management method reported by the operator.  

Disposal MethodLiquids (Bbl)Solids (Tons)
Centralized Waste Treatment Facility (NPDES Discharge)18,8730
Centralized Treatment Plant (for Recycling)909,49819
Injection Disposal Well4,479,5836,388
Landfill137697,590
On-Site Encapsulation2
On-Site Pit123
Public Sewage Treatment Plant207,698909
Residual Waste Processing Facility22,782,03181,160
Residual Waste Transfer Facility1,5394,455
Reuse (at Well Pad)31,024,14521,846
Reuse at a Conventional Well Site in Pennsylvania126,502
Reuse at a Well Pad Outside Pennsylvania2,819,0982,496
Reuse Other than Road Spreading22,505135
Road Spreading285
Storage Pending Disposal or Reuse7,753,1409,817
Surface Impoundment2,470,206393
Total Result72,615,367825,209
Table 4: Oil and gas waste disposal methods as reported by Pennsylvania operators in 2025. Based on data downloaded from Pennsylvania DEP on June 16, 2026.

As established above in the Nonreporting Conventional Wells section, missing data is a part of the story.  Acknowledging that, this section is focused on what is actually disclosed by the various operators, who reported sending the waste from Pennsylvania’s O&G wells to 532 destinations in seven states. 

Some of these destinations are not a single location.  For example, 126,387 barrels of waste was sent to a destination entitled, “Conventional wells report does not require reuse location,” noting another distinction between conventional and unconventional waste requirements. Destination descriptions for waste sent to out of state wells for the purpose of reuse are similarly vague, such as the 27,498 barrels destined for “Reuse at Ohio well pad” or the 346 barrels sent for “Reuse at Montana well pad.”  

The report also can’t answer why an operator called “Loan Asset Issuer LLC Series 2021 NG-1” would choose to send a couple of tanker trucks worth of produced fluid from a well called “Consol WFN6HHS” in West Finley Township, Washington County more than 1,500 miles for reuse at a Montana well pad.  We just know that it happened, according to the operator’s disclosure.

Uncovering every curiosity in the waste reports would be like describing every piece of hay in a haystack, so at some point, it’s useful to step back and look at the overall trends.  For this, we invite you to take a look at the waste map linked above, which includes aggregated solid and liquid waste totals for receiving facilities that we were able to map.  This was quite a process as well, because there are three different ways that the operators can indicate the location of the receiving location, and even so, there are widespread reliability issues.  

For example, there are data columns for well pad latitude and longitude for when operators reuse the waste at a different well pad, but instead they often put the location of the well pad that the waste originated from.  There is a different set of coordinates for other waste facilities, or they can use addresses.  Sometimes, the addresses are clearly corporate offices, and sometimes, none of these are filled out.  Because of this, we cross-referenced with other sources, including DEP’s well pad and waste facilities reports, and double checking these using Google Maps for plausibility.  For the aggregated sites such as “Reuse at Ohio well pad,” we simply had to pick a location.  

Because of this confusion, we have categorized these receiving facilities based on our overall confidence of the location’s accuracy, with purple square icons indicating high confidence, where we believe we have the correct facility location, brown showing medium confidence, where location accuracy issues are thought to be at the county level or less or else some inconsistencies were noted, such as the use of well pad ID numbers that weren’t found on the well pad report, and red showing low confidence, with location uncertainty greater than the county level.  That said, our tools for making these assessments are imperfect, so if you would notice any errors, we would very much appreciate your feedback.

Another way to understand the flow of waste is to visualize them through Sankey charts.  Here, we have separate charts for waste reported in tons and barrels.  Within each one, we include all of the specific waste types that contribute to the total, the states that the waste was sent to, as well as the disposal method.

Figure 1: Chart showing waste type, receiving destination, and disposal method of solid waste generated in Pennsylvania in 2025. Waste data for this chart was downloaded from Pennsylvania DEP on June 16, 2026.

Mousing over any part of this chart gives more information about what we are seeing. On the left half of the map, the proportional-width strands are color coded to indicate the state they they are destined for, with waste staying in Pennsylvania shown in blue, Ohio-bound waste in orange, and waste headed for sites in West Virginia in green, with other locations shown in grey.  On the right side, the strands reorganize to indicate the disposal method indicated by the operators.

On the top left, we see that drill cuttings are the real driver of solid waste, accounting for about 707,000 out of 825,000 tons, almost 86% of the total.  Of this, about 589,000 tons (83%) stayed in Pennsylvania, with around 114,000 tons (16%) headed to Ohio and 3,700 tons (0.5%) to West Virginia.  These proportions vary by the specific category.  For example, the Mountain State does take larger proportions of produced fluids that were reported in tons, accepting around 15,000 tons of almost 55,000 tons (28%) in that category.

Let’s take a look at the flow of the liquid waste.

Figure 2: Chart showing waste type, receiving destination, and disposal method of liquid waste generated in Pennsylvania in 2025. Waste data for this chart was downloaded from Pennsylvania DEP on June 16, 2026.

Operators reported nearly 70.3 million barrels of produced water, representing almost 97% of all waste reported in barrels.  About 63.3 million barrels of the produced water stayed in-state, or about 90%.  For all liquid waste, 65.4 out of 72.6 million barrels stayed in the Keystone State, also about 90% of that total.

If we take disposal methods into account, we can see some more nuance.  For example, a little under 4.5 million barrels (6%) of all liquid waste is reported going to injection wells for disposal.  However, Pennsylvania does not have very many injection wells compared to our neighbors, so in this subcategory, Ohio actually accepts three times the amount of waste as Pennsylvania does, with around 3.4 million barrels going to the Buckeye State compared to 1.1 million barrels staying in Pennsylvania, as was recently pointed out in the New York Times using FracTracker analysis.  Less than 4,200 barrels (0.09%) was sent to West Virginia’s injection wells, and about 17,000 barrels were sent to an injection well where the state was not indicated.  Some further research on that last item shows that the injection well in question, CNR East Warrent 3131 T10, is an enhanced oil recovery injection well operated by Pennhills Resources in McKean County, Pennsylvania.

It is important to note that we don’t have comparable data from other states to quantify the amount of waste that might be headed to Pennsylvania, as Ohio and West Virginia do not have waste reports with the destination data that the Pennsylvania report provides.  The general assumption is that since Pennsylvania is the largest producer of the three states with almost 7.7 trillion cubic feet (Tcf) of gas compared to 3.6 Tcf in West Virginia and 2.1 Tcf in Ohio, that it generates more waste and furthermore, it would seem plausible that the net flow of the subset of waste that crosses state lines travels from Pennsylvania to its neighbors.  Without data showing the destination of Ohio and West Virginia, however, that remains little more than a hunch.

Another thing to point out is that some of the disposal methods don’t really seem like endpoints in the story of the waste, but it is where we lose track of it from these oil and gas waste reports.  For example, 7.75 million barrels of liquids are sent to “storage pending disposal or reuse.”  That amounts to almost 11% of the total volume of liquid waste, and almost 3.3 million barrels more than waste sent to injection wells.  Almost 2.5 million barrels, more than 3% of the total, were sent to surface impoundments, but it seems unlikely that the waste would remain there in perpetuity.  And while residual waste processing facilities sounds like a reasonable destination for the 22.8 million barrels (31%) of liquid waste and 81,000 tons (10%) of solid waste, these facilities have their own waste streams and impacts, and while the overall contaminant load may originate from oil and gas wells, from the point of view of DEP’s O&G waste report, it is a sort of black hole.  Once the waste trucks pass the gates of these facilities (or the “event horizon” in our metaphor), we lose track of it forever as oil and gas waste.  For that matter, even the 698,000 tons of solid waste sent to landfills isn’t quite an endpoint, either, as some of the contaminants including radioactive materials and heavy metals percolate through the landfill to produce leachate every time it rains, presenting yet another waste mitigation conundrum.  

What Contaminants are in the Waste?  

Oil and gas waste often contains radioactive, carcinogenic and other highly hazardous materials at levels far exceeding guidelines for human safety. Yet, thanks to an industry loophole, Pennsylvania O&G waste is defined as a kind of residual waste, which is supposed to represent nonhazardous industrial waste. The nonhazardous status traces back to the 1980 Bentsen Amendment to the Resource Conservation and Recovery Act (RCRA), which exempted oil and gas waste from Subtitle C, the portion of RCRA that regulates hazardous waste. While New York has taken action to close this loophole in their state law and allow hazardous waste standards to be applied to O&G waste streams, Pennsylvania has not.

Of course, just because the waste is defined residual and not hazardous waste doesn’t mean that the waste is safe to be around.  Pennsylvania, to its credit, “requires residual waste generators to submit information annually to the Department, for every waste stream they produce.”  This is achieved through the submission of Form 26R, a form that requires detailed chemical analysis of waste every five years. The rules for this disclosure are as follows:

  • Generators of all residual waste streams, including O&G operators, are required to complete Form 26R for each waste stream to the facility where the waste is processed or disposed
  • This must be accompanied by a detailed chemical analysis for each waste stream.  The law states three different frequencies of this auxiliary report
    • Annual is the default standard
    • Operators can declare that the chemical analysis remains approximately the same and test every five years instead
    • The chemical analysis waiver can be extended beyond the five-year window for certain categories of waste

The generator is required to submit a copy of Form 26R for each waste stream to the solid waste management facility where the waste is sent for processing or disposal. After initial submission of a detailed chemical analysis for a waste stream, the waste generator may select to certify annually by providing sufficient documentation that the chemical and physical characteristics of the waste and the processes by which the waste was generated have not changed from the previous year submission, in lieu of annually performing the chemical analysis. The waste will have to be fully characterized every five (5) years even if no changes in the process generating the waste or the characteristics in the waste have occurred. For the categories of residual wastes that are covered in Section D of Form U, the chemical analysis waiver can be extended beyond the five-year period as long as there are no changes in the manufacturing process or ingredients that may result in changes to the waste characterization or chemical composition of the waste.

While oil and gas operators have been required to submit this form, the information has not been broadly available to the public until a recent concerted effort by Earthjustice, Ohio Valley Allies, WildEarth Guardians and FracTracker. On behalf of Ohio Valley Allies, Earthjustice submitted a Right-to-Know Law request for all O&G 26R reports since 2015 for unconventional wells, a massive amount of previously hard to access data about the chemical composition of PA’s oil and gas waste. Since many of these reports had not been digitized, Jill Hunkler of Ohio Valley Allies, Melissa Troutman of WildEarth Guardians, and others went to great lengths and spent several days scanning roughly 400,000 pages. Gary Allison, a consultant for FracTracker, subsequently assembled and began a preliminary analysis of the released Form 26R reports. This collaborative effort supplied key data for a recent New York Times investigation, which found that four injection wells near Marietta, Ohio, accepted wastewater from Pennsylvania fracking sites reporting median radium-226 levels 428 to 1,800 times EPA’s drinking-water standard. 

At the same time, FracTracker’s review of these released 26R reports suggests that these 400,000 pages didn’t contain every chemical analysis that would be expected under the five-year reporting schedule. Section D of Form U allows the chemical-analysis waiver to be extended for certain categories of residual waste, but it does not clearly state whether oil and gas waste qualifies for such an extension. It therefore remains unclear whether the apparent gaps reflect DEP not producing every responsive record, operators failing to file required reports, or the use of extended waivers and other interpretations of the reporting requirements. Despite these limitations, the 26R reports contain chemical analyses that document very high concentrations of hazardous contaminants in some oil and gas waste streams.  

Below are two examples of these chemical analysis reports, one for drill cuttings and the other for wastewater.  

Page 17 of the Eurofins laboratory analysis for Alexander BRA pad drill cuttings, showing 1,2,4-Trimethylbenzene at 22.1 mg/Kg.
Figure 3: Form 26R and Eurofins laboratory analysis for drill cuttings from the Alexander Bra Pad, Bradford County. The 26R report lists 3,156.79 tons of drill cuttings sent to five facilities in three states; the Client Sample Results begin on PDF page 17. View the full report (PDF).

This document starts with the 26R report.  In Section A on the first page, we can see that this waste sample is from the Alexander Bra Pad, a well operated by Chesapeake in Bradford County.  In Section B, we can see that the operator is reporting 3,156.79 tons of drill cuttings.  In Section C on pages 2-3, we can see that portions of this waste were sent to Alliance Landfill in Lackawana County, Phoenix Resources in Tioga County, Casella in Chemung County, New York, Tunnel Hill Reclamation in Perry County, Ohio, and NTSWA Landfill #2 in Bradford County.  

It’s a long document, so we are going to skip all the way down to the Client Sample Results section showing the chemical analysis performed by Eurofins TestAmerica, which is on PDF pages 17-20, or pages 13-16 of the lab report itself.  This lab formats non-detected analytes in black text and with an “ND” in the results column.  Analytes at detectable limits are shown in blue, with the Result being paired with the item in the Unit column.  The first one that we come across is 1,2,4-Trimethylbenzene, which is present at 22.1 milligrams per kilogram (mg/kg, and the next detected analyte is Ethylbenzene, at 3.3 mg/kg.  

If you are not a chemist and would like to understand more about the nature of these chemicals, you can look many of them up on the Open-FF Chemical Hazard Aggregator.  Gary Allison, Open-FF Founder and FracTracker Consultant, designed this tool to describe the relative hazards of chemicals that were reported as components of the injection fluid to FracFocus, the industry’s chemical disclosure registry that is required by many states, including Pennsylvania.  For that trimethylbenzene isomer, for example, we can see that PubChem gives the following warnings:

Figure 4: PubChem warnings about the impacts of 1,2,4-Trimethylbenzene. Aggregated by Open-FF, including that the substance is potentially fatal if swallowed or inhaled.

Further down, we see that the sample also contains 82,200 mg/Kg of diesel range organics and 40.9 milligrams per liter (mg/L) of strontium, another chemical tied to significant health concerns.  EPA considers strontium levels under 4 mg/L to be safe for consumption throughout one’s lifetime (see page 17).

No radiological analyses were performed on this drill cuttings sample, so let’s pivot to the wastewater sample, where such tests were conducted.

Page 17 of the Eurofins laboratory analysis, listing chloride at 117,000 mg/L, barium at 16,100 mg/L, calcium at 54,500 mg/L and strontium at 5,580 mg/L.
Figure 5: Eurofins laboratory analysis of wastewater from the DGSM Bra well pad, Bradford County. Page 17 of 38 is shown: chloride at 117,000 mg/L, barium at 16,100 mg/L, calcium at 54,500 mg/L and strontium at 5,580 mg/L. View the full report (PDF).

As with the drill cuttings sample, this analysis was conducted by Eurofins for a Chesapeake well.  In this case, we don’t have the associated 26R report, but there is a chain of custody form on page 35 that indicates this sample is associated with the DGSM Bra well pad, another well pad in Bradford County.  The Client Sample Results are on pages 17-18, and include a contaminant profile that is different from the drill cuttings sample, including:

  • Chlorides – 117,000 mg/L.  For reference, sea water typically has chlorides around 19,000 mg/L, making this sample six times saltier.
  • Strontium – 5,580 mg/L.  This is 1,395 times the lifetime standard of 4 mg/L, mentioned above
  • Barium – 16,100 mg/L.  This is 8,050 times the legal limit for drinking water
  • Calcium – 54,500 mg/L.  The US Geological Survey considers hard water to be 121 mg/L or above of combined calcium and magnesium.  Magnesium was a non-detect (based on a 10,000 mg/L reporting limit), but the calcium values certainly explain why operators inject anti-scaling agents downhole, as that is enough to gum up any pipe.
  • Radium-226 – 8,570 picocuries per liter (pCi/L) – Radium is a dangerous radioactive element.  This isotope decays into Radon-222 by ejecting an alpha particle. 
  • Radium-228 – 1,320 pCi/L.  Another dangerous radium isotope.  The legal drinking water limit for the two combined isotopes of radium is 5 pCi/L (see page 17), making this sample 1,978 times this amount.  

Browsing through the reports, note that this is just a sampling of the chemicals of interest.  Even though we are just looking at a few examples of the 26R reports and their associated lab reports, we can already see that there are enormous waste quantities with highly concentrated contaminant loads being sent to locations throughout Pennsylvania and neighboring states.  In that first document, we see drill cuttings sent from one well pad to five destinations in three different states.  In the second, the 26R report became disassociated, but the lab report shows us chemicals of concern in very high quantities that have the potential to impact neighbors and the environment of the sites where this waste is brought to the surface, handled, transferred, and disposed of.   

Conclusion

The Pennsylvania DEP’s oil and gas waste report provides quite a bit of insight into the waste streams created by the nation’s second largest gas producer.  We know that operators of the state’s oil and gas waste wells reported around 72.6 million barrels of liquid waste and 825,000 tons of solid waste.  We know the state’s unconventional wells, despite representing less than 15% of the total wells, account for nearly 99% of liquids and almost 100% of solid waste on the report.  We know that about 97% of all liquid waste is categorized as produced fluids, which in recent years includes both brine and flowback fluids.  Similarly, almost 86% of solid waste on the report is drill cuttings.  We know that while some of the waste is sent as far away as Montana or Arkansas, over 90% of the liquids and 81% of the solids on the report stay in-state.  

We also know a significant amount about what’s in the waste, making it clear that this waste can pose a serious threat to public health. Our review of the laboratory reports submitted as part of 26R forms document some waste streams containing striking concentrations of chloride, barium, strontium, petroleum compounds, and radioactive radium. One wastewater sample, for example, contained a combined 9,890 picocuries per liter of radium-226 and radium-228—nearly 2,000 times EPA’s drinking-water limit. 

And yet, digging through the data to find these answers have created just as many questions.  We don’t know why there are 48,545 wells that report some amount of oil and gas production but zero waste generation.  Despite reports of it occurring, we can’t quantify the practice of road spreading brine for dust suppression or de-icing on Pennsylvania roads.  We don’t know the volumes of waste coming into Pennsylvania from neighboring states, or why a Pennsylvania operator would pay to have several tanker trucks worth of drilling waste shipped all the way to Montana.  We don’t know the exact location of some of the receiving facilities, nor do we know what happens to much of the waste beyond some of the temporary arrangements designated on the report.  We also don’t have chemical lab analyses for all of the wells

As a reminder, around 1 in 4 Pennsylvanians rely on private well water for their drinking source.  The facilities that extract, store, and process this waste can’t remove the contaminant load with a flick of the wrist, and there really isn’t a great place for any of it, short of keeping it in situ.  Many of the residents that bring up concerns about pollution from O&G waste are worried about contamination of their water supplies and the potential for permanent health effects.  If we return to that imagery of two Empire State Buildings worth of solid waste, and of watching the water flow over Niagara Falls for 67 minutes, we do so with the knowledge that this waste created in Pennsylvania every year is anything but benign.  And while RCRA and DEP may sanitize the language by categorizing this waste “residual” instead of “hazardous”, that does nothing to sanitize the water itself.

Stay informedFracTracker Newsletter
Support our work

FracTracker Alliance helps communicate the risks of oil and gas and petrochemical development to advance just energy alternatives that protect public health, natural resources, and the climate.

By contributing to FracTracker, you are helping to make tangible changes, such as decreasing the number of oil and gas wells in the US, protecting the public from toxic and radioactive chemicals, and stopping petrochemical expansion into vulnerable communities.

Your donations help fund the sourcing and analysis of new data so that we can keep you informed and continually update our resources.

Please donate to FracTracker today as a way to advocate for clean water, clean air, and healthy communities.

Donate now
Pennsylvania 2025 Oil & Gas Production Report: Record Gas, Low-Producing Wells, and Long-Term Liabilities

Pennsylvania produced more than 7.8 trillion cubic feet of gas in 2025, with unconventional wells accounting for over 99% of the total. This analysis examines statewide production trends, declining well output, regional differences, and the large number of conventional wells reporting little or no production.

Aerial view of red brine haulers traveling on rural roads near homes in Moundsville, West Virginia.

PA DEP Approves Unusual “Mineral Brine” Well in Erie County, Raising Concerns About New Regulatory Loophole

Media Advisory: PA DEP Approves Unusual “Mineral Brine” Well in Erie County, Raising Concerns About New Regulatory Loophole. FracTracker appeals permit, citing unresolved questions about testing and sale of highly saline subsurface water that can contain radium, metals, and other contaminants

Campaign Update: Progress on FracTracker’s Community Air Monitoring Projects

New updates from FracTracker’s community air monitoring initiatives, including sensor deployments, air sampling, and ongoing work with frontline communities in the Ohio River Valley.

From Coal Plant to AI Campus: FracTracker Documents Construction at Homer City

FracTracker documented early construction and demolition activity at the former Homer City coal plant, now being redeveloped into a fracked gas-powered AI and high-performance computing campus in Indiana County, Pennsylvania.