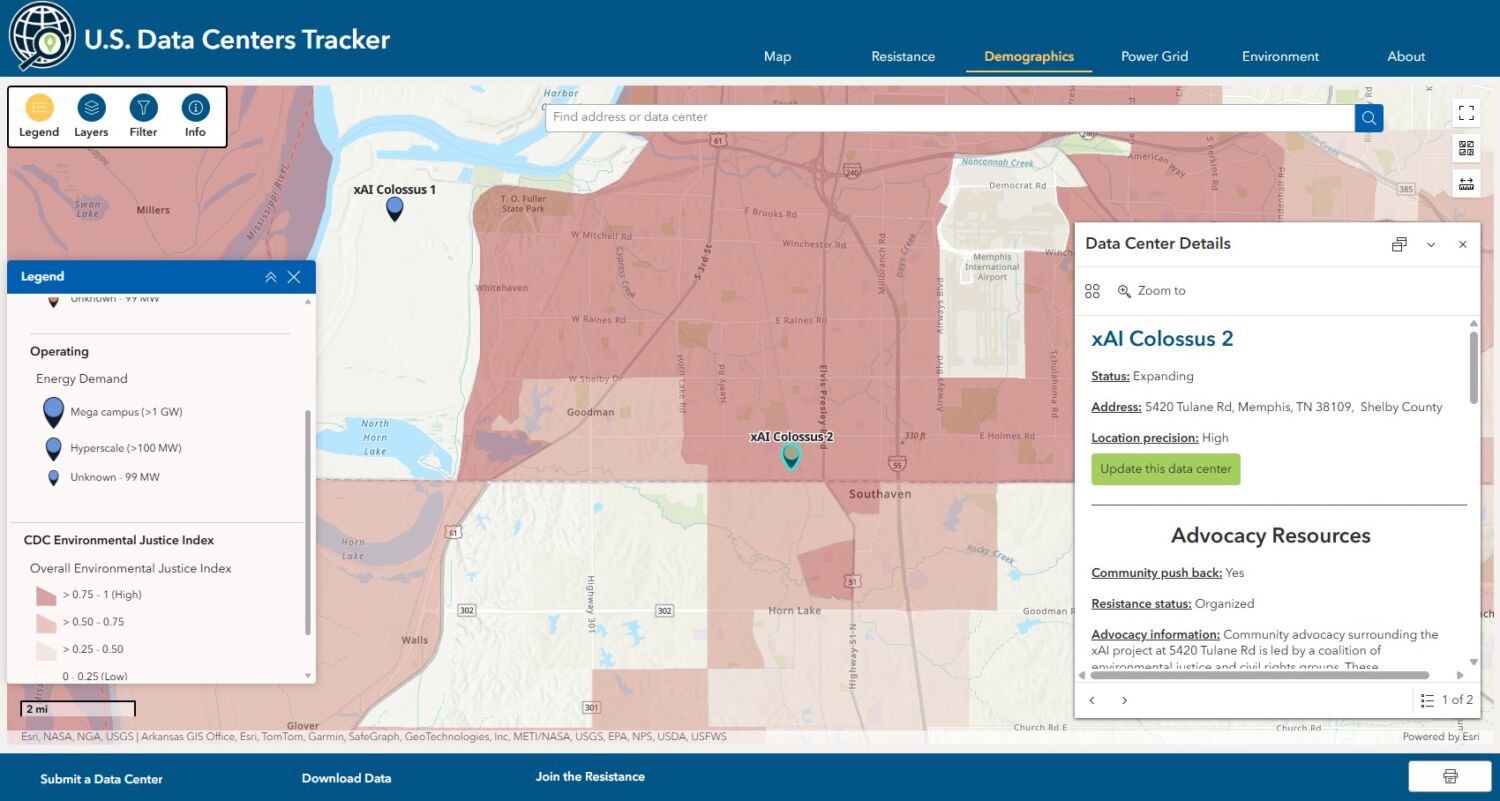
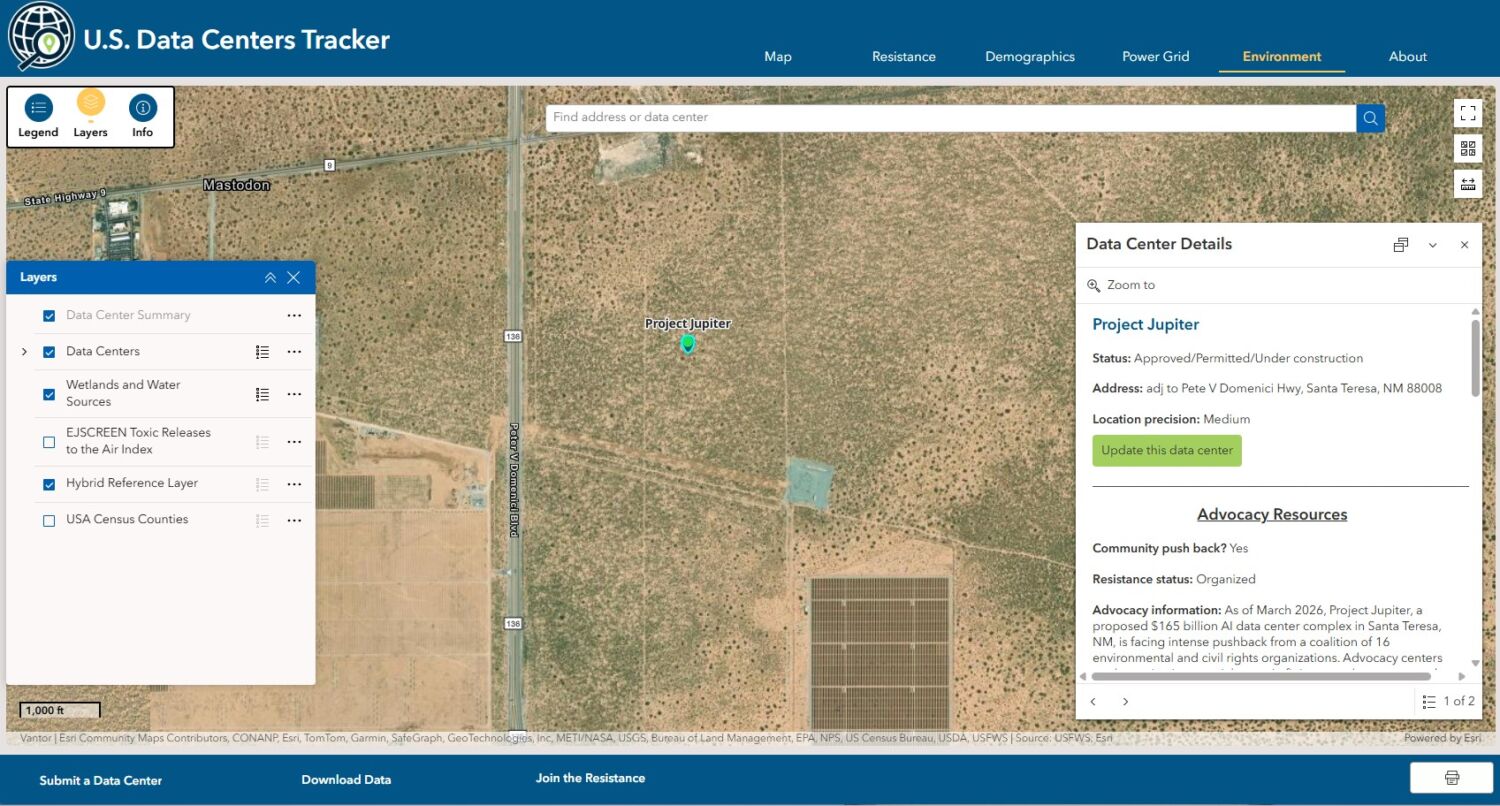
The dashboard builds on our continuously updated national data center map by integrating additional context on dedicated tabs including advocacy details, demographics, environmental justice designations, tribal lands, chronic disease rates, the surrounding energy landscape (such as power plants and balancing authorities), and environmental factors like air quality and water resources.

Key Findings
Of the 1,400+ sites included in the tracker, we are tracking 803 projects in the pre-development or construction process, highlighting an ongoing window in which permitting processes, regulatory decisions, and community engagement can still influence development outcomes.
Analysis of advocacy efforts shows that public resistance to data centers is widespread and growing, interventions employ a wide variety of strategies, and efforts are starting to achieve success.
Why Track Data Centers?
Since mid-2025, data center proposals have been popping up across the country at lightning speed. A hyperscale data center is defined by industry as a facility with at least 5,000 computer servers, 10,000 square feet of physical space, and an electric power rating (energy demand or power load) of at least 100 megawatts (MW).
Data center development is increasingly tied to broader public health, environmental, and energy concerns. Since the electricity demands of data centers are so high, these facilities have the potential to perpetuate the operations of legacy polluters, strain local power grids, and drive new fossil fuel infrastructure projects like fracked wells and power plants. This increase in fossil fuel activity means that data centers indirectly contribute to increased greenhouse gas and pollutant emissions that harm public health and our climate. Data centers can also create direct harmful pollution onsite by utilizing diesel generators for backup power, create noise and light pollution, and consume enormous amounts of water for equipment cooling.
Economically, hyperscale data centers harm local communities by increasing utility bills for everyday ratepayers, consuming tax dollars that could be better allocated to community needs, and failing to deliver on economic promises like job creation. A data center employs an average of 27 people once it is operational, which is a very small trade off considering the billions of dollars in subsidies that these facilities are receiving. Many of the jobs actually supported by data center development are indirect jobs linked to the fossil fuel industry, which impose high risks on its employees. For example, truck drivers that haul fracking waste are exposed to unregulated hazardous waste that can lead to cancer and other health problems.
In July 2025, FracTracker Alliance released the first iteration of our National Data Centers Tracker, which built on prior work tracking cryptocurrency operations. Our tracker is the first open-access, facility-level dataset and interactive mapping tool that documents the rapid buildout of AI and data center infrastructure across the United States. It can be downloaded, shared, and used by anyone for non-commercial purposes (please see our terms of service). This transparency is essential for accountability and advocacy. Data center expansion is outpacing both regulation and public awareness, and has often bypassed meaningful public input. Without transparent, facility-level information, communities cannot effectively advocate for local protections and researchers and decision makers cannot assess the potential impacts of existing and proposed data centers.
We have been updating the tracker daily and crowdsourcing data to gather information from advocates and other interested parties. Each announcement prompts a mini-research project to gather key information. Our online documentation presents a history of relevant news and developments as we follow each proposal through different stages of development. We focus on proposed sites and projects under construction, and we are working to incorporate smaller data centers already in operation.
What’s New
The National Data Centers Tracker is now set up as a dashboard with dedicated tabs. Each tab has data layers that can be toggled on and off using the left layer menu.
Map Tab
Map Tab
This section shows the same data as our original map, with notable expansions.
- Critical information is maintained such as address and geographic coordinates (latitude and longitude), the name of the operating company and/or tenant, reported energy demand in megawatts (MW), estimated square footage and acreage of the facilities, power sourcing (dedicated power plants of various types or grid-connected), and cooling method and type (air, water, closed loop, open loop, etc).
- Data center pins are colored according to status including:
- Proposed – Anything planned, announced, in permitting, or awaiting approval.
- Approved/Permitted/Under Construction – Actively being built, site prep underway, or construction start date confirmed.
- Expanding – Existing data center or related computing center that is scaling up operations.
- Operating – Fully built and operational.
- Suspended – Temporarily halted, on hold, or delayed without being cancelled, including projects that the developer plans to continue pursuing despite being blocked from one location.
- Cancelled – Plans dropped, defeated, denied, rescinded, rejected, or explicitly blocked by authorities/community.
- Data center pins varied by size depending on the MW power demand of the facility:
- Small pins – 0-99 MW
- Medium pins – 100-1,000 MW (hyperscale)
- Large pins – 1 gigawatt (GW) + (mega campus)
- *NEW* We’ve expanded our filters to include state, county, status, and hyperscale size (100+ MW).
- *NEW* In the right column you can quickly see the total number of projects, MW, and square footage for different categories of data centers. These totals update depending on zoom level and filter selection, and not all data centers have MW or square footage estimates to contribute to these totals.
- *NEW* Use the search bar at the top of the map to quickly find a location or data center of interest.
- *NEW* Advocacy-focused fields are now available in the map pop-ups including petitions, community group webpages, site fight leaders, opportunities for public engagement, and examples of community victories, making it easier for residents to connect with local efforts.
- *NEW* We are beginning to track whether local governments and officials have signed nondisclosure agreements (NDAs) associated with data center proposals, if there is planned backup generator use, and whether the data center will be co-located with a behind-the-meter dedicated power plant.
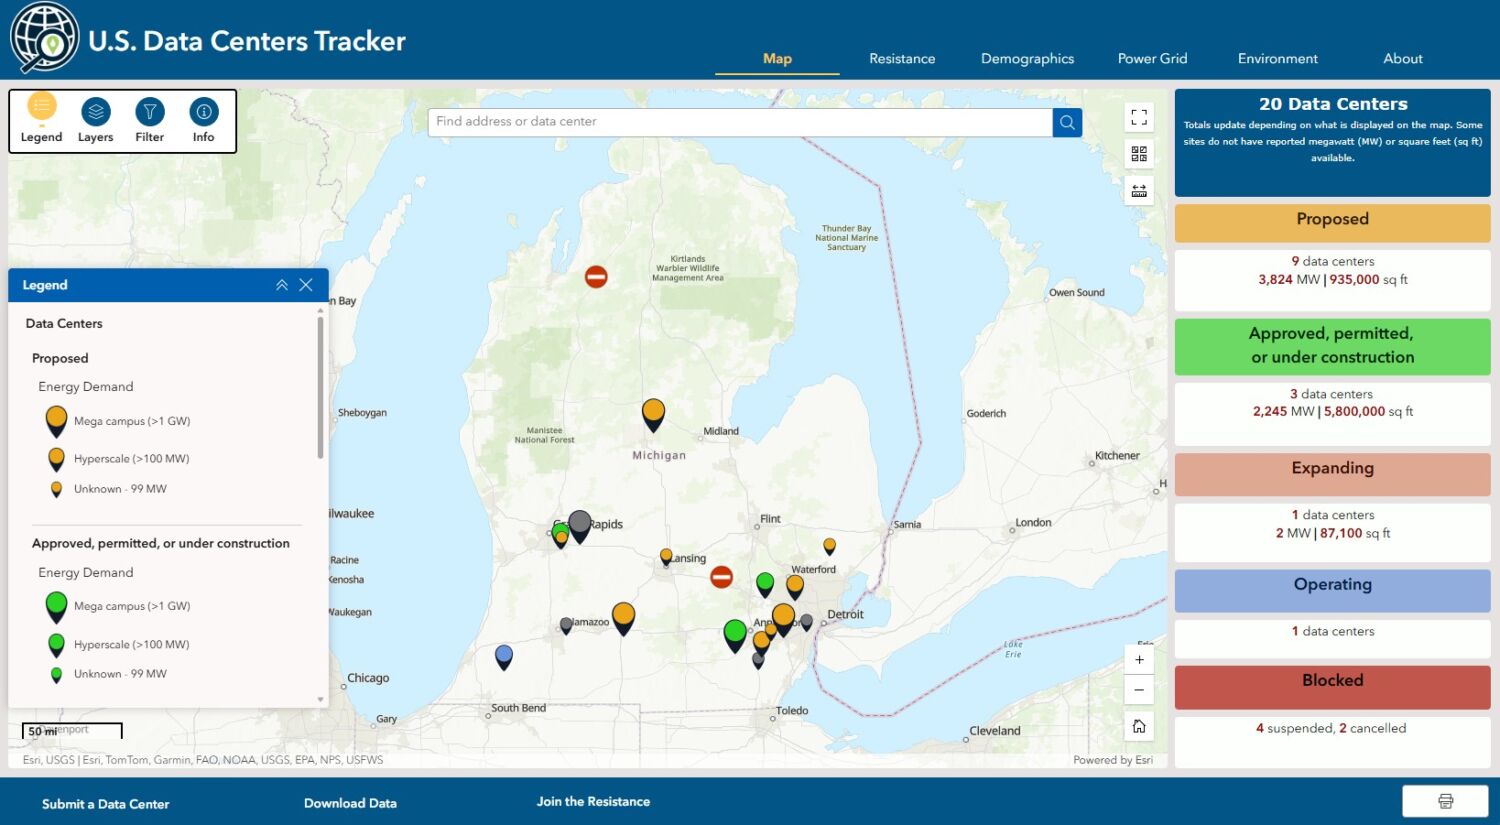
Data centers are visualized according to size and status.
Looking at the data, we’ve started to see general trends emerge. Looking at siting patterns, we found that Alaska, Rhode Island, and Vermont are the only states in the U.S. that do not currently have data centers or data center proposals. Virginia has emerged as the dominant hub by a large margin (452), followed by Georgia (174), Texas (167), and Pennsylvania (92). Across these leading states, a substantial portion of projects remain in early stages of development. Virginia alone has 215 proposed sites, while Texas, Georgia, and Pennsylvania report 75, 69, and 41 proposed projects, respectively.
Northern Virginia has the highest density of wide-area fiber optic networking in the world, connecting it to all major U.S. markets. Loudoun County, VA (nicknamed “Data Center Alley”) is the epicenter, with more than half of global internet traffic created or passing through this area. Georgia, especially Atlanta, has become a data center hotspot in part due to generous subsidies and incentives, such as tax breaks, offered to attract developers. Texas and Pennsylvania lead the country in fracked gas production. New fracked gas infrastructure goes hand in hand with many data center proposals in these regions.
Table 1. Data Center Prevalence by State
Last updated 3/26/2026
| State | Total | Proposed | Approved/Permitted/ Under construction | Expanding | Operating | Suspended | Cancelled |
| Virginia | 452 | 215 | 11 | 33 | 181 | 7 | 5 |
| Georgia | 174 | 69 | 11 | 1 | 86 | 5 | 2 |
| Texas | 167 | 75 | 26 | 4 | 60 | 2 | |
| Pennsylvania | 92 | 40 | 2 | 43 | 4 | 3 | |
| Ohio | 52 | 28 | 4 | 16 | 3 | 1 | |
| Indiana | 35 | 13 | 4 | 7 | 7 | 4 | |
| New York | 32 | 12 | 1 | 16 | 1 | 2 | |
| Illinois | 30 | 16 | 6 | 4 | 1 | 3 | |
| Arizona | 28 | 9 | 8 | 9 | 2 | ||
| North Carolina | 25 | 14 | 1 | 6 | 1 | 3 | |
| California | 24 | 11 | 3 | 1 | 8 | 1 | |
| Michigan | 20 | 9 | 3 | 1 | 1 | 4 | 2 |
| Missouri | 19 | 12 | 2 | 4 | 1 | ||
| Washington | 18 | 1 | 17 | ||||
| Iowa | 17 | 7 | 4 | 1 | 5 | ||
| Oregon | 17 | 4 | 1 | 2 | 9 | 1 | |
| Wisconsin | 17 | 7 | 3 | 1 | 2 | 4 | |
| Nevada | 14 | 7 | 3 | 4 | |||
| Maryland | 13 | 8 | 1 | 3 | 1 | ||
| Kentucky | 11 | 3 | 2 | 2 | 2 | 2 | |
| Oklahoma | 11 | 3 | 3 | 5 | |||
| Minnesota | 10 | 7 | 1 | 2 | |||
| New Jersey | 10 | 4 | 1 | 3 | 2 | ||
| Tennessee | 10 | 4 | 1 | 5 | |||
| Alabama | 8 | 3 | 1 | 4 | |||
| Nebraska | 8 | 1 | 1 | 6 | |||
| New Mexico | 8 | 2 | 1 | 5 | |||
| South Carolina | 8 | 4 | 1 | 2 | 1 | ||
| West Virginia | 8 | 6 | 2 | ||||
| Colorado | 7 | 2 | 1 | 4 | |||
| Florida | 7 | 4 | 2 | 1 | |||
| Louisiana | 7 | 4 | 1 | 1 | 1 | ||
| Mississippi | 7 | 4 | 2 | 1 | |||
| Utah | 7 | 5 | 1 | 1 | |||
| Arkansas | 6 | 3 | 1 | 2 | |||
| North Dakota | 6 | 1 | 1 | 4 | |||
| Kansas | 5 | 4 | 1 | ||||
| Massachusetts | 5 | 2 | 1 | 2 | |||
| Wyoming | 4 | 2 | 2 | ||||
| Connecticut | 3 | 3 | |||||
| Maine | 3 | 2 | 1 | ||||
| Montana | 3 | 3 | |||||
| South Dakota | 3 | 2 | 1 | ||||
| Delaware | 1 | 1 | |||||
| Hawaii | 1 | 1 | |||||
| Idaho | 1 | 1 | |||||
| New Hampshire | 1 | 1 | |||||
| Alaska | 0 | ||||||
| Rhode Island | 0 | ||||||
| Vermont | 0 | ||||||
| Total | 1415 | 636 | 115 | 52 | 527 | 45 | 40 |
Analysis of facility size reveals a clear shift toward large-scale, energy-intensive development that will have substantial implications for regional energy systems and infrastructure planning. Among sites with available MW demand data, the majority fall within the hyperscale range (100-999 MW), with a substantial number of projects exceeding 1,000 MW (1 GW) at the “mega campus” scale. Together, these larger facilities account for over 60% of sites with known energy demand in our database. However, the majority of the data centers in our full database have unknown estimated power demand (59%). Data center operators and developers are secretive about their projects, and this lack of transparency has led to many missing fields in our database. Without this basic transparency, many communities and local governments are asked to make decisions without fully understanding the effects the project might have if built.

There has been a shift towards hyperscale development, but the lack of transparency remains a serious problem in data center research.
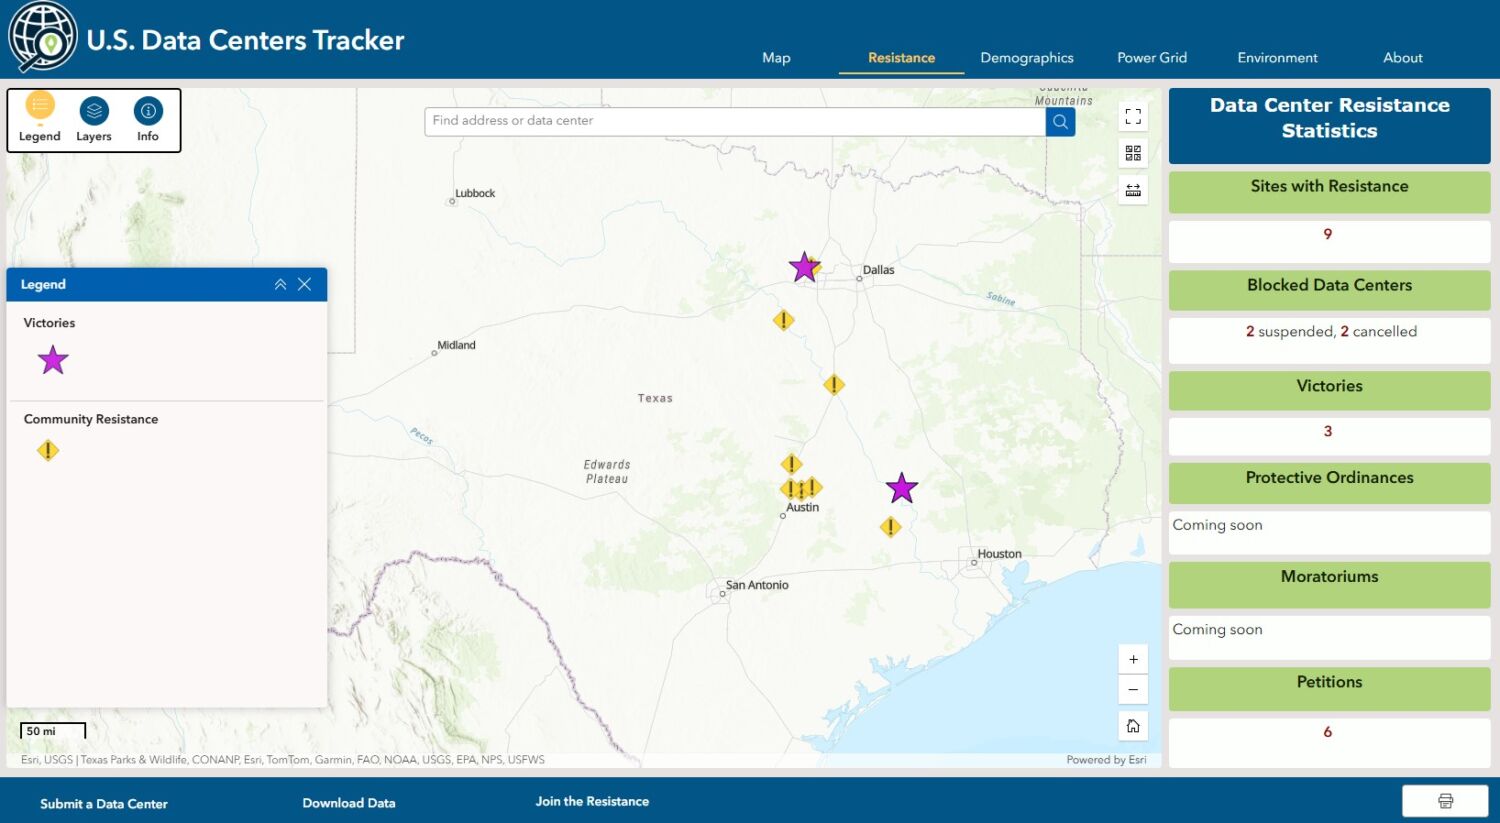
Resistance Tab
Demographics Tab
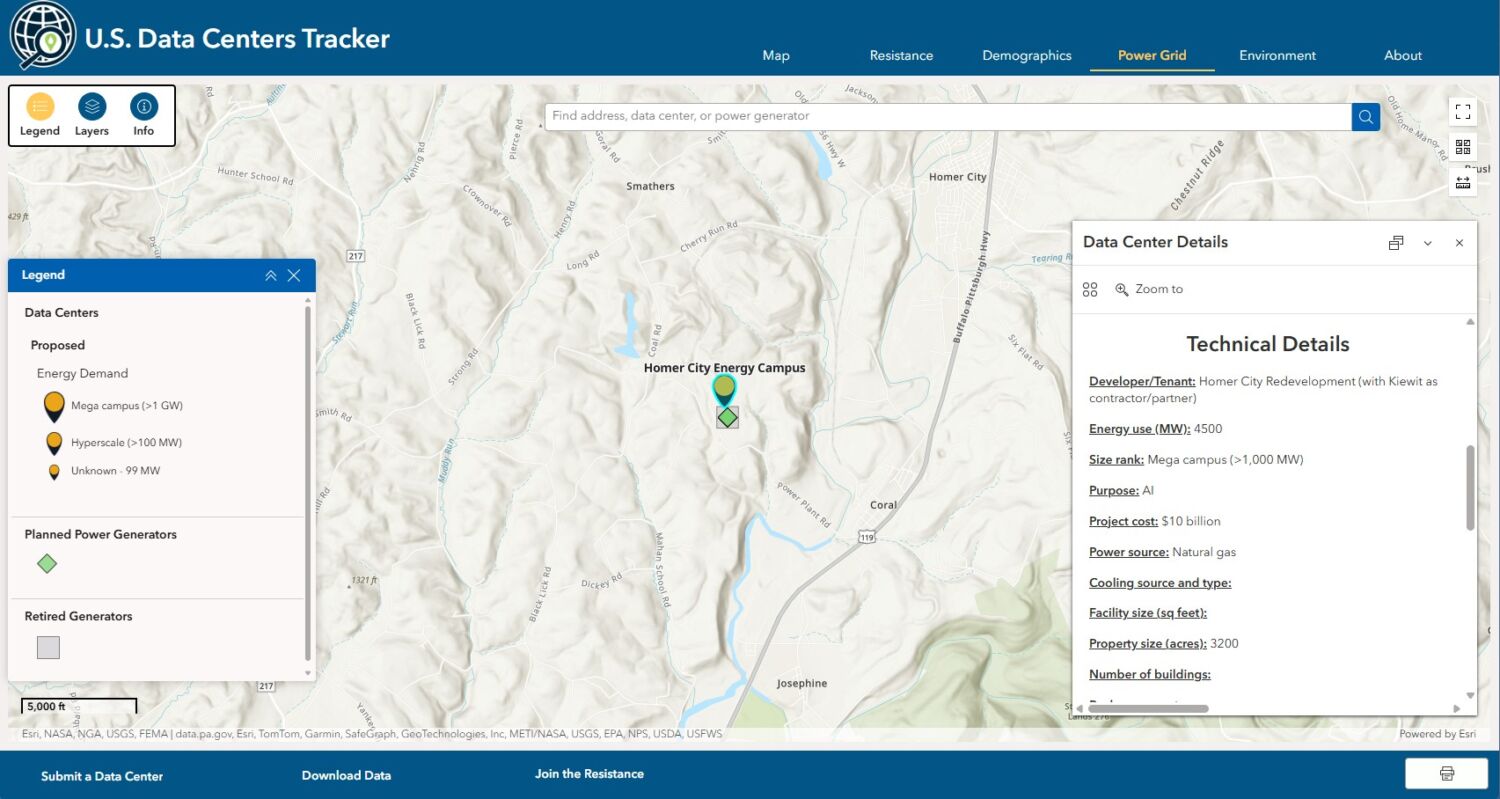
Power Grid Tab
Environment Tab
Methods
FracTracker’s U.S. Data Center Tracker dataset is compiled from a variety of sources by FracTracker staff to provide facility-level insights into the expansion of data center infrastructure across the United States. Data are validated through cross-referencing multiple sources when available, maintaining source documentation for traceability, and flagging uncertain entries for follow-up. While the dataset represents one of the most comprehensive efforts to document both data center development and associated resistance, it is subject to limitations, including uneven data availability and potential underreporting. Our project is a constant work in progress and we cannot guarantee its accuracy or completeness.
Sources include:
- News and trade press reporting
- Public records such as zoning documents, permits, planning documents, government databases and regulatory materials
- Freedom of Information Act (FOIA) responses
- Crowdsourced submissions from advocacy organizations and community members
- Collaborator datasets including Piedmont Environmental Council and Science for Georgia
Resistance data are systematically identified to capture both community- and policy-level responses to development. These include advocacy campaigns, petition platforms, local organizing efforts, and formal government actions, as documented in municipal records, meeting minutes, ordinances, and media coverage. Each instance of resistance is, where possible, linked to a specific site or jurisdiction. Victories refer to cases in which proposed developments were halted, withdrawn, or denied approval. Moratoriums are temporary policy measures that pause development to allow for further assessment or regulatory planning. Ordinances or regulatory actions represent longer-term structural changes that establish new rules governing data center siting and operation. Moratoriums and ordinances will be added to the map soon.
We will continue to update our tracker. Please reach out to us at jones@fractracker.org with comments or suggestions, or fill out our crowdsourcing form to submit information about a data center that isn’t on our map!
Conclusion
We have reframed our U.S. Data Centers Tracker as an advocacy focused dashboard. Data from numerous sources are presented on organized tabs to provide transparent, real-time visibility into projects that have major implications for energy demand, climate goals, and community health. Across the United States, residents, local organizations, and municipal governments are actively shaping development outcomes through community organizing and policy intervention. Data center development is not inevitable, and the actionable information presented in the U.S. Data Centers Tracker can give advocates the tools they need to understand and communicate the risks and harms imposed by the data center expansion boom.
Take Action
- Submit information about a data center we are missing
- Connect with other advocates on the Halt the Harm Network
- Share the tool with community and environmental groups working on clean energy, zoning, and public health.
Where to Learn More
- Tracking Data Centers: Energy Demand, Pollution, and Public Impact
- Howell Township Data Center Win: $1B Project Withdrawn After Community Meeting on Energy and Infrastructure Impacts
- Proof-of-Work Cryptocurrency Mining: Environmental BOMB, Not Balm, for the Planet
- Data Centers & Energy Demand – The Piedmont Environmental Council
- Data Centers: Transparency Makes Good Neighbors – Science for Georgia
- North Star Data Center Policy Toolkit
Topics in This Article:
Join the Conversation
Stay Informed
Support Our Work
FracTracker Alliance helps communicate the risks of oil and gas and petrochemical development to advance just energy alternatives that protect public health, natural resources, and the climate.
By contributing to FracTracker, you are helping to make tangible changes, such as decreasing the number of oil and gas wells in the US, protecting the public from toxic and radioactive chemicals, and stopping petrochemical expansion into vulnerable communities.
Your donations help fund the sourcing and analysis of new data so that we can keep you informed and continually update our resources.
Please donate to FracTracker today as a way to advocate for clean water, clean air, and healthy communities.
What You Should Read Next
 Ted Auch, 2022. Photo courtesy of FracTracker Alliance.
https://fractracker.org/wp-content/uploads/2026/07/52406478291_9120a22e07_k.jpg
1083
1500
Shannon Smith
https://fractracker.org/wp-content/uploads/2025/09/2025-Wordmark-Logo.png
Shannon Smith2026-07-10 14:18:442026-07-10 14:22:59Pennsylvania 2025 Oil & Gas Production Report: Record Gas, Low-Producing Wells, and Long-Term Liabilities
Ted Auch, 2022. Photo courtesy of FracTracker Alliance.
https://fractracker.org/wp-content/uploads/2026/07/52406478291_9120a22e07_k.jpg
1083
1500
Shannon Smith
https://fractracker.org/wp-content/uploads/2025/09/2025-Wordmark-Logo.png
Shannon Smith2026-07-10 14:18:442026-07-10 14:22:59Pennsylvania 2025 Oil & Gas Production Report: Record Gas, Low-Producing Wells, and Long-Term Liabilities https://fractracker.org/wp-content/uploads/2026/03/Web-Elements-Map-thumbnails-28.png
500
750
Shannon Smith
https://fractracker.org/wp-content/uploads/2025/09/2025-Wordmark-Logo.png
Shannon Smith2026-06-12 15:27:012026-07-10 14:27:18PA DEP Approves Unusual “Mineral Brine” Well in Erie County, Raising Concerns About New Regulatory Loophole
https://fractracker.org/wp-content/uploads/2026/03/Web-Elements-Map-thumbnails-28.png
500
750
Shannon Smith
https://fractracker.org/wp-content/uploads/2025/09/2025-Wordmark-Logo.png
Shannon Smith2026-06-12 15:27:012026-07-10 14:27:18PA DEP Approves Unusual “Mineral Brine” Well in Erie County, Raising Concerns About New Regulatory Loophole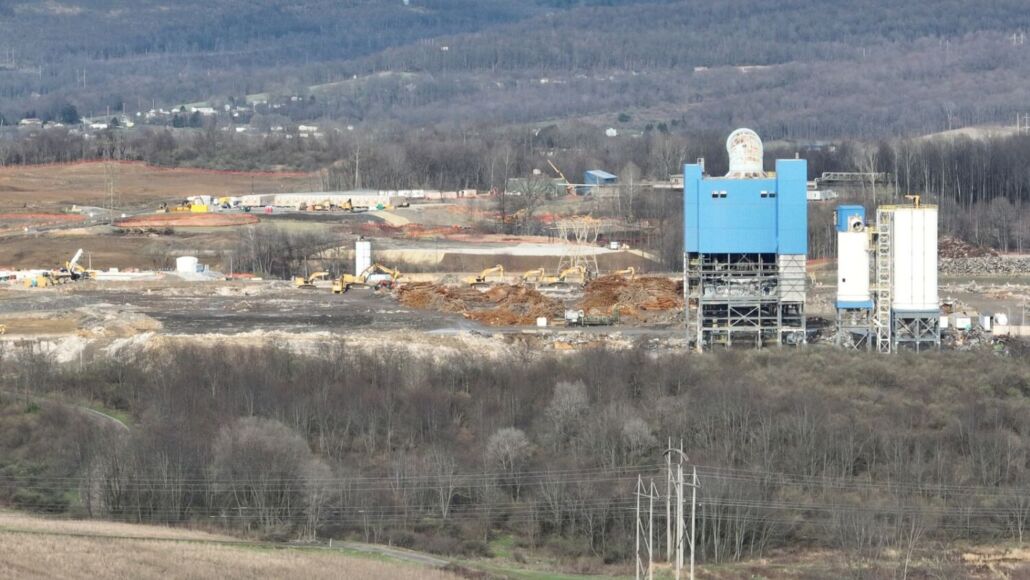 https://fractracker.org/wp-content/uploads/2026/05/Untitled-design.jpg
844
1500
FracTracker Alliance
https://fractracker.org/wp-content/uploads/2025/09/2025-Wordmark-Logo.png
FracTracker Alliance2026-04-30 17:32:352026-05-28 13:40:18From Coal Plant to AI Campus: FracTracker Documents Construction at Homer City
https://fractracker.org/wp-content/uploads/2026/05/Untitled-design.jpg
844
1500
FracTracker Alliance
https://fractracker.org/wp-content/uploads/2025/09/2025-Wordmark-Logo.png
FracTracker Alliance2026-04-30 17:32:352026-05-28 13:40:18From Coal Plant to AI Campus: FracTracker Documents Construction at Homer City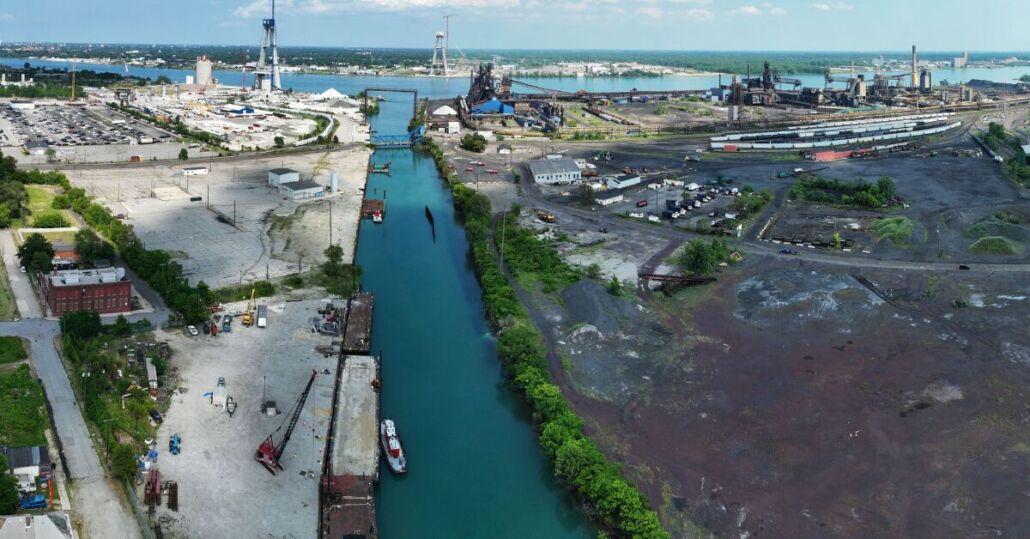 https://fractracker.org/wp-content/uploads/2026/05/3.jpg
628
1200
Gwen Klenke
https://fractracker.org/wp-content/uploads/2025/09/2025-Wordmark-Logo.png
Gwen Klenke2026-04-29 16:16:562026-05-08 11:24:12An update on Southwest Detroit Industrial Impacts: The Zug Island Ruling
https://fractracker.org/wp-content/uploads/2026/05/3.jpg
628
1200
Gwen Klenke
https://fractracker.org/wp-content/uploads/2025/09/2025-Wordmark-Logo.png
Gwen Klenke2026-04-29 16:16:562026-05-08 11:24:12An update on Southwest Detroit Industrial Impacts: The Zug Island Ruling https://fractracker.org/wp-content/uploads/2026/03/Shell-Polymers-Data-Tool-Graphics.png
628
1200
Guest Author
https://fractracker.org/wp-content/uploads/2025/09/2025-Wordmark-Logo.png
Guest Author2026-03-26 15:42:172026-04-03 10:35:54FracTracker’s New Data Tool Visualizes Shell’s Pollution, Violations, and Malfunctions Ahead of Permit Public Hearing
https://fractracker.org/wp-content/uploads/2026/03/Shell-Polymers-Data-Tool-Graphics.png
628
1200
Guest Author
https://fractracker.org/wp-content/uploads/2025/09/2025-Wordmark-Logo.png
Guest Author2026-03-26 15:42:172026-04-03 10:35:54FracTracker’s New Data Tool Visualizes Shell’s Pollution, Violations, and Malfunctions Ahead of Permit Public Hearing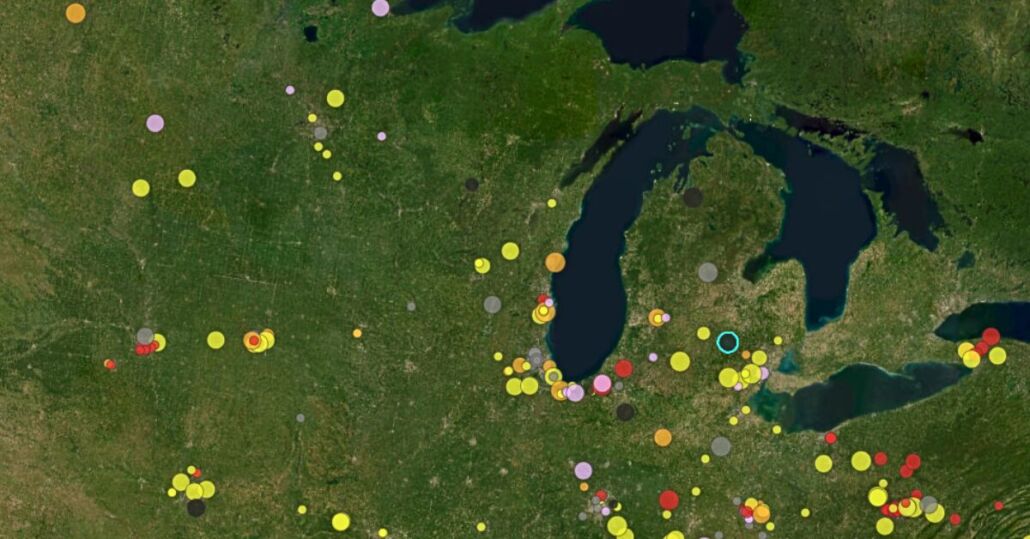 https://fractracker.org/wp-content/uploads/2026/01/Howell-Township-Win-Article-Graphics.jpg
628
1200
Gwen Klenke
https://fractracker.org/wp-content/uploads/2025/09/2025-Wordmark-Logo.png
Gwen Klenke2026-01-14 18:33:052026-05-06 18:11:32Howell Township Data Center Win: $1B Project Withdrawn After Community Meeting on Energy and Infrastructure Impacts
https://fractracker.org/wp-content/uploads/2026/01/Howell-Township-Win-Article-Graphics.jpg
628
1200
Gwen Klenke
https://fractracker.org/wp-content/uploads/2025/09/2025-Wordmark-Logo.png
Gwen Klenke2026-01-14 18:33:052026-05-06 18:11:32Howell Township Data Center Win: $1B Project Withdrawn After Community Meeting on Energy and Infrastructure Impacts https://fractracker.org/wp-content/uploads/2021/06/SShamer_Infrastructure-pipeline-rightofway-ColumbiaLineMB-BaltimoreCounty-MD-May2016.jpg
266
400
FracTracker Alliance
https://fractracker.org/wp-content/uploads/2025/09/2025-Wordmark-Logo.png
FracTracker Alliance2025-09-03 16:14:462025-09-30 10:26:57Comment Opposing the Southeast Supply Enhancement Project (SSEP) – Clean Water Act Section 404 Permit Application (SAW-2024-01961)
https://fractracker.org/wp-content/uploads/2021/06/SShamer_Infrastructure-pipeline-rightofway-ColumbiaLineMB-BaltimoreCounty-MD-May2016.jpg
266
400
FracTracker Alliance
https://fractracker.org/wp-content/uploads/2025/09/2025-Wordmark-Logo.png
FracTracker Alliance2025-09-03 16:14:462025-09-30 10:26:57Comment Opposing the Southeast Supply Enhancement Project (SSEP) – Clean Water Act Section 404 Permit Application (SAW-2024-01961)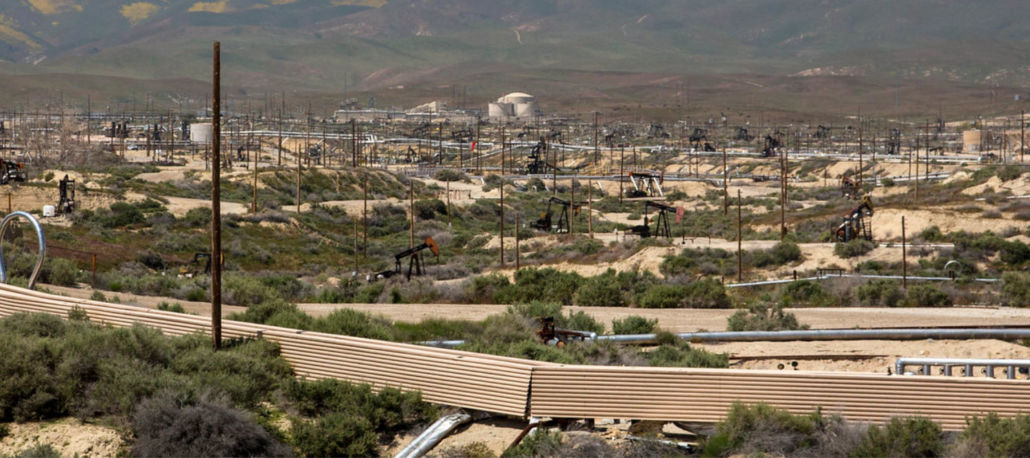 https://fractracker.org/wp-content/uploads/2021/07/California-oil-fields-feature.jpg
667
1500
Kyle Ferrar, MPH
https://fractracker.org/wp-content/uploads/2025/09/2025-Wordmark-Logo.png
Kyle Ferrar, MPH2025-08-26 17:36:222025-08-27 21:56:28California’s New Oil Wells Average 13.5 Barrels/Day — Far Below State Projections
https://fractracker.org/wp-content/uploads/2021/07/California-oil-fields-feature.jpg
667
1500
Kyle Ferrar, MPH
https://fractracker.org/wp-content/uploads/2025/09/2025-Wordmark-Logo.png
Kyle Ferrar, MPH2025-08-26 17:36:222025-08-27 21:56:28California’s New Oil Wells Average 13.5 Barrels/Day — Far Below State Projections Photo by David Becker
https://fractracker.org/wp-content/uploads/2025/08/david-becker-crs2vlkSe98-unsplash.jpg
996
1500
FracTracker Alliance
https://fractracker.org/wp-content/uploads/2025/09/2025-Wordmark-Logo.png
FracTracker Alliance2025-08-22 11:22:272025-08-26 15:47:09FracTracker Launches Oil, Gas, and Petrochemical Data Portals
Photo by David Becker
https://fractracker.org/wp-content/uploads/2025/08/david-becker-crs2vlkSe98-unsplash.jpg
996
1500
FracTracker Alliance
https://fractracker.org/wp-content/uploads/2025/09/2025-Wordmark-Logo.png
FracTracker Alliance2025-08-22 11:22:272025-08-26 15:47:09FracTracker Launches Oil, Gas, and Petrochemical Data Portals https://fractracker.org/wp-content/uploads/2013/12/Colorado.jpg
642
1144
FracTracker Alliance
https://fractracker.org/wp-content/uploads/2025/09/2025-Wordmark-Logo.png
FracTracker Alliance2025-07-22 10:42:552025-07-23 11:06:23Colorado Operators Increase Chemical Disclosures After Public Pressure, but Major Gaps Remain
https://fractracker.org/wp-content/uploads/2013/12/Colorado.jpg
642
1144
FracTracker Alliance
https://fractracker.org/wp-content/uploads/2025/09/2025-Wordmark-Logo.png
FracTracker Alliance2025-07-22 10:42:552025-07-23 11:06:23Colorado Operators Increase Chemical Disclosures After Public Pressure, but Major Gaps Remain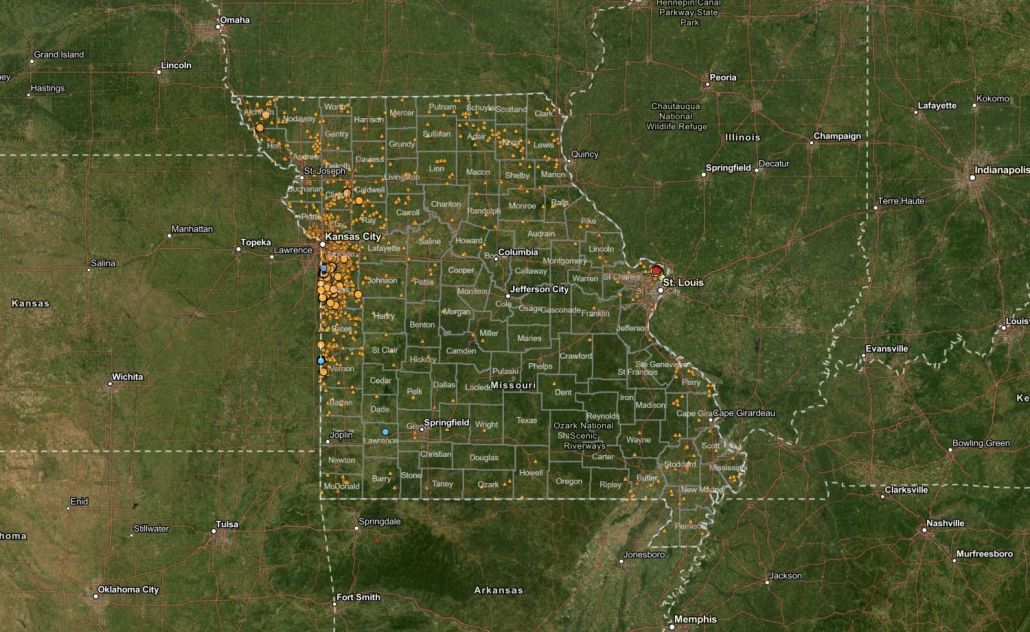 https://fractracker.org/wp-content/uploads/2025/07/Missouri-Oil-and-Gas-Wells-2025.jpg
921
1500
Kyle Ferrar, MPH
https://fractracker.org/wp-content/uploads/2025/09/2025-Wordmark-Logo.png
Kyle Ferrar, MPH2025-07-21 19:15:592025-07-22 10:08:23Evaluation of Federal Requirements for Plugging Orphaned Oil and Gas Wells: A Missouri Case Study
https://fractracker.org/wp-content/uploads/2025/07/Missouri-Oil-and-Gas-Wells-2025.jpg
921
1500
Kyle Ferrar, MPH
https://fractracker.org/wp-content/uploads/2025/09/2025-Wordmark-Logo.png
Kyle Ferrar, MPH2025-07-21 19:15:592025-07-22 10:08:23Evaluation of Federal Requirements for Plugging Orphaned Oil and Gas Wells: A Missouri Case Study https://fractracker.org/wp-content/uploads/2019/03/IdleWellsHathaway_resize.jpg
400
900
FracTracker Alliance
https://fractracker.org/wp-content/uploads/2025/09/2025-Wordmark-Logo.png
FracTracker Alliance2025-07-03 13:40:552025-07-03 15:42:15Methane Matters, but Make Polluters Pay: FracTracker’s Response to Carl Pope
https://fractracker.org/wp-content/uploads/2019/03/IdleWellsHathaway_resize.jpg
400
900
FracTracker Alliance
https://fractracker.org/wp-content/uploads/2025/09/2025-Wordmark-Logo.png
FracTracker Alliance2025-07-03 13:40:552025-07-03 15:42:15Methane Matters, but Make Polluters Pay: FracTracker’s Response to Carl Pope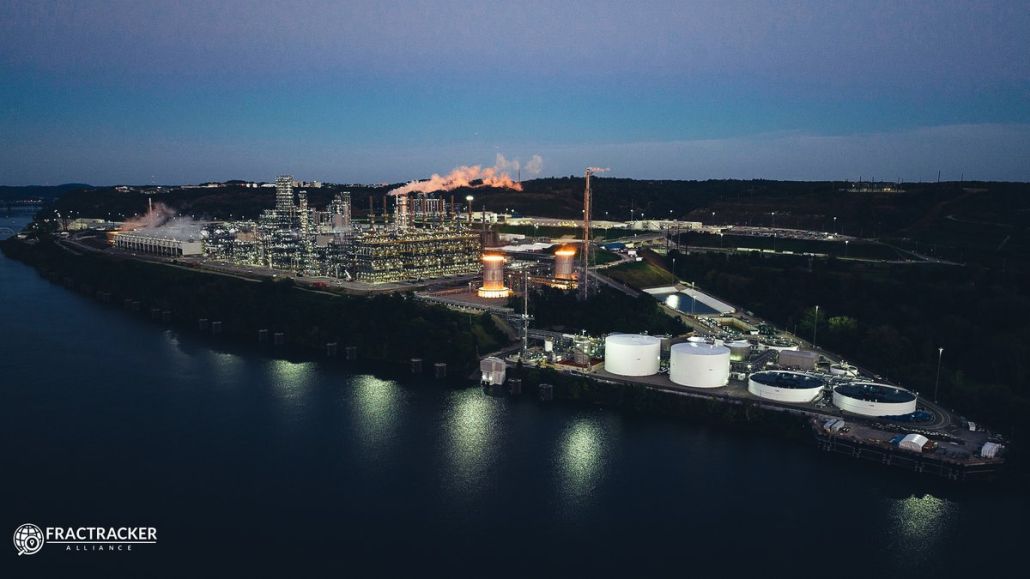 https://fractracker.org/wp-content/uploads/2022/11/Fhn3YgeXkAI0QiX.jpg
675
1200
Katie Jones
https://fractracker.org/wp-content/uploads/2025/09/2025-Wordmark-Logo.png
Katie Jones2025-07-03 13:22:502026-01-14 17:55:32Shell Polymers Monaca: 17.9 Billion Pounds of Emissions and Repeated Violations in Pennsylvania
https://fractracker.org/wp-content/uploads/2022/11/Fhn3YgeXkAI0QiX.jpg
675
1200
Katie Jones
https://fractracker.org/wp-content/uploads/2025/09/2025-Wordmark-Logo.png
Katie Jones2025-07-03 13:22:502026-01-14 17:55:32Shell Polymers Monaca: 17.9 Billion Pounds of Emissions and Repeated Violations in Pennsylvania https://fractracker.org/wp-content/uploads/2016/07/DSC_0266_LowRes.jpg
3000
4496
FracTracker Alliance
https://fractracker.org/wp-content/uploads/2025/09/2025-Wordmark-Logo.png
FracTracker Alliance2025-06-30 14:48:532025-07-03 13:47:59Plum Borough Rejects Fracking Waste Injection Well After Public Pushback
https://fractracker.org/wp-content/uploads/2016/07/DSC_0266_LowRes.jpg
3000
4496
FracTracker Alliance
https://fractracker.org/wp-content/uploads/2025/09/2025-Wordmark-Logo.png
FracTracker Alliance2025-06-30 14:48:532025-07-03 13:47:59Plum Borough Rejects Fracking Waste Injection Well After Public Pushback https://fractracker.org/wp-content/uploads/2025/05/51382261216_f8af819a45_o.jpg
1125
1500
Guest Author
https://fractracker.org/wp-content/uploads/2025/09/2025-Wordmark-Logo.png
Guest Author2025-05-31 12:00:592026-03-13 12:05:07Power Plant Locations and Unemployment Rates
https://fractracker.org/wp-content/uploads/2025/05/51382261216_f8af819a45_o.jpg
1125
1500
Guest Author
https://fractracker.org/wp-content/uploads/2025/09/2025-Wordmark-Logo.png
Guest Author2025-05-31 12:00:592026-03-13 12:05:07Power Plant Locations and Unemployment Rates https://fractracker.org/wp-content/uploads/2021/04/49770601811_6cc7e18996_k.jpg
716
1500
Matt Kelso, BA
https://fractracker.org/wp-content/uploads/2025/09/2025-Wordmark-Logo.png
Matt Kelso, BA2025-04-07 15:42:272025-04-07 15:42:27Pipeline Incidents Are a Daily Occurrence
https://fractracker.org/wp-content/uploads/2021/04/49770601811_6cc7e18996_k.jpg
716
1500
Matt Kelso, BA
https://fractracker.org/wp-content/uploads/2025/09/2025-Wordmark-Logo.png
Matt Kelso, BA2025-04-07 15:42:272025-04-07 15:42:27Pipeline Incidents Are a Daily Occurrence https://fractracker.org/wp-content/uploads/2021/02/Los-Angeles-skyline-feature-scaled.jpg
667
1500
Kyle Ferrar, MPH
https://fractracker.org/wp-content/uploads/2025/09/2025-Wordmark-Logo.png
Kyle Ferrar, MPH2025-03-27 15:37:102025-04-01 12:55:42Environmental Justice Analysis of Oil Extraction in Los Angeles Communities
https://fractracker.org/wp-content/uploads/2021/02/Los-Angeles-skyline-feature-scaled.jpg
667
1500
Kyle Ferrar, MPH
https://fractracker.org/wp-content/uploads/2025/09/2025-Wordmark-Logo.png
Kyle Ferrar, MPH2025-03-27 15:37:102025-04-01 12:55:42Environmental Justice Analysis of Oil Extraction in Los Angeles Communities https://fractracker.org/wp-content/uploads/2025/03/3_TAuch_Infrastructure-FrackPad-SouthwestPA_April2019.jpg
830
1500
Katie Jones
https://fractracker.org/wp-content/uploads/2025/09/2025-Wordmark-Logo.png
Katie Jones2025-03-26 14:05:222025-04-01 12:29:01How Increased Protective Buffer Zones Could Help Protect 3.6 million Pennsylvanians
https://fractracker.org/wp-content/uploads/2025/03/3_TAuch_Infrastructure-FrackPad-SouthwestPA_April2019.jpg
830
1500
Katie Jones
https://fractracker.org/wp-content/uploads/2025/09/2025-Wordmark-Logo.png
Katie Jones2025-03-26 14:05:222025-04-01 12:29:01How Increased Protective Buffer Zones Could Help Protect 3.6 million Pennsylvanians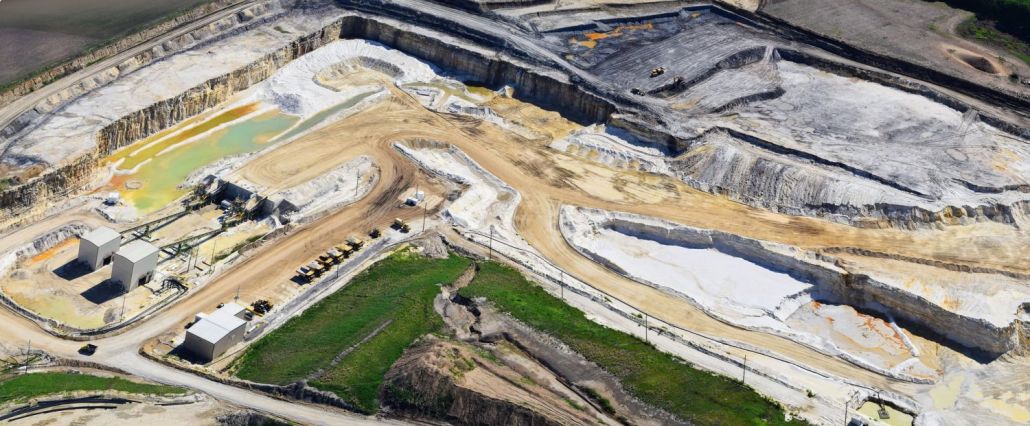 https://fractracker.org/wp-content/uploads/2025/02/49727923413_5d7b7335a0_k.jpg
621
1500
Guest Author
https://fractracker.org/wp-content/uploads/2025/09/2025-Wordmark-Logo.png
Guest Author2025-01-31 14:52:292025-02-03 15:59:13Regulatory Gaps and Resistance: The Battle Over Fracking in Southern Illinois
https://fractracker.org/wp-content/uploads/2025/02/49727923413_5d7b7335a0_k.jpg
621
1500
Guest Author
https://fractracker.org/wp-content/uploads/2025/09/2025-Wordmark-Logo.png
Guest Author2025-01-31 14:52:292025-02-03 15:59:13Regulatory Gaps and Resistance: The Battle Over Fracking in Southern Illinois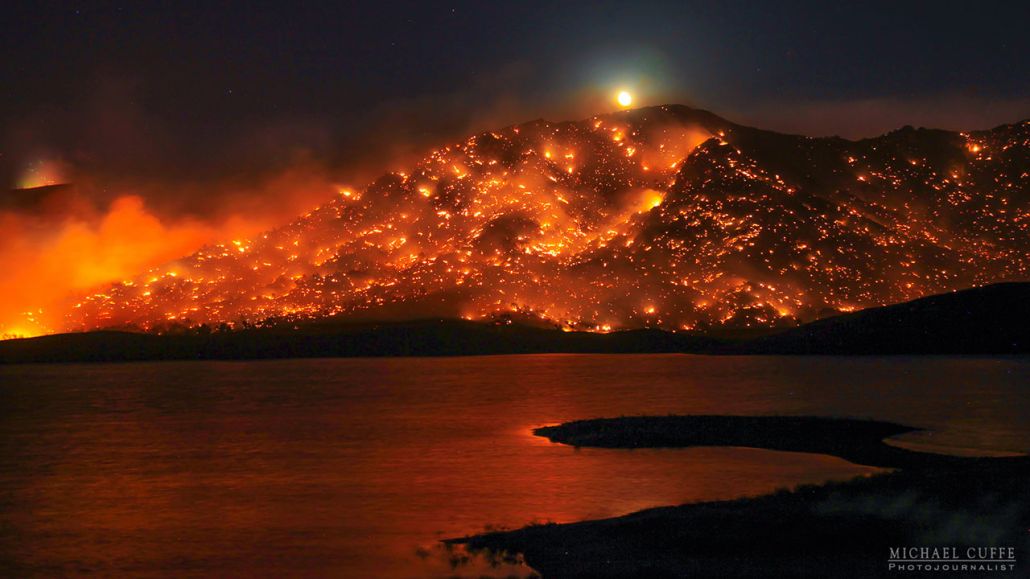 https://fractracker.org/wp-content/uploads/2025/02/1400669_062416-kabc-cuffe-erskine1-imgcrtr.jpg
720
1280
FracTracker Alliance
https://fractracker.org/wp-content/uploads/2025/09/2025-Wordmark-Logo.png
FracTracker Alliance2025-01-31 12:07:132025-02-06 14:11:38Can California Energy Policy Move Past its Contradictions?
https://fractracker.org/wp-content/uploads/2025/02/1400669_062416-kabc-cuffe-erskine1-imgcrtr.jpg
720
1280
FracTracker Alliance
https://fractracker.org/wp-content/uploads/2025/09/2025-Wordmark-Logo.png
FracTracker Alliance2025-01-31 12:07:132025-02-06 14:11:38Can California Energy Policy Move Past its Contradictions? FracTracker Alliance, 2024
https://fractracker.org/wp-content/uploads/2024/03/ODNR-Oil-and-Gas-Incidents-2018-2023.jpg
844
1500
Gwen Klenke
https://fractracker.org/wp-content/uploads/2025/09/2025-Wordmark-Logo.png
Gwen Klenke2025-01-06 11:47:452025-01-06 14:49:36Data Gaps: A Critical Examination of Oil and Gas Well Incidents in Ohio
FracTracker Alliance, 2024
https://fractracker.org/wp-content/uploads/2024/03/ODNR-Oil-and-Gas-Incidents-2018-2023.jpg
844
1500
Gwen Klenke
https://fractracker.org/wp-content/uploads/2025/09/2025-Wordmark-Logo.png
Gwen Klenke2025-01-06 11:47:452025-01-06 14:49:36Data Gaps: A Critical Examination of Oil and Gas Well Incidents in Ohio Great Plains Action Society
https://fractracker.org/wp-content/uploads/2024/10/No-CO2-Ppelines-Sioux-City.jpg
672
1012
Gwen Klenke
https://fractracker.org/wp-content/uploads/2025/09/2025-Wordmark-Logo.png
Gwen Klenke2024-10-22 11:55:082024-10-25 12:10:00Indigenous Communities’ Fight Against CO2 Pipelines in the Great Plains
Great Plains Action Society
https://fractracker.org/wp-content/uploads/2024/10/No-CO2-Ppelines-Sioux-City.jpg
672
1012
Gwen Klenke
https://fractracker.org/wp-content/uploads/2025/09/2025-Wordmark-Logo.png
Gwen Klenke2024-10-22 11:55:082024-10-25 12:10:00Indigenous Communities’ Fight Against CO2 Pipelines in the Great Plains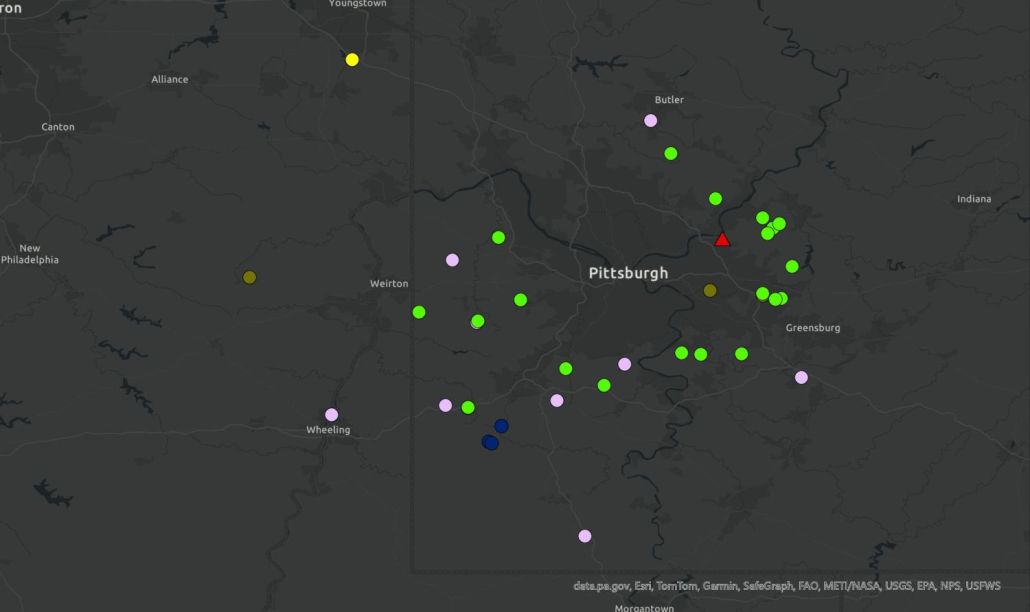 https://fractracker.org/wp-content/uploads/2024/08/Midas6M_RecvFacil_042024_Header.jpg
891
1500
Matt Kelso, BA
https://fractracker.org/wp-content/uploads/2025/09/2025-Wordmark-Logo.png
Matt Kelso, BA2024-08-01 20:41:312024-08-02 17:55:17Pennsylvania Oil and Gas Industry Trends: Drilled Wells, Violations, Production, and Waste
https://fractracker.org/wp-content/uploads/2024/08/Midas6M_RecvFacil_042024_Header.jpg
891
1500
Matt Kelso, BA
https://fractracker.org/wp-content/uploads/2025/09/2025-Wordmark-Logo.png
Matt Kelso, BA2024-08-01 20:41:312024-08-02 17:55:17Pennsylvania Oil and Gas Industry Trends: Drilled Wells, Violations, Production, and Waste https://fractracker.org/wp-content/uploads/2025/09/2025-Wordmark-Logo.png
0
0
FracTracker Alliance
https://fractracker.org/wp-content/uploads/2025/09/2025-Wordmark-Logo.png
FracTracker Alliance2024-06-05 17:41:582024-06-06 09:18:40A Closer Look at Risks of the Appalachian Hydrogen Hub
https://fractracker.org/wp-content/uploads/2025/09/2025-Wordmark-Logo.png
0
0
FracTracker Alliance
https://fractracker.org/wp-content/uploads/2025/09/2025-Wordmark-Logo.png
FracTracker Alliance2024-06-05 17:41:582024-06-06 09:18:40A Closer Look at Risks of the Appalachian Hydrogen Hub FracTracker Alliance, 2024
https://fractracker.org/wp-content/uploads/2024/06/Falcon-Pipeline-Violations-2024.jpg
844
1500
Katie Jones
https://fractracker.org/wp-content/uploads/2025/09/2025-Wordmark-Logo.png
Katie Jones2024-06-05 10:35:022024-06-05 11:36:30Falcon Pipeline Criminal Charges Explained
FracTracker Alliance, 2024
https://fractracker.org/wp-content/uploads/2024/06/Falcon-Pipeline-Violations-2024.jpg
844
1500
Katie Jones
https://fractracker.org/wp-content/uploads/2025/09/2025-Wordmark-Logo.png
Katie Jones2024-06-05 10:35:022024-06-05 11:36:30Falcon Pipeline Criminal Charges Explained https://fractracker.org/wp-content/uploads/2016/10/Nix-Pix-050.jpg
3088
4629
FracTracker Alliance
https://fractracker.org/wp-content/uploads/2025/09/2025-Wordmark-Logo.png
FracTracker Alliance2024-06-04 16:34:592025-05-02 14:53:36The Importance of Surveying Rural Landowners in North Dakota on Fracking
https://fractracker.org/wp-content/uploads/2016/10/Nix-Pix-050.jpg
3088
4629
FracTracker Alliance
https://fractracker.org/wp-content/uploads/2025/09/2025-Wordmark-Logo.png
FracTracker Alliance2024-06-04 16:34:592025-05-02 14:53:36The Importance of Surveying Rural Landowners in North Dakota on Fracking https://fractracker.org/wp-content/uploads/2016/04/Mount-Carbon-WV-Large.jpg
1429
1888
Ted Auch, PhD
https://fractracker.org/wp-content/uploads/2025/09/2025-Wordmark-Logo.png
Ted Auch, PhD2024-06-04 14:18:082024-06-04 16:39:12Exploring the Fallout of Precision Scheduled Rail: A Rail Worker’s Perspective on Precision Scheduled Rail
https://fractracker.org/wp-content/uploads/2016/04/Mount-Carbon-WV-Large.jpg
1429
1888
Ted Auch, PhD
https://fractracker.org/wp-content/uploads/2025/09/2025-Wordmark-Logo.png
Ted Auch, PhD2024-06-04 14:18:082024-06-04 16:39:12Exploring the Fallout of Precision Scheduled Rail: A Rail Worker’s Perspective on Precision Scheduled Rail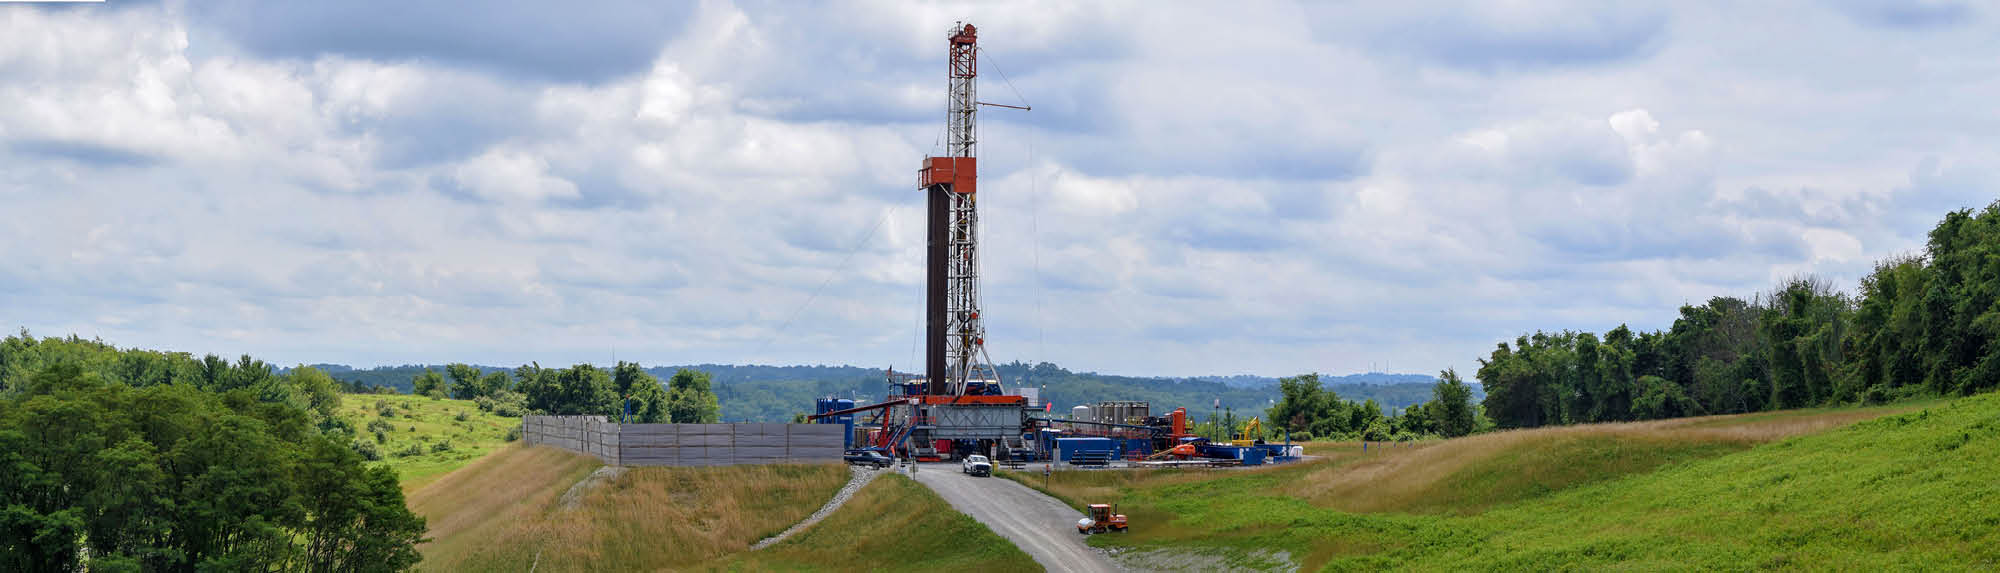 https://fractracker.org/wp-content/uploads/2019/12/Drilling-rig-in-Washington-County-Pennsylvania.jpg
573
2000
Katie Jones
https://fractracker.org/wp-content/uploads/2025/09/2025-Wordmark-Logo.png
Katie Jones2024-05-02 15:54:282025-05-21 12:33:41Not-So-Radical Transparency: An Ineffective and Unnecessary Partnership Between Pennsylvania Governor Shapiro and the Gas Company CNX
https://fractracker.org/wp-content/uploads/2019/03/IdleWellsHathaway_resize.jpg
400
900
Kyle Ferrar, MPH
https://fractracker.org/wp-content/uploads/2025/09/2025-Wordmark-Logo.png
Kyle Ferrar, MPH2024-05-02 10:32:552024-05-02 12:43:28California Must Improve Management of Idle Wells
https://fractracker.org/wp-content/uploads/2019/12/Drilling-rig-in-Washington-County-Pennsylvania.jpg
573
2000
Katie Jones
https://fractracker.org/wp-content/uploads/2025/09/2025-Wordmark-Logo.png
Katie Jones2024-05-02 15:54:282025-05-21 12:33:41Not-So-Radical Transparency: An Ineffective and Unnecessary Partnership Between Pennsylvania Governor Shapiro and the Gas Company CNX
https://fractracker.org/wp-content/uploads/2019/03/IdleWellsHathaway_resize.jpg
400
900
Kyle Ferrar, MPH
https://fractracker.org/wp-content/uploads/2025/09/2025-Wordmark-Logo.png
Kyle Ferrar, MPH2024-05-02 10:32:552024-05-02 12:43:28California Must Improve Management of Idle Wells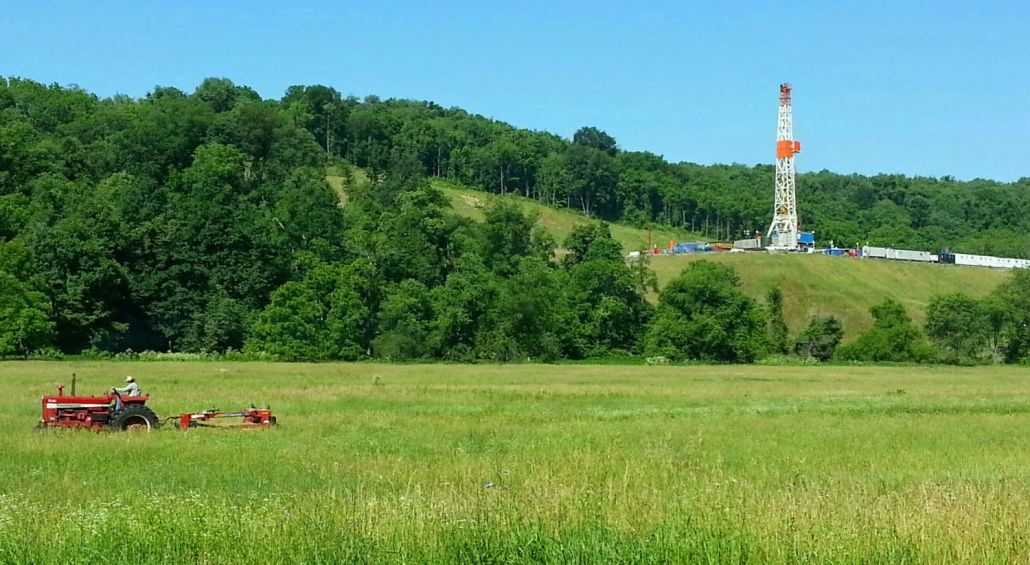 https://fractracker.org/wp-content/uploads/2023/10/gilooly-farmer-pa-2013.jpg
823
1500
Guest Author
https://fractracker.org/wp-content/uploads/2025/09/2025-Wordmark-Logo.png
Guest Author2024-04-26 11:34:082024-04-29 09:39:15Holes in FracFocus
https://fractracker.org/wp-content/uploads/2023/10/gilooly-farmer-pa-2013.jpg
823
1500
Guest Author
https://fractracker.org/wp-content/uploads/2025/09/2025-Wordmark-Logo.png
Guest Author2024-04-26 11:34:082024-04-29 09:39:15Holes in FracFocus FracTracker Alliance, 2024
https://fractracker.org/wp-content/uploads/2024/03/WV-PFAS-Map.jpeg
763
1500
Matt Kelso, BA
https://fractracker.org/wp-content/uploads/2025/09/2025-Wordmark-Logo.png
Matt Kelso, BA2024-03-29 15:06:512024-03-29 15:42:29Mapping PFAS Chemicals Used in Fracking Operations in West Virginia
FracTracker Alliance, 2024
https://fractracker.org/wp-content/uploads/2024/03/WV-PFAS-Map.jpeg
763
1500
Matt Kelso, BA
https://fractracker.org/wp-content/uploads/2025/09/2025-Wordmark-Logo.png
Matt Kelso, BA2024-03-29 15:06:512024-03-29 15:42:29Mapping PFAS Chemicals Used in Fracking Operations in West Virginia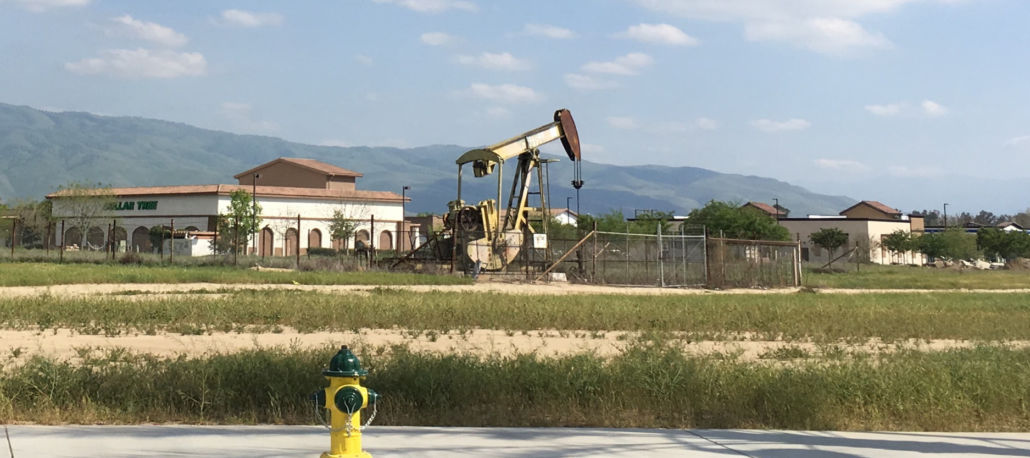 https://fractracker.org/wp-content/uploads/2020/04/California-well-pad.jpg
666
1500
FracTracker Alliance
https://fractracker.org/wp-content/uploads/2025/09/2025-Wordmark-Logo.png
FracTracker Alliance2024-03-07 17:01:582024-03-12 09:55:39Chevron’s $2.3 Billion Asset Adjustment Raises Questions Amidst Regulatory Changes in California
https://fractracker.org/wp-content/uploads/2020/04/California-well-pad.jpg
666
1500
FracTracker Alliance
https://fractracker.org/wp-content/uploads/2025/09/2025-Wordmark-Logo.png
FracTracker Alliance2024-03-07 17:01:582024-03-12 09:55:39Chevron’s $2.3 Billion Asset Adjustment Raises Questions Amidst Regulatory Changes in California Ross incinerator in Eaton Township. Photo by Ted Auch, FracTracker Alliance, 2023
https://fractracker.org/wp-content/uploads/2024/02/52748252528_19364d2943_k.jpg
918
1500
Guest Author
https://fractracker.org/wp-content/uploads/2025/09/2025-Wordmark-Logo.png
Guest Author2024-02-07 21:56:582024-02-09 13:47:09Stop Toxic Threat: A Heavy Industrial Zoning Battle
Ross incinerator in Eaton Township. Photo by Ted Auch, FracTracker Alliance, 2023
https://fractracker.org/wp-content/uploads/2024/02/52748252528_19364d2943_k.jpg
918
1500
Guest Author
https://fractracker.org/wp-content/uploads/2025/09/2025-Wordmark-Logo.png
Guest Author2024-02-07 21:56:582024-02-09 13:47:09Stop Toxic Threat: A Heavy Industrial Zoning Battle Ross Environmental Hazardous Waste Incinerator in Eaton Township, Ohio. Ted Auch, FracTracker Alliance, 2023
https://fractracker.org/wp-content/uploads/2024/02/52747231757_2834f8bd30_k.jpg
1124
1500
Guest Author
https://fractracker.org/wp-content/uploads/2025/09/2025-Wordmark-Logo.png
Guest Author2024-02-01 22:00:352024-02-09 13:45:10East Palestine Warning: The Growing Threat From Hazardous Waste Storage
Ross Environmental Hazardous Waste Incinerator in Eaton Township, Ohio. Ted Auch, FracTracker Alliance, 2023
https://fractracker.org/wp-content/uploads/2024/02/52747231757_2834f8bd30_k.jpg
1124
1500
Guest Author
https://fractracker.org/wp-content/uploads/2025/09/2025-Wordmark-Logo.png
Guest Author2024-02-01 22:00:352024-02-09 13:45:10East Palestine Warning: The Growing Threat From Hazardous Waste Storage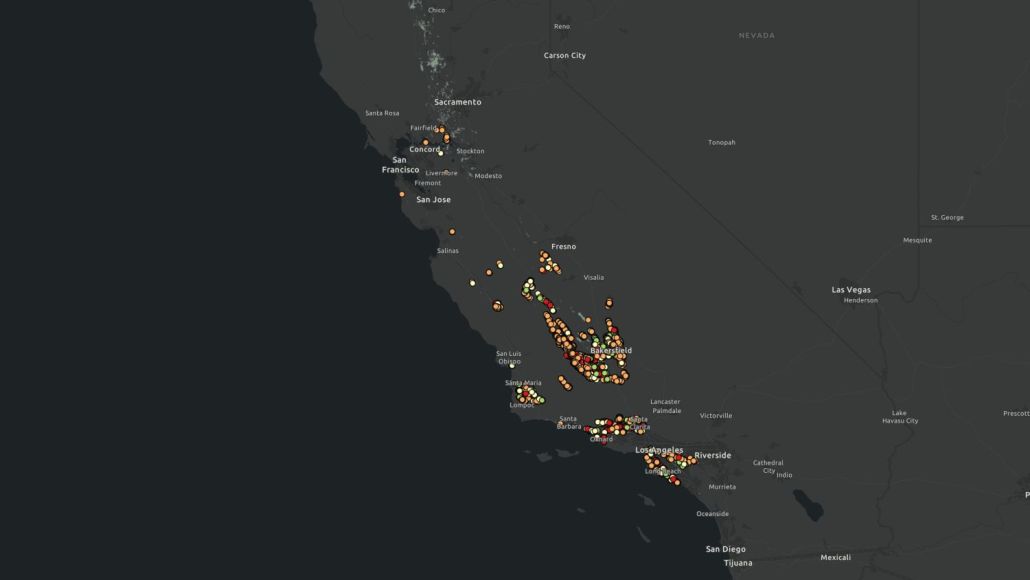 FracTracker Alliance, 2024
https://fractracker.org/wp-content/uploads/2024/01/California-Daily-Oil-Production-2024.jpg
844
1500
Kyle Ferrar, MPH
https://fractracker.org/wp-content/uploads/2025/09/2025-Wordmark-Logo.png
Kyle Ferrar, MPH2024-01-30 05:00:012024-02-05 13:46:42Index of Oil and Gas Operator Health in California Shows Risks to State Economy and Taxpayers
FracTracker Alliance, 2024
https://fractracker.org/wp-content/uploads/2024/01/California-Daily-Oil-Production-2024.jpg
844
1500
Kyle Ferrar, MPH
https://fractracker.org/wp-content/uploads/2025/09/2025-Wordmark-Logo.png
Kyle Ferrar, MPH2024-01-30 05:00:012024-02-05 13:46:42Index of Oil and Gas Operator Health in California Shows Risks to State Economy and Taxpayers The cottage along Slope Creek, months after being vacated due to health concerns caused by nearby oil and gas operations. Photo courtesy of Chloe Mankin
https://fractracker.org/wp-content/uploads/2024/01/slopecreek2018.jpg
845
1500
Chloe Mankin
https://fractracker.org/wp-content/uploads/2025/09/2025-Wordmark-Logo.png
Chloe Mankin2024-01-12 12:51:302024-01-12 16:32:21Calling for Change: Life on the Fracking Frontlines
The cottage along Slope Creek, months after being vacated due to health concerns caused by nearby oil and gas operations. Photo courtesy of Chloe Mankin
https://fractracker.org/wp-content/uploads/2024/01/slopecreek2018.jpg
845
1500
Chloe Mankin
https://fractracker.org/wp-content/uploads/2025/09/2025-Wordmark-Logo.png
Chloe Mankin2024-01-12 12:51:302024-01-12 16:32:21Calling for Change: Life on the Fracking Frontlines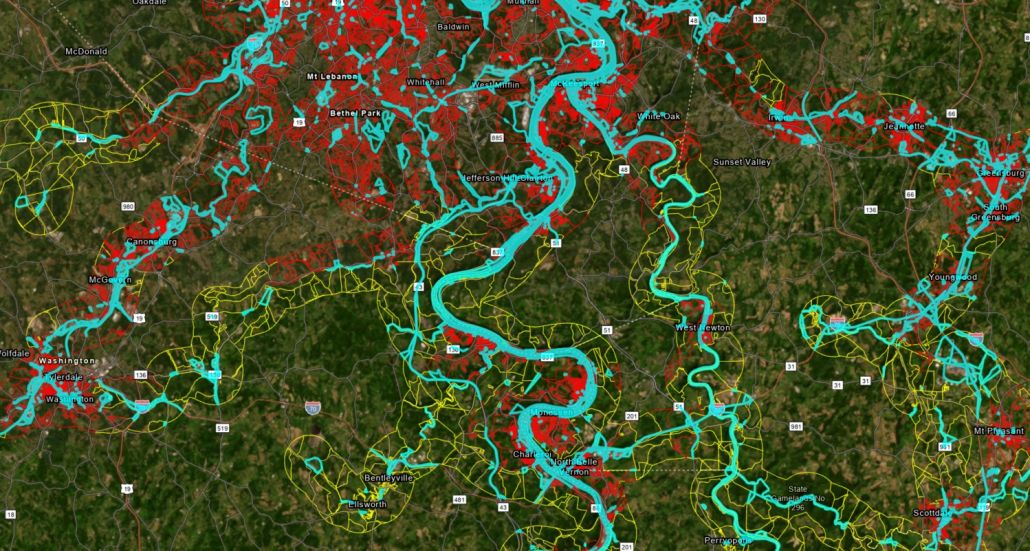 https://fractracker.org/wp-content/uploads/2023/12/Figure-6-Rail-Population.jpg
801
1498
Matt Kelso, BA
https://fractracker.org/wp-content/uploads/2025/09/2025-Wordmark-Logo.png
Matt Kelso, BA2023-12-14 16:26:372023-12-15 11:47:53On the Wrong Track: Risks to Residents of the Upper Ohio River Valley From Railroad Incidents
https://fractracker.org/wp-content/uploads/2023/12/Figure-6-Rail-Population.jpg
801
1498
Matt Kelso, BA
https://fractracker.org/wp-content/uploads/2025/09/2025-Wordmark-Logo.png
Matt Kelso, BA2023-12-14 16:26:372023-12-15 11:47:53On the Wrong Track: Risks to Residents of the Upper Ohio River Valley From Railroad Incidents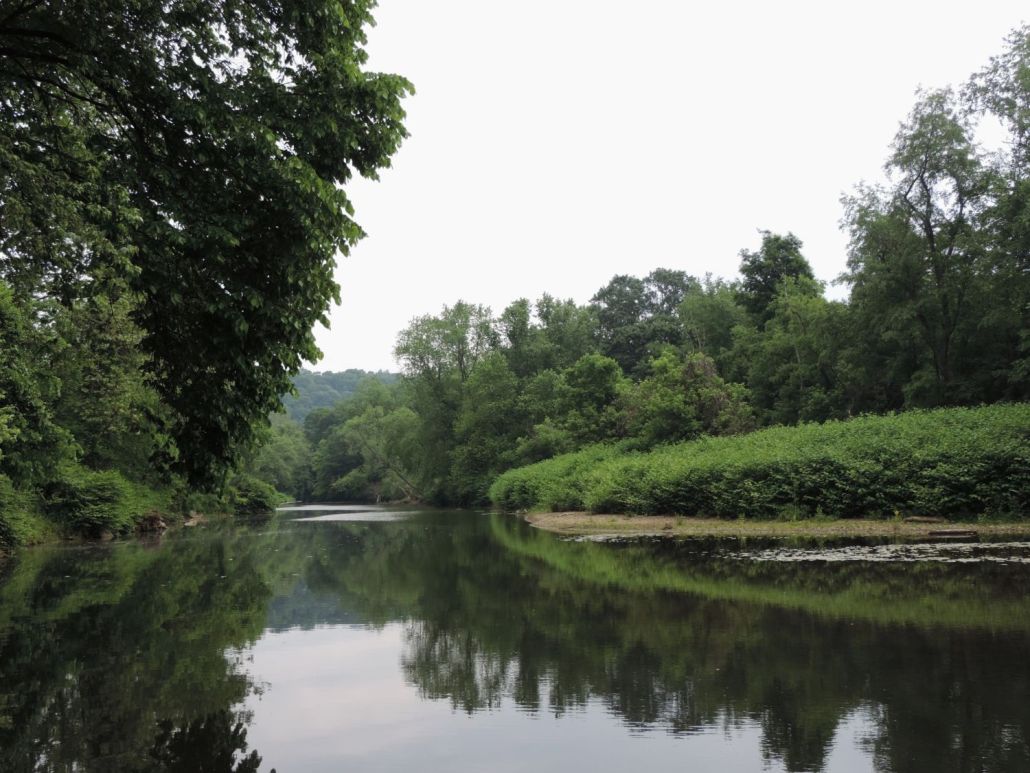 Matt Kelso, FracTracker Alliance, 2023
https://fractracker.org/wp-content/uploads/2023/11/DSCN1328.jpg
1125
1500
Matt Kelso, BA
https://fractracker.org/wp-content/uploads/2025/09/2025-Wordmark-Logo.png
Matt Kelso, BA2023-11-16 13:25:082025-03-06 15:39:23Digital Atlas: Exploring Nature and Industry in the Raccoon Creek Watershed
Matt Kelso, FracTracker Alliance, 2023
https://fractracker.org/wp-content/uploads/2023/11/DSCN1328.jpg
1125
1500
Matt Kelso, BA
https://fractracker.org/wp-content/uploads/2025/09/2025-Wordmark-Logo.png
Matt Kelso, BA2023-11-16 13:25:082025-03-06 15:39:23Digital Atlas: Exploring Nature and Industry in the Raccoon Creek Watershed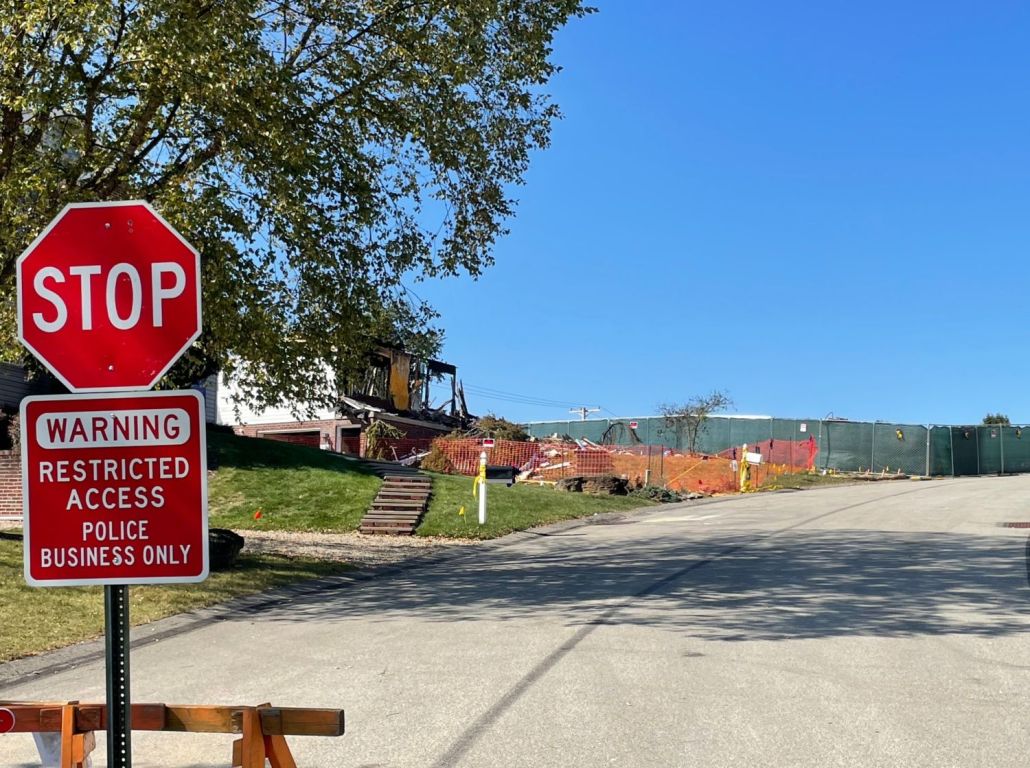 https://fractracker.org/wp-content/uploads/2023/10/RusticRidge_102023.jpg
1119
1500
Matt Kelso, BA
https://fractracker.org/wp-content/uploads/2025/09/2025-Wordmark-Logo.png
Matt Kelso, BA2023-11-09 19:01:252025-08-12 13:45:14Why Do Houses Keep Exploding in One Pennsylvania Suburb?
https://fractracker.org/wp-content/uploads/2023/10/RusticRidge_102023.jpg
1119
1500
Matt Kelso, BA
https://fractracker.org/wp-content/uploads/2025/09/2025-Wordmark-Logo.png
Matt Kelso, BA2023-11-09 19:01:252025-08-12 13:45:14Why Do Houses Keep Exploding in One Pennsylvania Suburb?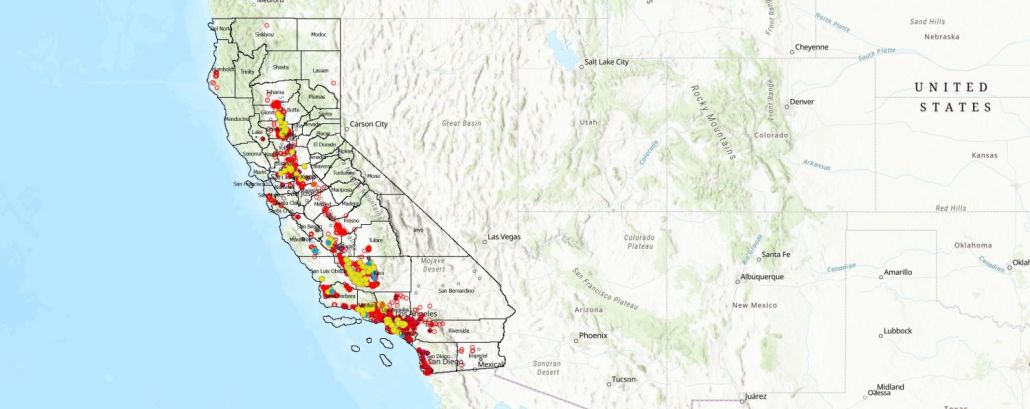 https://fractracker.org/wp-content/uploads/2023/10/Wells-Within-3200-Feet-of-Schools-Childcare-CA.jpg
595
1500
Kyle Ferrar, MPH
https://fractracker.org/wp-content/uploads/2025/09/2025-Wordmark-Logo.png
Kyle Ferrar, MPH2023-10-04 16:38:472023-10-04 21:19:54Oil and Gas Activity Within California Public Health Protection Zones
https://fractracker.org/wp-content/uploads/2023/10/Wells-Within-3200-Feet-of-Schools-Childcare-CA.jpg
595
1500
Kyle Ferrar, MPH
https://fractracker.org/wp-content/uploads/2025/09/2025-Wordmark-Logo.png
Kyle Ferrar, MPH2023-10-04 16:38:472023-10-04 21:19:54Oil and Gas Activity Within California Public Health Protection Zones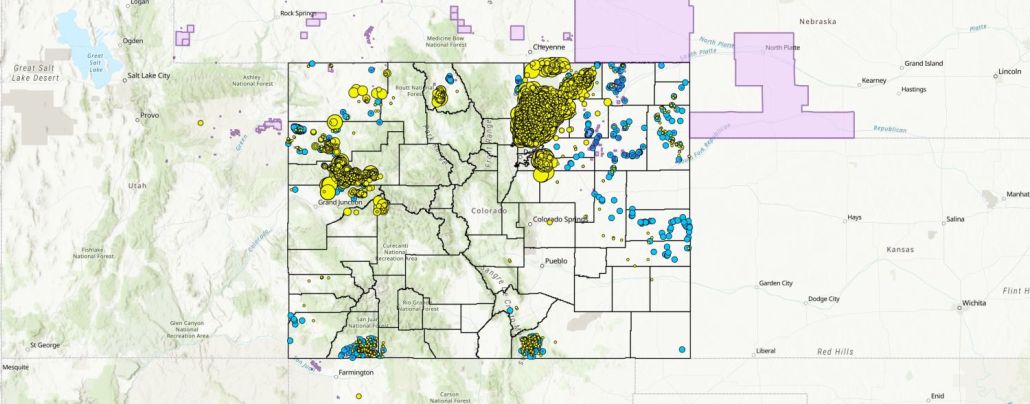 https://fractracker.org/wp-content/uploads/2023/05/Colorado-Water-Use-5.2.23.jpg
589
1500
Kyle Ferrar, MPH
https://fractracker.org/wp-content/uploads/2025/09/2025-Wordmark-Logo.png
Kyle Ferrar, MPH2023-05-02 12:33:532026-04-23 15:43:28Evaluation of the Capacity for Water Recycling for Colorado Oil and Gas Extraction Operations
https://fractracker.org/wp-content/uploads/2023/05/Colorado-Water-Use-5.2.23.jpg
589
1500
Kyle Ferrar, MPH
https://fractracker.org/wp-content/uploads/2025/09/2025-Wordmark-Logo.png
Kyle Ferrar, MPH2023-05-02 12:33:532026-04-23 15:43:28Evaluation of the Capacity for Water Recycling for Colorado Oil and Gas Extraction Operations Sarah Carballo, FracTracker Alliance, 2022
https://fractracker.org/wp-content/uploads/2023/04/DSC_0855.jpg
1001
1500
FracTracker Alliance
https://fractracker.org/wp-content/uploads/2025/09/2025-Wordmark-Logo.png
FracTracker Alliance2023-04-27 13:46:002023-04-27 14:18:17Evidence Shows Oil and Gas Companies Use PFAS in New Mexico Wells
Sarah Carballo, FracTracker Alliance, 2022
https://fractracker.org/wp-content/uploads/2023/04/DSC_0855.jpg
1001
1500
FracTracker Alliance
https://fractracker.org/wp-content/uploads/2025/09/2025-Wordmark-Logo.png
FracTracker Alliance2023-04-27 13:46:002023-04-27 14:18:17Evidence Shows Oil and Gas Companies Use PFAS in New Mexico Wells https://fractracker.org/wp-content/uploads/2023/04/Rework-Permits-Feature-Image.png
506
1500
Kyle Ferrar, MPH
https://fractracker.org/wp-content/uploads/2025/09/2025-Wordmark-Logo.png
Kyle Ferrar, MPH2023-04-14 11:36:392023-04-28 16:05:23CalGEM Permit Review Q1 2023: Well Rework Permits Increase by 76% in California
https://fractracker.org/wp-content/uploads/2023/04/Rework-Permits-Feature-Image.png
506
1500
Kyle Ferrar, MPH
https://fractracker.org/wp-content/uploads/2025/09/2025-Wordmark-Logo.png
Kyle Ferrar, MPH2023-04-14 11:36:392023-04-28 16:05:23CalGEM Permit Review Q1 2023: Well Rework Permits Increase by 76% in California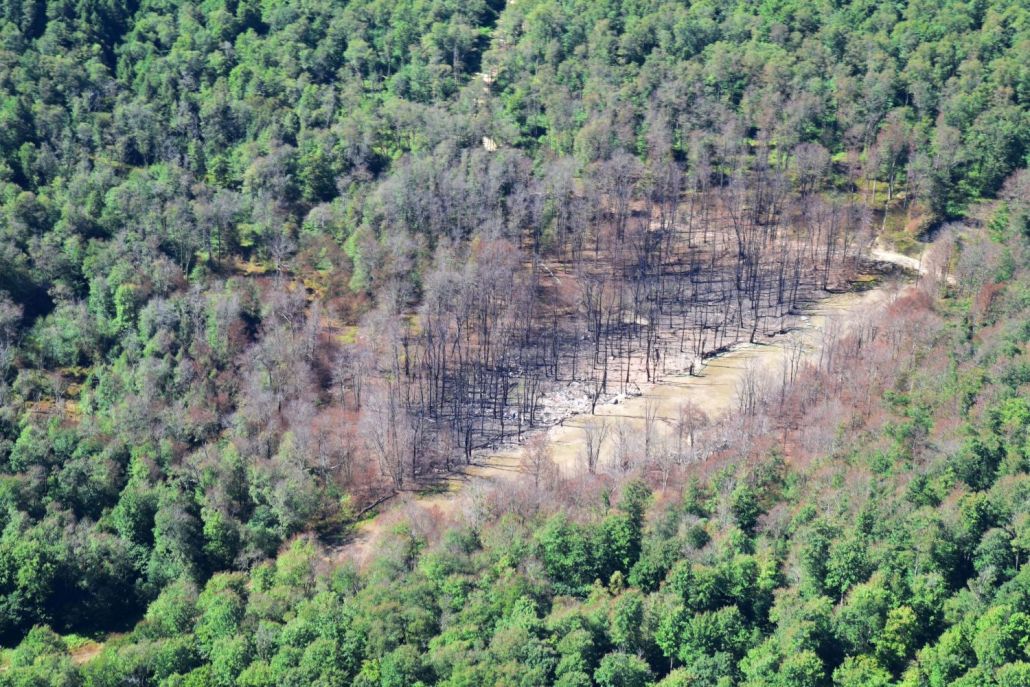 Ted Auch, FracTracker Alliance, 2022
https://fractracker.org/wp-content/uploads/2023/02/DSC_1026_LowRes.jpg
1000
1500
Matt Kelso, BA
https://fractracker.org/wp-content/uploads/2025/09/2025-Wordmark-Logo.png
Matt Kelso, BA2023-02-01 15:36:182023-02-01 17:01:372022 Pipeline Incidents Update: Is Pipeline Safety Achievable?
Ted Auch, FracTracker Alliance, 2022
https://fractracker.org/wp-content/uploads/2023/02/DSC_1026_LowRes.jpg
1000
1500
Matt Kelso, BA
https://fractracker.org/wp-content/uploads/2025/09/2025-Wordmark-Logo.png
Matt Kelso, BA2023-02-01 15:36:182023-02-01 17:01:372022 Pipeline Incidents Update: Is Pipeline Safety Achievable?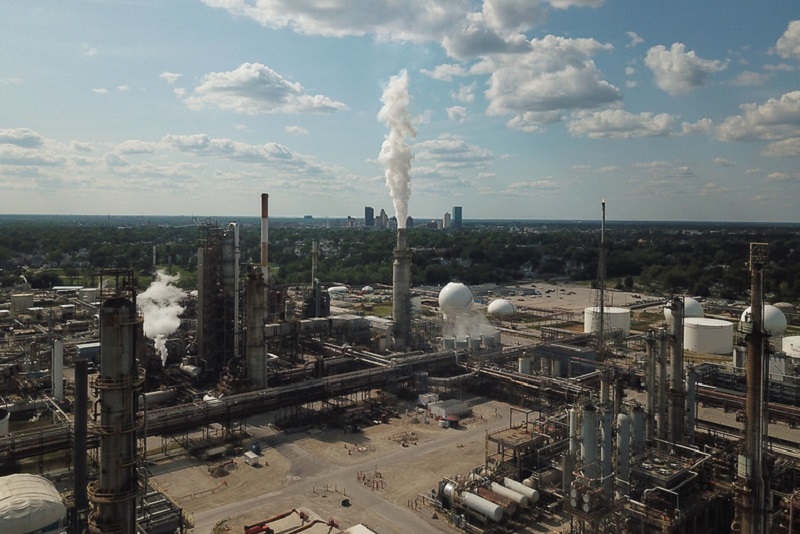 https://fractracker.org/wp-content/uploads/2020/09/Methane_Air_WaterQualityConcerns-1.jpg
534
800
FracTracker Alliance
https://fractracker.org/wp-content/uploads/2025/09/2025-Wordmark-Logo.png
FracTracker Alliance2023-01-31 15:01:342023-02-27 16:43:15Testimony On EPA’s Proposed Methane Pollution Standards for the Oil and Gas Industry
https://fractracker.org/wp-content/uploads/2020/09/Methane_Air_WaterQualityConcerns-1.jpg
534
800
FracTracker Alliance
https://fractracker.org/wp-content/uploads/2025/09/2025-Wordmark-Logo.png
FracTracker Alliance2023-01-31 15:01:342023-02-27 16:43:15Testimony On EPA’s Proposed Methane Pollution Standards for the Oil and Gas Industry https://fractracker.org/wp-content/uploads/2023/01/California-Rework-Permits-2023.jpg
541
1500
Kyle Ferrar, MPH
https://fractracker.org/wp-content/uploads/2025/09/2025-Wordmark-Logo.png
Kyle Ferrar, MPH2023-01-24 09:01:352023-01-24 13:21:55Assessment of Rework Permits on Oil Production from Operational Wells Within the 3,200-Foot Public Health Protection Zone
https://fractracker.org/wp-content/uploads/2023/01/California-Rework-Permits-2023.jpg
541
1500
Kyle Ferrar, MPH
https://fractracker.org/wp-content/uploads/2025/09/2025-Wordmark-Logo.png
Kyle Ferrar, MPH2023-01-24 09:01:352023-01-24 13:21:55Assessment of Rework Permits on Oil Production from Operational Wells Within the 3,200-Foot Public Health Protection Zone https://fractracker.org/wp-content/uploads/2023/01/CalGEM-Q4-2022-Permit-Review.jpg
570
1500
Kyle Ferrar, MPH
https://fractracker.org/wp-content/uploads/2025/09/2025-Wordmark-Logo.png
Kyle Ferrar, MPH2023-01-18 18:01:532023-01-18 18:03:23CalGEM Permit Review Q4 2022: Oil Permit Approvals Show Steep Rise Within Protective Buffer Zones
https://fractracker.org/wp-content/uploads/2023/01/CalGEM-Q4-2022-Permit-Review.jpg
570
1500
Kyle Ferrar, MPH
https://fractracker.org/wp-content/uploads/2025/09/2025-Wordmark-Logo.png
Kyle Ferrar, MPH2023-01-18 18:01:532023-01-18 18:03:23CalGEM Permit Review Q4 2022: Oil Permit Approvals Show Steep Rise Within Protective Buffer Zones https://fractracker.org/wp-content/uploads/2021/03/TAuch_Transportation-RoverPipeline_Construction-EnergyTransferPartners-Woodsfield_OH_May2017.jpg
576
1500
Karen Edelstein
https://fractracker.org/wp-content/uploads/2025/09/2025-Wordmark-Logo.png
Karen Edelstein2022-11-30 17:50:122024-01-22 16:03:23A Contentious Landscape of Pipeline Build-outs in the Eastern US
https://fractracker.org/wp-content/uploads/2021/03/TAuch_Transportation-RoverPipeline_Construction-EnergyTransferPartners-Woodsfield_OH_May2017.jpg
576
1500
Karen Edelstein
https://fractracker.org/wp-content/uploads/2025/09/2025-Wordmark-Logo.png
Karen Edelstein2022-11-30 17:50:122024-01-22 16:03:23A Contentious Landscape of Pipeline Build-outs in the Eastern US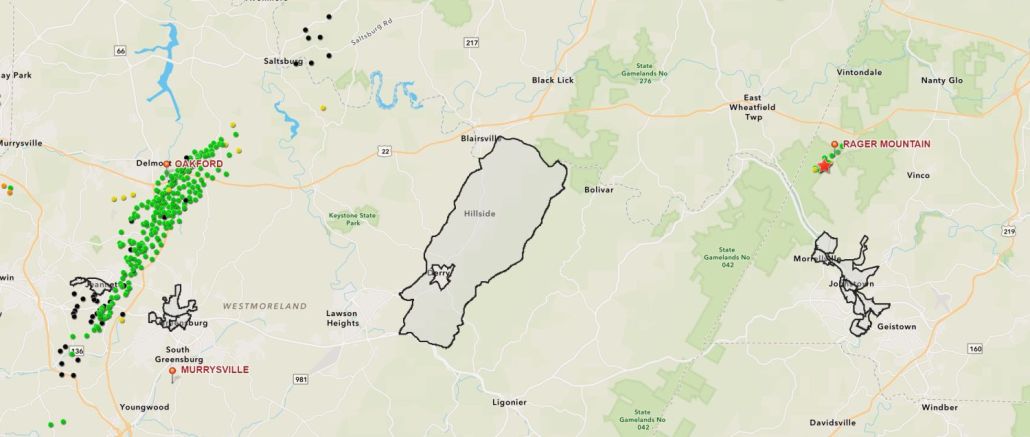 https://fractracker.org/wp-content/uploads/2022/11/Rager-Mountain-Feature.jpg
636
1500
Erica Jackson
https://fractracker.org/wp-content/uploads/2025/09/2025-Wordmark-Logo.png
Erica Jackson2022-11-30 14:12:222023-02-03 13:50:48Major Gas Leak Reveals Risks of Aging Gas Storage Wells in Pennsylvania
https://fractracker.org/wp-content/uploads/2022/11/Rager-Mountain-Feature.jpg
636
1500
Erica Jackson
https://fractracker.org/wp-content/uploads/2025/09/2025-Wordmark-Logo.png
Erica Jackson2022-11-30 14:12:222023-02-03 13:50:48Major Gas Leak Reveals Risks of Aging Gas Storage Wells in Pennsylvania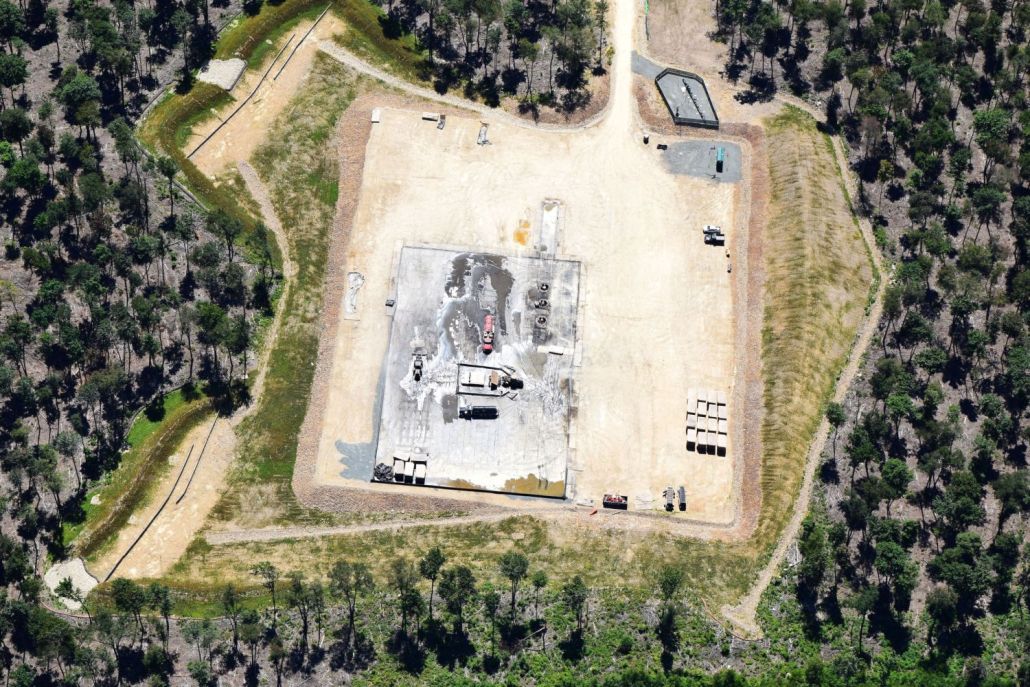 https://fractracker.org/wp-content/uploads/2022/11/DSC_1359_HighRes.jpg
1000
1500
FracTracker Alliance
https://fractracker.org/wp-content/uploads/2025/09/2025-Wordmark-Logo.png
FracTracker Alliance2022-11-23 15:15:112025-03-06 15:40:10Coursing Through Gasland: A Digital Atlas Exploring Natural Gas Development in the Towanda Creek Watershed
https://fractracker.org/wp-content/uploads/2022/11/Fhn3YgeXkAI0QiX.jpg
675
1200
Erica Jackson
https://fractracker.org/wp-content/uploads/2025/09/2025-Wordmark-Logo.png
Erica Jackson2022-11-17 16:43:392022-11-18 13:41:39Falcon Pipeline Online, Begins Operations Following Violations of Clean Streams Law
https://fractracker.org/wp-content/uploads/2022/11/DSC_1359_HighRes.jpg
1000
1500
FracTracker Alliance
https://fractracker.org/wp-content/uploads/2025/09/2025-Wordmark-Logo.png
FracTracker Alliance2022-11-23 15:15:112025-03-06 15:40:10Coursing Through Gasland: A Digital Atlas Exploring Natural Gas Development in the Towanda Creek Watershed
https://fractracker.org/wp-content/uploads/2022/11/Fhn3YgeXkAI0QiX.jpg
675
1200
Erica Jackson
https://fractracker.org/wp-content/uploads/2025/09/2025-Wordmark-Logo.png
Erica Jackson2022-11-17 16:43:392022-11-18 13:41:39Falcon Pipeline Online, Begins Operations Following Violations of Clean Streams Law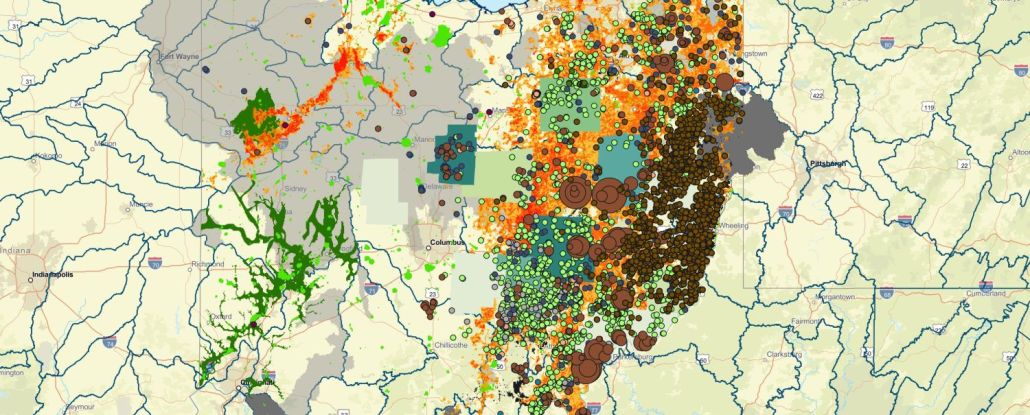 https://fractracker.org/wp-content/uploads/2022/10/Columbus-Source-Water.jpg
605
1500
Guest Author
https://fractracker.org/wp-content/uploads/2025/09/2025-Wordmark-Logo.png
Guest Author2022-10-31 21:39:022022-11-29 14:24:38Synopsis: Risks to the Greater Columbus Water Supply from Oil and Gas Production
https://fractracker.org/wp-content/uploads/2022/10/Columbus-Source-Water.jpg
605
1500
Guest Author
https://fractracker.org/wp-content/uploads/2025/09/2025-Wordmark-Logo.png
Guest Author2022-10-31 21:39:022022-11-29 14:24:38Synopsis: Risks to the Greater Columbus Water Supply from Oil and Gas Production https://fractracker.org/wp-content/uploads/2022/09/DSC_1021_LowRes__1607617394306__w1920-e1663613850641.jpg
667
1500
Ted Auch, PhD
https://fractracker.org/wp-content/uploads/2025/09/2025-Wordmark-Logo.png
Ted Auch, PhD2022-09-19 15:08:172022-11-03 11:56:26Desalination: The Chemical Industry’s Demand for Water in Texas
https://fractracker.org/wp-content/uploads/2022/09/DSC_1021_LowRes__1607617394306__w1920-e1663613850641.jpg
667
1500
Ted Auch, PhD
https://fractracker.org/wp-content/uploads/2025/09/2025-Wordmark-Logo.png
Ted Auch, PhD2022-09-19 15:08:172022-11-03 11:56:26Desalination: The Chemical Industry’s Demand for Water in Texas https://fractracker.org/wp-content/uploads/2021/06/LKrop_infrastructure-offshoredrilling-drillrigs-SantaBarbara-CA_EnvrDefenseCtr_Aug20131-e1663254826557.jpg
178
400
Erica Jackson
https://fractracker.org/wp-content/uploads/2025/09/2025-Wordmark-Logo.png
Erica Jackson2022-09-06 13:32:202022-09-15 11:14:03Take Action in Support of No New Leases
https://fractracker.org/wp-content/uploads/2021/06/LKrop_infrastructure-offshoredrilling-drillrigs-SantaBarbara-CA_EnvrDefenseCtr_Aug20131-e1663254826557.jpg
178
400
Erica Jackson
https://fractracker.org/wp-content/uploads/2025/09/2025-Wordmark-Logo.png
Erica Jackson2022-09-06 13:32:202022-09-15 11:14:03Take Action in Support of No New Leases https://fractracker.org/wp-content/uploads/2022/08/51119572588_132e0366c1_k_1-e1663254774314.jpg
607
1364
Guest Author
https://fractracker.org/wp-content/uploads/2025/09/2025-Wordmark-Logo.png
Guest Author2022-08-31 14:33:482022-09-15 16:29:45Carbon Capture and Storage: Developments in the Law of Pore Space in North Dakota
https://fractracker.org/wp-content/uploads/2022/08/51119572588_132e0366c1_k_1-e1663254774314.jpg
607
1364
Guest Author
https://fractracker.org/wp-content/uploads/2025/09/2025-Wordmark-Logo.png
Guest Author2022-08-31 14:33:482022-09-15 16:29:45Carbon Capture and Storage: Developments in the Law of Pore Space in North Dakota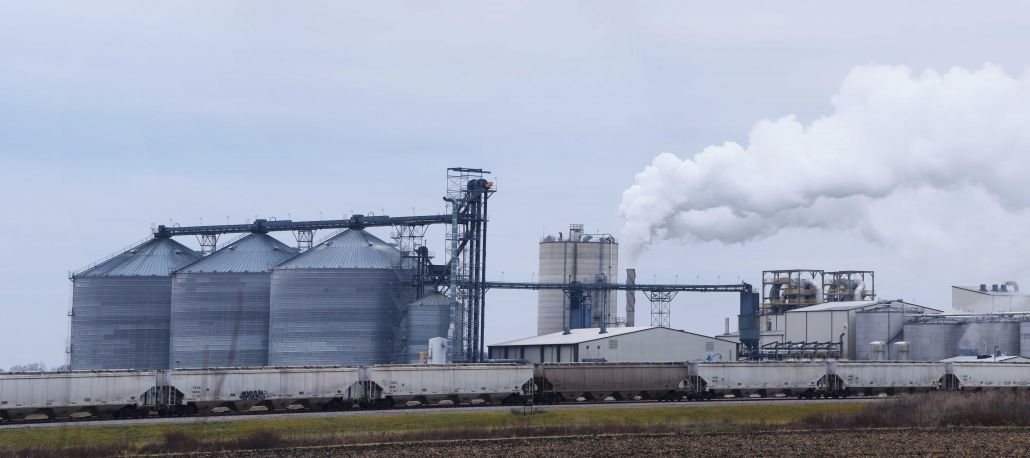 https://fractracker.org/wp-content/uploads/2017/03/DSC_0341_to_0345_LowRes2-e1663254589691.jpg
667
1500
Ted Auch, PhD
https://fractracker.org/wp-content/uploads/2025/09/2025-Wordmark-Logo.png
Ted Auch, PhD2022-08-31 12:54:012023-12-07 14:33:18Carbon Capture and Storage: Industry Connections and Community Impacts
https://fractracker.org/wp-content/uploads/2017/03/DSC_0341_to_0345_LowRes2-e1663254589691.jpg
667
1500
Ted Auch, PhD
https://fractracker.org/wp-content/uploads/2025/09/2025-Wordmark-Logo.png
Ted Auch, PhD2022-08-31 12:54:012023-12-07 14:33:18Carbon Capture and Storage: Industry Connections and Community Impacts https://fractracker.org/wp-content/uploads/2022/08/ExxonMobil-LaBarge-CCUS-e1663254477876.jpg
465
1047
Ted Auch, PhD
https://fractracker.org/wp-content/uploads/2025/09/2025-Wordmark-Logo.png
Ted Auch, PhD2022-08-31 11:19:122022-09-15 11:08:15Carbon Capture and Storage: Fact or Fiction?
https://fractracker.org/wp-content/uploads/2022/08/ExxonMobil-LaBarge-CCUS-e1663254477876.jpg
465
1047
Ted Auch, PhD
https://fractracker.org/wp-content/uploads/2025/09/2025-Wordmark-Logo.png
Ted Auch, PhD2022-08-31 11:19:122022-09-15 11:08:15Carbon Capture and Storage: Fact or Fiction? https://fractracker.org/wp-content/uploads/2022/08/MOV_8837_Moment-e1663254387862.jpg
284
640
Kyle Ferrar, MPH
https://fractracker.org/wp-content/uploads/2025/09/2025-Wordmark-Logo.png
Kyle Ferrar, MPH2022-08-22 09:52:582026-04-28 14:45:28FracTracker Finds Widespread Hydrocarbon Emissions from Active & Idle Oil and Gas Wells and Infrastructure in California
https://fractracker.org/wp-content/uploads/2022/08/MOV_8837_Moment-e1663254387862.jpg
284
640
Kyle Ferrar, MPH
https://fractracker.org/wp-content/uploads/2025/09/2025-Wordmark-Logo.png
Kyle Ferrar, MPH2022-08-22 09:52:582026-04-28 14:45:28FracTracker Finds Widespread Hydrocarbon Emissions from Active & Idle Oil and Gas Wells and Infrastructure in California https://fractracker.org/wp-content/uploads/2022/07/kyle-ferrar-e1663254307641.jpg
636
1430
Kyle Ferrar, MPH
https://fractracker.org/wp-content/uploads/2025/09/2025-Wordmark-Logo.png
Kyle Ferrar, MPH2022-07-29 19:04:322022-09-15 11:05:17California Regulators Approve More Oil Well Permits Amid a Crisis of Leaking Oil Wells that Should be Plugged
https://fractracker.org/wp-content/uploads/2022/07/kyle-ferrar-e1663254307641.jpg
636
1430
Kyle Ferrar, MPH
https://fractracker.org/wp-content/uploads/2025/09/2025-Wordmark-Logo.png
Kyle Ferrar, MPH2022-07-29 19:04:322022-09-15 11:05:17California Regulators Approve More Oil Well Permits Amid a Crisis of Leaking Oil Wells that Should be Plugged https://fractracker.org/wp-content/uploads/2022/06/CCSHFeatureImage.jpg
667
1500
Guest Author
https://fractracker.org/wp-content/uploads/2025/09/2025-Wordmark-Logo.png
Guest Author2022-06-23 15:29:312022-06-30 12:30:43An Insider Take on the Appalachian Hydrogen & CCUS Conference
https://fractracker.org/wp-content/uploads/2022/06/CCSHFeatureImage.jpg
667
1500
Guest Author
https://fractracker.org/wp-content/uploads/2025/09/2025-Wordmark-Logo.png
Guest Author2022-06-23 15:29:312022-06-30 12:30:43An Insider Take on the Appalachian Hydrogen & CCUS Conference https://fractracker.org/wp-content/uploads/2022/06/TAuch_Infrastructure-OilRefinery_DowntownToledo-ToledoOil-LucasCounty-OH_Lighthawk_Sept2021.jpg
667
1500
Matt Kelso, BA
https://fractracker.org/wp-content/uploads/2025/09/2025-Wordmark-Logo.png
Matt Kelso, BA2022-06-21 15:46:522024-06-18 10:53:27Does Hydrogen Have a Role in our Energy Future?
https://fractracker.org/wp-content/uploads/2022/06/TAuch_Infrastructure-OilRefinery_DowntownToledo-ToledoOil-LucasCounty-OH_Lighthawk_Sept2021.jpg
667
1500
Matt Kelso, BA
https://fractracker.org/wp-content/uploads/2025/09/2025-Wordmark-Logo.png
Matt Kelso, BA2022-06-21 15:46:522024-06-18 10:53:27Does Hydrogen Have a Role in our Energy Future?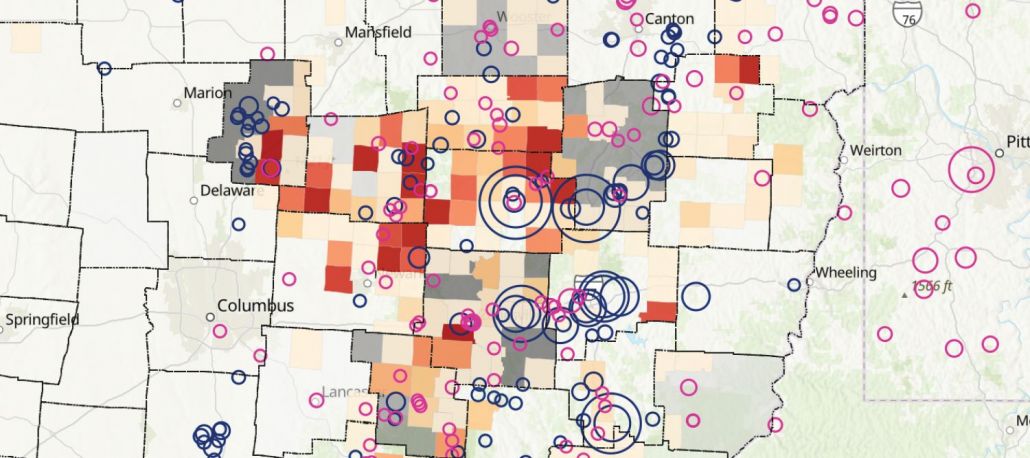 https://fractracker.org/wp-content/uploads/2022/05/Brine-spreading-map-feature-1.jpg
667
1500
Guest Author
https://fractracker.org/wp-content/uploads/2025/09/2025-Wordmark-Logo.png
Guest Author2022-05-13 16:19:112022-08-10 15:43:05Oil and Gas Brine in Ohio
https://fractracker.org/wp-content/uploads/2022/05/Brine-spreading-map-feature-1.jpg
667
1500
Guest Author
https://fractracker.org/wp-content/uploads/2025/09/2025-Wordmark-Logo.png
Guest Author2022-05-13 16:19:112022-08-10 15:43:05Oil and Gas Brine in Ohio https://fractracker.org/wp-content/uploads/2022/05/DustingHighVolDirtyFilter-feature.jpg
667
1500
Guest Author
https://fractracker.org/wp-content/uploads/2025/09/2025-Wordmark-Logo.png
Guest Author2022-05-03 09:37:492022-05-03 09:37:49PA Environment Digest Blog: Conventional Oil & Gas Drillers Dispose Of Drill Cuttings By ‘Dusting’
https://fractracker.org/wp-content/uploads/2022/05/DustingHighVolDirtyFilter-feature.jpg
667
1500
Guest Author
https://fractracker.org/wp-content/uploads/2025/09/2025-Wordmark-Logo.png
Guest Author2022-05-03 09:37:492022-05-03 09:37:49PA Environment Digest Blog: Conventional Oil & Gas Drillers Dispose Of Drill Cuttings By ‘Dusting’ https://fractracker.org/wp-content/uploads/2022/04/TAuch_Cultural-Harvey_FamilyFarm_NEXUS_Pipeline-DTEEnergy_Enbridge-ChippewaLake_MedinaCounty_OH_May20183-feature.jpg
667
1500
Ted Auch, PhD
https://fractracker.org/wp-content/uploads/2025/09/2025-Wordmark-Logo.png
Ted Auch, PhD2022-04-28 14:12:552022-04-28 14:12:55Real Talk on Pipelines
https://fractracker.org/wp-content/uploads/2022/04/TAuch_Cultural-Harvey_FamilyFarm_NEXUS_Pipeline-DTEEnergy_Enbridge-ChippewaLake_MedinaCounty_OH_May20183-feature.jpg
667
1500
Ted Auch, PhD
https://fractracker.org/wp-content/uploads/2025/09/2025-Wordmark-Logo.png
Ted Auch, PhD2022-04-28 14:12:552022-04-28 14:12:55Real Talk on Pipelines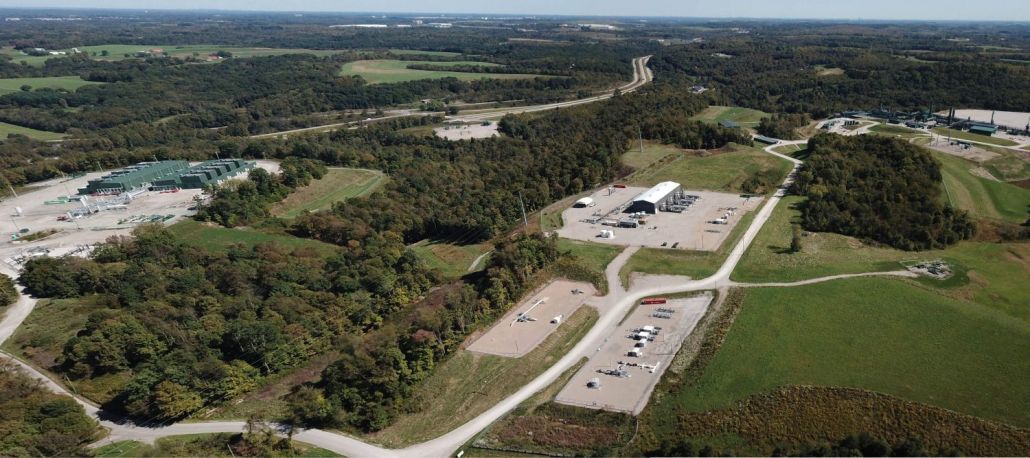 https://fractracker.org/wp-content/uploads/2022/04/TAuch_Infrastructure-Compressor_Cryogenic_Complex-MarkWest_EnergyTransfer-WashingtonCounty-PA_Sept2021-feature.jpg
667
1500
Matt Kelso, BA
https://fractracker.org/wp-content/uploads/2025/09/2025-Wordmark-Logo.png
Matt Kelso, BA2022-04-28 13:37:312023-03-09 14:03:402021 Production from Pennsylvania’s Oil and Gas Wells
https://fractracker.org/wp-content/uploads/2022/04/TAuch_Infrastructure-Compressor_Cryogenic_Complex-MarkWest_EnergyTransfer-WashingtonCounty-PA_Sept2021-feature.jpg
667
1500
Matt Kelso, BA
https://fractracker.org/wp-content/uploads/2025/09/2025-Wordmark-Logo.png
Matt Kelso, BA2022-04-28 13:37:312023-03-09 14:03:402021 Production from Pennsylvania’s Oil and Gas Wells https://fractracker.org/wp-content/uploads/2022/04/Russia-Ukraine-Energy-feature.jpg
667
1500
FracTracker Alliance
https://fractracker.org/wp-content/uploads/2025/09/2025-Wordmark-Logo.png
FracTracker Alliance2022-04-20 13:25:452022-04-20 17:23:17Mapping Energy Systems Impacted by the Russia-Ukraine War
https://fractracker.org/wp-content/uploads/2022/04/Russia-Ukraine-Energy-feature.jpg
667
1500
FracTracker Alliance
https://fractracker.org/wp-content/uploads/2025/09/2025-Wordmark-Logo.png
FracTracker Alliance2022-04-20 13:25:452022-04-20 17:23:17Mapping Energy Systems Impacted by the Russia-Ukraine War https://fractracker.org/wp-content/uploads/2022/04/IMG_5940-1.jpg
1125
1500
Erica Jackson
https://fractracker.org/wp-content/uploads/2025/09/2025-Wordmark-Logo.png
Erica Jackson2022-04-11 16:48:092022-04-20 13:23:14Dimock residents working to protect water from a new threat: fracking waste
https://fractracker.org/wp-content/uploads/2022/04/IMG_5940-1.jpg
1125
1500
Erica Jackson
https://fractracker.org/wp-content/uploads/2025/09/2025-Wordmark-Logo.png
Erica Jackson2022-04-11 16:48:092022-04-20 13:23:14Dimock residents working to protect water from a new threat: fracking waste https://fractracker.org/wp-content/uploads/2022/03/KFerrar-feature-CAsetbacks2022.jpg
878
1500
Kyle Ferrar, MPH
https://fractracker.org/wp-content/uploads/2025/09/2025-Wordmark-Logo.png
Kyle Ferrar, MPH2022-04-06 12:01:332023-08-24 19:08:53Implications of a 3,200-foot Setback in California
https://fractracker.org/wp-content/uploads/2022/03/KFerrar-feature-CAsetbacks2022.jpg
878
1500
Kyle Ferrar, MPH
https://fractracker.org/wp-content/uploads/2025/09/2025-Wordmark-Logo.png
Kyle Ferrar, MPH2022-04-06 12:01:332023-08-24 19:08:53Implications of a 3,200-foot Setback in California https://fractracker.org/wp-content/uploads/2022/03/BLenker_infrastructure-oilrig-southLA-CA_Oct20173.jpg
795
1500
Kyle Ferrar, MPH
https://fractracker.org/wp-content/uploads/2025/09/2025-Wordmark-Logo.png
Kyle Ferrar, MPH2022-03-15 16:32:032022-03-15 18:00:00New Trends in Drilling Permit Approvals Take Shape in CA
https://fractracker.org/wp-content/uploads/2022/03/BLenker_infrastructure-oilrig-southLA-CA_Oct20173.jpg
795
1500
Kyle Ferrar, MPH
https://fractracker.org/wp-content/uploads/2025/09/2025-Wordmark-Logo.png
Kyle Ferrar, MPH2022-03-15 16:32:032022-03-15 18:00:00New Trends in Drilling Permit Approvals Take Shape in CA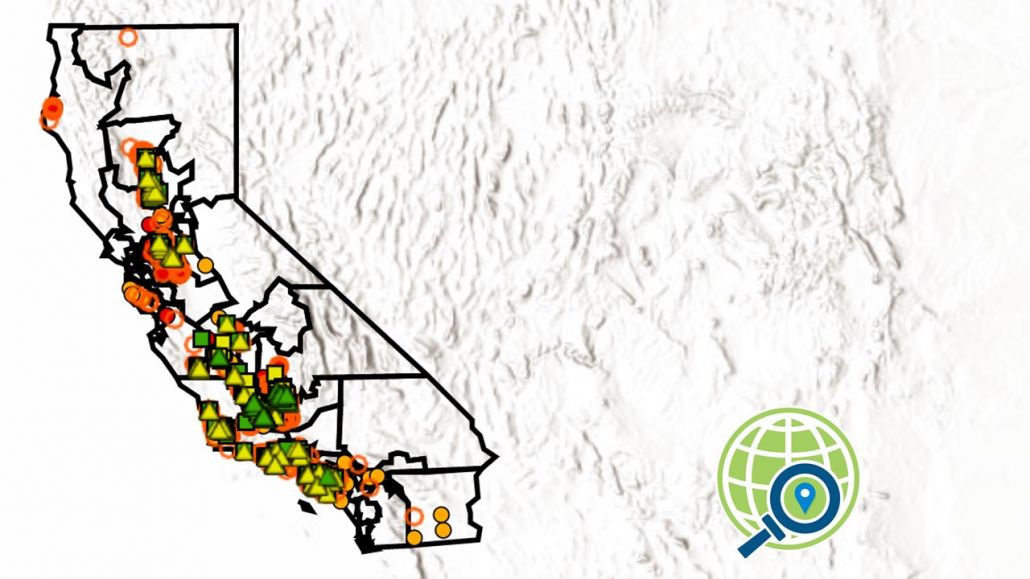 https://fractracker.org/wp-content/uploads/2022/03/KFerrar-CAlegislative-analysis_March2022.jpg
720
1280
Kyle Ferrar, MPH
https://fractracker.org/wp-content/uploads/2025/09/2025-Wordmark-Logo.png
Kyle Ferrar, MPH2022-03-14 15:18:402022-03-14 15:18:40Oil and Gas Drilling in California Legislative Districts
https://fractracker.org/wp-content/uploads/2022/03/KFerrar-CAlegislative-analysis_March2022.jpg
720
1280
Kyle Ferrar, MPH
https://fractracker.org/wp-content/uploads/2025/09/2025-Wordmark-Logo.png
Kyle Ferrar, MPH2022-03-14 15:18:402022-03-14 15:18:40Oil and Gas Drilling in California Legislative Districts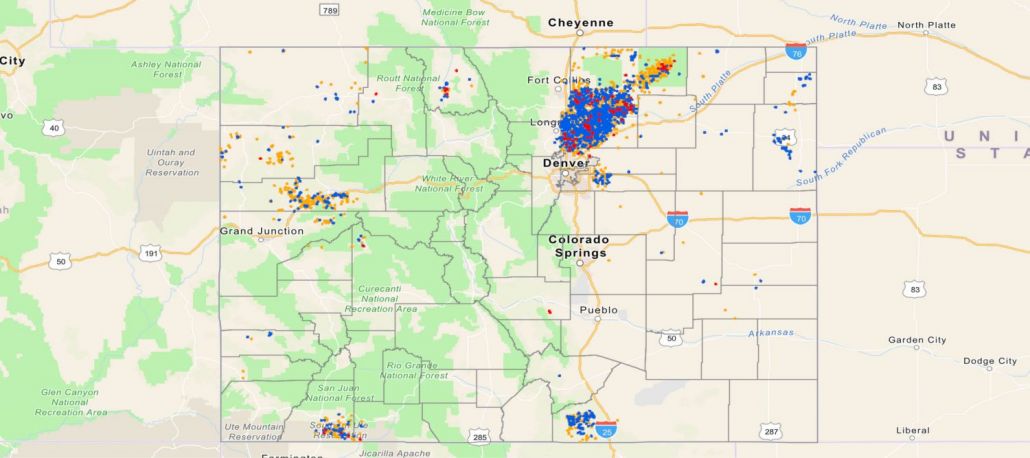 https://fractracker.org/wp-content/uploads/2022/01/PFAS-wells-in-Colorado-Feature.jpg
667
1500
Matt Kelso, BA
https://fractracker.org/wp-content/uploads/2025/09/2025-Wordmark-Logo.png
Matt Kelso, BA2022-01-31 16:36:332022-01-31 16:36:33New Report: Fracking with “Forever Chemicals” in Colorado
https://fractracker.org/wp-content/uploads/2022/01/PFAS-wells-in-Colorado-Feature.jpg
667
1500
Matt Kelso, BA
https://fractracker.org/wp-content/uploads/2025/09/2025-Wordmark-Logo.png
Matt Kelso, BA2022-01-31 16:36:332022-01-31 16:36:33New Report: Fracking with “Forever Chemicals” in Colorado https://fractracker.org/wp-content/uploads/2022/01/FeatImage_MK.jpg
935
1500
Matt Kelso, BA
https://fractracker.org/wp-content/uploads/2025/09/2025-Wordmark-Logo.png
Matt Kelso, BA2022-01-20 15:32:142022-01-20 15:32:14Introducing: FracTracker’s comprehensive new Pennsylvania map!
https://fractracker.org/wp-content/uploads/2022/01/FeatImage_MK.jpg
935
1500
Matt Kelso, BA
https://fractracker.org/wp-content/uploads/2025/09/2025-Wordmark-Logo.png
Matt Kelso, BA2022-01-20 15:32:142022-01-20 15:32:14Introducing: FracTracker’s comprehensive new Pennsylvania map! https://fractracker.org/wp-content/uploads/2021/12/173695136_1422048161521006_7197500259062906334_n.jpg
667
1500
Erica Jackson
https://fractracker.org/wp-content/uploads/2025/09/2025-Wordmark-Logo.png
Erica Jackson2021-12-01 15:27:402021-12-01 15:27:40New Letter from Federal Regulators Regarding how the Falcon has Been Investigated
https://fractracker.org/wp-content/uploads/2021/12/173695136_1422048161521006_7197500259062906334_n.jpg
667
1500
Erica Jackson
https://fractracker.org/wp-content/uploads/2025/09/2025-Wordmark-Logo.png
Erica Jackson2021-12-01 15:27:402021-12-01 15:27:40New Letter from Federal Regulators Regarding how the Falcon has Been Investigated https://fractracker.org/wp-content/uploads/2021/11/TAuch_Infrastructure-naturalgas-powerplant-construction-Caithness-GuernseyCounty-OH_April2021.jpg
667
1500
Guest Author
https://fractracker.org/wp-content/uploads/2025/09/2025-Wordmark-Logo.png
Guest Author2021-12-01 15:20:152022-01-04 17:53:55US Army Corps Muskingum Watershed Plan ignores local concerns of oil and gas effects
https://fractracker.org/wp-content/uploads/2021/11/TAuch_Infrastructure-naturalgas-powerplant-construction-Caithness-GuernseyCounty-OH_April2021.jpg
667
1500
Guest Author
https://fractracker.org/wp-content/uploads/2025/09/2025-Wordmark-Logo.png
Guest Author2021-12-01 15:20:152022-01-04 17:53:55US Army Corps Muskingum Watershed Plan ignores local concerns of oil and gas effects https://fractracker.org/wp-content/uploads/2021/11/TAuch_Plastics_Refinery_TankFarm_Terminal-Trafigura_CorpusChristiPolymers_Valero_Citgo_FlintHillsResources-CorpusChristi_TX_LightHawk_Nov2019-feature.jpg
667
1500
Ted Auch, PhD
https://fractracker.org/wp-content/uploads/2025/09/2025-Wordmark-Logo.png
Ted Auch, PhD2021-11-05 09:43:472021-11-05 09:47:30Southeastern Texas Petrochemical Industry Needs 318 Billion Gallons of Water, but the US EPA Says Not So Fast
https://fractracker.org/wp-content/uploads/2021/11/TAuch_Plastics_Refinery_TankFarm_Terminal-Trafigura_CorpusChristiPolymers_Valero_Citgo_FlintHillsResources-CorpusChristi_TX_LightHawk_Nov2019-feature.jpg
667
1500
Ted Auch, PhD
https://fractracker.org/wp-content/uploads/2025/09/2025-Wordmark-Logo.png
Ted Auch, PhD2021-11-05 09:43:472021-11-05 09:47:30Southeastern Texas Petrochemical Industry Needs 318 Billion Gallons of Water, but the US EPA Says Not So Fast https://fractracker.org/wp-content/uploads/2021/10/Chickahominy-feature.jpg
667
1500
Karen Edelstein
https://fractracker.org/wp-content/uploads/2025/09/2025-Wordmark-Logo.png
Karen Edelstein2021-11-01 13:29:122021-12-17 11:53:41Chickahominy Pipeline project tries to exploit an apparent regulatory loophole
https://fractracker.org/wp-content/uploads/2021/10/Chickahominy-feature.jpg
667
1500
Karen Edelstein
https://fractracker.org/wp-content/uploads/2025/09/2025-Wordmark-Logo.png
Karen Edelstein2021-11-01 13:29:122021-12-17 11:53:41Chickahominy Pipeline project tries to exploit an apparent regulatory loophole https://fractracker.org/wp-content/uploads/2021/10/Mariner-East-2-feature.jpg
667
1500
Erica Jackson
https://fractracker.org/wp-content/uploads/2025/09/2025-Wordmark-Logo.png
Erica Jackson2021-10-29 13:02:432021-11-01 12:17:20Map Update on Criminal Charges Facing Mariner East 2 Pipeline
https://fractracker.org/wp-content/uploads/2021/10/Mariner-East-2-feature.jpg
667
1500
Erica Jackson
https://fractracker.org/wp-content/uploads/2025/09/2025-Wordmark-Logo.png
Erica Jackson2021-10-29 13:02:432021-11-01 12:17:20Map Update on Criminal Charges Facing Mariner East 2 Pipeline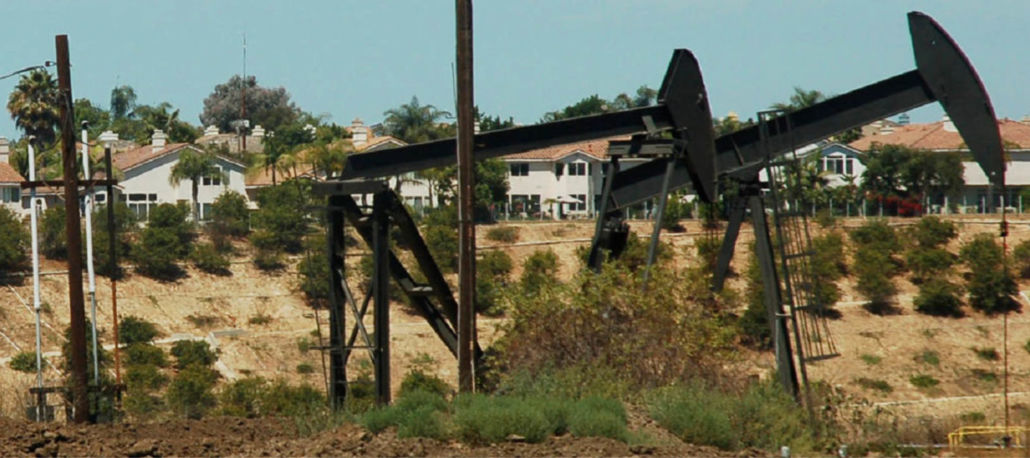 https://fractracker.org/wp-content/uploads/2021/09/NRDC-Urban-Drilling-feature.jpg
667
1500
Kyle Ferrar, MPH
https://fractracker.org/wp-content/uploads/2025/09/2025-Wordmark-Logo.png
Kyle Ferrar, MPH2021-09-14 14:26:442026-04-28 14:29:26It’s Time to Stop Urban Oil Drilling in Los Angeles
https://fractracker.org/wp-content/uploads/2021/09/NRDC-Urban-Drilling-feature.jpg
667
1500
Kyle Ferrar, MPH
https://fractracker.org/wp-content/uploads/2025/09/2025-Wordmark-Logo.png
Kyle Ferrar, MPH2021-09-14 14:26:442026-04-28 14:29:26It’s Time to Stop Urban Oil Drilling in Los Angeles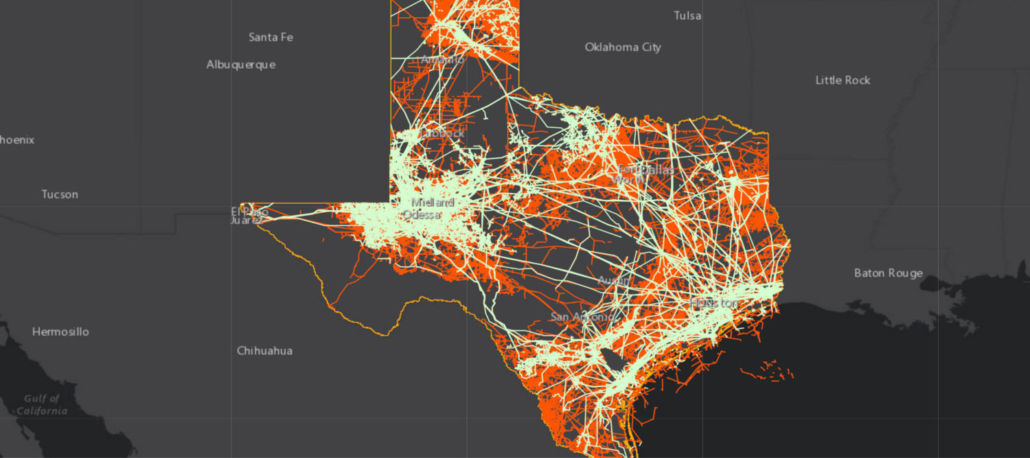 https://fractracker.org/wp-content/uploads/2021/08/Texas-Infrastructure-Feature-.jpg
667
1500
Intern FracTracker
https://fractracker.org/wp-content/uploads/2025/09/2025-Wordmark-Logo.png
Intern FracTracker2021-09-14 08:00:002022-01-24 17:49:20Infrastructure Networks in Texas
https://fractracker.org/wp-content/uploads/2021/08/Texas-Infrastructure-Feature-.jpg
667
1500
Intern FracTracker
https://fractracker.org/wp-content/uploads/2025/09/2025-Wordmark-Logo.png
Intern FracTracker2021-09-14 08:00:002022-01-24 17:49:20Infrastructure Networks in Texas https://fractracker.org/wp-content/uploads/2021/09/National-Prison-Strike-poster-feature.jpg
667
1500
Kyle Ferrar, MPH
https://fractracker.org/wp-content/uploads/2025/09/2025-Wordmark-Logo.png
Kyle Ferrar, MPH2021-09-09 08:00:082021-09-08 17:30:46California Prisons are Within 2,500’ of Oil and Gas Extraction
https://fractracker.org/wp-content/uploads/2021/09/National-Prison-Strike-poster-feature.jpg
667
1500
Kyle Ferrar, MPH
https://fractracker.org/wp-content/uploads/2025/09/2025-Wordmark-Logo.png
Kyle Ferrar, MPH2021-09-09 08:00:082021-09-08 17:30:46California Prisons are Within 2,500’ of Oil and Gas Extraction https://fractracker.org/wp-content/uploads/2021/08/kemap.jpg
400
900
Karen Edelstein
https://fractracker.org/wp-content/uploads/2025/09/2025-Wordmark-Logo.png
Karen Edelstein2021-08-26 11:19:442021-08-26 15:08:04New power plant proposal called senseless and wasteful by climate groups
https://fractracker.org/wp-content/uploads/2021/08/kemap.jpg
400
900
Karen Edelstein
https://fractracker.org/wp-content/uploads/2025/09/2025-Wordmark-Logo.png
Karen Edelstein2021-08-26 11:19:442021-08-26 15:08:04New power plant proposal called senseless and wasteful by climate groups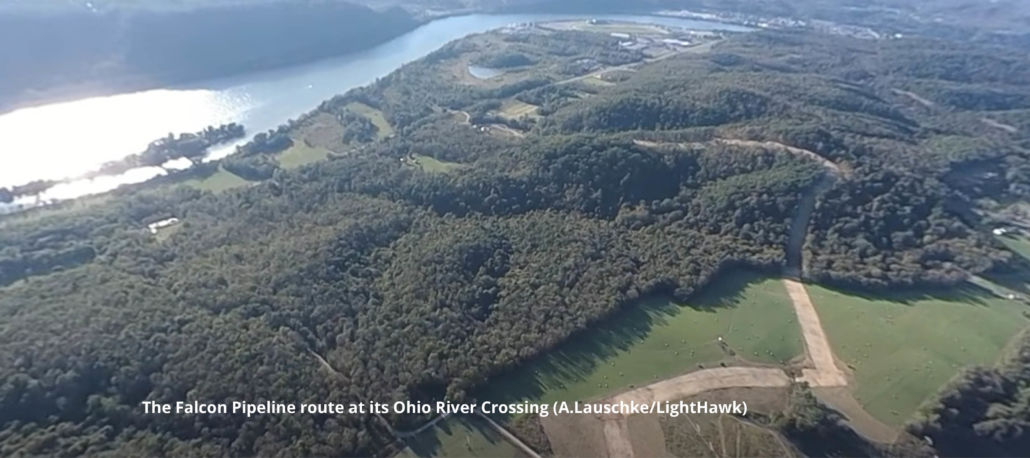 https://fractracker.org/wp-content/uploads/2021/03/Falcon-Ohio-River-Crossing-Feature-A.LauschkeLightHawk-scaled.jpg
667
1500
Erica Jackson
https://fractracker.org/wp-content/uploads/2025/09/2025-Wordmark-Logo.png
Erica Jackson2021-08-24 07:15:232021-08-23 17:30:12Ongoing Safety Concerns over Shell’s Falcon Pipeline
https://fractracker.org/wp-content/uploads/2021/03/Falcon-Ohio-River-Crossing-Feature-A.LauschkeLightHawk-scaled.jpg
667
1500
Erica Jackson
https://fractracker.org/wp-content/uploads/2025/09/2025-Wordmark-Logo.png
Erica Jackson2021-08-24 07:15:232021-08-23 17:30:12Ongoing Safety Concerns over Shell’s Falcon Pipeline https://fractracker.org/wp-content/uploads/2021/08/BLenker_infrastructure-oilrig-southLA-CA_Oct2017-feature.jpg
667
1500
Kyle Ferrar, MPH
https://fractracker.org/wp-content/uploads/2025/09/2025-Wordmark-Logo.png
Kyle Ferrar, MPH2021-08-05 16:38:392021-08-05 16:38:39New Neighborhood Drilling Permits Issued While California Fails to Act on Public Health Rules
https://fractracker.org/wp-content/uploads/2021/08/BLenker_infrastructure-oilrig-southLA-CA_Oct2017-feature.jpg
667
1500
Kyle Ferrar, MPH
https://fractracker.org/wp-content/uploads/2025/09/2025-Wordmark-Logo.png
Kyle Ferrar, MPH2021-08-05 16:38:392021-08-05 16:38:39New Neighborhood Drilling Permits Issued While California Fails to Act on Public Health Rules https://fractracker.org/wp-content/uploads/2021/08/Bitcoin-feature.jpg
667
1500
Karen Edelstein
https://fractracker.org/wp-content/uploads/2025/09/2025-Wordmark-Logo.png
Karen Edelstein2021-08-02 17:05:372022-01-04 10:48:28The world is watching as bitcoin battle brews in the US
https://fractracker.org/wp-content/uploads/2021/08/Bitcoin-feature.jpg
667
1500
Karen Edelstein
https://fractracker.org/wp-content/uploads/2025/09/2025-Wordmark-Logo.png
Karen Edelstein2021-08-02 17:05:372022-01-04 10:48:28The world is watching as bitcoin battle brews in the US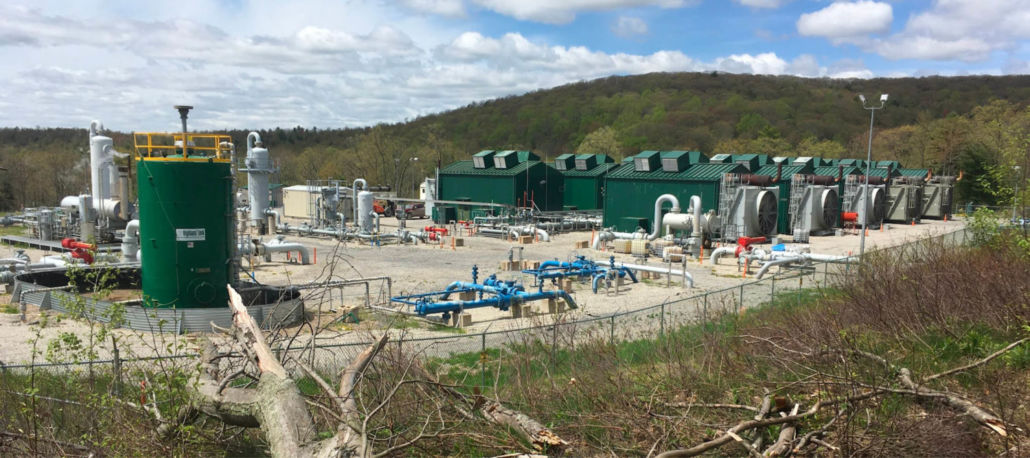 https://fractracker.org/wp-content/uploads/2021/07/Lycoming-feature.jpg
667
1500
FracTracker Alliance
https://fractracker.org/wp-content/uploads/2025/09/2025-Wordmark-Logo.png
FracTracker Alliance2021-07-27 09:58:142021-07-28 11:23:19Lycoming Watershed Digital Atlas
https://fractracker.org/wp-content/uploads/2021/07/Lycoming-feature.jpg
667
1500
FracTracker Alliance
https://fractracker.org/wp-content/uploads/2025/09/2025-Wordmark-Logo.png
FracTracker Alliance2021-07-27 09:58:142021-07-28 11:23:19Lycoming Watershed Digital Atlas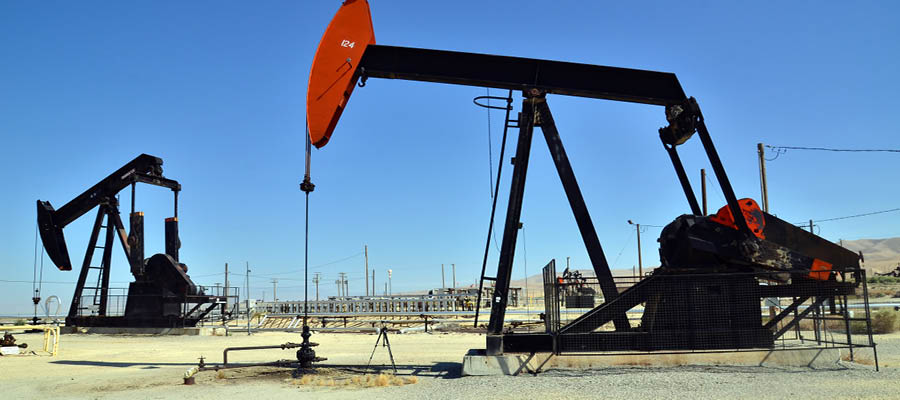 https://fractracker.org/wp-content/uploads/2021/07/California-oil-drilling-feature.jpg
400
900
Kyle Ferrar, MPH
https://fractracker.org/wp-content/uploads/2025/09/2025-Wordmark-Logo.png
Kyle Ferrar, MPH2021-07-26 13:56:312021-07-26 14:03:09California Oil & Gas Drilling Permits Drop in Response to Decreased Permit Applications to CalGEM
https://fractracker.org/wp-content/uploads/2021/07/California-oil-fields-feature.jpg
667
1500
Kyle Ferrar, MPH
https://fractracker.org/wp-content/uploads/2025/09/2025-Wordmark-Logo.png
Kyle Ferrar, MPH2021-07-20 16:32:222021-07-20 17:36:11California Denies Well Stimulation Permits
https://fractracker.org/wp-content/uploads/2021/07/California-oil-drilling-feature.jpg
400
900
Kyle Ferrar, MPH
https://fractracker.org/wp-content/uploads/2025/09/2025-Wordmark-Logo.png
Kyle Ferrar, MPH2021-07-26 13:56:312021-07-26 14:03:09California Oil & Gas Drilling Permits Drop in Response to Decreased Permit Applications to CalGEM
https://fractracker.org/wp-content/uploads/2021/07/California-oil-fields-feature.jpg
667
1500
Kyle Ferrar, MPH
https://fractracker.org/wp-content/uploads/2025/09/2025-Wordmark-Logo.png
Kyle Ferrar, MPH2021-07-20 16:32:222021-07-20 17:36:11California Denies Well Stimulation Permits https://fractracker.org/wp-content/uploads/2021/07/PSR-PFAS-feature.jpg
667
1500
Matt Kelso, BA
https://fractracker.org/wp-content/uploads/2025/09/2025-Wordmark-Logo.png
Matt Kelso, BA2021-07-15 07:55:282021-07-15 07:55:28Mapping PFAS “Forever Chemicals” in Oil & Gas Operations
https://fractracker.org/wp-content/uploads/2021/07/PSR-PFAS-feature.jpg
667
1500
Matt Kelso, BA
https://fractracker.org/wp-content/uploads/2025/09/2025-Wordmark-Logo.png
Matt Kelso, BA2021-07-15 07:55:282021-07-15 07:55:28Mapping PFAS “Forever Chemicals” in Oil & Gas Operations https://fractracker.org/wp-content/uploads/2021/06/National-Map-2021-Feature.jpg
667
1500
Erica Jackson
https://fractracker.org/wp-content/uploads/2025/09/2025-Wordmark-Logo.png
Erica Jackson2021-06-30 08:00:252022-05-02 15:24:21Updated National Energy and Petrochemical Map
https://fractracker.org/wp-content/uploads/2021/06/National-Map-2021-Feature.jpg
667
1500
Erica Jackson
https://fractracker.org/wp-content/uploads/2025/09/2025-Wordmark-Logo.png
Erica Jackson2021-06-30 08:00:252022-05-02 15:24:21Updated National Energy and Petrochemical Map https://fractracker.org/wp-content/uploads/2021/06/TAuch_Infrastructure-Hopedale_Cryogenic_Plant-MarkWest_Energy-HarrisonCounty-OH_Nov2020-Feature.jpg
667
1500
Ted Auch, PhD
https://fractracker.org/wp-content/uploads/2025/09/2025-Wordmark-Logo.png
Ted Auch, PhD2021-06-11 12:26:292021-07-01 11:12:42Ohio, West Virginia, Pennsylvania Fracking Story Map
https://fractracker.org/wp-content/uploads/2021/06/TAuch_Infrastructure-Hopedale_Cryogenic_Plant-MarkWest_Energy-HarrisonCounty-OH_Nov2020-Feature.jpg
667
1500
Ted Auch, PhD
https://fractracker.org/wp-content/uploads/2025/09/2025-Wordmark-Logo.png
Ted Auch, PhD2021-06-11 12:26:292021-07-01 11:12:42Ohio, West Virginia, Pennsylvania Fracking Story Map https://fractracker.org/wp-content/uploads/2021/06/Myers-ClassII-InjectionWell-Stallion-SWD-VikingResources-PortageCounty-OH_March2021-feature.jpg
667
1500
Ted Auch, PhD
https://fractracker.org/wp-content/uploads/2025/09/2025-Wordmark-Logo.png
Ted Auch, PhD2021-06-03 12:51:592021-06-11 14:02:03Ohio & Fracking Waste: The Case for Better Waste Management
https://fractracker.org/wp-content/uploads/2021/06/Myers-ClassII-InjectionWell-Stallion-SWD-VikingResources-PortageCounty-OH_March2021-feature.jpg
667
1500
Ted Auch, PhD
https://fractracker.org/wp-content/uploads/2025/09/2025-Wordmark-Logo.png
Ted Auch, PhD2021-06-03 12:51:592021-06-11 14:02:03Ohio & Fracking Waste: The Case for Better Waste Management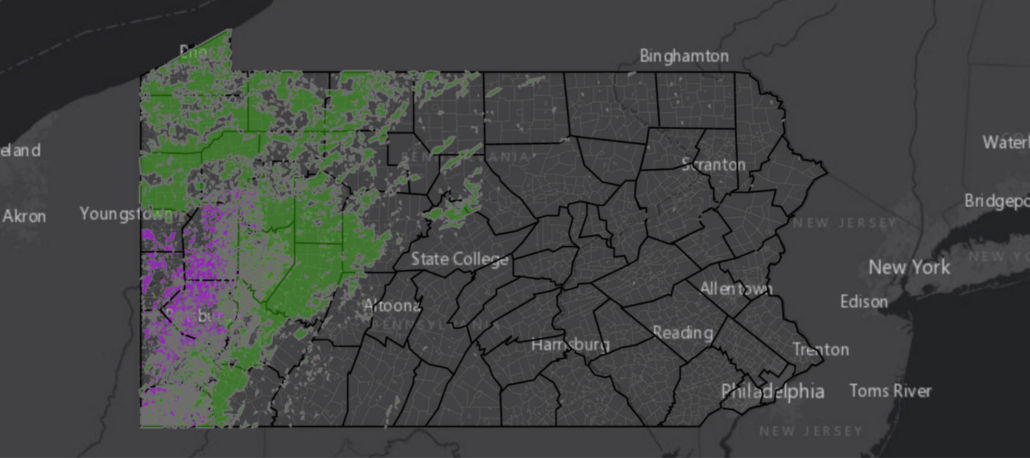 https://fractracker.org/wp-content/uploads/2021/05/Pennsylvania-conventional-wells-feature.jpg
667
1500
Erica Jackson
https://fractracker.org/wp-content/uploads/2025/09/2025-Wordmark-Logo.png
Erica Jackson2021-05-27 17:57:282025-04-11 17:29:29Pennsylvania Conventional Well Map Update
https://fractracker.org/wp-content/uploads/2021/05/Pennsylvania-conventional-wells-feature.jpg
667
1500
Erica Jackson
https://fractracker.org/wp-content/uploads/2025/09/2025-Wordmark-Logo.png
Erica Jackson2021-05-27 17:57:282025-04-11 17:29:29Pennsylvania Conventional Well Map Update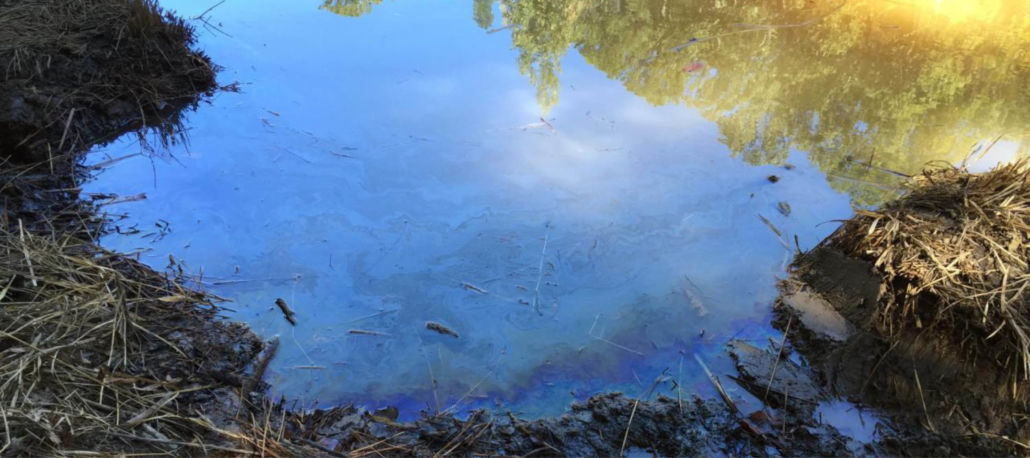 EPA
https://fractracker.org/wp-content/uploads/2021/05/Colonial-pipeline-spill-feature.jpg
667
1500
Karen Edelstein
https://fractracker.org/wp-content/uploads/2025/09/2025-Wordmark-Logo.png
Karen Edelstein2021-05-26 07:00:272023-07-18 10:31:34Impacts of 2020 Colonial Pipeline Rupture Continue to Grow
EPA
https://fractracker.org/wp-content/uploads/2021/05/Colonial-pipeline-spill-feature.jpg
667
1500
Karen Edelstein
https://fractracker.org/wp-content/uploads/2025/09/2025-Wordmark-Logo.png
Karen Edelstein2021-05-26 07:00:272023-07-18 10:31:34Impacts of 2020 Colonial Pipeline Rupture Continue to Grow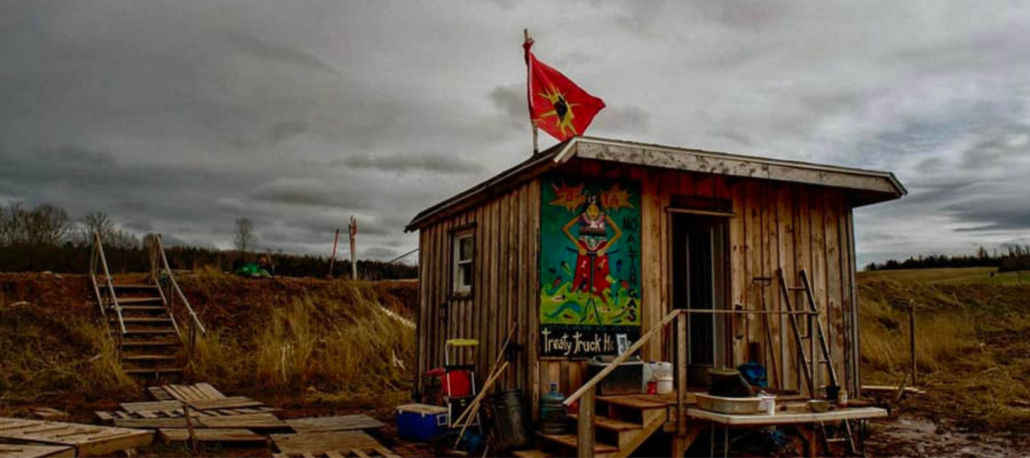 Jared Durelle
https://fractracker.org/wp-content/uploads/2021/05/Stop-Alton-Gas-Treaty-Truckhouse-feature-photo-by-Jared-Durelle.jpg
667
1500
Karen Edelstein
https://fractracker.org/wp-content/uploads/2025/09/2025-Wordmark-Logo.png
Karen Edelstein2021-05-20 14:50:522022-01-10 17:07:38Gas Storage Plan vs. Indigenous Rights in Nova Scotia
Jared Durelle
https://fractracker.org/wp-content/uploads/2021/05/Stop-Alton-Gas-Treaty-Truckhouse-feature-photo-by-Jared-Durelle.jpg
667
1500
Karen Edelstein
https://fractracker.org/wp-content/uploads/2025/09/2025-Wordmark-Logo.png
Karen Edelstein2021-05-20 14:50:522022-01-10 17:07:38Gas Storage Plan vs. Indigenous Rights in Nova Scotia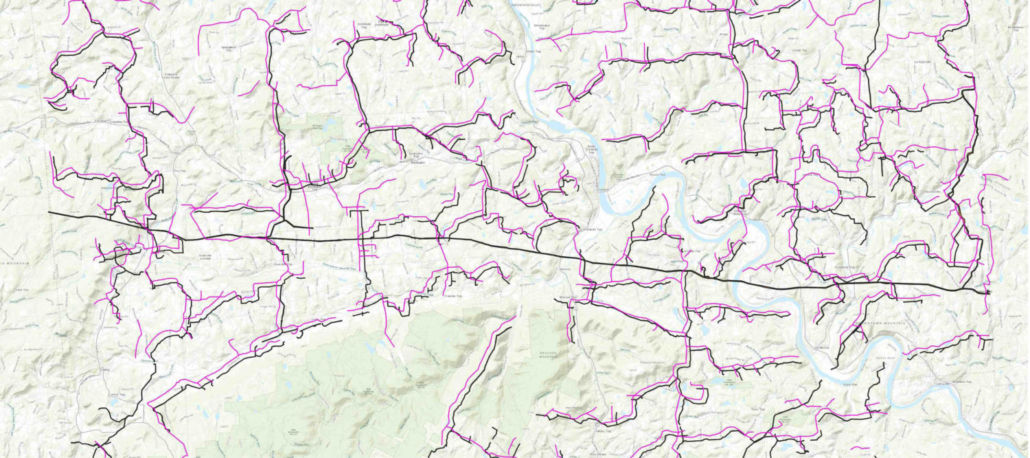 https://fractracker.org/wp-content/uploads/2021/05/Bradford-County-PA-gathering-lines-feature.jpg
667
1500
Intern FracTracker
https://fractracker.org/wp-content/uploads/2025/09/2025-Wordmark-Logo.png
Intern FracTracker2021-05-19 10:51:122021-05-20 14:41:22Mapping Gathering Lines in Bradford County, Pennsylvania
https://fractracker.org/wp-content/uploads/2021/05/Bradford-County-PA-gathering-lines-feature.jpg
667
1500
Intern FracTracker
https://fractracker.org/wp-content/uploads/2025/09/2025-Wordmark-Logo.png
Intern FracTracker2021-05-19 10:51:122021-05-20 14:41:22Mapping Gathering Lines in Bradford County, Pennsylvania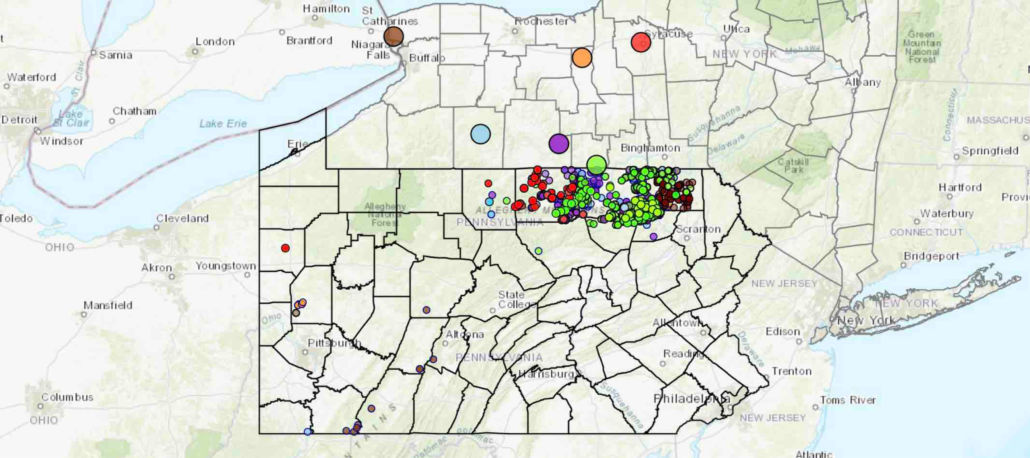 https://fractracker.org/wp-content/uploads/2021/04/PA-Unconventional-Drilling-Waste-Disposal-in-NYS-2011-20-feature-scaled.jpg
667
1500
Karen Edelstein
https://fractracker.org/wp-content/uploads/2025/09/2025-Wordmark-Logo.png
Karen Edelstein2021-04-20 14:05:162021-05-19 10:54:04Trends in fracking waste coming to New York State from Pennsylvania
https://fractracker.org/wp-content/uploads/2021/04/49770601811_6cc7e18996_k.jpg
716
1500
Matt Kelso, BA
https://fractracker.org/wp-content/uploads/2025/09/2025-Wordmark-Logo.png
Matt Kelso, BA2021-04-14 15:01:522021-04-26 17:02:402021 Pipeline Incidents Update: Safety Record Not Improving
https://fractracker.org/wp-content/uploads/2021/04/PA-Unconventional-Drilling-Waste-Disposal-in-NYS-2011-20-feature-scaled.jpg
667
1500
Karen Edelstein
https://fractracker.org/wp-content/uploads/2025/09/2025-Wordmark-Logo.png
Karen Edelstein2021-04-20 14:05:162021-05-19 10:54:04Trends in fracking waste coming to New York State from Pennsylvania
https://fractracker.org/wp-content/uploads/2021/04/49770601811_6cc7e18996_k.jpg
716
1500
Matt Kelso, BA
https://fractracker.org/wp-content/uploads/2025/09/2025-Wordmark-Logo.png
Matt Kelso, BA2021-04-14 15:01:522021-04-26 17:02:402021 Pipeline Incidents Update: Safety Record Not Improving https://fractracker.org/wp-content/uploads/2021/04/New-York-State-wells-feature.jpg
833
1875
Karen Edelstein
https://fractracker.org/wp-content/uploads/2025/09/2025-Wordmark-Logo.png
Karen Edelstein2021-04-01 11:10:062021-04-15 14:08:35New York State Oil & Gas Well Drilling: Patterns Over Time
https://fractracker.org/wp-content/uploads/2021/04/New-York-State-wells-feature.jpg
833
1875
Karen Edelstein
https://fractracker.org/wp-content/uploads/2025/09/2025-Wordmark-Logo.png
Karen Edelstein2021-04-01 11:10:062021-04-15 14:08:35New York State Oil & Gas Well Drilling: Patterns Over Time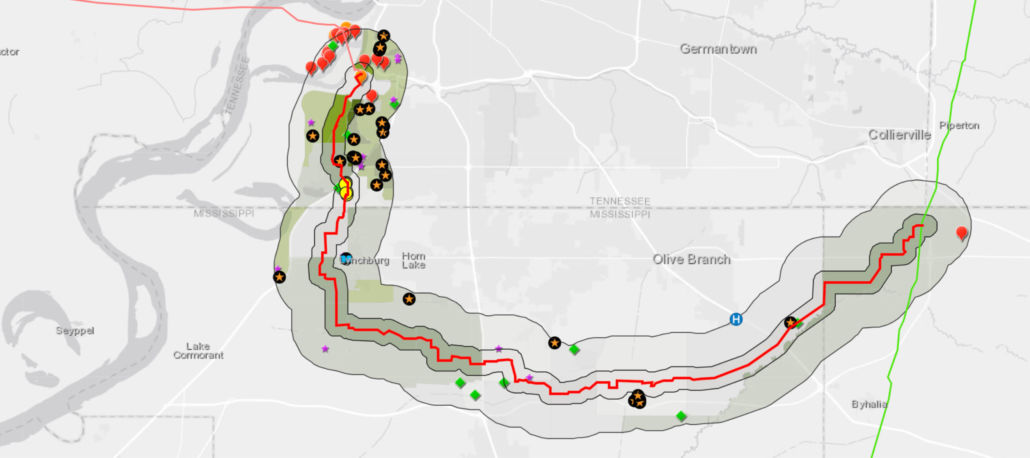 https://fractracker.org/wp-content/uploads/2021/03/Byhalia-map-feature-2-scaled.jpg
667
1500
Karen Edelstein
https://fractracker.org/wp-content/uploads/2025/09/2025-Wordmark-Logo.png
Karen Edelstein2021-03-17 17:06:302021-09-16 13:15:25Risky Byhalia Connection Pipeline Threatens Tennessee & Mississippi Health, Water Supply
https://fractracker.org/wp-content/uploads/2021/03/Falcon-Ohio-River-Crossing-Feature-A.LauschkeLightHawk-scaled.jpg
667
1500
Erica Jackson
https://fractracker.org/wp-content/uploads/2025/09/2025-Wordmark-Logo.png
Erica Jackson2021-03-17 08:48:432021-04-15 15:11:21Shell’s Falcon Pipeline Under Investigation for Serious Public Safety Threats
https://fractracker.org/wp-content/uploads/2021/03/Byhalia-map-feature-2-scaled.jpg
667
1500
Karen Edelstein
https://fractracker.org/wp-content/uploads/2025/09/2025-Wordmark-Logo.png
Karen Edelstein2021-03-17 17:06:302021-09-16 13:15:25Risky Byhalia Connection Pipeline Threatens Tennessee & Mississippi Health, Water Supply
https://fractracker.org/wp-content/uploads/2021/03/Falcon-Ohio-River-Crossing-Feature-A.LauschkeLightHawk-scaled.jpg
667
1500
Erica Jackson
https://fractracker.org/wp-content/uploads/2025/09/2025-Wordmark-Logo.png
Erica Jackson2021-03-17 08:48:432021-04-15 15:11:21Shell’s Falcon Pipeline Under Investigation for Serious Public Safety Threats https://fractracker.org/wp-content/uploads/2021/03/Arvin-CA-well-sites-and-schools-feature-scaled.jpg
667
1500
Kyle Ferrar, MPH
https://fractracker.org/wp-content/uploads/2025/09/2025-Wordmark-Logo.png
Kyle Ferrar, MPH2021-03-04 15:29:422021-04-15 15:14:45Kern County’s Drafted EIR Will Increase the Burden for Frontline Communities
https://fractracker.org/wp-content/uploads/2021/03/Arvin-CA-well-sites-and-schools-feature-scaled.jpg
667
1500
Kyle Ferrar, MPH
https://fractracker.org/wp-content/uploads/2025/09/2025-Wordmark-Logo.png
Kyle Ferrar, MPH2021-03-04 15:29:422021-04-15 15:14:45Kern County’s Drafted EIR Will Increase the Burden for Frontline Communities FracTracker Alliance, 2021
https://fractracker.org/wp-content/uploads/2021/02/Waste-Disposal-Wells-in-Pennsylvania-feature-scaled.jpg
667
1500
Matt Kelso, BA
https://fractracker.org/wp-content/uploads/2025/09/2025-Wordmark-Logo.png
Matt Kelso, BA2021-02-26 12:23:392021-04-15 14:08:41Pennsylvania’s Waste Disposal Wells – A Tale of Two Datasets
https://fractracker.org/wp-content/uploads/2021/02/Los-Angeles-skyline-feature-scaled.jpg
667
1500
Kyle Ferrar, MPH
https://fractracker.org/wp-content/uploads/2025/09/2025-Wordmark-Logo.png
Kyle Ferrar, MPH2021-02-23 14:42:162021-04-15 14:08:42California Oil & Gas Setbacks Recommendations Memo
FracTracker Alliance, 2021
https://fractracker.org/wp-content/uploads/2021/02/Waste-Disposal-Wells-in-Pennsylvania-feature-scaled.jpg
667
1500
Matt Kelso, BA
https://fractracker.org/wp-content/uploads/2025/09/2025-Wordmark-Logo.png
Matt Kelso, BA2021-02-26 12:23:392021-04-15 14:08:41Pennsylvania’s Waste Disposal Wells – A Tale of Two Datasets
https://fractracker.org/wp-content/uploads/2021/02/Los-Angeles-skyline-feature-scaled.jpg
667
1500
Kyle Ferrar, MPH
https://fractracker.org/wp-content/uploads/2025/09/2025-Wordmark-Logo.png
Kyle Ferrar, MPH2021-02-23 14:42:162021-04-15 14:08:42California Oil & Gas Setbacks Recommendations Memo https://fractracker.org/wp-content/uploads/2021/02/Figure-2.-There-are-50-operational-oil-and-gas-wells-permitted-on-California-state-lands-in-the-Sacramento-River-Delta-feature-scaled.jpg
667
1500
Kyle Ferrar, MPH
https://fractracker.org/wp-content/uploads/2025/09/2025-Wordmark-Logo.png
Kyle Ferrar, MPH2021-02-12 17:42:002021-04-15 14:08:43Oil and Gas Wells on California State Lands
https://fractracker.org/wp-content/uploads/2021/02/Figure-2.-There-are-50-operational-oil-and-gas-wells-permitted-on-California-state-lands-in-the-Sacramento-River-Delta-feature-scaled.jpg
667
1500
Kyle Ferrar, MPH
https://fractracker.org/wp-content/uploads/2025/09/2025-Wordmark-Logo.png
Kyle Ferrar, MPH2021-02-12 17:42:002021-04-15 14:08:43Oil and Gas Wells on California State Lands https://fractracker.org/wp-content/uploads/2021/03/Control-your-dust-frac-sand-feature-scaled.jpg
667
1500
Ted Auch, PhD
https://fractracker.org/wp-content/uploads/2025/09/2025-Wordmark-Logo.png
Ted Auch, PhD2021-01-29 10:30:092026-04-14 11:55:22Industrial Impacts in Michigan: A Photo Essay & Story Map
https://fractracker.org/wp-content/uploads/2021/03/Control-your-dust-frac-sand-feature-scaled.jpg
667
1500
Ted Auch, PhD
https://fractracker.org/wp-content/uploads/2025/09/2025-Wordmark-Logo.png
Ted Auch, PhD2021-01-29 10:30:092026-04-14 11:55:22Industrial Impacts in Michigan: A Photo Essay & Story Map https://fractracker.org/wp-content/uploads/2020/12/CASetbacksMappic.jpg
614
1500
Kyle Ferrar, MPH
https://fractracker.org/wp-content/uploads/2025/09/2025-Wordmark-Logo.png
Kyle Ferrar, MPH2020-12-17 13:45:242021-04-15 14:16:02People and Production: Reducing Risk in California Extraction
https://fractracker.org/wp-content/uploads/2020/12/CASetbacksMappic.jpg
614
1500
Kyle Ferrar, MPH
https://fractracker.org/wp-content/uploads/2025/09/2025-Wordmark-Logo.png
Kyle Ferrar, MPH2020-12-17 13:45:242021-04-15 14:16:02People and Production: Reducing Risk in California Extraction https://fractracker.org/wp-content/uploads/2019/08/EQT-Tioga-Wide-7.gif
300
800
Kyle Ferrar, MPH
https://fractracker.org/wp-content/uploads/2025/09/2025-Wordmark-Logo.png
Kyle Ferrar, MPH2020-11-18 12:40:132021-04-15 14:16:04Documenting emissions from new oil and gas wells in California
https://fractracker.org/wp-content/uploads/2019/08/EQT-Tioga-Wide-7.gif
300
800
Kyle Ferrar, MPH
https://fractracker.org/wp-content/uploads/2025/09/2025-Wordmark-Logo.png
Kyle Ferrar, MPH2020-11-18 12:40:132021-04-15 14:16:04Documenting emissions from new oil and gas wells in California https://fractracker.org/wp-content/uploads/2020/10/TAuch_infrastructure-wellpad-sandtruck-ChesapeakeAppalachia-RainSulWellpad-SullivanCounty-PA_July2020-feature-scaled.jpg
667
1500
Ted Auch, PhD
https://fractracker.org/wp-content/uploads/2025/09/2025-Wordmark-Logo.png
Ted Auch, PhD2020-10-15 11:24:272021-04-15 14:16:07Energy Security, International Investment, and Democracy in the US Shale Oil & Gas Industry
https://fractracker.org/wp-content/uploads/2020/10/TAuch_infrastructure-wellpad-sandtruck-ChesapeakeAppalachia-RainSulWellpad-SullivanCounty-PA_July2020-feature-scaled.jpg
667
1500
Ted Auch, PhD
https://fractracker.org/wp-content/uploads/2025/09/2025-Wordmark-Logo.png
Ted Auch, PhD2020-10-15 11:24:272021-04-15 14:16:07Energy Security, International Investment, and Democracy in the US Shale Oil & Gas Industry https://fractracker.org/wp-content/uploads/2020/08/Loyalsock-feature-scaled.jpg
667
1500
Shannon Smith
https://fractracker.org/wp-content/uploads/2025/09/2025-Wordmark-Logo.png
Shannon Smith2020-08-04 18:44:392023-01-17 10:30:44The Loyalsock Watershed Project
https://fractracker.org/wp-content/uploads/2020/08/Loyalsock-feature-scaled.jpg
667
1500
Shannon Smith
https://fractracker.org/wp-content/uploads/2025/09/2025-Wordmark-Logo.png
Shannon Smith2020-08-04 18:44:392023-01-17 10:30:44The Loyalsock Watershed Project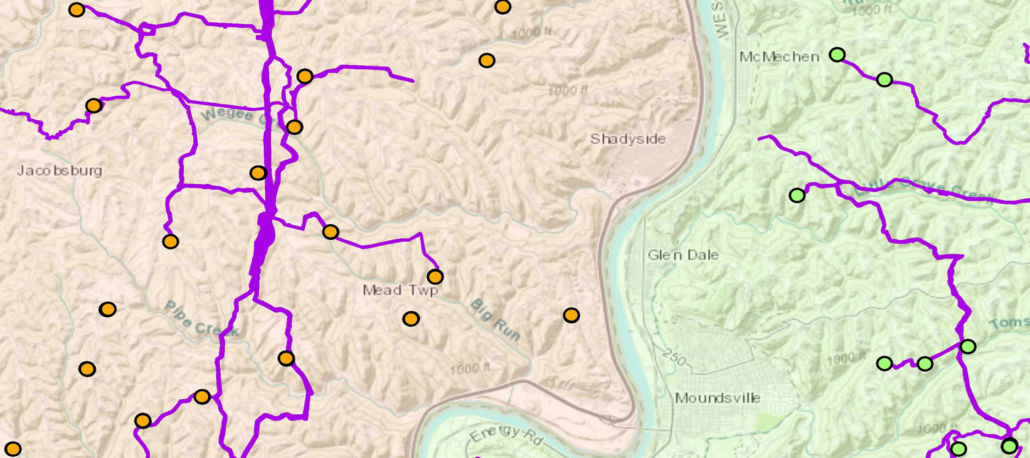 https://fractracker.org/wp-content/uploads/2020/07/Mapping-gathering-lines-in-OH-and-WV-feature.jpg
833
1875
Intern FracTracker
https://fractracker.org/wp-content/uploads/2025/09/2025-Wordmark-Logo.png
Intern FracTracker2020-07-02 12:09:192025-05-02 14:45:00Mapping Gathering Lines in Ohio and West Virginia
https://fractracker.org/wp-content/uploads/2020/07/Mapping-gathering-lines-in-OH-and-WV-feature.jpg
833
1875
Intern FracTracker
https://fractracker.org/wp-content/uploads/2025/09/2025-Wordmark-Logo.png
Intern FracTracker2020-07-02 12:09:192025-05-02 14:45:00Mapping Gathering Lines in Ohio and West Virginia https://fractracker.org/wp-content/uploads/2020/06/Oil-Gas-waste-tank-in-Michigan-feature-scaled.jpg
430
1500
Ted Auch, PhD
https://fractracker.org/wp-content/uploads/2025/09/2025-Wordmark-Logo.png
Ted Auch, PhD2020-06-18 10:24:572021-04-15 14:16:44The North Dakota Shale Viewer Reimagined: Mapping the Water and Waste Impact
https://fractracker.org/wp-content/uploads/2020/06/Oil-Gas-waste-tank-in-Michigan-feature-scaled.jpg
430
1500
Ted Auch, PhD
https://fractracker.org/wp-content/uploads/2025/09/2025-Wordmark-Logo.png
Ted Auch, PhD2020-06-18 10:24:572021-04-15 14:16:44The North Dakota Shale Viewer Reimagined: Mapping the Water and Waste Impact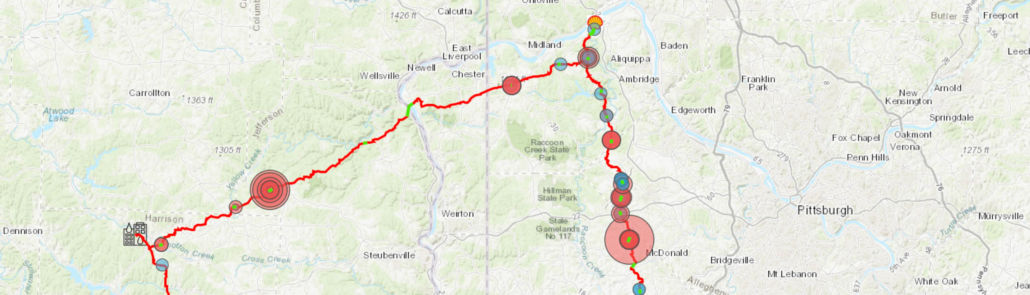 https://fractracker.org/wp-content/uploads/2020/06/FalconPipelineFrontPage-scaled.jpg
430
1500
Erica Jackson
https://fractracker.org/wp-content/uploads/2025/09/2025-Wordmark-Logo.png
Erica Jackson2020-06-16 11:47:062021-04-15 14:16:44Falcon Pipeline Construction Releases over 250,000 Gallons of Drilling Fluid in Pennsylvania and Ohio
https://fractracker.org/wp-content/uploads/2020/06/FalconPipelineFrontPage-scaled.jpg
430
1500
Erica Jackson
https://fractracker.org/wp-content/uploads/2025/09/2025-Wordmark-Logo.png
Erica Jackson2020-06-16 11:47:062021-04-15 14:16:44Falcon Pipeline Construction Releases over 250,000 Gallons of Drilling Fluid in Pennsylvania and Ohio https://fractracker.org/wp-content/uploads/2020/06/CalGEM-Drilling-and-Rework-Permits-2015-2020-feature.jpg
833
1875
Kyle Ferrar, MPH
https://fractracker.org/wp-content/uploads/2025/09/2025-Wordmark-Logo.png
Kyle Ferrar, MPH2020-06-08 08:44:542021-04-15 14:16:46Systematic Racism in Kern County Oil and Gas Permitting Ordinance
https://fractracker.org/wp-content/uploads/2020/06/CalGEM-Drilling-and-Rework-Permits-2015-2020-feature.jpg
833
1875
Kyle Ferrar, MPH
https://fractracker.org/wp-content/uploads/2025/09/2025-Wordmark-Logo.png
Kyle Ferrar, MPH2020-06-08 08:44:542021-04-15 14:16:46Systematic Racism in Kern County Oil and Gas Permitting Ordinance https://fractracker.org/wp-content/uploads/2020/05/waterfall-1806956_1920.jpg
724
1500
Matt Kelso, BA
https://fractracker.org/wp-content/uploads/2025/09/2025-Wordmark-Logo.png
Matt Kelso, BA2020-05-29 16:22:102021-04-15 14:16:48Fracking Water Use in Pennsylvania Increases Dramatically
https://fractracker.org/wp-content/uploads/2020/05/waterfall-1806956_1920.jpg
724
1500
Matt Kelso, BA
https://fractracker.org/wp-content/uploads/2025/09/2025-Wordmark-Logo.png
Matt Kelso, BA2020-05-29 16:22:102021-04-15 14:16:48Fracking Water Use in Pennsylvania Increases Dramatically https://fractracker.org/wp-content/uploads/2020/05/North-Brooklyn-Pipeline-demographics_1.jpg
914
2242
Guest Author
https://fractracker.org/wp-content/uploads/2025/09/2025-Wordmark-Logo.png
Guest Author2020-05-18 09:00:212021-04-15 14:16:48New Yorkers mount resistance against North Brooklyn Pipeline
https://fractracker.org/wp-content/uploads/2020/05/North-Brooklyn-Pipeline-demographics_1.jpg
914
2242
Guest Author
https://fractracker.org/wp-content/uploads/2025/09/2025-Wordmark-Logo.png
Guest Author2020-05-18 09:00:212021-04-15 14:16:48New Yorkers mount resistance against North Brooklyn Pipeline https://fractracker.org/wp-content/uploads/2020/04/Map-of-New-2020-Fracking-Permits-in-California.jpg
720
1500
Kyle Ferrar, MPH
https://fractracker.org/wp-content/uploads/2025/09/2025-Wordmark-Logo.png
Kyle Ferrar, MPH2020-05-07 12:48:132021-04-15 14:16:49California, Back in Frack
https://fractracker.org/wp-content/uploads/2020/04/California-well-pad.jpg
666
1500
Kyle Ferrar, MPH
https://fractracker.org/wp-content/uploads/2025/09/2025-Wordmark-Logo.png
Kyle Ferrar, MPH2020-04-02 10:20:422021-04-15 14:16:50California Setback Analyses Summary
https://fractracker.org/wp-content/uploads/2020/04/Map-of-New-2020-Fracking-Permits-in-California.jpg
720
1500
Kyle Ferrar, MPH
https://fractracker.org/wp-content/uploads/2025/09/2025-Wordmark-Logo.png
Kyle Ferrar, MPH2020-05-07 12:48:132021-04-15 14:16:49California, Back in Frack
https://fractracker.org/wp-content/uploads/2020/04/California-well-pad.jpg
666
1500
Kyle Ferrar, MPH
https://fractracker.org/wp-content/uploads/2025/09/2025-Wordmark-Logo.png
Kyle Ferrar, MPH2020-04-02 10:20:422021-04-15 14:16:50California Setback Analyses Summary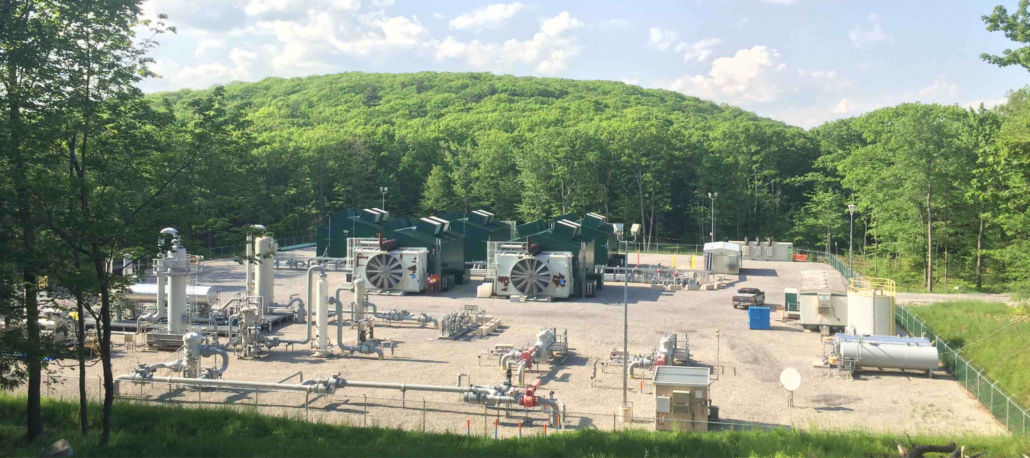 https://fractracker.org/wp-content/uploads/2020/03/Compressor-station-within-Loyalsock-State-Forest-PA-scaled.jpg
667
1500
Guest Author
https://fractracker.org/wp-content/uploads/2025/09/2025-Wordmark-Logo.png
Guest Author2020-03-19 13:16:212021-04-15 14:16:51Air Pollution from Pennsylvania Shale Gas Compressor Stations – REPORT
https://fractracker.org/wp-content/uploads/2020/03/Compressor-station-within-Loyalsock-State-Forest-PA-scaled.jpg
667
1500
Guest Author
https://fractracker.org/wp-content/uploads/2025/09/2025-Wordmark-Logo.png
Guest Author2020-03-19 13:16:212021-04-15 14:16:51Air Pollution from Pennsylvania Shale Gas Compressor Stations – REPORT https://fractracker.org/wp-content/uploads/2020/03/New-York-State-Oil-Gas-Well-Viewer-2020.jpg
1208
1966
Karen Edelstein
https://fractracker.org/wp-content/uploads/2025/09/2025-Wordmark-Logo.png
Karen Edelstein2020-03-11 12:07:052021-04-15 14:16:54New York State Oil & Gas Wells – 2020 Update
https://fractracker.org/wp-content/uploads/2020/03/New-York-State-Oil-Gas-Well-Viewer-2020.jpg
1208
1966
Karen Edelstein
https://fractracker.org/wp-content/uploads/2025/09/2025-Wordmark-Logo.png
Karen Edelstein2020-03-11 12:07:052021-04-15 14:16:54New York State Oil & Gas Wells – 2020 Update https://fractracker.org/wp-content/uploads/2020/02/National-map-feature-3.png
400
900
Erica Jackson
https://fractracker.org/wp-content/uploads/2025/09/2025-Wordmark-Logo.png
Erica Jackson2020-02-28 17:35:142022-05-02 15:21:42National Energy and Petrochemical Map
https://fractracker.org/wp-content/uploads/2020/02/National-map-feature-3.png
400
900
Erica Jackson
https://fractracker.org/wp-content/uploads/2025/09/2025-Wordmark-Logo.png
Erica Jackson2020-02-28 17:35:142022-05-02 15:21:42National Energy and Petrochemical Map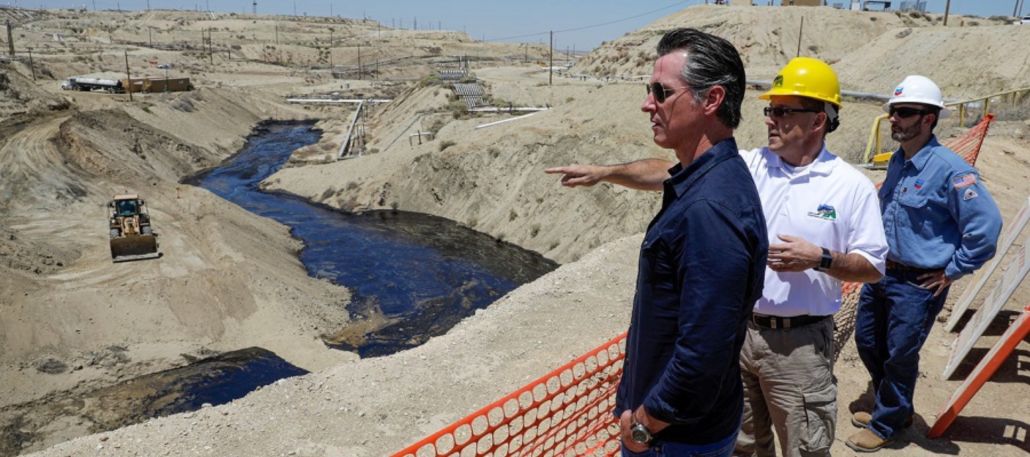 https://fractracker.org/wp-content/uploads/2020/01/California-Governor-Gavin-Newsom--scaled.jpg
666
1500
Kyle Ferrar, MPH
https://fractracker.org/wp-content/uploads/2025/09/2025-Wordmark-Logo.png
Kyle Ferrar, MPH2020-02-24 10:09:182021-04-15 14:55:29Governor Newsom Must Do More to Address the Cause of Oil Spill Surface Expressions
https://fractracker.org/wp-content/uploads/2020/01/California-Governor-Gavin-Newsom--scaled.jpg
666
1500
Kyle Ferrar, MPH
https://fractracker.org/wp-content/uploads/2025/09/2025-Wordmark-Logo.png
Kyle Ferrar, MPH2020-02-24 10:09:182021-04-15 14:55:29Governor Newsom Must Do More to Address the Cause of Oil Spill Surface Expressions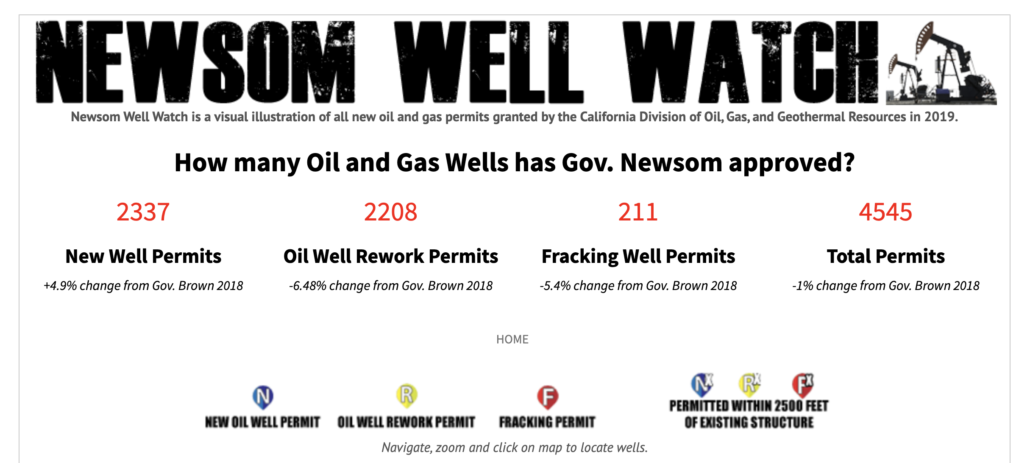 https://fractracker.org/wp-content/uploads/2020/02/Screen-Shot-2020-02-21-at-2.22.05-PM.png
674
1500
Kyle Ferrar, MPH
https://fractracker.org/wp-content/uploads/2025/09/2025-Wordmark-Logo.png
Kyle Ferrar, MPH2020-02-22 13:29:222021-04-15 14:55:30Oil & Gas Well Permits Issued By Newsom Administration Rival Those Issued Under Gov. Jerry Brown
https://fractracker.org/wp-content/uploads/2020/02/Screen-Shot-2020-02-21-at-2.22.05-PM.png
674
1500
Kyle Ferrar, MPH
https://fractracker.org/wp-content/uploads/2025/09/2025-Wordmark-Logo.png
Kyle Ferrar, MPH2020-02-22 13:29:222021-04-15 14:55:30Oil & Gas Well Permits Issued By Newsom Administration Rival Those Issued Under Gov. Jerry Brown https://fractracker.org/wp-content/uploads/2019/02/San-Bruno-Aftermath-feature-image.png
400
900
Matt Kelso, BA
https://fractracker.org/wp-content/uploads/2025/09/2025-Wordmark-Logo.png
Matt Kelso, BA2020-02-21 16:13:542021-04-15 14:55:30Pipelines Continue to Catch Fire and Explode
https://fractracker.org/wp-content/uploads/2019/02/San-Bruno-Aftermath-feature-image.png
400
900
Matt Kelso, BA
https://fractracker.org/wp-content/uploads/2025/09/2025-Wordmark-Logo.png
Matt Kelso, BA2020-02-21 16:13:542021-04-15 14:55:30Pipelines Continue to Catch Fire and Explode https://fractracker.org/wp-content/uploads/2020/01/Brookfield-scaled.jpg
667
1500
Ted Auch, PhD
https://fractracker.org/wp-content/uploads/2025/09/2025-Wordmark-Logo.png
Ted Auch, PhD2020-01-13 17:51:102021-04-15 14:55:31The Hidden Inefficiencies and Environmental Costs of Fracking in Ohio
https://fractracker.org/wp-content/uploads/2020/01/Brookfield-scaled.jpg
667
1500
Ted Auch, PhD
https://fractracker.org/wp-content/uploads/2025/09/2025-Wordmark-Logo.png
Ted Auch, PhD2020-01-13 17:51:102021-04-15 14:55:31The Hidden Inefficiencies and Environmental Costs of Fracking in Ohio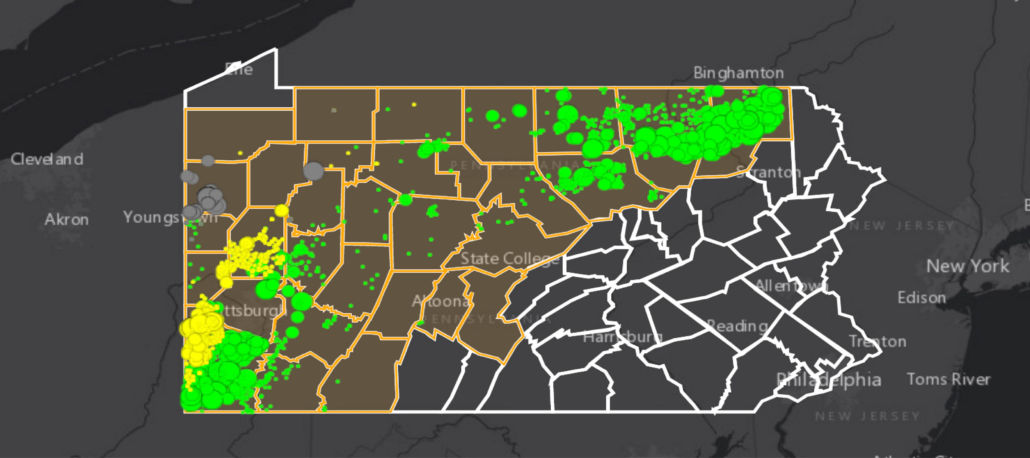 https://fractracker.org/wp-content/uploads/2020/01/PA-2019-Fracked-Gas-Production-Feature-scaled.jpg
667
1500
Matt Kelso, BA
https://fractracker.org/wp-content/uploads/2025/09/2025-Wordmark-Logo.png
Matt Kelso, BA2020-01-07 18:02:382021-04-15 14:55:32Fracking in Pennsylvania: Not Worth It
https://fractracker.org/wp-content/uploads/2020/01/PA-2019-Fracked-Gas-Production-Feature-scaled.jpg
667
1500
Matt Kelso, BA
https://fractracker.org/wp-content/uploads/2025/09/2025-Wordmark-Logo.png
Matt Kelso, BA2020-01-07 18:02:382021-04-15 14:55:32Fracking in Pennsylvania: Not Worth It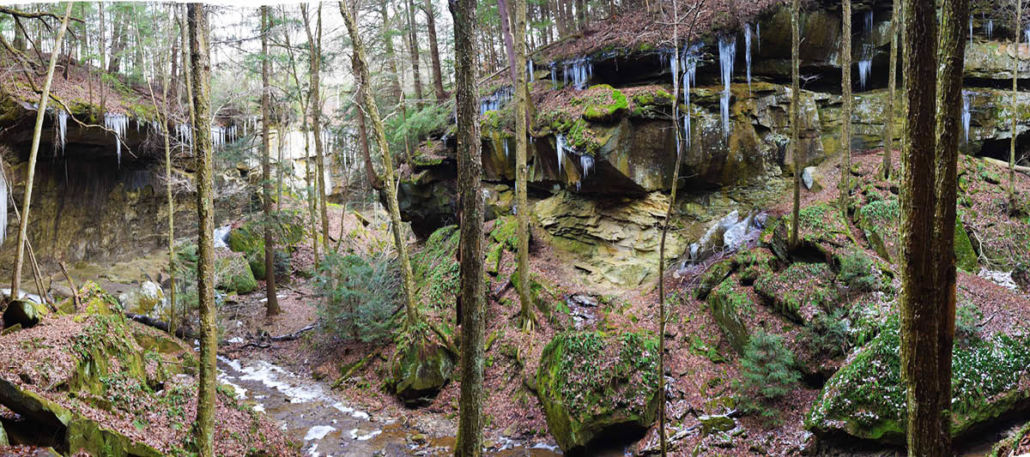 Photo by Ted Auch, FracTracker Alliance
https://fractracker.org/wp-content/uploads/2019/12/Captina-Creek-Watershed-Feature.jpg
533
1200
Ted Auch, PhD
https://fractracker.org/wp-content/uploads/2025/09/2025-Wordmark-Logo.png
Ted Auch, PhD2019-12-20 09:49:212021-04-15 14:55:33Fracking Threatens Ohio’s Captina Creek Watershed
Photo by Ted Auch, FracTracker Alliance
https://fractracker.org/wp-content/uploads/2019/12/Captina-Creek-Watershed-Feature.jpg
533
1200
Ted Auch, PhD
https://fractracker.org/wp-content/uploads/2025/09/2025-Wordmark-Logo.png
Ted Auch, PhD2019-12-20 09:49:212021-04-15 14:55:33Fracking Threatens Ohio’s Captina Creek Watershed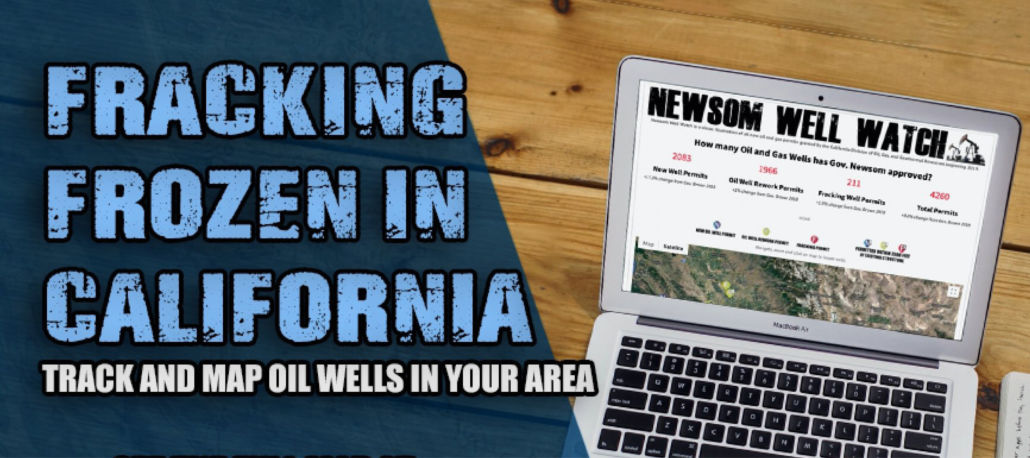 https://fractracker.org/wp-content/uploads/2019/11/Newsom-Well-Watch-Feature-scaled.jpg
667
1500
Kyle Ferrar, MPH
https://fractracker.org/wp-content/uploads/2025/09/2025-Wordmark-Logo.png
Kyle Ferrar, MPH2019-11-19 20:06:282021-04-15 14:55:36California is Frack Free, for the Moment
https://fractracker.org/wp-content/uploads/2019/11/Newsom-Well-Watch-Feature-scaled.jpg
667
1500
Kyle Ferrar, MPH
https://fractracker.org/wp-content/uploads/2025/09/2025-Wordmark-Logo.png
Kyle Ferrar, MPH2019-11-19 20:06:282021-04-15 14:55:36California is Frack Free, for the Moment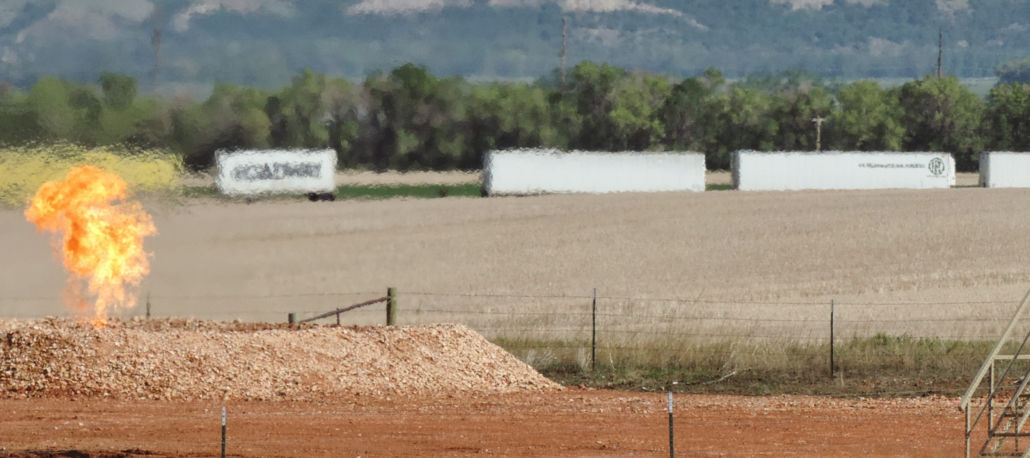 https://fractracker.org/wp-content/uploads/2019/10/Oil-and-gas-drilling-in-ND.-Photo-by-Nick-Lund-NPCA-2014-feature-scaled.jpg
667
1500
Intern FracTracker
https://fractracker.org/wp-content/uploads/2025/09/2025-Wordmark-Logo.png
Intern FracTracker2019-10-10 11:50:142021-04-28 11:55:45How State Regulations Hold Us back and What Other Countries are doing about Fracking
https://fractracker.org/wp-content/uploads/2019/10/Oil-and-gas-drilling-in-ND.-Photo-by-Nick-Lund-NPCA-2014-feature-scaled.jpg
667
1500
Intern FracTracker
https://fractracker.org/wp-content/uploads/2025/09/2025-Wordmark-Logo.png
Intern FracTracker2019-10-10 11:50:142021-04-28 11:55:45How State Regulations Hold Us back and What Other Countries are doing about Fracking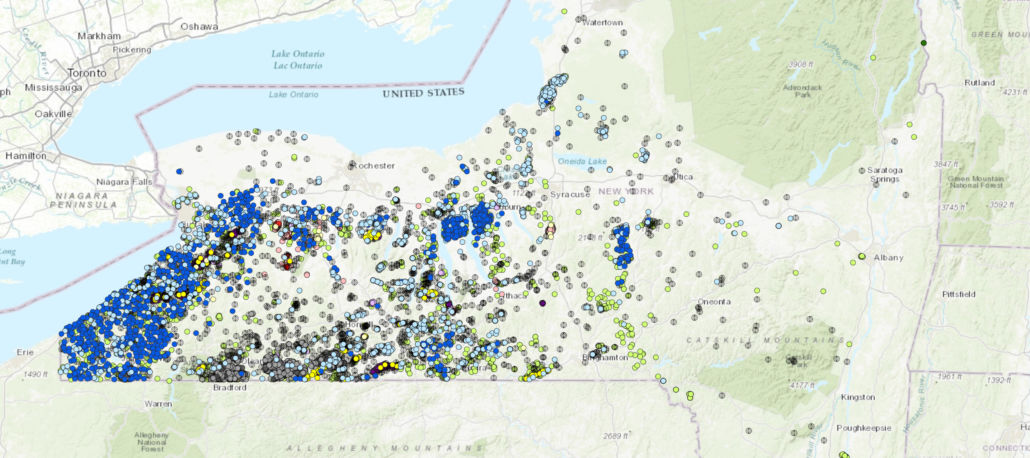 https://fractracker.org/wp-content/uploads/2019/09/2018-NYS-Oil-and-Gas-Wells-feature-image-2-scaled.jpg
667
1500
Guest Author
https://fractracker.org/wp-content/uploads/2025/09/2025-Wordmark-Logo.png
Guest Author2019-09-17 09:00:492021-04-15 14:56:25New Method for Locating Abandoned Oil and Gas Wells is Tested in New York State
https://fractracker.org/wp-content/uploads/2019/09/2018-NYS-Oil-and-Gas-Wells-feature-image-2-scaled.jpg
667
1500
Guest Author
https://fractracker.org/wp-content/uploads/2025/09/2025-Wordmark-Logo.png
Guest Author2019-09-17 09:00:492021-04-15 14:56:25New Method for Locating Abandoned Oil and Gas Wells is Tested in New York State https://fractracker.org/wp-content/uploads/2019/11/OHSecretChem.png
1421
1100
Shannon Smith
https://fractracker.org/wp-content/uploads/2025/09/2025-Wordmark-Logo.png
Shannon Smith2019-09-12 15:42:582021-06-11 15:00:22Ohio’s Secret Fracking Chemicals
https://fractracker.org/wp-content/uploads/2019/11/OHSecretChem.png
1421
1100
Shannon Smith
https://fractracker.org/wp-content/uploads/2025/09/2025-Wordmark-Logo.png
Shannon Smith2019-09-12 15:42:582021-06-11 15:00:22Ohio’s Secret Fracking Chemicals https://fractracker.org/wp-content/uploads/2019/08/Abandoned-wells-PA-feature.png
667
1500
Intern FracTracker
https://fractracker.org/wp-content/uploads/2025/09/2025-Wordmark-Logo.png
Intern FracTracker2019-08-08 14:17:382025-05-02 14:45:21Abandoned Wells in Pennsylvania: We’re Not Doing Enough
https://fractracker.org/wp-content/uploads/2019/08/Abandoned-wells-PA-feature.png
667
1500
Intern FracTracker
https://fractracker.org/wp-content/uploads/2025/09/2025-Wordmark-Logo.png
Intern FracTracker2019-08-08 14:17:382025-05-02 14:45:21Abandoned Wells in Pennsylvania: We’re Not Doing Enough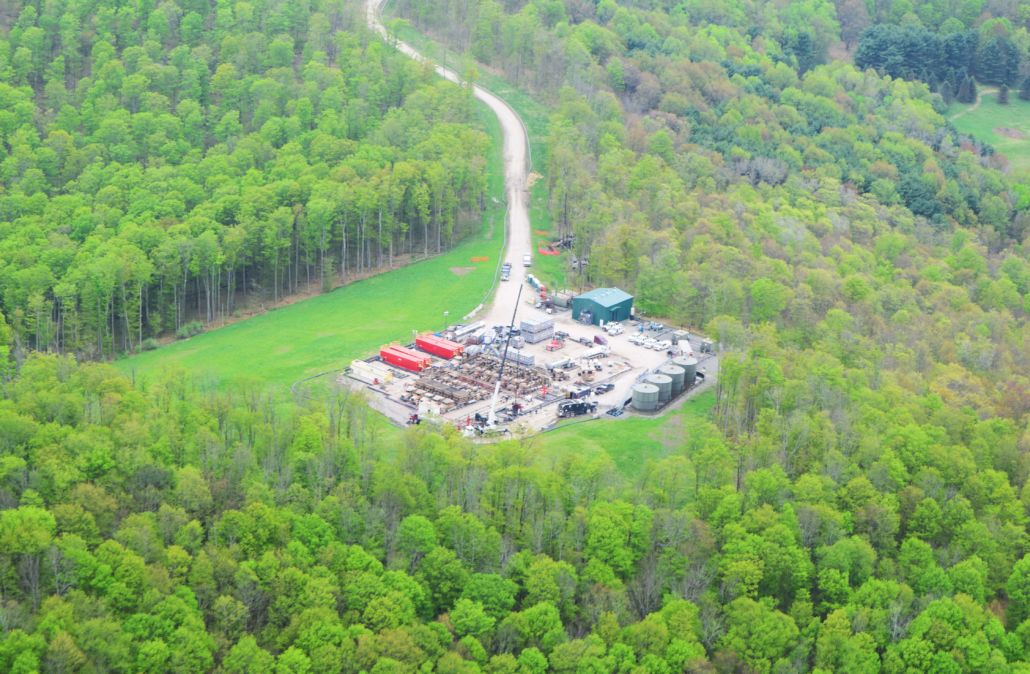 https://fractracker.org/wp-content/uploads/2019/07/DSC_0624_LowRes-scaled.jpg
982
1500
Shannon Smith
https://fractracker.org/wp-content/uploads/2025/09/2025-Wordmark-Logo.png
Shannon Smith2019-08-07 09:36:032026-04-28 15:34:37Wildness Lost – Pine Creek
https://fractracker.org/wp-content/uploads/2019/07/DSC_0624_LowRes-scaled.jpg
982
1500
Shannon Smith
https://fractracker.org/wp-content/uploads/2025/09/2025-Wordmark-Logo.png
Shannon Smith2019-08-07 09:36:032026-04-28 15:34:37Wildness Lost – Pine Creek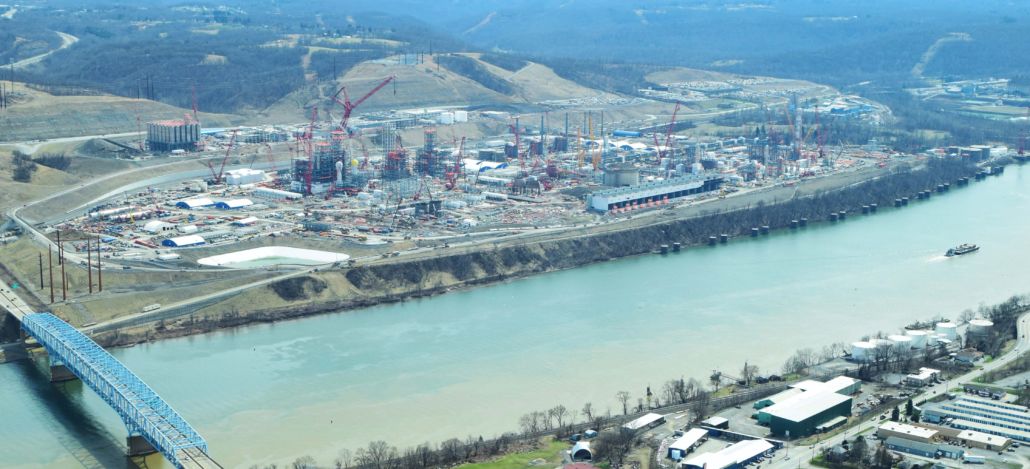 https://fractracker.org/wp-content/uploads/2019/07/Cracker-Plant-2-scaled.jpg
683
1500
Ted Auch, PhD
https://fractracker.org/wp-content/uploads/2025/09/2025-Wordmark-Logo.png
Ted Auch, PhD2019-07-23 14:37:052021-04-15 14:56:27The Underlying Politics and Unconventional Well Fundamentals of an Appalachian Storage Hub
https://fractracker.org/wp-content/uploads/2019/07/Cracker-Plant-2-scaled.jpg
683
1500
Ted Auch, PhD
https://fractracker.org/wp-content/uploads/2025/09/2025-Wordmark-Logo.png
Ted Auch, PhD2019-07-23 14:37:052021-04-15 14:56:27The Underlying Politics and Unconventional Well Fundamentals of an Appalachian Storage Hub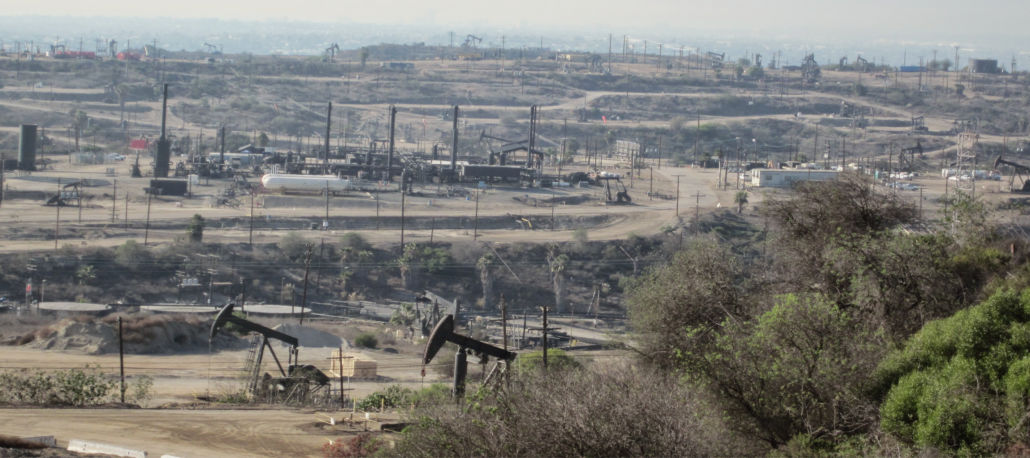 https://fractracker.org/wp-content/uploads/2019/07/inglewood-field-ca-feature-1-scaled.jpg
667
1500
Kyle Ferrar, MPH
https://fractracker.org/wp-content/uploads/2025/09/2025-Wordmark-Logo.png
Kyle Ferrar, MPH2019-07-11 14:48:462021-04-15 14:56:28Permitting New Oil and Gas Wells Under the Newsom Administration
https://fractracker.org/wp-content/uploads/2019/07/inglewood-field-ca-feature-1-scaled.jpg
667
1500
Kyle Ferrar, MPH
https://fractracker.org/wp-content/uploads/2025/09/2025-Wordmark-Logo.png
Kyle Ferrar, MPH2019-07-11 14:48:462021-04-15 14:56:28Permitting New Oil and Gas Wells Under the Newsom Administration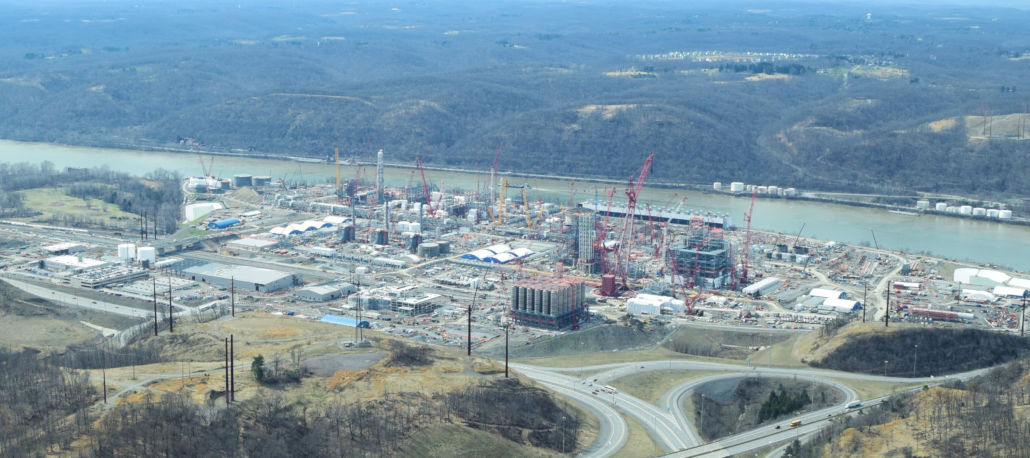 https://fractracker.org/wp-content/uploads/2019/07/Beaver-Cracker-Plant-Feature-scaled.jpg
667
1500
Erica Jackson
https://fractracker.org/wp-content/uploads/2025/09/2025-Wordmark-Logo.png
Erica Jackson2019-07-10 09:33:552022-02-15 10:54:51Mapping the Petrochemical Build-Out Along the Ohio River
https://fractracker.org/wp-content/uploads/2019/07/Beaver-Cracker-Plant-Feature-scaled.jpg
667
1500
Erica Jackson
https://fractracker.org/wp-content/uploads/2025/09/2025-Wordmark-Logo.png
Erica Jackson2019-07-10 09:33:552022-02-15 10:54:51Mapping the Petrochemical Build-Out Along the Ohio River https://fractracker.org/wp-content/uploads/2019/06/SignalHill_DavidMcNew_GettyImages_edit.jpg
400
900
Kyle Ferrar, MPH
https://fractracker.org/wp-content/uploads/2025/09/2025-Wordmark-Logo.png
Kyle Ferrar, MPH2019-07-02 12:03:382021-04-15 14:56:29Impact of a 2,500′ Oil and Gas Well Setback in California
https://fractracker.org/wp-content/uploads/2019/06/SignalHill_DavidMcNew_GettyImages_edit.jpg
400
900
Kyle Ferrar, MPH
https://fractracker.org/wp-content/uploads/2025/09/2025-Wordmark-Logo.png
Kyle Ferrar, MPH2019-07-02 12:03:382021-04-15 14:56:29Impact of a 2,500′ Oil and Gas Well Setback in California https://fractracker.org/wp-content/uploads/2019/06/Washington-County-Rig-2-scaled.jpg
667
1500
Matt Kelso, BA
https://fractracker.org/wp-content/uploads/2025/09/2025-Wordmark-Logo.png
Matt Kelso, BA2019-06-10 12:07:422021-04-15 14:56:30Production and Location Trends in PA: A Moving Target
https://fractracker.org/wp-content/uploads/2019/06/Washington-County-Rig-2-scaled.jpg
667
1500
Matt Kelso, BA
https://fractracker.org/wp-content/uploads/2025/09/2025-Wordmark-Logo.png
Matt Kelso, BA2019-06-10 12:07:422021-04-15 14:56:30Production and Location Trends in PA: A Moving Target https://fractracker.org/wp-content/uploads/2019/05/PipelineConstructionFeature.png
667
1500
Erica Jackson
https://fractracker.org/wp-content/uploads/2025/09/2025-Wordmark-Logo.png
Erica Jackson2019-05-08 08:27:302021-04-15 14:56:31The Falcon Public Monitoring Project
https://fractracker.org/wp-content/uploads/2019/05/PipelineConstructionFeature.png
667
1500
Erica Jackson
https://fractracker.org/wp-content/uploads/2025/09/2025-Wordmark-Logo.png
Erica Jackson2019-05-08 08:27:302021-04-15 14:56:31The Falcon Public Monitoring Project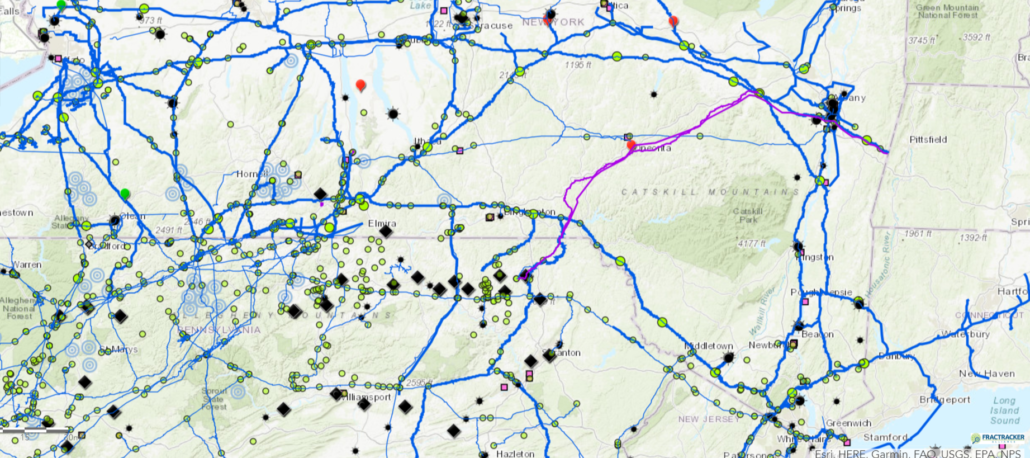 https://fractracker.org/wp-content/uploads/2019/04/YouAreHereMap2.png
667
1500
Guest Author
https://fractracker.org/wp-content/uploads/2025/09/2025-Wordmark-Logo.png
Guest Author2019-04-24 15:49:052021-04-15 14:56:34Release: The 2019 You Are Here map launches, showing New York’s hurdles to climate leadership
https://fractracker.org/wp-content/uploads/2019/03/IdleWellsHathaway_resize.jpg
400
900
Kyle Ferrar, MPH
https://fractracker.org/wp-content/uploads/2025/09/2025-Wordmark-Logo.png
Kyle Ferrar, MPH2019-04-03 11:30:582021-04-15 14:56:34Idle Wells are a Major Risk
https://fractracker.org/wp-content/uploads/2019/04/YouAreHereMap2.png
667
1500
Guest Author
https://fractracker.org/wp-content/uploads/2025/09/2025-Wordmark-Logo.png
Guest Author2019-04-24 15:49:052021-04-15 14:56:34Release: The 2019 You Are Here map launches, showing New York’s hurdles to climate leadership
https://fractracker.org/wp-content/uploads/2019/03/IdleWellsHathaway_resize.jpg
400
900
Kyle Ferrar, MPH
https://fractracker.org/wp-content/uploads/2025/09/2025-Wordmark-Logo.png
Kyle Ferrar, MPH2019-04-03 11:30:582021-04-15 14:56:34Idle Wells are a Major Risk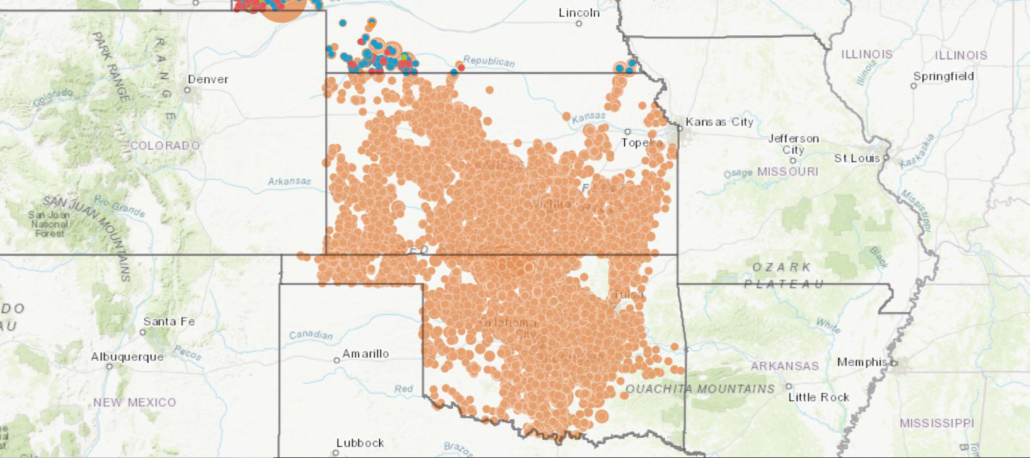 https://fractracker.org/wp-content/uploads/2019/03/KSOKNE-Injection-Wells.png
667
1500
Ted Auch, PhD
https://fractracker.org/wp-content/uploads/2025/09/2025-Wordmark-Logo.png
Ted Auch, PhD2019-03-07 14:32:242021-04-15 14:56:54Wicked Witch of the Waste
https://fractracker.org/wp-content/uploads/2019/03/KSOKNE-Injection-Wells.png
667
1500
Ted Auch, PhD
https://fractracker.org/wp-content/uploads/2025/09/2025-Wordmark-Logo.png
Ted Auch, PhD2019-03-07 14:32:242021-04-15 14:56:54Wicked Witch of the Waste https://fractracker.org/wp-content/uploads/2019/02/PipelineConstructionPA.png
400
900
Karen Edelstein
https://fractracker.org/wp-content/uploads/2025/09/2025-Wordmark-Logo.png
Karen Edelstein2019-02-28 19:24:532021-04-15 14:56:54The Growing Web of Oil and Gas Pipelines
https://fractracker.org/wp-content/uploads/2019/02/San-Bruno-Aftermath-feature-image.png
400
900
Guest Author
https://fractracker.org/wp-content/uploads/2025/09/2025-Wordmark-Logo.png
Guest Author2019-02-08 19:21:012021-04-15 14:56:55Unnatural Disasters
https://fractracker.org/wp-content/uploads/2019/02/PipelineConstructionPA.png
400
900
Karen Edelstein
https://fractracker.org/wp-content/uploads/2025/09/2025-Wordmark-Logo.png
Karen Edelstein2019-02-28 19:24:532021-04-15 14:56:54The Growing Web of Oil and Gas Pipelines
https://fractracker.org/wp-content/uploads/2019/02/San-Bruno-Aftermath-feature-image.png
400
900
Guest Author
https://fractracker.org/wp-content/uploads/2025/09/2025-Wordmark-Logo.png
Guest Author2019-02-08 19:21:012021-04-15 14:56:55Unnatural Disasters https://fractracker.org/wp-content/uploads/2019/01/SWD_PA2.png
667
1500
Matt Kelso, BA
https://fractracker.org/wp-content/uploads/2025/09/2025-Wordmark-Logo.png
Matt Kelso, BA2019-01-31 10:54:552021-04-15 14:56:56Getting Rid of All of that Waste – Increasing Use of Oil and Gas Injection Wells in Pennsylvania
https://fractracker.org/wp-content/uploads/2019/01/SWD_PA2.png
667
1500
Matt Kelso, BA
https://fractracker.org/wp-content/uploads/2025/09/2025-Wordmark-Logo.png
Matt Kelso, BA2019-01-31 10:54:552021-04-15 14:56:56Getting Rid of All of that Waste – Increasing Use of Oil and Gas Injection Wells in Pennsylvania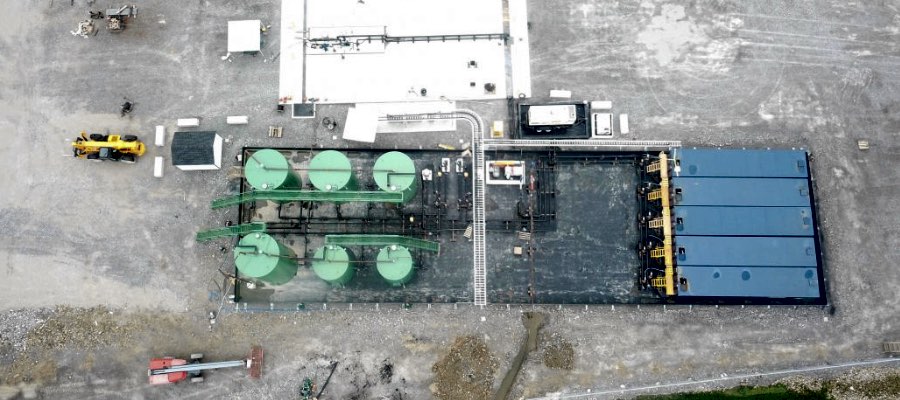 https://fractracker.org/wp-content/uploads/2019/01/InjectionWell-Sky-Feature.jpg
400
900
Ted Auch, PhD
https://fractracker.org/wp-content/uploads/2025/09/2025-Wordmark-Logo.png
Ted Auch, PhD2019-01-09 14:37:272021-04-15 14:56:57A Disturbing Tale of Diminishing Returns in Ohio
https://fractracker.org/wp-content/uploads/2019/01/UncWellsPerYear_2005_2018.png
806
1218
Matt Kelso, BA
https://fractracker.org/wp-content/uploads/2025/09/2025-Wordmark-Logo.png
Matt Kelso, BA2019-01-08 14:14:382021-04-15 14:57:01Pennsylvania Drilling Trends in 2018
https://fractracker.org/wp-content/uploads/2019/01/InjectionWell-Sky-Feature.jpg
400
900
Ted Auch, PhD
https://fractracker.org/wp-content/uploads/2025/09/2025-Wordmark-Logo.png
Ted Auch, PhD2019-01-09 14:37:272021-04-15 14:56:57A Disturbing Tale of Diminishing Returns in Ohio
https://fractracker.org/wp-content/uploads/2019/01/UncWellsPerYear_2005_2018.png
806
1218
Matt Kelso, BA
https://fractracker.org/wp-content/uploads/2025/09/2025-Wordmark-Logo.png
Matt Kelso, BA2019-01-08 14:14:382021-04-15 14:57:01Pennsylvania Drilling Trends in 2018![]()
216 Franklin St, Suite 400, Johnstown, PA 15901
Phone: +1 (717) 303-0403 | info@fractracker.org
FracTracker Alliance is a 501(c)3 non-profit: Tax identification number: 80-0844297
Leave a Reply
Want to join the discussion?Feel free to contribute!