 https://fractracker.org/wp-content/uploads/2021/06/SShamer_Infrastructure-pipeline-rightofway-ColumbiaLineMB-BaltimoreCounty-MD-May2016.jpg
266
400
FracTracker Alliance
https://fractracker.org/wp-content/uploads/2025/09/2025-Wordmark-Logo.png
FracTracker Alliance2025-09-03 16:14:462025-09-30 10:26:57Comment Opposing the Southeast Supply Enhancement Project (SSEP) – Clean Water Act Section 404 Permit Application (SAW-2024-01961)
https://fractracker.org/wp-content/uploads/2021/06/SShamer_Infrastructure-pipeline-rightofway-ColumbiaLineMB-BaltimoreCounty-MD-May2016.jpg
266
400
FracTracker Alliance
https://fractracker.org/wp-content/uploads/2025/09/2025-Wordmark-Logo.png
FracTracker Alliance2025-09-03 16:14:462025-09-30 10:26:57Comment Opposing the Southeast Supply Enhancement Project (SSEP) – Clean Water Act Section 404 Permit Application (SAW-2024-01961)Gathering Lines in Bradford County, Pennsylvania
A narrative account of creating fracking pipeline data for northeastern Pennsylvania
Overview
Gathering lines are not consistently documented by public agencies. As part of FracTracker’s efforts to supply the public with reliable data on oil and gas gathering pipelines, spring Data & GIS intern Jack traced gathering lines in Bradford County, PA.
The Project
For every natural gas well, there is a network of pipelines and compressors that transport the material to refinement and distribution centers. Overall, there are two types of pipelines: gathering lines and transmission lines. Gathering lines transport materials from the wells to the larger transmission lines that pump materials across state lines. While transmission lines—like the Keystone XL pipeline—make national news, people often overlook the details of the underlying gathering lines.
In order to better understand their environmental and social impacts, FracTracker Alliance has a large ongoing project to map these gathering lines. As a part of this project, I analyzed fracking development in northeastern Pennsylvania. This particular area is a stronghold of the fracking industry and features over 8,000 unconventional natural gas wells.
Bradford County, Pennsylvania
Bradford County is one of the region’s hotspots for fracking activity. According to the Pennsylvania Department of Environmental Protection (PA DEP), the first fracking permit dates all the way back to 1995. However. large expansion of this industry did not begin until 2010. From the beginning of 2010 to the end of 2011, the PA DEP issued over 1,500 permits for unconventional natural gas wells. Permitting rates remained high through 2015 before dropping off. In total, the PA DEP has issued over 4,000 fracking permits, and there are currently over 500 active wells in Bradford county.
From our tracing efforts, we recorded roughly 7,000 acres (~11 square miles) of land cleared for gathering lines in Bradford County alone. To put this number into perspective, that is about half the entire acreage of Manhattan. This acreage total is just for the network of pipelines and does not include the area cleared for the wells as well. These gathering lines cut through a variety of landscapes. Some well pads and gathering lines are completely encased in forest, while others zig-zag through residential and agricultural areas.
The footprint of this industry is everywhere in Bradford county. While combing through thousands of acres of satellite imagery, I often wondered why this was needed. There had to be somebody holding this information already. Once I had nearly finished with Bradford County, I learned that FracTracker Alliance had digitized records presented to the public by the county. These were records of both where gathering lines were, and proposals of new pipelines to install.
Part of me was relieved. In my mind, the accounting of ubiquitous infrastructure that can affect communities should be the responsibility of the state or federal government—not a small organization. However, I quickly realized there was an issue.
Map 1

Figure 1. Comparison of gathering line data in Bradford County. The county record of proposed and existing gathering lines is purple and the area cleared for gathering lines traced from satellite imagery is outlined in black with orange fill.
The map above shows the proposed gathering lines in purple and the gathering lines traced using satellite imagery in black and orange. Overall, the general shape of the county’s record and traced are nearly the same. Viewing at this scale, there appears to only be a small difference in placement between the information presented to the public and what was actually put into the ground.
Map 2

Figure 2. A comparison of gathering line data in Bradford County at the local level. The county record is purple, while the area cleared for gathering lines traced from satellite imagery is orange with a black outline.
However, when we zoom in, the differences in the data quality become clear. The county record contains only lines and do not plot out the actual area used. As a result, this data functionally has very few uses. For example, the county cannot calculate the amount of forest cleared due to construction or how much pipeline is in areas with high erosion.
The information available to the public is also only the idealized shape and does not represent the actual construction. From tracing the satellite images, you can tell construction workers must make many decisions during the installation process that deviate from a perfect shape. However, a proper record of these decisions—the little kinks and turns of this network—are never asked for. You might also notice that there are whole sections of traced gathering lines completely absent from the county record.
At times, the county record differs from the actual placement by nearly one-thousand feet. This is not a rounding error. That difference is like mistaking your neighbor’s house down the street for your own. It is not an acceptable standard of information. We need greater detail.
The Take Away
There are large discrepancies surrounding the data about gathering lines. Often information about fracking and the energy industry is not readily available to the public for reasons of national security. However, by not having accurate information available at the local level, communities are ill prepared to manage and respond when problems arise. While the natural gas industry is not new, many of the functional elements of fracking are. This includes topic like how to manage fracking waste, what is the proper distance to maintain from extraction activities, and how to plug or deprecate old wells. As this industry continues, local communities have the burden of figuring out these answers while equipped with poor information.
FracTracker Alliance’s ongoing work to map out these gathering lines is a great first step for providing these communities with the information they need. However, due to the limitations of different tracing methods and the sheer size of the fracking industry, it is difficult to produce anything more than a conservative estimate of all this infrastructure. In order for communities to fully assess the environmental effects, there needs to be a fundamental change in the type, quality, and availability of information governments demands from this industry.
References & Where to Learn More
- FracTracker article, Mapping Gathering Lines in Ohio and West Virginia
- FracTracker Pennsylvania maps and data
Topics in This Article:
Join the Conversation
Stay Informed
FracTracker Newsletter
Support Our Work
FracTracker Alliance helps communicate the risks of oil and gas and petrochemical development to advance just energy alternatives that protect public health, natural resources, and the climate.
By contributing to FracTracker, you are helping to make tangible changes, such as decreasing the number of oil and gas wells in the US, protecting the public from toxic and radioactive chemicals, and stopping petrochemical expansion into vulnerable communities.
Your donations help fund the sourcing and analysis of new data so that we can keep you informed and continually update our resources.
Please donate to FracTracker today as a way to advocate for clean water, clean air, and healthy communities.
What You Should Read Next
https://fractracker.org/wp-content/uploads/2021/06/SShamer_Infrastructure-pipeline-rightofway-ColumbiaLineMB-BaltimoreCounty-MD-May2016.jpg
266
400
FracTracker Alliance
https://fractracker.org/wp-content/uploads/2025/09/2025-Wordmark-Logo.png
FracTracker Alliance2025-09-03 16:14:462025-09-30 10:26:57Comment Opposing the Southeast Supply Enhancement Project (SSEP) – Clean Water Act Section 404 Permit Application (SAW-2024-01961)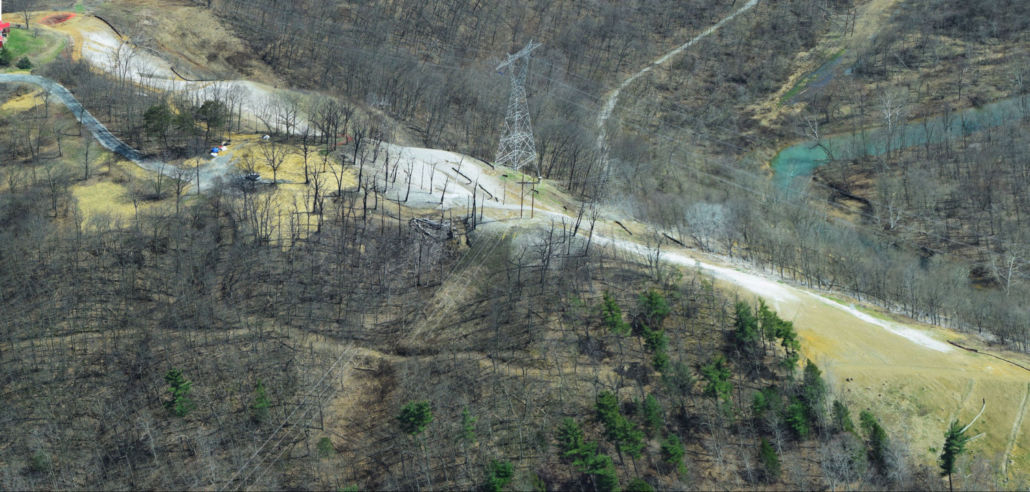 https://fractracker.org/wp-content/uploads/2021/04/49770601811_6cc7e18996_k.jpg
716
1500
Matt Kelso, BA
https://fractracker.org/wp-content/uploads/2025/09/2025-Wordmark-Logo.png
Matt Kelso, BA2025-04-07 15:42:272025-04-07 15:42:27Pipeline Incidents Are a Daily Occurrence
https://fractracker.org/wp-content/uploads/2021/04/49770601811_6cc7e18996_k.jpg
716
1500
Matt Kelso, BA
https://fractracker.org/wp-content/uploads/2025/09/2025-Wordmark-Logo.png
Matt Kelso, BA2025-04-07 15:42:272025-04-07 15:42:27Pipeline Incidents Are a Daily Occurrence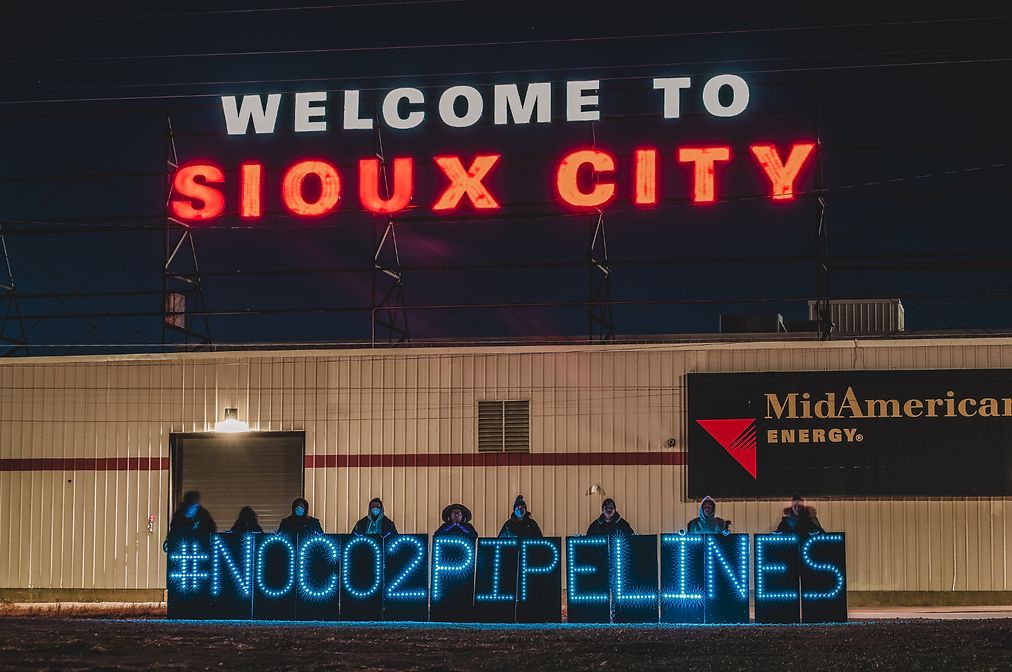 Great Plains Action Society
https://fractracker.org/wp-content/uploads/2024/10/No-CO2-Ppelines-Sioux-City.jpg
672
1012
Gwen Klenke
https://fractracker.org/wp-content/uploads/2025/09/2025-Wordmark-Logo.png
Gwen Klenke2024-10-22 11:55:082024-10-25 12:10:00Indigenous Communities’ Fight Against CO2 Pipelines in the Great Plains
Great Plains Action Society
https://fractracker.org/wp-content/uploads/2024/10/No-CO2-Ppelines-Sioux-City.jpg
672
1012
Gwen Klenke
https://fractracker.org/wp-content/uploads/2025/09/2025-Wordmark-Logo.png
Gwen Klenke2024-10-22 11:55:082024-10-25 12:10:00Indigenous Communities’ Fight Against CO2 Pipelines in the Great Plains https://fractracker.org/wp-content/uploads/2025/09/2025-Wordmark-Logo.png
0
0
FracTracker Alliance
https://fractracker.org/wp-content/uploads/2025/09/2025-Wordmark-Logo.png
FracTracker Alliance2024-06-05 17:41:582024-06-06 09:18:40A Closer Look at Risks of the Appalachian Hydrogen Hub
https://fractracker.org/wp-content/uploads/2025/09/2025-Wordmark-Logo.png
0
0
FracTracker Alliance
https://fractracker.org/wp-content/uploads/2025/09/2025-Wordmark-Logo.png
FracTracker Alliance2024-06-05 17:41:582024-06-06 09:18:40A Closer Look at Risks of the Appalachian Hydrogen Hub FracTracker Alliance, 2024
https://fractracker.org/wp-content/uploads/2024/06/Falcon-Pipeline-Violations-2024.jpg
844
1500
Katie Jones
https://fractracker.org/wp-content/uploads/2025/09/2025-Wordmark-Logo.png
Katie Jones2024-06-05 10:35:022024-06-05 11:36:30Falcon Pipeline Criminal Charges Explained
FracTracker Alliance, 2024
https://fractracker.org/wp-content/uploads/2024/06/Falcon-Pipeline-Violations-2024.jpg
844
1500
Katie Jones
https://fractracker.org/wp-content/uploads/2025/09/2025-Wordmark-Logo.png
Katie Jones2024-06-05 10:35:022024-06-05 11:36:30Falcon Pipeline Criminal Charges Explained Ted Auch, FracTracker Alliance, 2022
https://fractracker.org/wp-content/uploads/2023/02/DSC_1026_LowRes.jpg
1000
1500
Matt Kelso, BA
https://fractracker.org/wp-content/uploads/2025/09/2025-Wordmark-Logo.png
Matt Kelso, BA2023-02-01 15:36:182023-02-01 17:01:372022 Pipeline Incidents Update: Is Pipeline Safety Achievable?
Ted Auch, FracTracker Alliance, 2022
https://fractracker.org/wp-content/uploads/2023/02/DSC_1026_LowRes.jpg
1000
1500
Matt Kelso, BA
https://fractracker.org/wp-content/uploads/2025/09/2025-Wordmark-Logo.png
Matt Kelso, BA2023-02-01 15:36:182023-02-01 17:01:372022 Pipeline Incidents Update: Is Pipeline Safety Achievable? https://fractracker.org/wp-content/uploads/2021/03/TAuch_Transportation-RoverPipeline_Construction-EnergyTransferPartners-Woodsfield_OH_May2017.jpg
576
1500
Karen Edelstein
https://fractracker.org/wp-content/uploads/2025/09/2025-Wordmark-Logo.png
Karen Edelstein2022-11-30 17:50:122024-01-22 16:03:23A Contentious Landscape of Pipeline Build-outs in the Eastern US
https://fractracker.org/wp-content/uploads/2021/03/TAuch_Transportation-RoverPipeline_Construction-EnergyTransferPartners-Woodsfield_OH_May2017.jpg
576
1500
Karen Edelstein
https://fractracker.org/wp-content/uploads/2025/09/2025-Wordmark-Logo.png
Karen Edelstein2022-11-30 17:50:122024-01-22 16:03:23A Contentious Landscape of Pipeline Build-outs in the Eastern US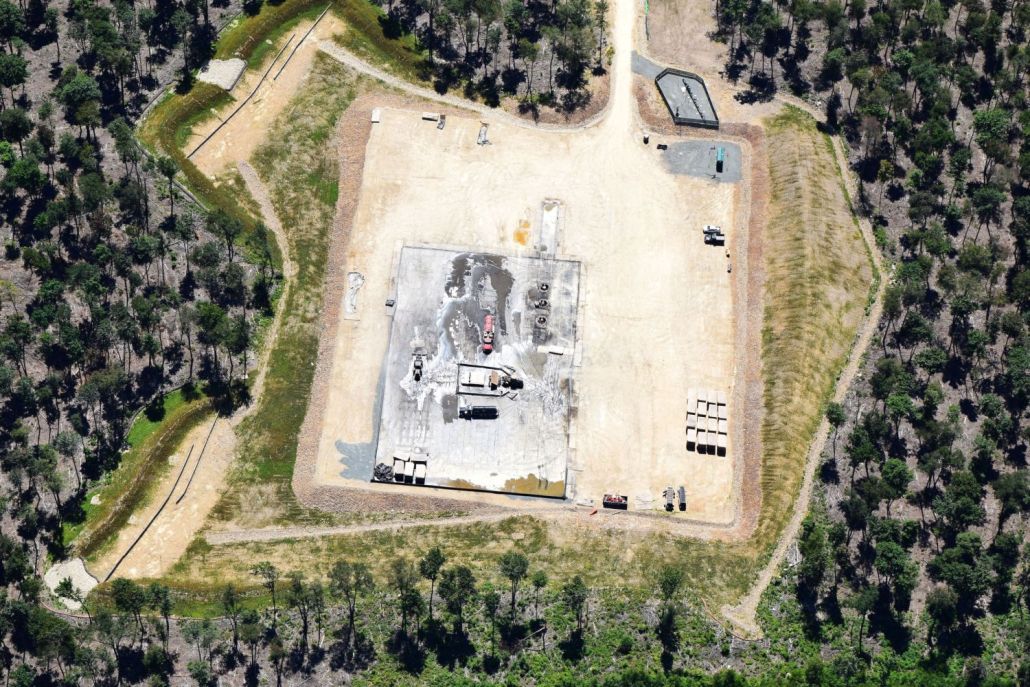 https://fractracker.org/wp-content/uploads/2022/11/DSC_1359_HighRes.jpg
1000
1500
FracTracker Alliance
https://fractracker.org/wp-content/uploads/2025/09/2025-Wordmark-Logo.png
FracTracker Alliance2022-11-23 15:15:112025-03-06 15:40:10Coursing Through Gasland: A Digital Atlas Exploring Natural Gas Development in the Towanda Creek Watershed
https://fractracker.org/wp-content/uploads/2022/11/DSC_1359_HighRes.jpg
1000
1500
FracTracker Alliance
https://fractracker.org/wp-content/uploads/2025/09/2025-Wordmark-Logo.png
FracTracker Alliance2022-11-23 15:15:112025-03-06 15:40:10Coursing Through Gasland: A Digital Atlas Exploring Natural Gas Development in the Towanda Creek Watershed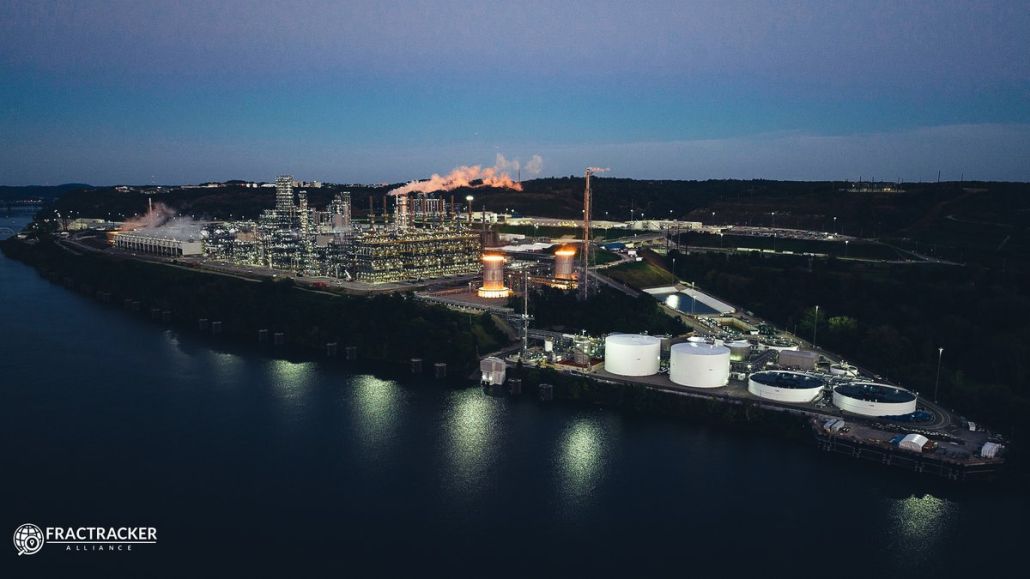 https://fractracker.org/wp-content/uploads/2022/11/Fhn3YgeXkAI0QiX.jpg
675
1200
Erica Jackson
https://fractracker.org/wp-content/uploads/2025/09/2025-Wordmark-Logo.png
Erica Jackson2022-11-17 16:43:392022-11-18 13:41:39Falcon Pipeline Online, Begins Operations Following Violations of Clean Streams Law
https://fractracker.org/wp-content/uploads/2022/11/Fhn3YgeXkAI0QiX.jpg
675
1200
Erica Jackson
https://fractracker.org/wp-content/uploads/2025/09/2025-Wordmark-Logo.png
Erica Jackson2022-11-17 16:43:392022-11-18 13:41:39Falcon Pipeline Online, Begins Operations Following Violations of Clean Streams Law https://fractracker.org/wp-content/uploads/2022/06/CCSHFeatureImage.jpg
667
1500
Guest Author
https://fractracker.org/wp-content/uploads/2025/09/2025-Wordmark-Logo.png
Guest Author2022-06-23 15:29:312022-06-30 12:30:43An Insider Take on the Appalachian Hydrogen & CCUS Conference
https://fractracker.org/wp-content/uploads/2022/06/CCSHFeatureImage.jpg
667
1500
Guest Author
https://fractracker.org/wp-content/uploads/2025/09/2025-Wordmark-Logo.png
Guest Author2022-06-23 15:29:312022-06-30 12:30:43An Insider Take on the Appalachian Hydrogen & CCUS Conference https://fractracker.org/wp-content/uploads/2022/04/TAuch_Cultural-Harvey_FamilyFarm_NEXUS_Pipeline-DTEEnergy_Enbridge-ChippewaLake_MedinaCounty_OH_May20183-feature.jpg
667
1500
Ted Auch, PhD
https://fractracker.org/wp-content/uploads/2025/09/2025-Wordmark-Logo.png
Ted Auch, PhD2022-04-28 14:12:552022-04-28 14:12:55Real Talk on Pipelines
https://fractracker.org/wp-content/uploads/2022/04/TAuch_Cultural-Harvey_FamilyFarm_NEXUS_Pipeline-DTEEnergy_Enbridge-ChippewaLake_MedinaCounty_OH_May20183-feature.jpg
667
1500
Ted Auch, PhD
https://fractracker.org/wp-content/uploads/2025/09/2025-Wordmark-Logo.png
Ted Auch, PhD2022-04-28 14:12:552022-04-28 14:12:55Real Talk on Pipelines https://fractracker.org/wp-content/uploads/2022/04/Russia-Ukraine-Energy-feature.jpg
667
1500
FracTracker Alliance
https://fractracker.org/wp-content/uploads/2025/09/2025-Wordmark-Logo.png
FracTracker Alliance2022-04-20 13:25:452022-04-20 17:23:17Mapping Energy Systems Impacted by the Russia-Ukraine War
https://fractracker.org/wp-content/uploads/2022/04/Russia-Ukraine-Energy-feature.jpg
667
1500
FracTracker Alliance
https://fractracker.org/wp-content/uploads/2025/09/2025-Wordmark-Logo.png
FracTracker Alliance2022-04-20 13:25:452022-04-20 17:23:17Mapping Energy Systems Impacted by the Russia-Ukraine War https://fractracker.org/wp-content/uploads/2021/12/173695136_1422048161521006_7197500259062906334_n.jpg
667
1500
Erica Jackson
https://fractracker.org/wp-content/uploads/2025/09/2025-Wordmark-Logo.png
Erica Jackson2021-12-01 15:27:402021-12-01 15:27:40New Letter from Federal Regulators Regarding how the Falcon has Been Investigated
https://fractracker.org/wp-content/uploads/2021/12/173695136_1422048161521006_7197500259062906334_n.jpg
667
1500
Erica Jackson
https://fractracker.org/wp-content/uploads/2025/09/2025-Wordmark-Logo.png
Erica Jackson2021-12-01 15:27:402021-12-01 15:27:40New Letter from Federal Regulators Regarding how the Falcon has Been Investigated https://fractracker.org/wp-content/uploads/2021/10/Chickahominy-feature.jpg
667
1500
Karen Edelstein
https://fractracker.org/wp-content/uploads/2025/09/2025-Wordmark-Logo.png
Karen Edelstein2021-11-01 13:29:122021-12-17 11:53:41Chickahominy Pipeline project tries to exploit an apparent regulatory loophole
https://fractracker.org/wp-content/uploads/2021/10/Chickahominy-feature.jpg
667
1500
Karen Edelstein
https://fractracker.org/wp-content/uploads/2025/09/2025-Wordmark-Logo.png
Karen Edelstein2021-11-01 13:29:122021-12-17 11:53:41Chickahominy Pipeline project tries to exploit an apparent regulatory loophole https://fractracker.org/wp-content/uploads/2021/10/Mariner-East-2-feature.jpg
667
1500
Erica Jackson
https://fractracker.org/wp-content/uploads/2025/09/2025-Wordmark-Logo.png
Erica Jackson2021-10-29 13:02:432021-11-01 12:17:20Map Update on Criminal Charges Facing Mariner East 2 Pipeline
https://fractracker.org/wp-content/uploads/2021/10/Mariner-East-2-feature.jpg
667
1500
Erica Jackson
https://fractracker.org/wp-content/uploads/2025/09/2025-Wordmark-Logo.png
Erica Jackson2021-10-29 13:02:432021-11-01 12:17:20Map Update on Criminal Charges Facing Mariner East 2 Pipeline https://fractracker.org/wp-content/uploads/2021/08/Texas-Infrastructure-Feature-.jpg
667
1500
Intern FracTracker
https://fractracker.org/wp-content/uploads/2025/09/2025-Wordmark-Logo.png
Intern FracTracker2021-09-14 08:00:002022-01-24 17:49:20Infrastructure Networks in Texas
https://fractracker.org/wp-content/uploads/2021/08/Texas-Infrastructure-Feature-.jpg
667
1500
Intern FracTracker
https://fractracker.org/wp-content/uploads/2025/09/2025-Wordmark-Logo.png
Intern FracTracker2021-09-14 08:00:002022-01-24 17:49:20Infrastructure Networks in Texas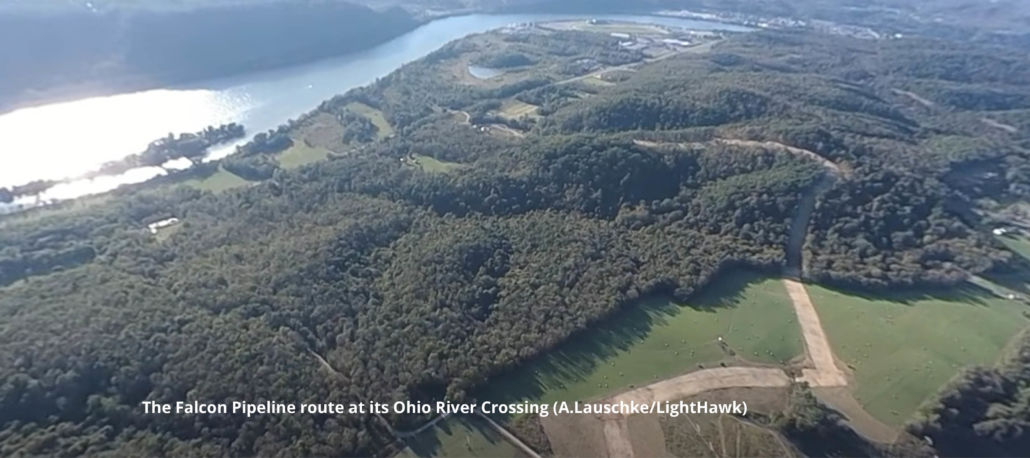 https://fractracker.org/wp-content/uploads/2021/03/Falcon-Ohio-River-Crossing-Feature-A.LauschkeLightHawk-scaled.jpg
667
1500
Erica Jackson
https://fractracker.org/wp-content/uploads/2025/09/2025-Wordmark-Logo.png
Erica Jackson2021-08-24 07:15:232021-08-23 17:30:12Ongoing Safety Concerns over Shell’s Falcon Pipeline
https://fractracker.org/wp-content/uploads/2021/03/Falcon-Ohio-River-Crossing-Feature-A.LauschkeLightHawk-scaled.jpg
667
1500
Erica Jackson
https://fractracker.org/wp-content/uploads/2025/09/2025-Wordmark-Logo.png
Erica Jackson2021-08-24 07:15:232021-08-23 17:30:12Ongoing Safety Concerns over Shell’s Falcon Pipeline https://fractracker.org/wp-content/uploads/2021/06/National-Map-2021-Feature.jpg
667
1500
Erica Jackson
https://fractracker.org/wp-content/uploads/2025/09/2025-Wordmark-Logo.png
Erica Jackson2021-06-30 08:00:252022-05-02 15:24:21Updated National Energy and Petrochemical Map
https://fractracker.org/wp-content/uploads/2021/06/National-Map-2021-Feature.jpg
667
1500
Erica Jackson
https://fractracker.org/wp-content/uploads/2025/09/2025-Wordmark-Logo.png
Erica Jackson2021-06-30 08:00:252022-05-02 15:24:21Updated National Energy and Petrochemical Map https://fractracker.org/wp-content/uploads/2021/06/TAuch_Infrastructure-Hopedale_Cryogenic_Plant-MarkWest_Energy-HarrisonCounty-OH_Nov2020-Feature.jpg
667
1500
Ted Auch, PhD
https://fractracker.org/wp-content/uploads/2025/09/2025-Wordmark-Logo.png
Ted Auch, PhD2021-06-11 12:26:292021-07-01 11:12:42Ohio, West Virginia, Pennsylvania Fracking Story Map
https://fractracker.org/wp-content/uploads/2021/06/TAuch_Infrastructure-Hopedale_Cryogenic_Plant-MarkWest_Energy-HarrisonCounty-OH_Nov2020-Feature.jpg
667
1500
Ted Auch, PhD
https://fractracker.org/wp-content/uploads/2025/09/2025-Wordmark-Logo.png
Ted Auch, PhD2021-06-11 12:26:292021-07-01 11:12:42Ohio, West Virginia, Pennsylvania Fracking Story Map EPA
https://fractracker.org/wp-content/uploads/2021/05/Colonial-pipeline-spill-feature.jpg
667
1500
Karen Edelstein
https://fractracker.org/wp-content/uploads/2025/09/2025-Wordmark-Logo.png
Karen Edelstein2021-05-26 07:00:272023-07-18 10:31:34Impacts of 2020 Colonial Pipeline Rupture Continue to Grow
EPA
https://fractracker.org/wp-content/uploads/2021/05/Colonial-pipeline-spill-feature.jpg
667
1500
Karen Edelstein
https://fractracker.org/wp-content/uploads/2025/09/2025-Wordmark-Logo.png
Karen Edelstein2021-05-26 07:00:272023-07-18 10:31:34Impacts of 2020 Colonial Pipeline Rupture Continue to Grow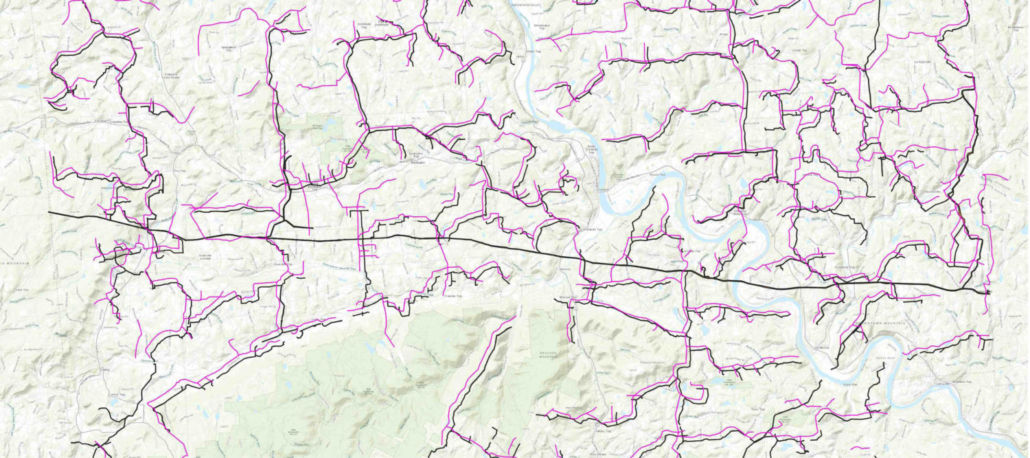 https://fractracker.org/wp-content/uploads/2021/05/Bradford-County-PA-gathering-lines-feature.jpg
667
1500
Intern FracTracker
https://fractracker.org/wp-content/uploads/2025/09/2025-Wordmark-Logo.png
Intern FracTracker2021-05-19 10:51:122021-05-20 14:41:22Mapping Gathering Lines in Bradford County, Pennsylvania
https://fractracker.org/wp-content/uploads/2021/04/49770601811_6cc7e18996_k.jpg
716
1500
Matt Kelso, BA
https://fractracker.org/wp-content/uploads/2025/09/2025-Wordmark-Logo.png
Matt Kelso, BA2021-04-14 15:01:522021-04-26 17:02:402021 Pipeline Incidents Update: Safety Record Not Improving
https://fractracker.org/wp-content/uploads/2021/05/Bradford-County-PA-gathering-lines-feature.jpg
667
1500
Intern FracTracker
https://fractracker.org/wp-content/uploads/2025/09/2025-Wordmark-Logo.png
Intern FracTracker2021-05-19 10:51:122021-05-20 14:41:22Mapping Gathering Lines in Bradford County, Pennsylvania
https://fractracker.org/wp-content/uploads/2021/04/49770601811_6cc7e18996_k.jpg
716
1500
Matt Kelso, BA
https://fractracker.org/wp-content/uploads/2025/09/2025-Wordmark-Logo.png
Matt Kelso, BA2021-04-14 15:01:522021-04-26 17:02:402021 Pipeline Incidents Update: Safety Record Not Improving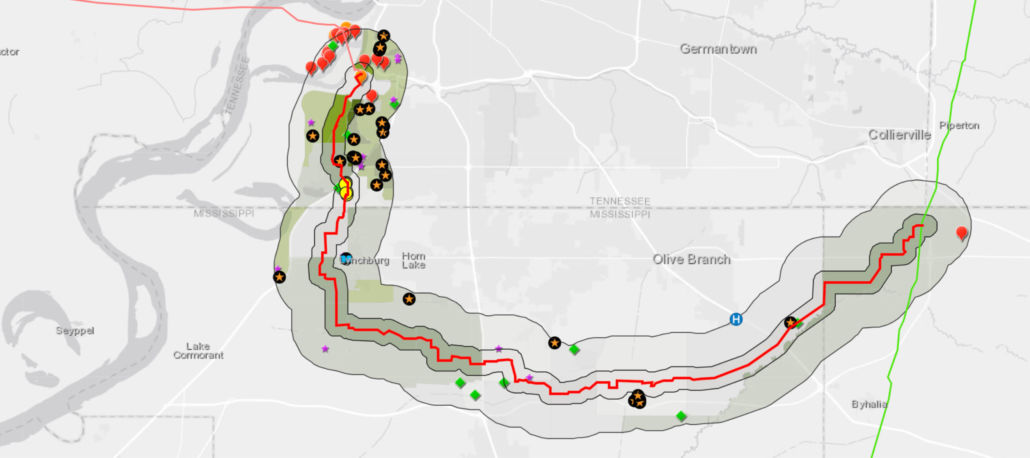 https://fractracker.org/wp-content/uploads/2021/03/Byhalia-map-feature-2-scaled.jpg
667
1500
Karen Edelstein
https://fractracker.org/wp-content/uploads/2025/09/2025-Wordmark-Logo.png
Karen Edelstein2021-03-17 17:06:302021-09-16 13:15:25Risky Byhalia Connection Pipeline Threatens Tennessee & Mississippi Health, Water Supply
https://fractracker.org/wp-content/uploads/2021/03/Falcon-Ohio-River-Crossing-Feature-A.LauschkeLightHawk-scaled.jpg
667
1500
Erica Jackson
https://fractracker.org/wp-content/uploads/2025/09/2025-Wordmark-Logo.png
Erica Jackson2021-03-17 08:48:432021-04-15 15:11:21Shell’s Falcon Pipeline Under Investigation for Serious Public Safety Threats
https://fractracker.org/wp-content/uploads/2021/03/Byhalia-map-feature-2-scaled.jpg
667
1500
Karen Edelstein
https://fractracker.org/wp-content/uploads/2025/09/2025-Wordmark-Logo.png
Karen Edelstein2021-03-17 17:06:302021-09-16 13:15:25Risky Byhalia Connection Pipeline Threatens Tennessee & Mississippi Health, Water Supply
https://fractracker.org/wp-content/uploads/2021/03/Falcon-Ohio-River-Crossing-Feature-A.LauschkeLightHawk-scaled.jpg
667
1500
Erica Jackson
https://fractracker.org/wp-content/uploads/2025/09/2025-Wordmark-Logo.png
Erica Jackson2021-03-17 08:48:432021-04-15 15:11:21Shell’s Falcon Pipeline Under Investigation for Serious Public Safety Threats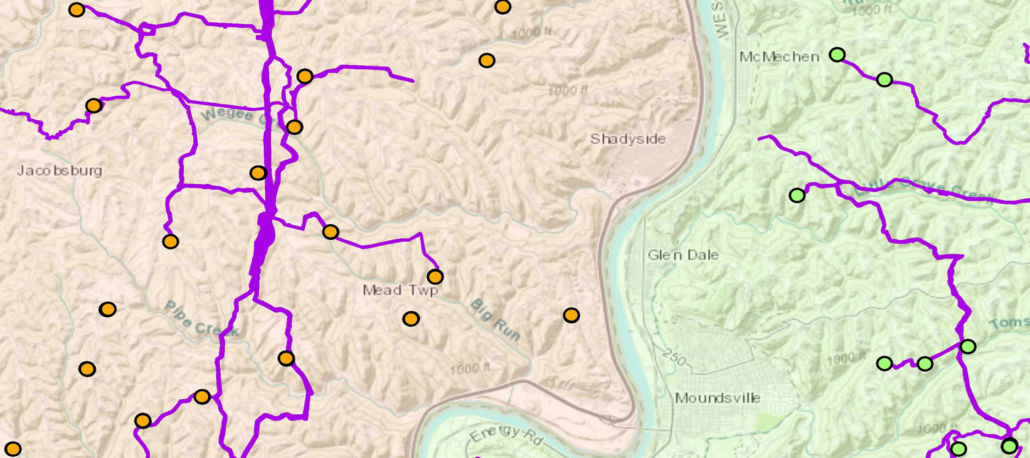 https://fractracker.org/wp-content/uploads/2020/07/Mapping-gathering-lines-in-OH-and-WV-feature.jpg
833
1875
Intern FracTracker
https://fractracker.org/wp-content/uploads/2025/09/2025-Wordmark-Logo.png
Intern FracTracker2020-07-02 12:09:192025-05-02 14:45:00Mapping Gathering Lines in Ohio and West Virginia
https://fractracker.org/wp-content/uploads/2020/07/Mapping-gathering-lines-in-OH-and-WV-feature.jpg
833
1875
Intern FracTracker
https://fractracker.org/wp-content/uploads/2025/09/2025-Wordmark-Logo.png
Intern FracTracker2020-07-02 12:09:192025-05-02 14:45:00Mapping Gathering Lines in Ohio and West Virginia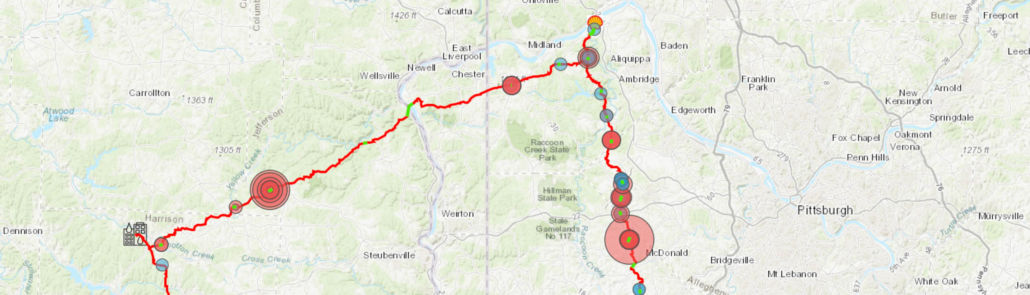 https://fractracker.org/wp-content/uploads/2020/06/FalconPipelineFrontPage-scaled.jpg
430
1500
Erica Jackson
https://fractracker.org/wp-content/uploads/2025/09/2025-Wordmark-Logo.png
Erica Jackson2020-06-16 11:47:062021-04-15 14:16:44Falcon Pipeline Construction Releases over 250,000 Gallons of Drilling Fluid in Pennsylvania and Ohio
https://fractracker.org/wp-content/uploads/2020/06/FalconPipelineFrontPage-scaled.jpg
430
1500
Erica Jackson
https://fractracker.org/wp-content/uploads/2025/09/2025-Wordmark-Logo.png
Erica Jackson2020-06-16 11:47:062021-04-15 14:16:44Falcon Pipeline Construction Releases over 250,000 Gallons of Drilling Fluid in Pennsylvania and Ohio https://fractracker.org/wp-content/uploads/2020/05/North-Brooklyn-Pipeline-demographics_1.jpg
914
2242
Guest Author
https://fractracker.org/wp-content/uploads/2025/09/2025-Wordmark-Logo.png
Guest Author2020-05-18 09:00:212021-04-15 14:16:48New Yorkers mount resistance against North Brooklyn Pipeline
https://fractracker.org/wp-content/uploads/2020/05/North-Brooklyn-Pipeline-demographics_1.jpg
914
2242
Guest Author
https://fractracker.org/wp-content/uploads/2025/09/2025-Wordmark-Logo.png
Guest Author2020-05-18 09:00:212021-04-15 14:16:48New Yorkers mount resistance against North Brooklyn Pipeline https://fractracker.org/wp-content/uploads/2020/02/National-map-feature-3.png
400
900
Erica Jackson
https://fractracker.org/wp-content/uploads/2025/09/2025-Wordmark-Logo.png
Erica Jackson2020-02-28 17:35:142022-05-02 15:21:42National Energy and Petrochemical Map
https://fractracker.org/wp-content/uploads/2019/02/San-Bruno-Aftermath-feature-image.png
400
900
Matt Kelso, BA
https://fractracker.org/wp-content/uploads/2025/09/2025-Wordmark-Logo.png
Matt Kelso, BA2020-02-21 16:13:542021-04-15 14:55:30Pipelines Continue to Catch Fire and Explode
https://fractracker.org/wp-content/uploads/2020/02/National-map-feature-3.png
400
900
Erica Jackson
https://fractracker.org/wp-content/uploads/2025/09/2025-Wordmark-Logo.png
Erica Jackson2020-02-28 17:35:142022-05-02 15:21:42National Energy and Petrochemical Map
https://fractracker.org/wp-content/uploads/2019/02/San-Bruno-Aftermath-feature-image.png
400
900
Matt Kelso, BA
https://fractracker.org/wp-content/uploads/2025/09/2025-Wordmark-Logo.png
Matt Kelso, BA2020-02-21 16:13:542021-04-15 14:55:30Pipelines Continue to Catch Fire and Explode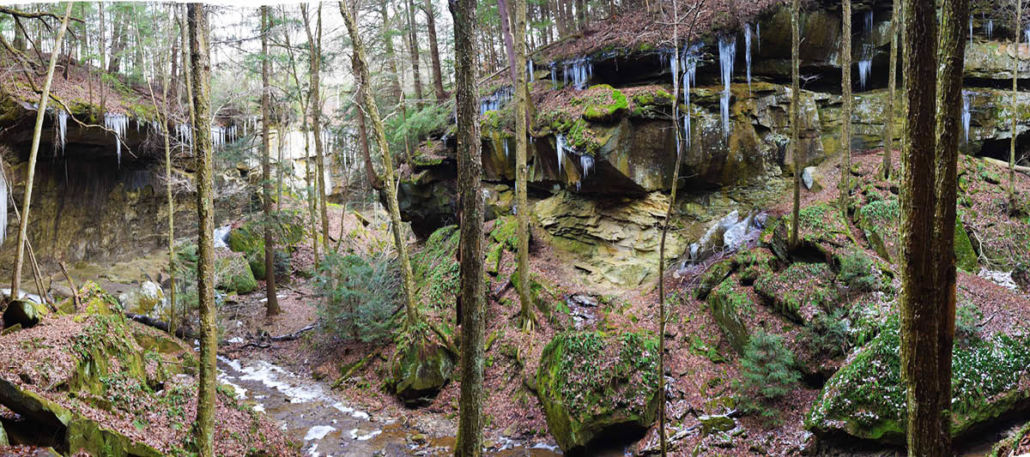 Photo by Ted Auch, FracTracker Alliance
https://fractracker.org/wp-content/uploads/2019/12/Captina-Creek-Watershed-Feature.jpg
533
1200
Ted Auch, PhD
https://fractracker.org/wp-content/uploads/2025/09/2025-Wordmark-Logo.png
Ted Auch, PhD2019-12-20 09:49:212021-04-15 14:55:33Fracking Threatens Ohio’s Captina Creek Watershed
Photo by Ted Auch, FracTracker Alliance
https://fractracker.org/wp-content/uploads/2019/12/Captina-Creek-Watershed-Feature.jpg
533
1200
Ted Auch, PhD
https://fractracker.org/wp-content/uploads/2025/09/2025-Wordmark-Logo.png
Ted Auch, PhD2019-12-20 09:49:212021-04-15 14:55:33Fracking Threatens Ohio’s Captina Creek Watershed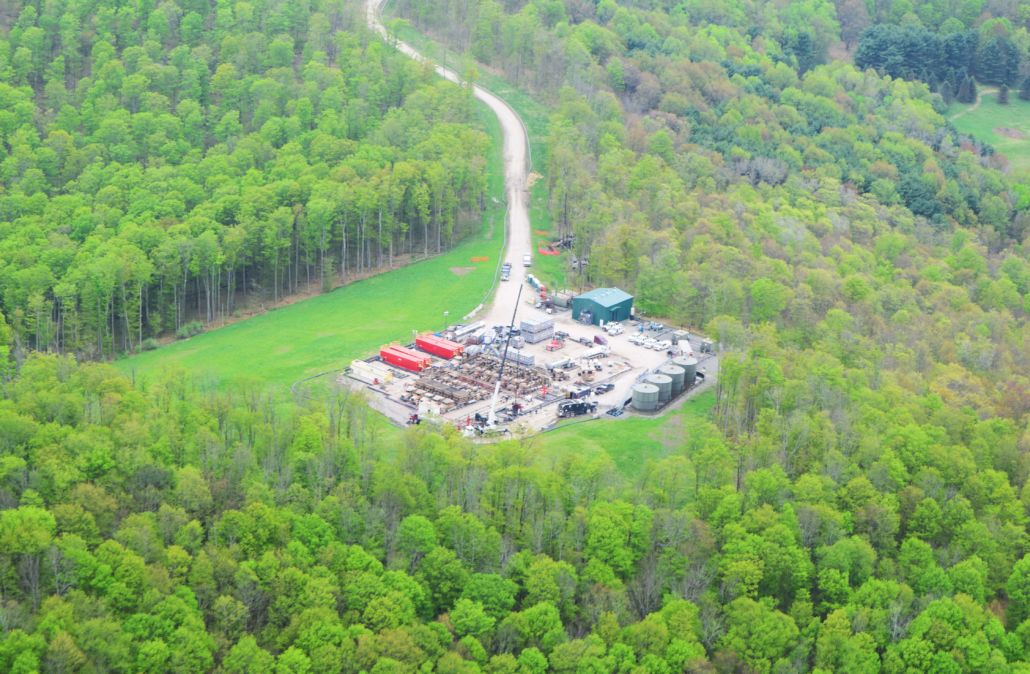 https://fractracker.org/wp-content/uploads/2019/07/DSC_0624_LowRes-scaled.jpg
982
1500
Shannon Smith
https://fractracker.org/wp-content/uploads/2025/09/2025-Wordmark-Logo.png
Shannon Smith2019-08-07 09:36:032026-04-28 15:34:37Wildness Lost – Pine Creek
https://fractracker.org/wp-content/uploads/2019/07/DSC_0624_LowRes-scaled.jpg
982
1500
Shannon Smith
https://fractracker.org/wp-content/uploads/2025/09/2025-Wordmark-Logo.png
Shannon Smith2019-08-07 09:36:032026-04-28 15:34:37Wildness Lost – Pine Creek https://fractracker.org/wp-content/uploads/2019/05/PipelineConstructionFeature.png
667
1500
Erica Jackson
https://fractracker.org/wp-content/uploads/2025/09/2025-Wordmark-Logo.png
Erica Jackson2019-05-08 08:27:302021-04-15 14:56:31The Falcon Public Monitoring Project
https://fractracker.org/wp-content/uploads/2019/05/PipelineConstructionFeature.png
667
1500
Erica Jackson
https://fractracker.org/wp-content/uploads/2025/09/2025-Wordmark-Logo.png
Erica Jackson2019-05-08 08:27:302021-04-15 14:56:31The Falcon Public Monitoring Project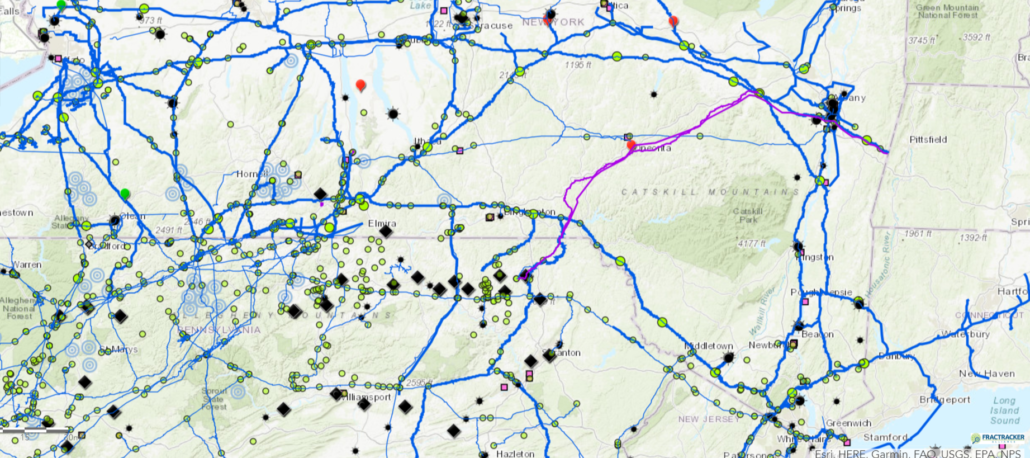 https://fractracker.org/wp-content/uploads/2019/04/YouAreHereMap2.png
667
1500
Guest Author
https://fractracker.org/wp-content/uploads/2025/09/2025-Wordmark-Logo.png
Guest Author2019-04-24 15:49:052021-04-15 14:56:34Release: The 2019 You Are Here map launches, showing New York’s hurdles to climate leadership
https://fractracker.org/wp-content/uploads/2019/04/YouAreHereMap2.png
667
1500
Guest Author
https://fractracker.org/wp-content/uploads/2025/09/2025-Wordmark-Logo.png
Guest Author2019-04-24 15:49:052021-04-15 14:56:34Release: The 2019 You Are Here map launches, showing New York’s hurdles to climate leadership https://fractracker.org/wp-content/uploads/2019/02/PipelineConstructionPA.png
400
900
Karen Edelstein
https://fractracker.org/wp-content/uploads/2025/09/2025-Wordmark-Logo.png
Karen Edelstein2019-02-28 19:24:532021-04-15 14:56:54The Growing Web of Oil and Gas Pipelines
https://fractracker.org/wp-content/uploads/2019/02/San-Bruno-Aftermath-feature-image.png
400
900
Guest Author
https://fractracker.org/wp-content/uploads/2025/09/2025-Wordmark-Logo.png
Guest Author2019-02-08 19:21:012021-04-15 14:56:55Unnatural Disasters
https://fractracker.org/wp-content/uploads/2019/02/PipelineConstructionPA.png
400
900
Karen Edelstein
https://fractracker.org/wp-content/uploads/2025/09/2025-Wordmark-Logo.png
Karen Edelstein2019-02-28 19:24:532021-04-15 14:56:54The Growing Web of Oil and Gas Pipelines
https://fractracker.org/wp-content/uploads/2019/02/San-Bruno-Aftermath-feature-image.png
400
900
Guest Author
https://fractracker.org/wp-content/uploads/2025/09/2025-Wordmark-Logo.png
Guest Author2019-02-08 19:21:012021-04-15 14:56:55Unnatural Disasters![]()
216 Franklin St, Suite 400, Johnstown, PA 15901
Phone: +1 (717) 303-0403 | info@fractracker.org
FracTracker Alliance is a 501(c)3 non-profit: Tax identification number: 80-0844297
It would be so much more useful and publicly transparent if the PADEP would post online the GIS shapefile information regarding the locations of pipelines, wells, etc. (really any large project). They get shapefiles from the applicants when they are reviewing permit applications, so it is a simple matter to post it online. I do not buy the argument that the locations are confidential because it is critical energy infrastructure somehow protected for national security purposes. When the pipelines are only “proposed” they present no risk, and once they are in the ground, it is clear to anyone where they are.
Agreed!