Mapping a new vision in PA: Alternatives to petrochemical development
At a Re-Imagine Beaver County gathering in Pennsylvania earlier this month, static maps became dynamic in the hands of those who live in and around the region depicted. Residents of this area in the greater Pittsburgh region gathered to depict a new vision for Beaver County, PA. This county is currently faced with the proposal of a massive Shell-owned petrochemical facility – also called a “cracker” – and further build-out that could render the area a northern version of Louisiana’s “Chemical Corridor.” Participants at this event, from Beaver County and beyond, were encouraged to collectively envision a future based on sustainable development. The picture they created was one that welcomes change – but requires it to be sustainable and for the benefit of the community that makes it happen.
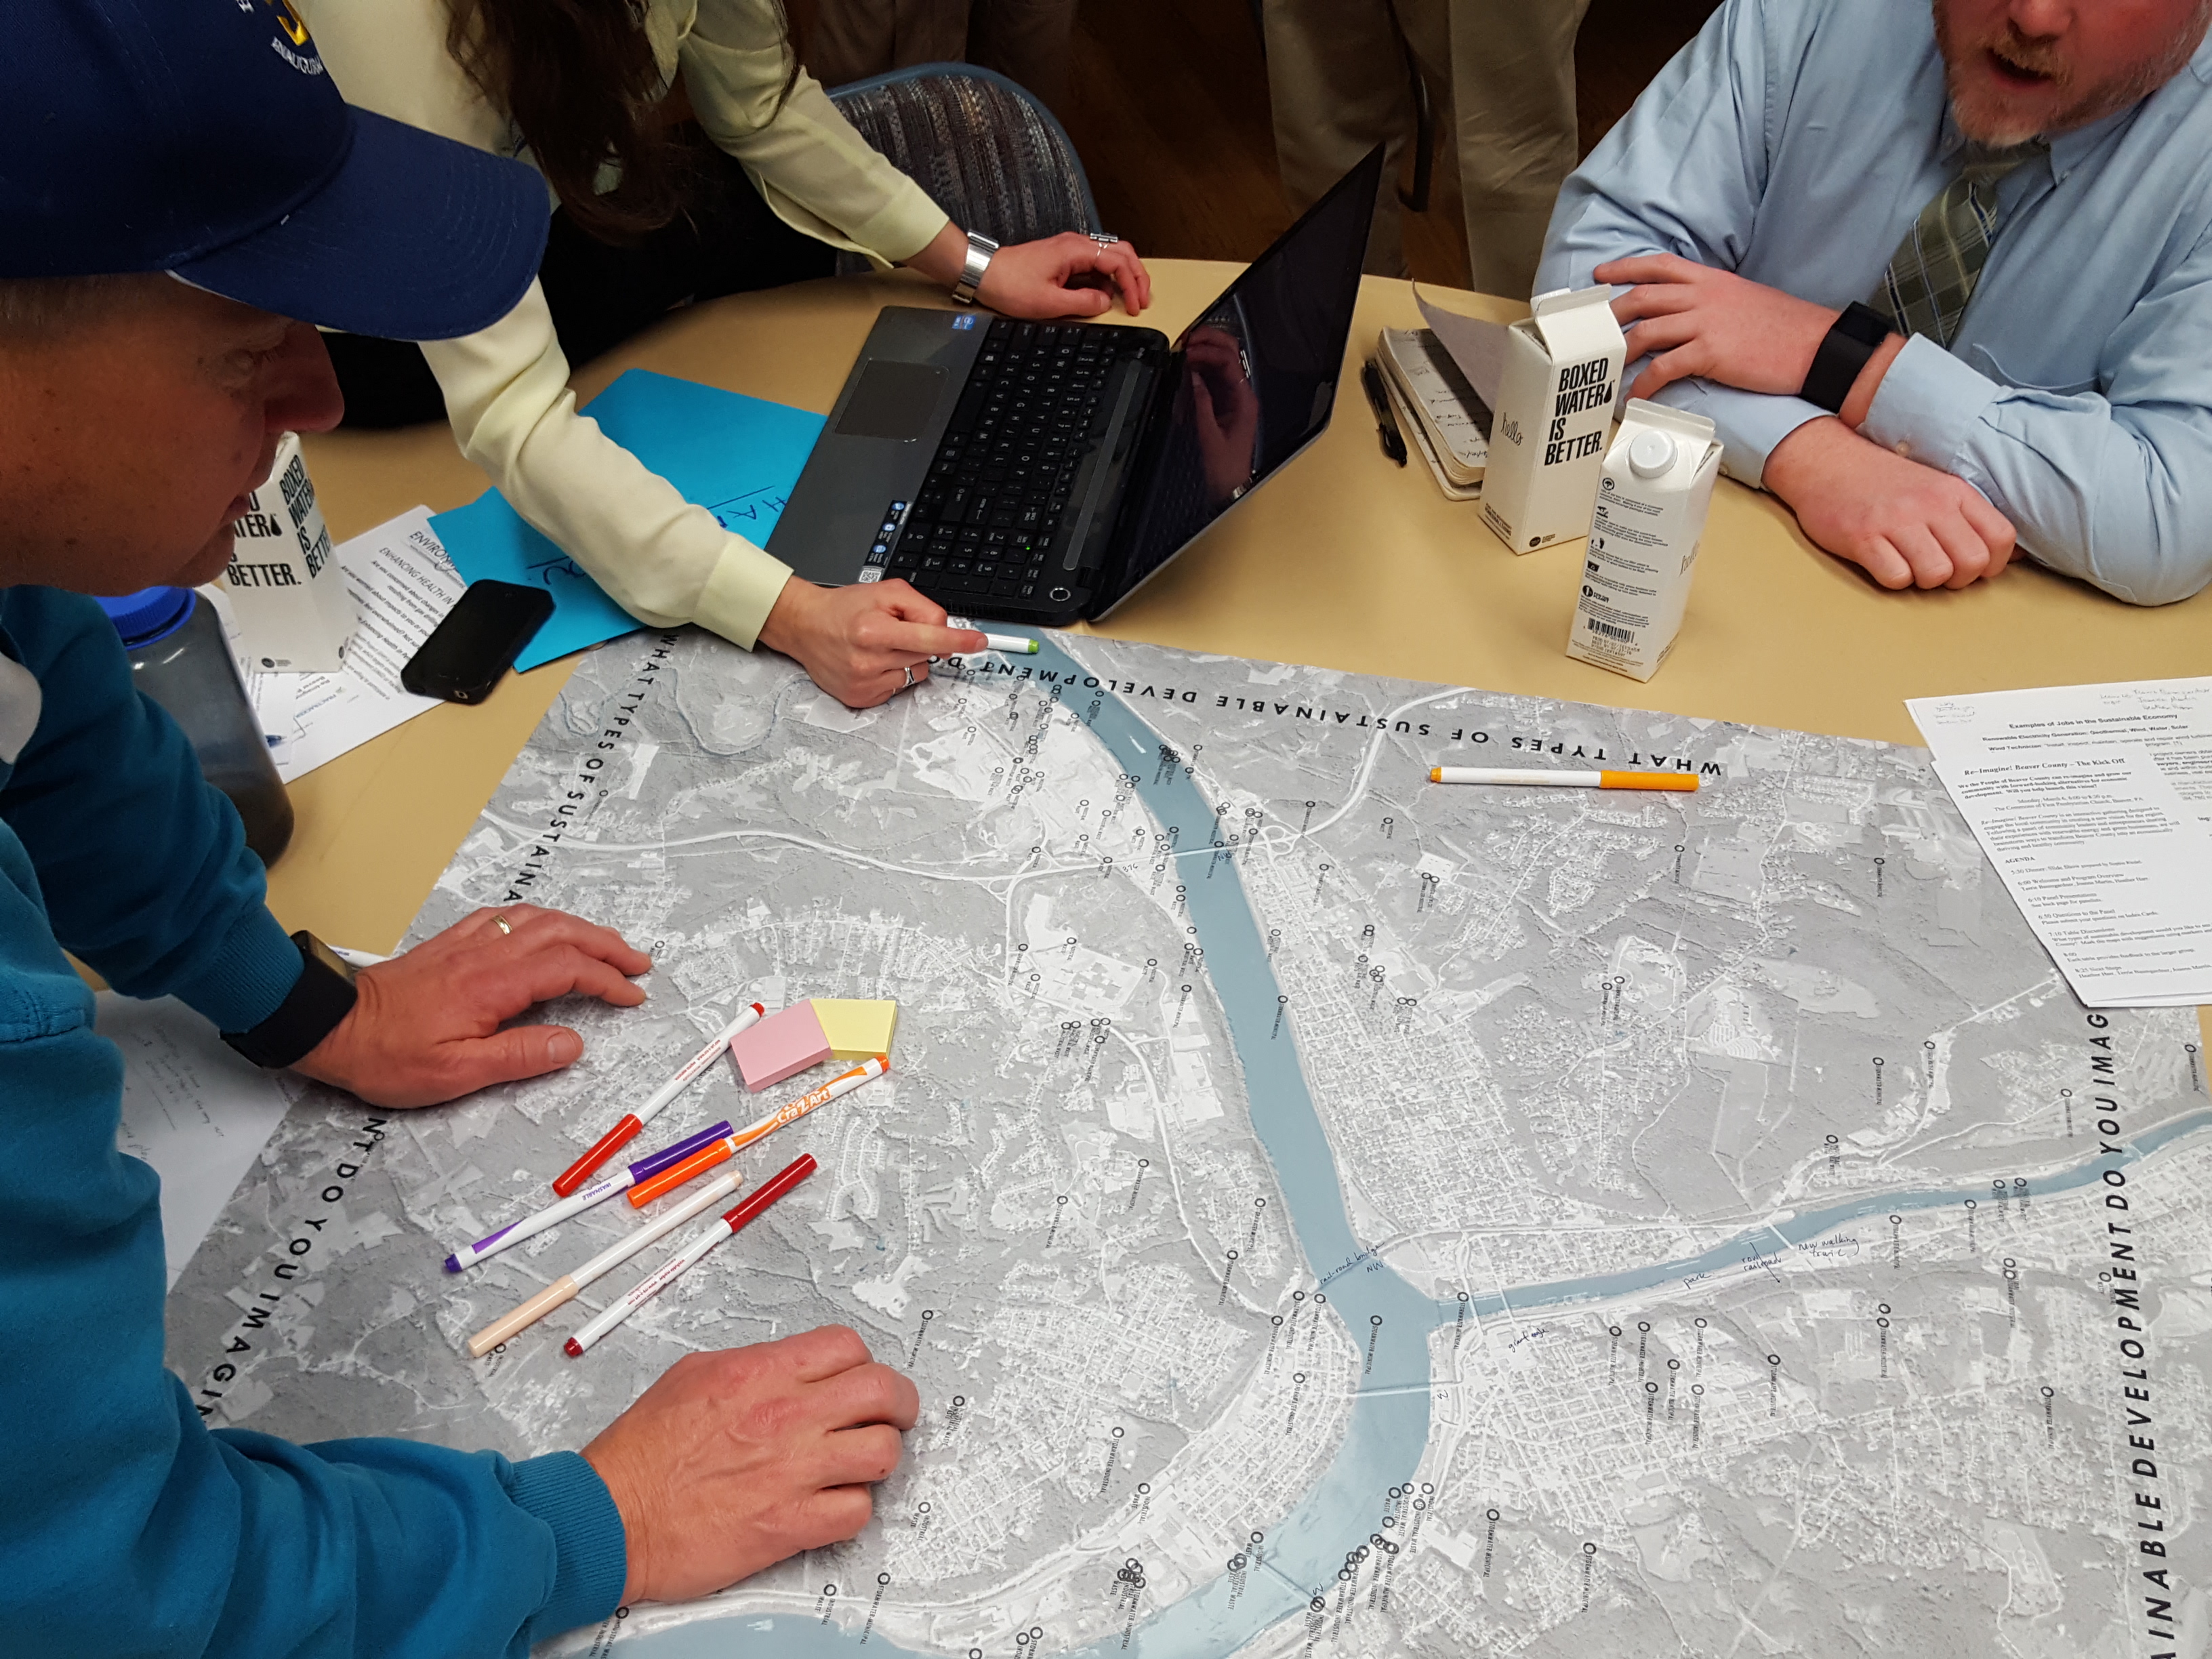
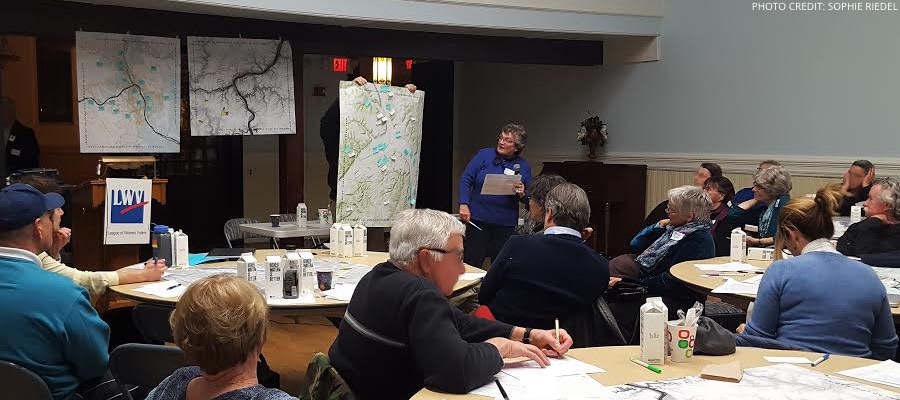
Figure 1: Participants study a map of Beaver County. Photo credit: Sophie Riedel.
Re-Imagine Beaver County Participants
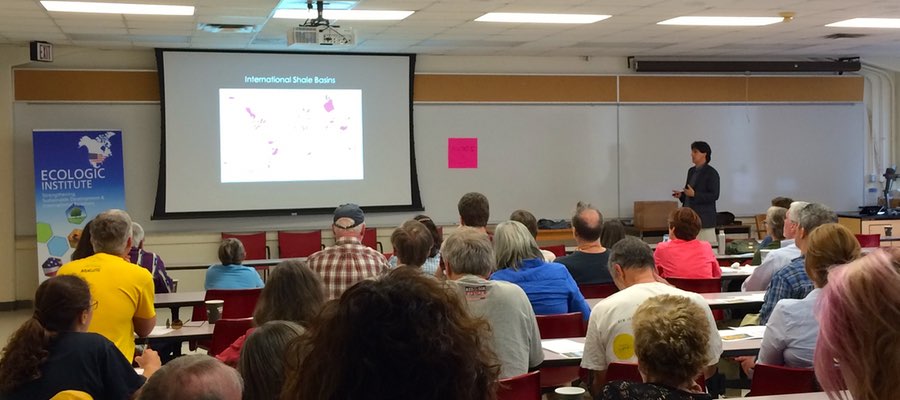
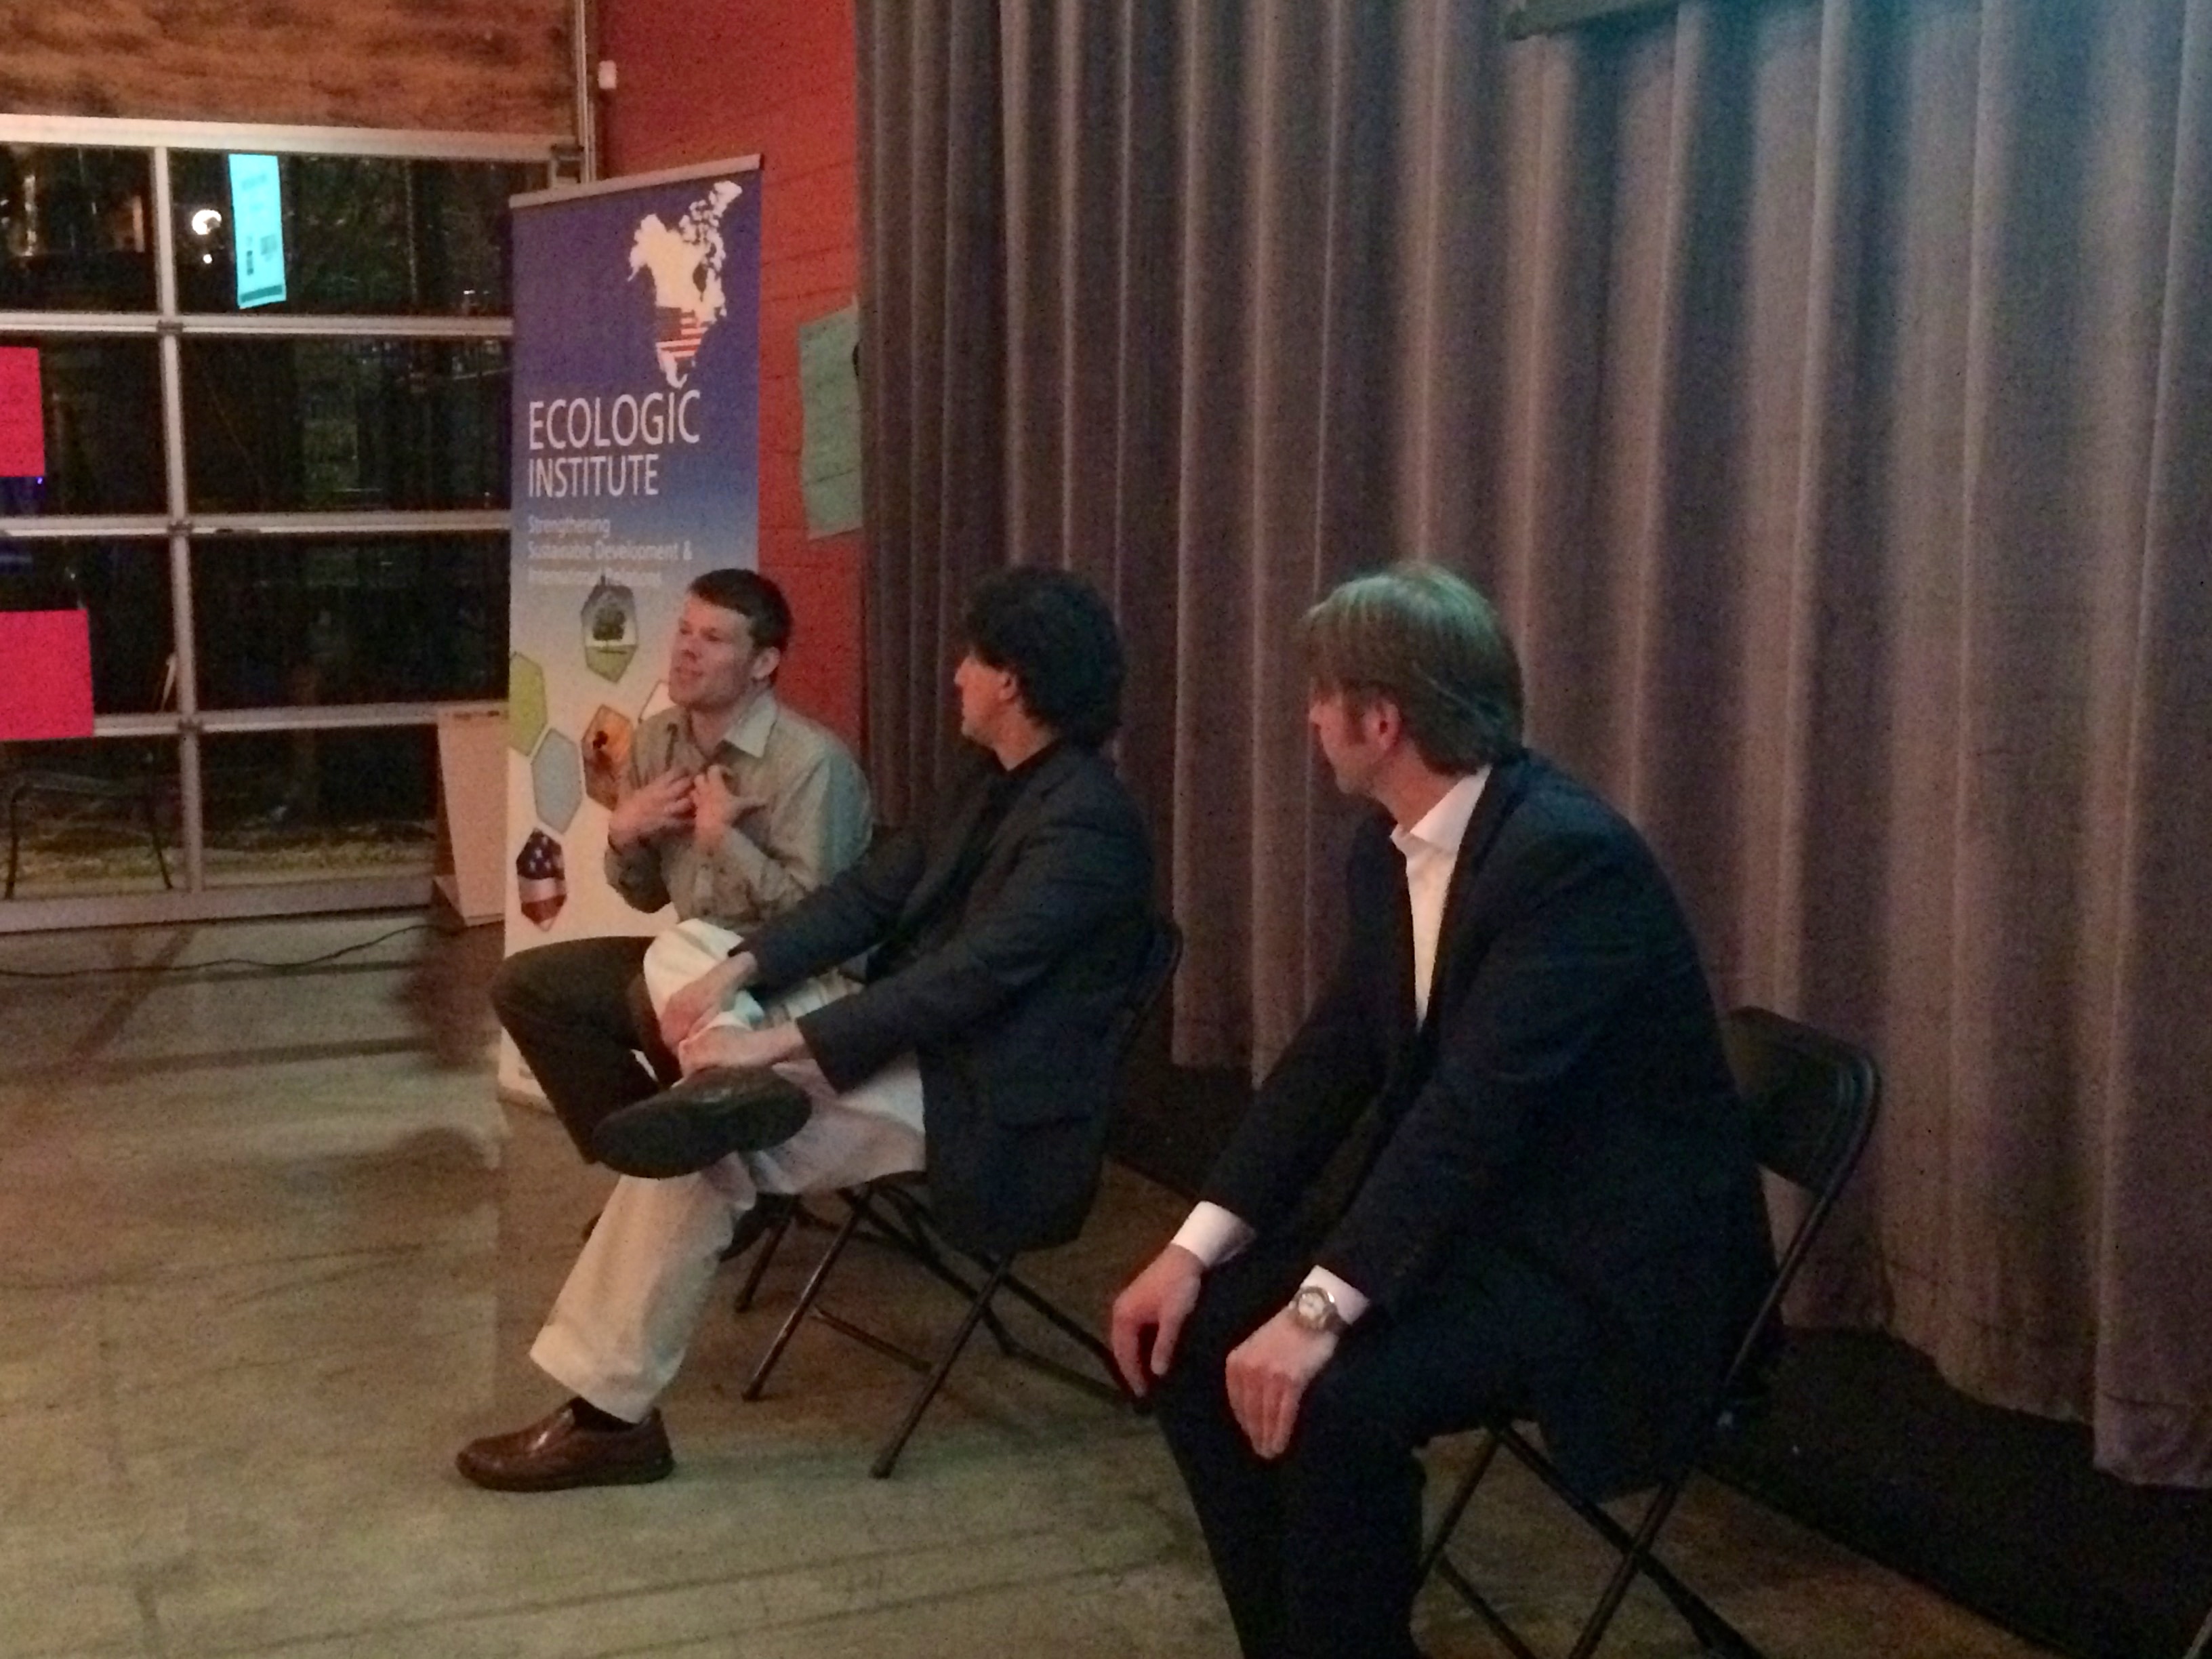
Panelists from municipal government, organic agriculture, and leaders and entrepreneurs of sustainable initiatives started off the event, sponsored by the League of Women Voters of Pennsylvania and endorsed by the Beaver County Marcellus Awareness Committee. After an hour, the room of 60 or so participants dove into the lively de- and re-construction of large format maps of the area. They were invited to markup the maps, created by Carnegie Mellon University graduate student of the School of Architecture, Sophie Riedel. Each table worked from a different base map of the same area – centering on the confluence of the Ohio and Beaver rivers, including the already heavily-industrialized riverside and the site of Shell’s proposed petrochemical facility.
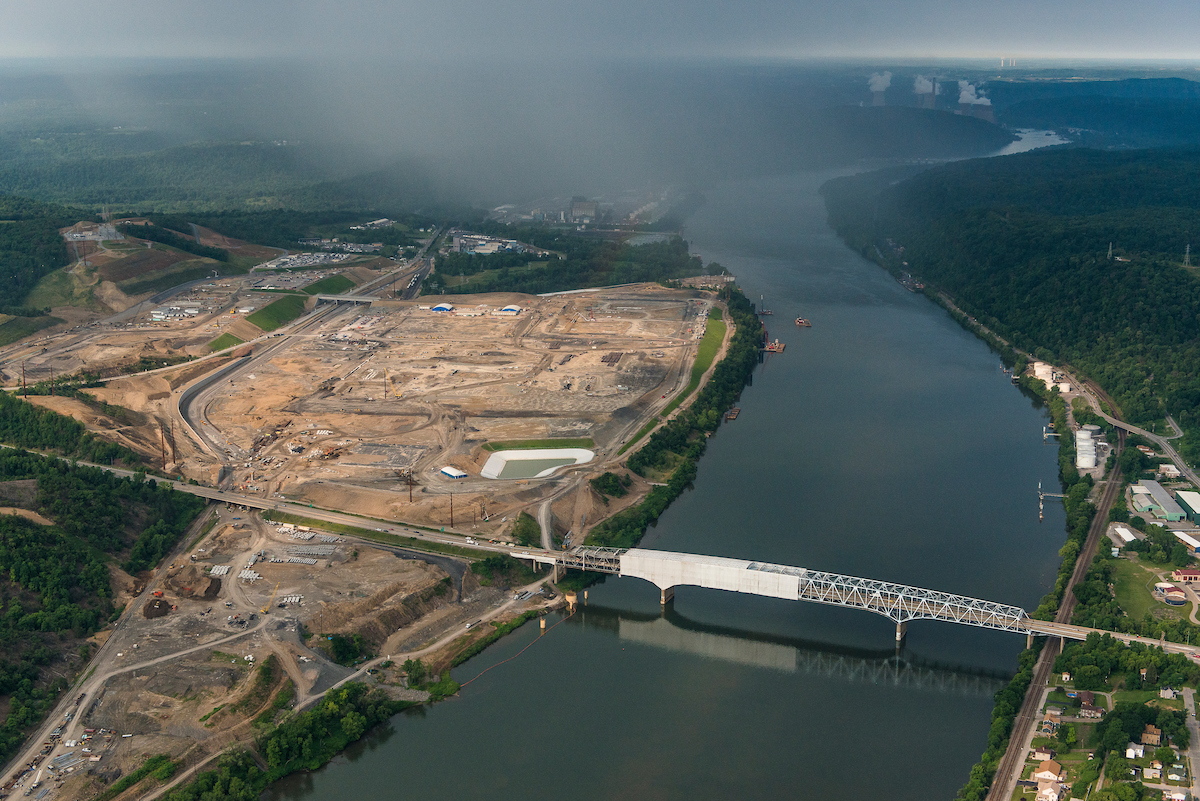
Figure 2: The site of the proposed petrochemical facility in Beaver County (on left) and the Ohio River that participants hope to see reinvented as a recreational waterway buttressed by public parks. Photo credit: Garth Lenz, iLCP.
Much more than a thought exercise, the gathering represented a timely response to a growing grassroots effort around the proposed petrochemical inundation. Changes are already underway at the site, and those who live in this region have the right to give input. This right is especially salient when considering the risks associated with the petrochemical industry – including detrimental health impacts on babies before they are even born, asthma exacerbation, and increased cancer rates.
Charting a new vision
The re-invented Beaver County would be one of increased connectivity and mobility, well-equipped to provide for local needs with local means.
Many ideas included on the maps reflected a longing for transportation options independent of personal vehicles – including better, safer, more connected bike trails and walking paths, use of existing rail lines for local travel, and even the inventive suggestion of a water taxi. These inherently lower-impact means of transport coincide with preferences of millennials, according to several of the panelists, who want more walkable, bikeable communities. Ushering in such sustainable suggestions would welcome more young families to an area with an aging population. More than just about moving people, transportation ideas also included ways to get locally grown foods to those who need it, such as the elderly.
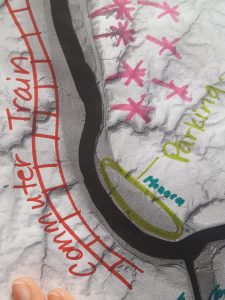
Figure 3: Participants modify maps to reflect a new vision. Photo credit: Sophie Riedel.
The value of beauty was a subtheme in many of the ideas to connect and mobilize the population and goods, ideas which often held a dual aim of protecting open space, creating new parks, and offering recreation possibilities. Participants ambitiously reimagined their river, the Ohio, from its current status as a closed-off corridor for industrial usage and waste, to a recreational resource for kayaking and fishing walleye.
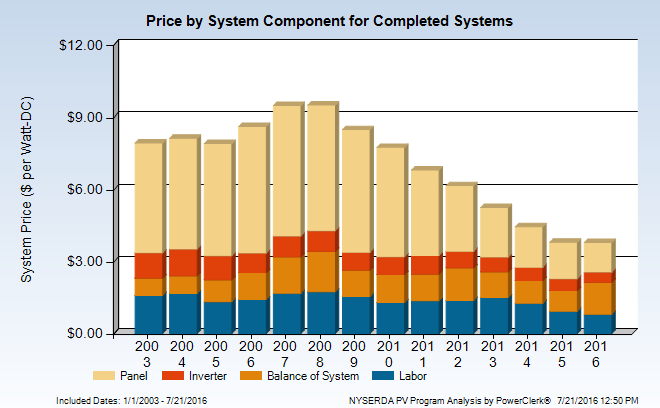
Participants marked up the maps to show the resources that help sustain this community, and voiced a strong desire for development that would enable additional self-reliance. These forward-thinking changes included increased agriculture and use of permaculture techniques, and community gardens for growing food near the people who currently lack access. Ideas for powering the region abounded, like harnessing wind power and putting solar panels on every new building.
Participants were firm on local sourcing for another key resource: the labor required for these efforts, they insisted, must come from the local populace. Educational programs designed to channel learners into workers for sustainability might include training to rebuild homes to “greener” standards, and programs aimed at bringing a new generation of farmers to the fields. Perhaps a nod to the world-wide plastic glut that a petrochemical facility would add to, suggestions even included local ways of dealing with waste, like starting a composting program and establishing more recycling centers.
Whose vision?
Who is a part of this vision, both in creating it and living it out? Inevitably, the selection of panelists and the interests of the audience members themselves influenced the vision this group crafted. The question of inclusion and representation found articulation among many participants, and the hosts of the event welcomed suggestions on reaching a broader audience moving forward. Looking around the room, one man asked, “Where are all the young people, and families with kids?” Indeed, only several members of this demographic were present. Though indicative of the racial makeup of Beaver County, the audience appeared to be primarily white, meaning that the racially diverse communities in the region where not represented. Others pointed out that going forward, the audience should also include those residents struggling with un- and underemployment, who have a major stake in whatever vision of Beaver County comes to fruition. Another said he would like to see more elected officials and leaders present. Notably, Potter Township Board of Supervisors Chairperson, Rebecca Matsco, who is a strong advocate for the proposed petrochemical project in her township, was present for the first half of the event.
Local means for meeting local needs
People who welcome petrochemical development in Beaver County might believe that those who voice concerns about the proposed Shell plant aren’t forward-thinking, or simply oppose change. Quite in contrast, participants at Re-Imagine Beaver County went to work reinventing their community with optimism and enthusiasm. They didn’t seem to be resisting change, but instead, wanting to participate in the process of change and to ultimately see benefits to their community. For example, discussion of solar power generated substantial excitement. According to panel speaker Hal Saville, however, the biggest challenge is making it affordable for everyone, which suggests that the estimated $1.6 billion in tax breaks going to Shell for the petrochemical plant could be better allocated.
A key narrative from supporters of the ethane cracker centers on the pressing need for jobs in this area, though some locals have expressed concern about how many of Shell’s promised jobs would go to residents. Whoever gets hired, these jobs come with serious dangers to workers. Participants at this event proposed alternative initiatives – both ambitious and small – for creating jobs within the community, like providing “sprout funds” to encourage new business start-ups, and launching a coordinated effort to rehab aging housing stock. These ideas suggest that the people of this region feel their energy and ingenuity would be best spent making Beaver County a better place to live and work, in contrast to producing disposable petrochemical products for export around the world. The fact that so many participants emphasized local means for meeting their needs in no way downplays the need for good jobs. Rather, it points to the fact that people want jobs that are good for them and for the future of their community.
Moving the vision forward
Where do we go from here? Can the momentum of this event draw in greater representation from the region to have a voice in this process? Will these visions become animated and guide the creation of a new reality? Broader and deeper planning is in order; participants and panelists alike pointed to tools like comprehensive community plans and cleaner, “greener” industrial policies. More than anything, the group articulated a need for more deliberation and participation. As panelist and farm co-owner Don Kretschmann put it, when it comes to change, we need to “think it through before we go ahead and do it.”
The maps themselves, bearing the inspirations scrawled out during the event, have not reached the end of the road. From here, these maps will accompany an upcoming exhibition of the artworks in Petrochemical America, which locals hope to bring to the greater Pittsburgh area in the coming months. League of Women Voters, for their part, continue to move the vision forward, inviting input from all on next steps, with an emphasis on pulling in a broader cross-section of the community.
To voice your vision, and to stay in the loop on future Re-Imagine Beaver County events, contact reimaginelwvpa@gmail.com.
Many thanks to Sophie Riedel for sharing photographs from the event, and to the International League of Conservation Photographers and the Environmental Integrity Project for sharing the aerial photograph of the Shell site from their joint project, “The Human Cost of Energy Production.”
By Leann Leiter, Environmental Health Fellow
")
")
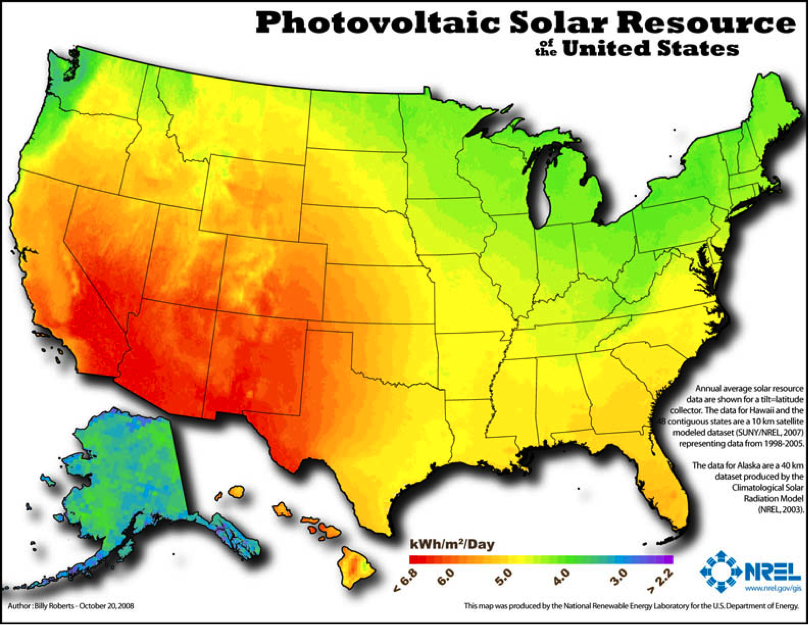


 Both states are at risk from accelerated and more extreme hydrocarbon extraction, but both also bear significant potential for broad success with renewable energy. While only 0.1% of Florida’s current generating capacity comes from solar, it has some of the strongest incoming solar radiation in the country. North Carolina sports the best conditions for offshore wind energy on the east coast. The Tarheel State ranked 2nd in the nation for new installed solar capacity in 2014, and the same year, over 4,300 North Carolinians worked in the solar power industry. Already, 4,800 Floridians work in the solar industry.