Updated National Energy and Petrochemical Map
We first released this map in February of 2020. In the year since, the world’s energy systems have experienced record changes. Explore the interactive map, updated by FracTracker Alliance in April, 2021.
We first released this map in February of 2020. In the year since, the world’s energy systems have experienced record changes. Explore the interactive map, updated by FracTracker Alliance in April, 2021.
COVID-19 and the oil and gas industry are at odds. Air pollution created by oil and gas activities make people more vulnerable to viruses like COVID-19. Simultaneously, the economic impact of the pandemic is posing major challenges to oil and gas companies that were already struggling to meet their bottom line. In responding to these challenges, will our elected leaders agree on a stimulus package that prioritizes people over profits?
People living in areas with poor air quality may be more vulnerable to COVID-19, a disease that affects the lungs. Poor air quality is linked to higher rates of asthma and chronic obstructive pulmonary disease (COPD), even without a pandemic.
Air pollution from oil and gas development can come from compressor stations, condensate tanks, construction activity, dehydrators, engines, fugitive emissions, pits, vehicles, and venting and flaring. The impact is so severe that for every three job years created by fracking in the Marcellus Shale, one year of life is lost due to increased exposure to pollution.
Yes, air quality has improved in certain areas of China and elsewhere due to decreased traffic during the COVID-19 pandemic. But despite our eagerness for good news, sightings of dolphins in Italian waterways does not mean that mother earth has forgiven us or “hit the reset button.”
Significant environmental health concerns persist, despite some improvements in air quality. During the 2003 SARS outbreak, which was caused by another coronavirus, patients from areas with the high levels of air pollution were twice as likely to die from SARS compared to those who lived in places with little pollution.
On March 8th, Stanford University environmental resource economist Marshall Burke looked at the impacts of air quality improvements under COVID-19, and offered this important caveat:
“It seems clearly incorrect and foolhardy to conclude that pandemics are good for health. Again I emphasize that the effects calculated above are just the health benefits of the air pollution changes, and do not account for the many other short- or long-term negative consequences of social and economic disruption on health or other outcomes; these harms could exceed any health benefits from reduced air pollution. But the calculation is perhaps a useful reminder of the often-hidden health consequences of the status quo, i.e. the substantial costs that our current way of doing things exacts on our health and livelihoods.”
This is an environmental justice issue. Higher levels of air pollution tend to be in communities with more poverty, people of color, and immigrants. Other health impacts related to oil and gas activities, from cancer to negative birth outcomes, compromise people’s health, making them more vulnerable to COVID-19. Plus, marginalized communities experience disproportionate barriers to healthcare as well as a heavier economic toll during city-wide lockdowns.
The COVID-19 health crisis is setting off major changes in the oil and gas industry. The situation may thwart plans for additional petrochemical expansion and cause investors to turn away from fracking for good.
Oil, gas, and petrochemical producers were facing financial uncertainties even before COVID-19 began to spread internationally. Now, the economics have never been worse.
In 2019, shale-focused oil and gas producers ended the year with net losses of $6.7 billion. This capped off the decade of the “shale revolution,” during which oil and gas companies spent $189 billion more on drilling and other capital expenses than they brought in through sales. This negative cash flow is a huge red flag for investors.
“North America’s shale industry has never succeeded in producing positive free cash flows for any full year since the practice of fracking became widespread.” IEEFA
Shale companies in the United States produce more natural gas than they can sell, to the extent that they frequently resort to burning gas straight into the atmosphere. This oversupply drives down prices, a phenomenon that industry refers to as a “price glut.”
The oil-price war between Russia and Saudi Arabia has been taking a toll on oil and gas prices as well. Saudi Arabia plans to increase oil production by 2 – 3 million barrels per day in April, bringing the global total to 102 million barrels produced per day. But with the global COVID-19 lockdown, transportation has decreased considerably, and the world may only need 90 million barrels per day.
If you’ve taken Econ 101, you know that when production increases as demand decreases, prices plummet. Some analysts estimate that the price of oil will soon fall to as low as $5 per barrel, (compared to the OPEC+ intended price of $60 per barrel).
Oil and gas industry lobbyists have asked Congress for financial support in response to COVID-19. Two stimulus bills in both the House and Senate are currently competing for aid.
Speaker McConnell’s bill seeks to provide corporate welfare with a $415 billion fund. This would largely benefit industries like oil and gas, airlines, and cruise ships. Friends of the Earth gauged the potential bailout to the fracking industry at $26.287 billion. In another approach, the GOP Senate is seeking to raise oil prices by directly purchasing for the Strategic Petroleum Reserve, the nation’s emergency oil supply.
Speaker Pelosi’s proposed stimulus bill includes $250 billion in emergency funding with stricter conditions on corporate use, but doesn’t contain strong enough language to prevent a massive bailout to oil and gas companies.
Hopefully with public pressure, Democrats will take a firmer stance and push for economic stimulus to be directed to healthcare, paid sick leave, stronger unemployment insurance, free COVID-19 testing, and food security.
Fracking companies were struggling to stay afloat before COVID-19 even with generous government subsidies. It’s becoming very clear that the fracking boom is finally busting. In an attempt to make use of the oversupply of gas and win back investors, the petrochemical industry is expanding rapidly. There are currently plans for $164 billion of new infrastructure in the United States that would turn fracked natural gas into plastic.
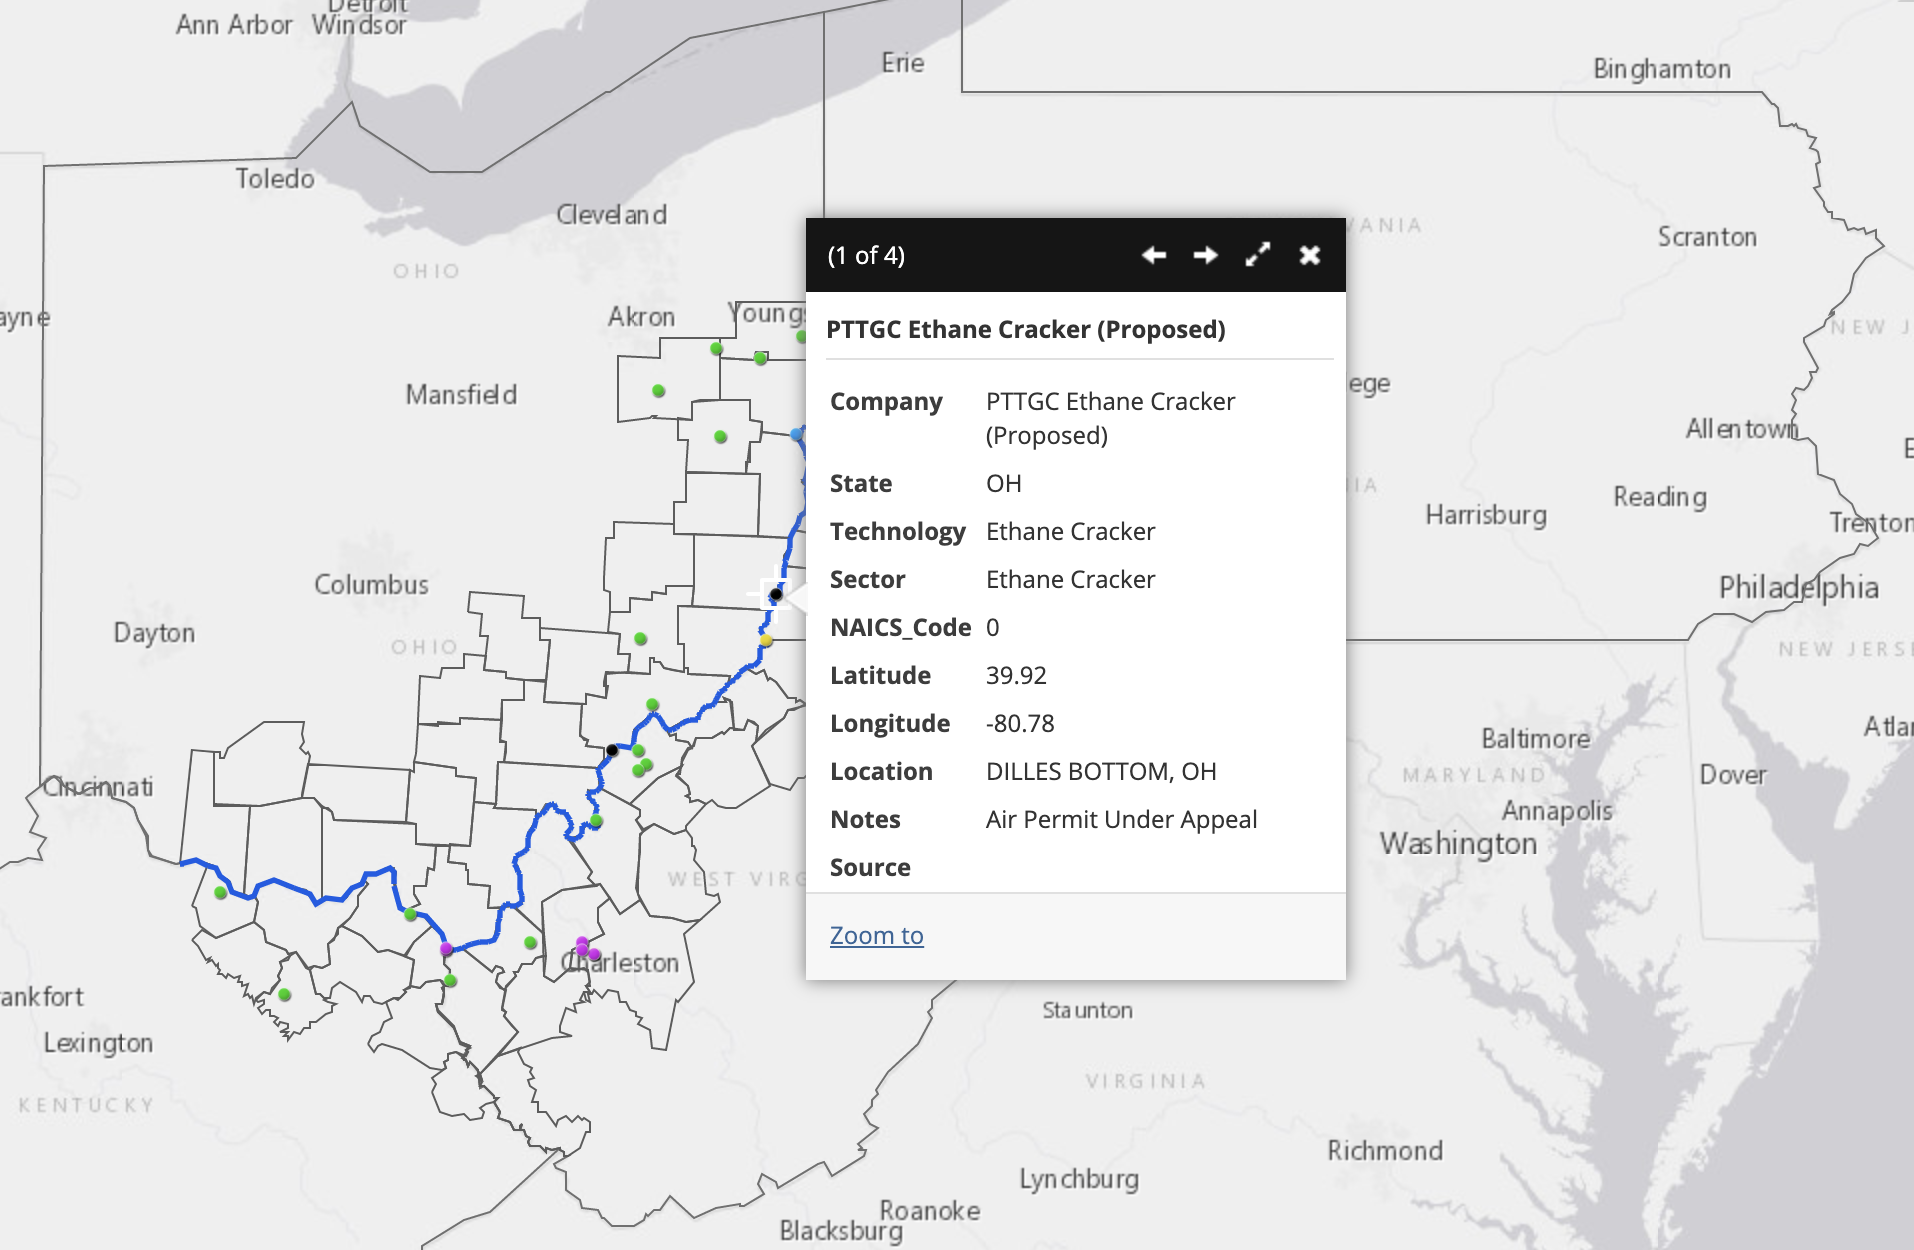
The location of the proposed PTTGC Ethane Cracker in Belmont, Ohio. Go to this map.
There are several fundamental flaws with this plan. One is that the price of plastic is falling. A new report by the Institute for Energy Economics and Financial Analysis (IEEFA) states that the price of plastic today is 40% lower than industry projections in 2010-2013. This is around the time that plans started for a $5.7 billion petrochemical complex in Belmont County, Ohio. This would be the second major infrastructural addition to the planned petrochemical buildout in the Ohio River Valley, the first being the multi-billion dollar ethane cracker plant in Beaver County, Pennsylvania.
Secondly, there is more national and global competition than anticipated, both in supply and production. Natural gas and petrochemical companies have invested in infrastructure in an attempt to take advantage of cheap natural gas, creating an oversupply of plastic, again decreasing prices and revenue. Plus, governments around the world are banning single-use plastics, and McKinsey & Company estimates that up to 60% of plastic production could be based on reuse and recycling by 2050.
Sharp declines in feedstock prices do not lead to rising demand for petrochemical end products.
Third, oil and gas companies were overly optimistic in their projections of national economic growth. The IMF recently projected that GDP growth will slow down in China and the United States in the coming years. And this was before the historic drop in oil prices and the COVID-19 outbreak.
“The risks are becoming insurmountable. The price of plastics is sinking and the market is already oversupplied due to industry overbuilding and increased competition,” said Tom Sanzillo, IEEFA’s director of finance and author of the report.
Oil, gas, and petrochemical companies are facing perilous prospects from demand and supply sides. Increasing supply does not match up with decreasing demand, and as a result the price of oil and plastics are dropping quickly. Tens of thousands of oil and gas workers are being fired, and more than 200 oil and gas companies have filed for bankruptcy in North America in the past five years. Investors are no longer interested in propping up failing companies.
Natural gas accounts for 44% of electricity generation in the United States – more than any other source. Despite that, the cost per megawatt hour of electricity for renewable energy power plants is now cheaper than that of natural gas power plants. At this point, the economy is bound to move towards cleaner and more economically sustainable energy solutions.
It’s not always necessary or appropriate to find a “silver lining” in crises, and it’s wrong to celebrate reduced pollution or renewable energy achievements that come as the direct result of illness and death. Everyone’s first priority must be their health and the health of their community. Yet the pandemic has exposed fundamental flaws in our energy system, and given elected leaders a moment to pause and consider how we should move forward.
It is a pivotal moment in terms of global energy production. With determination, the United States can exercise the political willpower to prioritize people over profits– in this case, public health over fossil fuel companies.
Top photo of petrochemical activity in the Houston, Texas area. By Ted Auch, FracTracker Alliance. Aerial assistance provided by LightHawk.
Talking about fracking all day, every day, can be a bit of a downer. Here at FracTracker, we find hope in the advances of clean energy across the country and around the world. This time around, let’s see how Missouri’s clean energy sector is fairing. Long story short – while it seems their clean energy is a bit behind in the game, at least they are trying.
The role of clean energy in Missouri’s economy is on the rise: Clean energy already supports 55,251 jobs, and the sector grew by 5.3 % over 2015-2016. This rate is over three times faster than overall jobs in Missouri. And in 2017, St. Louis approved a measure to transition to 100% clean, renewable energy by 2035, making it one of the largest cities to do so. St. Louis’ decision also puts it squarely in line with efforts from other cities to take the lead on renewable energy, especially in the face of larger federal inaction.
In collaboration with our partners at Environmental Entrepreneurs (E2), FracTracker Alliance produced a series of maps investigating current clean energy businesses and sites where renewable energy is and can be generated. They aim to describe Missouri’s clean energy economy – and how much room it has to grow. Here is a sneak peak at some of these maps, below:
Map 1. Clean Energy Electric Generation
View map fullscreen | How FracTracker maps work
Map 1, above, shows clean renewable energy generation in Missouri. Solar and wind are the most dominant forms of renewable energy in Missouri. Missouri’s clean energy generating capacity is highest in the northwest corner of the state, where several large wind-energy projects are located. The state has 6 wind farms in this region including the newly-announced 100 MW Hawthorne Wind Farm and 49 MW High Prairie Wind Farm. In total, Missouri produces 1,000 MW of wind energy from about 500 turbines. Solar power is more dominant across the rest of the state, especially with schools’ solar energy generation around Kansas City and St. Louis and solar farms throughout the rest of the state, including Pulaski, Macon, and Bates counties. All in all, about 702 megawatts of wind and solar capacity are installed currently, with another 458 megawatts currently proposed to be built.
Map 2. Clean Energy Generation Potential
View map fullscreen | How FracTracker maps work
However, much more potential remains to be tapped as shown in Map 2, above. This holds true across solar, wind, and other renewable energy sources – particularly in the southwest corner of the state, where solar energy potential is the highest.
Missouri has up to 275,000 MW of wind potential energy, and these maps of energy potential show that overall, approximately 75% of the state has above-average potential for solar power. This is an important statistic since coal fueled 81% of Missouri’s electricity in 2017; only two other states burned more in 2017. Also, the new addition of bidirectional natural gas flow to the Rockies Express Pipeline means stiffer competition for renewables from the natural gas market.
Map 3. Clean Energy Businesses
View map fullscreen | How FracTracker maps work
It looks like the transition to clean energy in Missouri is happening, but there is always work to be done (nerdy “energy” joke). According to the E2 Missouri Clean Jobs Report, there is a lot of room for the clean energy sector to develop.
The potential does exist for the sector to drive economic growth in the state by being a major contributor to job growth. According the Environmental Entrepreneur’s Midwest Advocate Micaela Preskill, the industry in Missouri is slated to grow another 4.5% through 2019. Recent hires in the sector show that the workforce is very ethnically diverse, with the percentage of minority new hires doubling the average state demographics. Also 14% of new hires are veterans. Map 3, above, displays over 400 businesses, including energy efficiency contractors and renewable energy installers, which cover all 34 state senate districts. Surveys indicate that 80 percent of businesses working in clean energy in Missouri employ fewer than 25 individuals, illustrating the importance of small businesses in the clean-energy sector.
With the new state policies that support the transition from fossil fuels and the growing clean energy economy, Missouri is on a path to becoming more sustainably focused. This is particularly important because of the state’s past and present reliance on coal, and the availability of natural gas. More investment of state and federal resources in the clean energy sector could provide the boost that benefits state’s health, environment and economy through new jobs and manufacturing.
By Kyle Ferrar, Western Program Coordinator
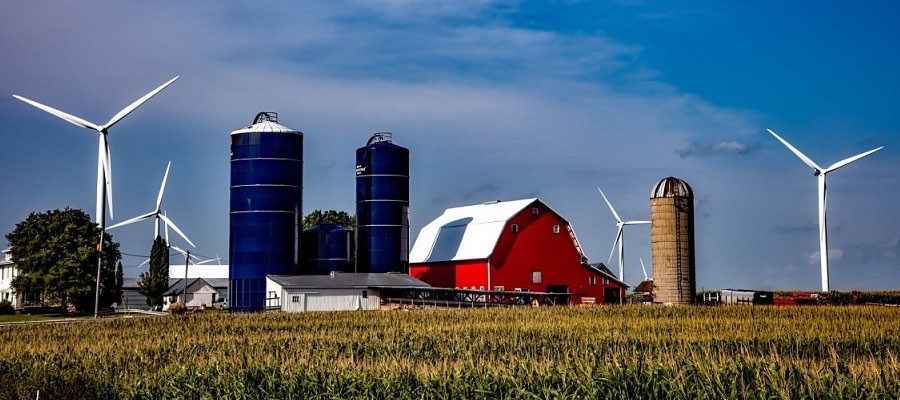
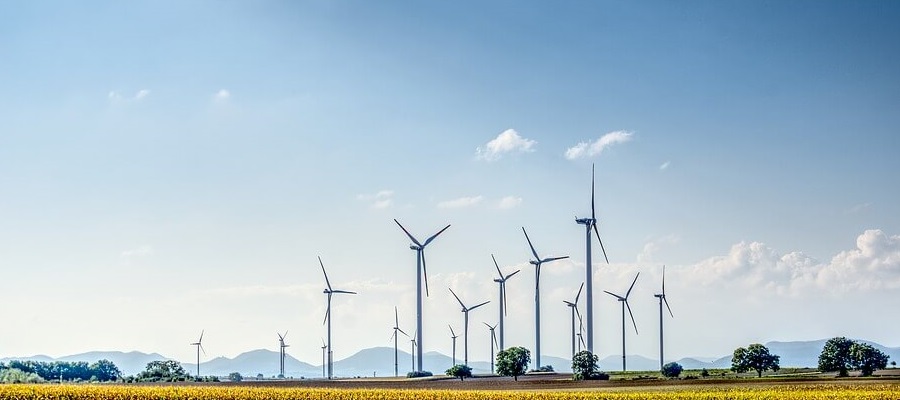
Behind in the Game Feature Image: Wind and farm. Creative Commons license.
Energy use — whether for heating, cooking, transportation, or manufacturing — is a fact of life for humans on our planet. From the most subsistence-level village life, to the largest metropolises in the world, energy is consumed. But fossil fuels are not a sustainable source of energy. Fossil fuels, by their very nature, are finite in quantity, and increasingly more expensive to extract as the most accessible stores are tapped.
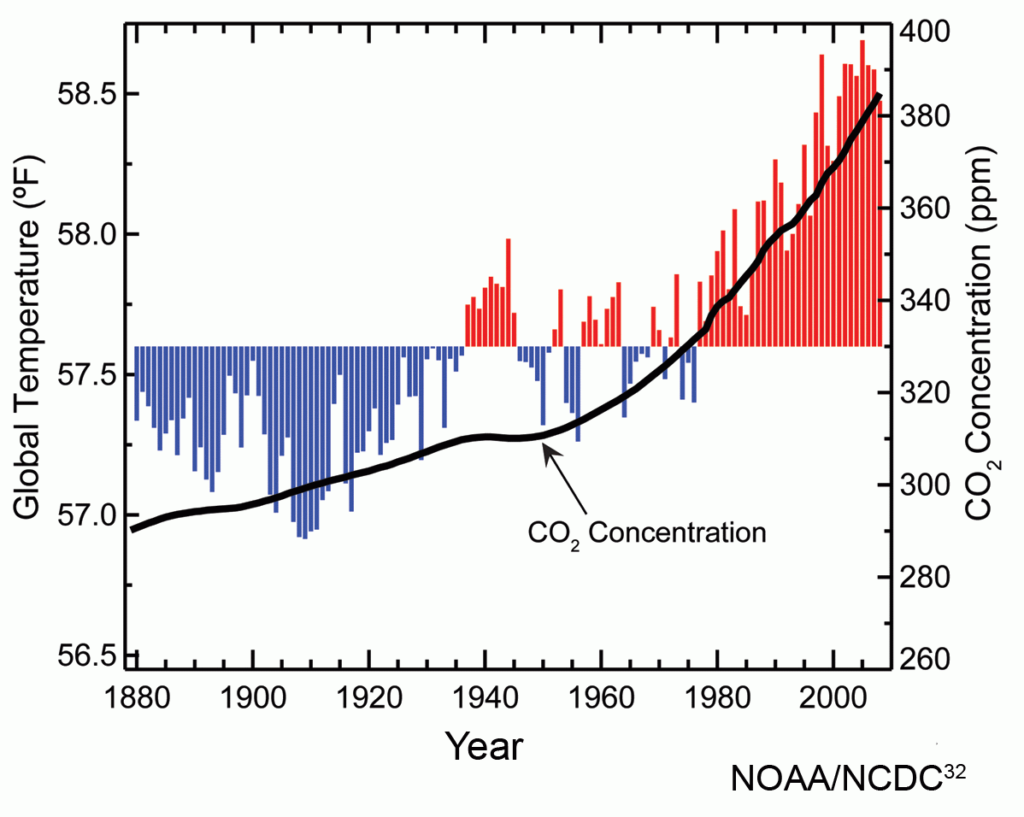
Fossil fuel consumption by-products are driving CO2 and methane to accumulate in the atmosphere, leading towards what most scientists think will be a tipping point to irreversible climate chaos (see image below).
Alternatives to fossil fuels not only exist, but in many cases, are becoming more affordable (see additional information on solar afforability here) than the environmentally-destructive oil, gas, and coal-burning options. Technological advances are changing the way people around the world can live, with cleaner, greener, and more equitable energy sources, as well as more conservation-focused consumption patterns.
Recognizing the benefits to transitioning away from fossil fuels, communities across the US and world-wide, are saying NO to fossil fuel extraction and YES to renewable energy: solar, wind, geothermal, and hydro power, as well as electric vehicles when the electricity that supplies them is renewably generated. Below, and in the following map, we are tracking this movement to a clean energy future.
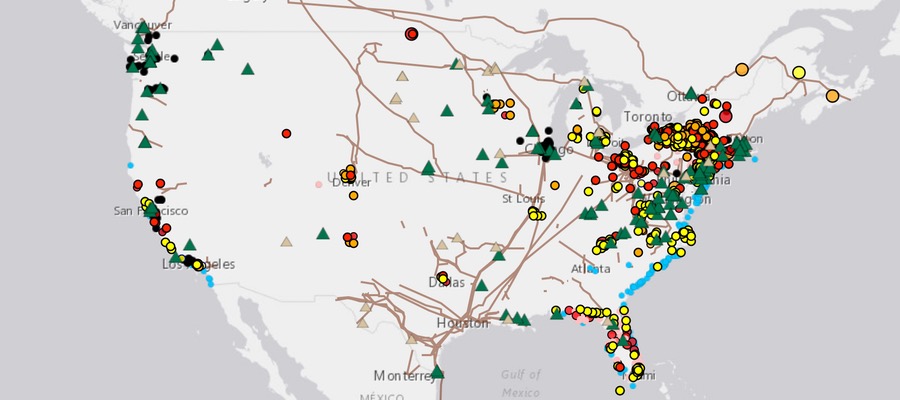
The Resistance – Movements Against Fossil Fuels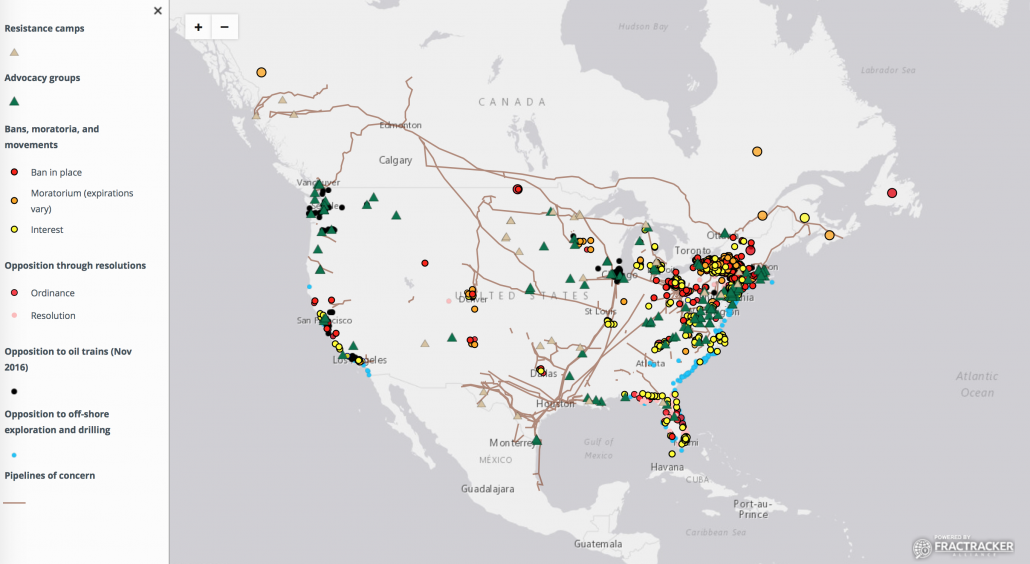 View Live Map | How FracTracker maps work
At least 35 communities in California and Washington State have passed resolutions against off-shore drilling. On the East Coast, from Florida to New York State, 44 municipalities have passed resolutions opposing seismic blasting, a form of exploration for oil and gas that has disastrous impacts on marine life, including threatened and endangered marine mammals. What’s further, 105 communities have come out against a combination of offshore drilling and seismic blasting, and at least 26 have taken a stand against offshore drilling.
In Florida, where several bills that would prohibit fracking statewide have been in play for the past few years, individual municipalities have registered their opposition. 43 have signed resolutions opposing fracking, and 7 communities, including Zephyr Hills, Cape Coral, Bonita Springs, Coconut Creek, Dade City, Estero, and St. Petersburg, have passed full ordinances against fracking within their boundaries. In addition to resolutions against drilling in 25 Florida counties, 13 counties in Florida have passed legislation fully banning fracking. These counties are Alachua, Bay, Brevard, Citrus, Indian River, Madison, Osceola, Pinellas, Seminole, St. Lucie, Volusia, Wakulla, and Walton.
In Connecticut, where the geology is not suitable for oil and gas extraction, communities are still proactively protecting themselves against one byproduct of extreme oil and gas extraction: fracking waste disposal. While historically, there are no known instances of fracking waste being exported to Connecticut for disposal, as of March 2018, 46 municipalities are considering rules to ban future disposal of oil and gas wastes within their boundaries, while another 45 have already outlawed the practice, as of late May 2018.
New York State has had a state-wide ban against high-volume hydraulic fracturing since December of 2014. New York led the way in home-rule backed municipal bans and moratoria (temporary prohibitions). Since 2011, 92 NYS municipalities have instituted bans against fracking, and 96 towns, cities, and village have passed moratoria — most of which have now expired. At least another 88 municipalities have also considered banning the practice, prior to the more comprehensive state-wide ban.
The state of Vermont has also banned fracking, and Maryland has instituted a long-term moratorium. Outside of New York State, another 51 municipalities — from Australia to Italy, and New Jersey to California — have passed local ordinances banning fracking. Five countries — Bulgaria, France, Ireland, Germany, and Scotland — have banned the practice altogether. The countries of Wales, The Netherlands, and Uruguay have active moratoria. Moratoria are also currently in place in Cantabria, Spain; Victoria, Australia; Newfoundland, Canada; Paraná, Brazil; Entre Rios, Argentina; and the Eastern Band of Cherokee Indians, as well as the Turtle Mountain Band of Chippewa Indians.
Coordinated efforts are happening — across state lines, linking urban and rural communities — to fight new fossil fuel infrastructure on local and regional levels. On both sides of the New York / Connecticut border, communities are uniting against the Cricket Valley Energy Center, an 1,100 MW fracked gas-powered plant that opponents say presents environmental and human health risks and diverts NYS’s renewable energy focus back to fossil fuels.
More than 30 communities in Pennsylvania along the route of the proposed PennEast pipeline have passed resolutions opposing that pipeline. Nearly 80 communities in New York and New Jersey have come out against the proposed Pilgrim Pipeline, designed to carry light crude from the Port of Albany to the Atlantic Coast refineries. And a plan by Crestwood/ Stagecoach Energy to store hydrocarbons in abandoned salt caverns along the shores of Seneca Lake in the scenic Finger Lakes Region of central New York met unprecedented sharp opposition. As of early 2018, over 32 towns and counties, and close to 400 local businesses had signed resolutions opposing the gas storage plans. Pressure from business and government interests likely contributed to scaling down of the storage plans from butane, ethane, and natural gas, to only LNG.
A 2013 ban on fracking in Hawai’i was met initially with some puzzlement, since there are no oil and gas deposits within the lava-created rock that makes up the Big Island. However, this ban was not against fracking for gas; rather, it dealt with fracking to harness geothermal energy. The Puna Geothermal Venture Plant, located on Hawaii’s highly geologically active East Rift Zone, was controversial when it was built twenty-five years ago. Now, with lava already on the property and poised to potentially inundate the facility, opponents are pushing for its complete closure — if the plant survives the massive flow from Kilauea, now devastating Lower Puna, that started in early May 2018.
Fossil fuels are transported through a variety of mechanisms. Pipelines are the most common means of conveyance; the US Energy Information Administration (EIA) estimates that 3 million miles of oil and gas transmission and delivery pipelines crisscross the US. The Bureau of Transportation Statistics estimated in 2014 that there were nearly 1.6 million miles of gas transmission pipelines in the US, and another 160,521 miles of oil pipelines. Pipeline safety has been a concern for years, and as pipeline build-out continues, so does the litany of accidents due to failures.
A widely used alternative to moving light crude via pipelines is to transport it by rail, from oil fields in Canada and the Dakotas to coastal refineries. In 2014, crude oil production from North Dakota was nearly 1 million barrels per day. The same year, Texas was producing 2.9 million barrels per day. Statistics from the Association of American Railroads (NY Times, 4/12/2014) indicate that in 2013, 407,642 carloads (700 barrels = 1 carload) of crude oil were shipped across the US. That’s more than 285 million barrels, or about 80% of the crude oil shipped to port, that were transported via rail.
Accidents resulting from the derailment of freight cars carrying crude oil can be disastrous to both human communities, and to the environment. The Lac-Mégantic derailment in July, 2013 resulted in a death toll of 47, and the near complete devastation of the downtown of this small Quebec town. Benzene contamination at the site was heavy, and the Chaudière River was contaminated with 26,000 gallons of the light crude, which impacted towns 50 miles downstream.
The disaster at Lac-Mégantic led to a rallying cry among policy-makers, regulators, and environmentalists, who continued to raise awareness of the risks of “crude by rail”, or, as the freight cars are often known, “bomb trains”. Within 2 years after the disaster, over 180 communities from Washington State, to California, to New York, and New Jersey, passed local resolutions demanding better safety regulations, and exhorting officials to stop shipping crude through their communities.
Earlier research by FracTracker Alliance on “bomb train” routes through major New York urban centers like Buffalo and Rochester showed dozens of K-12 public and private schools are within the ½-mile blast zones. Without adequate evacuation plans, the injury or loss of life — were a derailment to happen within the cities — could be extensive. The importance of public critique about the transportation of light crude by rail cannot be overstated.
communities making it happen
The answer to a clean and renewable energy future, while rooted in the resistance to fossil fuel build out, consists of much more than protesting, and saying “NO”. A clean energy future requires goal-setting, and a vision to commit to change. It takes communities investing in a healthy future for all community members—today, tomorrow, and into the next century.
Clean, Renewable Energy Movements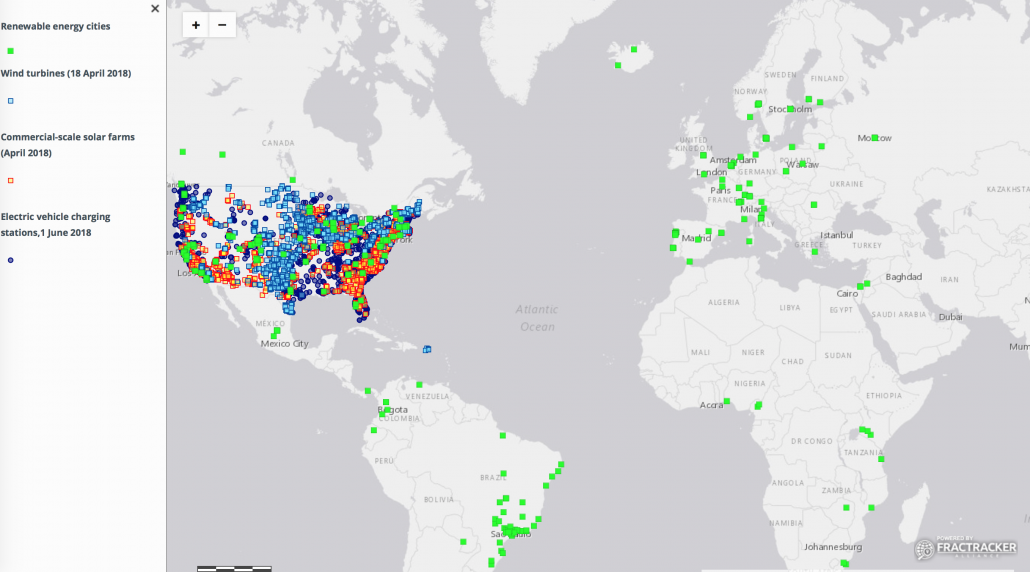 View Live Map | How FracTracker maps work
To that end, nearly 350 communities worldwide (so far) have set tangible goals to transition off fossil fuels – see map above. These communities are our beacons for a sustainable planet. They take seriously the dangerous ecological cascades posed by climate change and have made creative and conscious commitments to future generations of Earth’s biota.
As of early 2018, at least 62 cities in the US have set goals for being powered by renewable energy before the middle of the 21st century according to Sierra Club’s tally of municipalities striving for clean energy power. Five of these communities — Kodiak Island, AK; Rock Port, MO; Greensburg, KS, Burlington, VT; and Aspen, CO, have already met their goals. EcoWatch collected information on over 100 cities around the world that are now powered by at least 70% renewables, and the organization CDP noted close to 200 cities and towns with ambitious targets for renewable power within the next two decades.
Across the US, over 27,300 MW of commercial solar has been installed as of April, 2018. And currently, wind turbines provide close to 59,000 MW of clean energy, nationwide. As of June, 2018, there were more than 18,000 electric vehicle charging stations across the country. While many municipalities are committed to replacing fossil fuels with renewable energy sources, we have a long way to go. Change must happen exponentially in order to meet ambitious goals of even 50% renewable energy in the next decade. For example, in 2011, New York State was meeting approximately 19% of its energy needs from renewable energy—largely from hydropower. Governor Cuomo’s “50 by 30” plan—mandating a clean energy standard of 50% renewables by 2030—sets forth goals that will require aggressive advocacy, the will of decision-makers, economic funding and incentives, education, and the steadfast insistence of the citizenry if we are to have a chance at slowing climate change and curbing greenhouse gas emissions.
On every continent of the planet, there are citizen-based movements to address the impacts of coal on the environment. CoalSwarm has compiled a dynamic listing on a country-by-country basis. Similarly, a sister project, FrackSwarm, is a clearinghouse for citizen’s movements around the world that are addressing the impacts of fracking. Both CoalSwarm and FrackSwarm advocate strongly for a movement to clean energy everywhere. Both sites feature detailed background information on movements around the world and are partner projects to SourceWatch and the Center for Media and Democracy.
Halt the Harm Network, another organization closely allied with FracTracker Alliance, has developed a robust network of groups leading the fights against the oil and gas industry. Their database is searchable by skills, geography, and interests. Many of the organizations included in their database are also included in this map of resistance advocacy and activism groups fighting for a clean energy future.
Last, but not least, in 2017, FracTracker Alliance partnered with E2 to create a resource called “Mapping Clean Energy: New York”. You can view the maps that show clean energy jobs, solar, wind, and electric vehicle resources here. FracTracker also developed clean energy interactive maps for Pennsylvania, Ohio, Illinois, Michigan, and Missouri.
FracTracker will continue to update our Clean Energy Action Maps project, and actively solicit input and feedback from the public. If your advocacy group is not listed on our maps above, please complete the form at the bottom of the project page. We’ll compile public input, and regularly add new organizations to this resource.
Of note: We will soon be retiring our Alliance Map in favor of these maps, as we believe it is extremely important to capture the depth and breadth of the movements against fossil fuels and in support of renewables. This project is our effort to make connections across the globe, whether or not we are in direct communication with the groups on the maps.
If you have any questions about this work, please email: info@fractracker.org.
By Vivian Underhill, Data and GIS Intern; and Kyle Ferrar, Western Program Coordinator, FracTracker Alliance
California and New York are not the only states supporting the transition from harmful fossil fuels such as natural gas to more sustainable and less polluting clean, renewable energy sources. In collaboration with Environmental Entrepreneurs (E2), FracTracker has produced a series of maps investigating current clean energy businesses, existing renewable energy infrastructure, and renewable energy potential. These maps show where growth of the renewable economies is growing and even identifies the many renewable contractors and projects that are planned and already active across the country.
According to the Clean Jobs Midwest Report, growth of the renewable sector has been a strong boon for local Michigan economies, in addition to reducing green-house gas emissions. Michigan increased clean energy jobs by 5.3 percent, or 4,655, outpacing other job sectors in the state by a factor of three. According to a new Union of Concerned Scientists Report, Michigan utilities could create 10 times more jobs in renewables than natural gas. Another report by the Union of Concerned Scientists notes that:
… using the latest wind turbine technologies, Michigan’s onshore wind resource has the potential to generate nearly five times the state’s 2012 electricity demand, even after a variety of competing land uses are accounted for. Solar photovoltaic (PV) resources in urban areas — including large ground-mounted and smaller rooftop systems — could provide another 71 percent of the state’s 2012 electricity demand.
FracTracker’s maps below show plenty of potential for additional renewable energy generation, and highlight where Michigan’s clean energy sector is already paving the way to a healthier future. But first, let’s give you some background on this story.
In 2008, Michigan passed legislation requiring utilities to generate 10% of their electricity from renewables by 2015. In 2014, The Michigan Public Service Commmission (MPSC) reported that this legislation would save the state over $4 billion dollars; as the MPSC Chairman John D. Quackenbush wrote in conjunction with a 2014 report on the state’s energy optimization activities: “The cheapest energy is the energy never used… For every dollar spent on these programs in 2014, customers can expect to realize $4.38 in savings – more than any year since 2010.” In addition, the statute’s focus on renewables has brought nearly $3 billion in renewable energy investment to the state.
In 2016, legislators built on this track record and improved aspects of the state’s clean energy standards with Public Acts 341 and 342; among other things, these acts increase the percentage of renewable energy to 15% by 2021, and otherwise incentivize clean energy sources.
Just last week, Michigan’s two largest utilities committed to increase their renewable power generation to 25% by 2030 under pressure from a ballot drive launched by Tom Steyer, a billionaire environmentalist.
Below we have embedded the maps FracTracker created with E2, showing clean energy potential, generation capacity, and the location of clean energy businesses in Michigan.
Map 1. Michigan Clean Energy Potential
View map fullscreen | How FracTracker maps work
As shown in the map above, solar and wind are the most dominant forms of renewable energy in Michigan, although there is also potential to take advantage of the geothermal energy. Approximately 75% of the state has potential for either wind, solar, or geothermal power.
Map 2. Michigan Clean Energy Generation Capacity
View map fullscreen | How FracTracker maps work
Map 2, above, shows the current generating capacity in the state. Most of Michigan’s existing solar and wind infrastructure exists in the South and Southeast portions of the state, though not exclusively. Many schools also have solar capabilities on their roofs. Further, 32 counties already have large-scale renewable energy projects, and many more are in in the works.
Map 3. Michigan Clean Energy Businesses
View map fullscreen | How FracTracker maps work
Finally, a vibrant industry of over 1,200 businesses has developed to support the clean energy revolution in Michigan. Map 3 (above) shows the locations of these entreprenuers in fields that include both energy efficiency and renewable energy generation (solar, wind, and geothermal). Businesses include a range of operations including design, machining, installation, contracting, and maintenance – covering all 38 state senate districts and all 110 state house districts.
While Michigan has come a long way in recent years, the field of clean renewable energy generation is still in its infancy. This geographical assessment, in addition to the numerous economic reports showing the profitability of the clean energy sector, paint a brighter future for Michigan and the climate. However, much more potential remains to be tapped, across solar, wind, and other renewable energy sources. It is imperative that policies are put in place to prioritize clean energy growth over natural gas.
Cover photo: MI Wind Farm. Photo by Michelle Froese | Windpower Engineering and Development
Explore additional state analyses: IL | MI | MO | NY | OH | PA
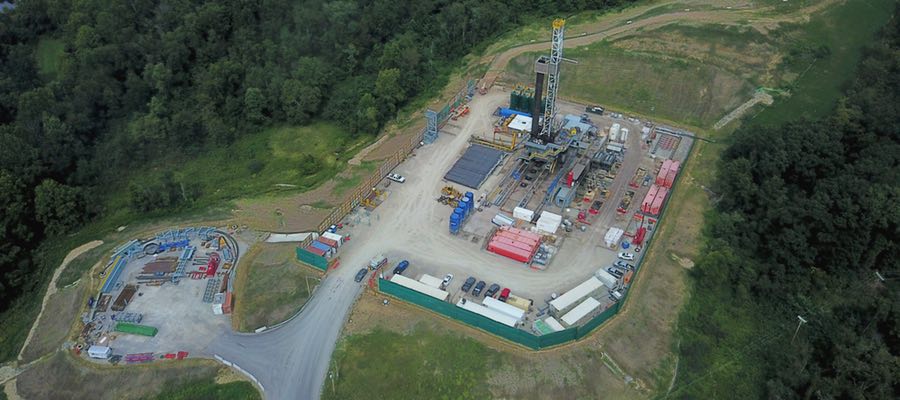
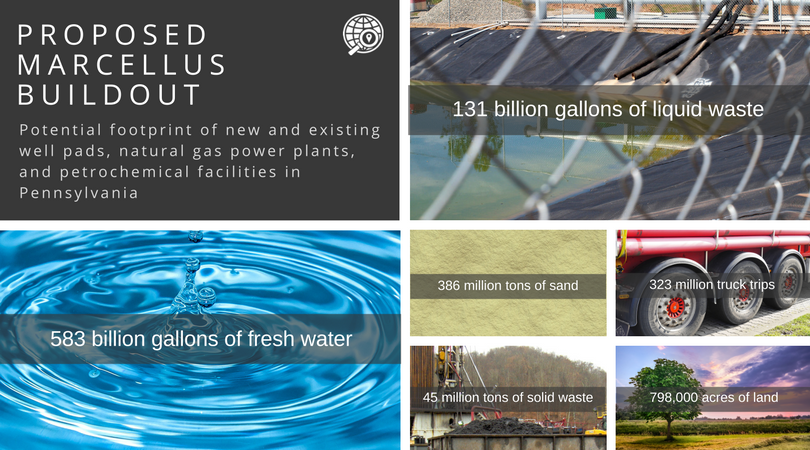
FracTracker Alliance released the report: A Hazy Future: Pennsylvania’s Energy Landscape in 2045 today, which details the potential future impacts of a massive buildout of Marcellus Shale wells and associated natural gas infrastructure.
Industry analysts forecast 47,600 new unconventional oil and gas wells may be drilled in Pennsylvania by 2045, fueling new natural gas power plants and petrochemical facilities in PA and beyond. Based on industry projections and current rates of consumption, FracTracker – a national data-driven non-profit – estimates the buildout would require 583 billion gallons of fresh water, 386 million tons of sand, 798,000 acres of land, 131 billion gallons of liquid waste, 45 million tons of solid waste, and more than 323 million truck trips to drilling sites.
“Only 1,801 of the 10,851 unconventional wells already drilled count as a part of this projection, meaning we could see an additional 45,799 such wells in the coming decades,” commented Matt Kelso, Manager of Data and Technology for FracTracker and lead author on the report.
Why the push for so much more drilling? Out of state – and out of country – transport is the outlet for surplus production.
“The oil and gas industry overstates the need for more hydrocarbons,” asserted FracTracker Alliance’s Executive Director, Brook Lenker. “While other countries and states are focusing more on renewables, PA seems resolute to increase its fossil fuel portfolio.”
The report determined that the projected cleared land for well pads and pipelines into the year 2045 could support solar power generation for 285 million homes, more than double the number that exist in the U.S.
“A Hazy Future shows that a fossil fuel-based future for Pennsylvania would come at the expense of its communities’ health, clean air, water and land. It makes clear that a dirty energy future is unnecessary,” said Earthworks’ Pennsylvania Field Advocate, Leann Leiter. Earthworks endorsed FracTracker’s report. She continued, “I hope Governor Wolf reads this and makes the right choices for all Pennsylvanians present and future.”
A Hazy Future reviews the current state of energy demand and use in Pennsylvania, calculates the footprint of industry projections of the proposed buildout, and assesses what that would look like for residents of the Commonwealth.
About FracTracker Alliance
Started in 2010 as a southwestern Pennsylvania area website, FracTracker Alliance is a national organization with regional offices across the United States in Pennsylvania, the District of Columbia, New York, Ohio, and California. The organization’s mission is to study, map, and communicate the risks of oil and gas development to protect our planet and support the renewable energy transformation. Its goal is to support advocacy groups at the local, regional, and national level, informing their actions to positively shape our nation’s energy future.
Questions? Email us: info@fractracker.org.

Next spring, join FracTracker Alliance and Ecologic Institute on a unique and timely European Renewable Energy Tour. Witness the incredible – and essential – energy revolution happening in Europe in an immersive, holistic way.
Europe’s energy policies are set to reduce dependence on foreign providers of fossil fuels, and substantially reduce the region’s climate change footprint. In addition to learning how select European cities are expanding their renewable energy portfolios, the goal of this trip is to stimulate and inspire new perspectives and connections that will accelerate a better energy future in the United States.
Save the dates: May 27, 2018 – June 2, 2018
The full price of the tour ($1990.00*) includes all site visits, meetings, admission fees, 14 meals (except alcoholic beverages), accommodations, and in-Europe travel from Copenhagen, to Hamburg, to Berlin, to Frankfurt. The fee includes a small donation to both partnering organizations. International flights to Copenhagen and from Frankfurt (back to the U.S.) are not included. Financial assistance may be available. Contact us for more information.
The deadline to buy your tickets has been extended to December 31, 2017. We hope you will join us for this unique, 7-day educational experience.
* Double occupancy receives a $300 discount. Select the Double Occupancy option when purchasing your tickets.
** Airfare to and from Europe is not included in the total price of the trip. Participants should book their flights to arrive in Copenhagen, Denmark on May 27th, departing for the US from Frankfurt, Germany on June 2, 2018.
Brook Lenker, Executive Director, FracTracker Alliance
lenker@fractracker.org or (717) 303-0403
Corn Ethanol and Fracking – Similarities Abound
Even though it is a biofuel and not a fossil fuel, in this post we discuss the ways in which the corn ethanol production industry is similar to the fracking industry. For those who may not be familiar, biofuel refers to a category of fuels derived directly from living matter. These may include:
Speaking about biofuels in 2006, J. Hill et al. said:
To be a viable substitute for a fossil fuel, an alternative fuel should not only have superior environmental benefits over the fossil fuel it displaces, be economically competitive with it, and be producible in sufficient quantities to make a meaningful impact on energy demands, but it should also provide a net energy gain over the energy sources used to produce it.
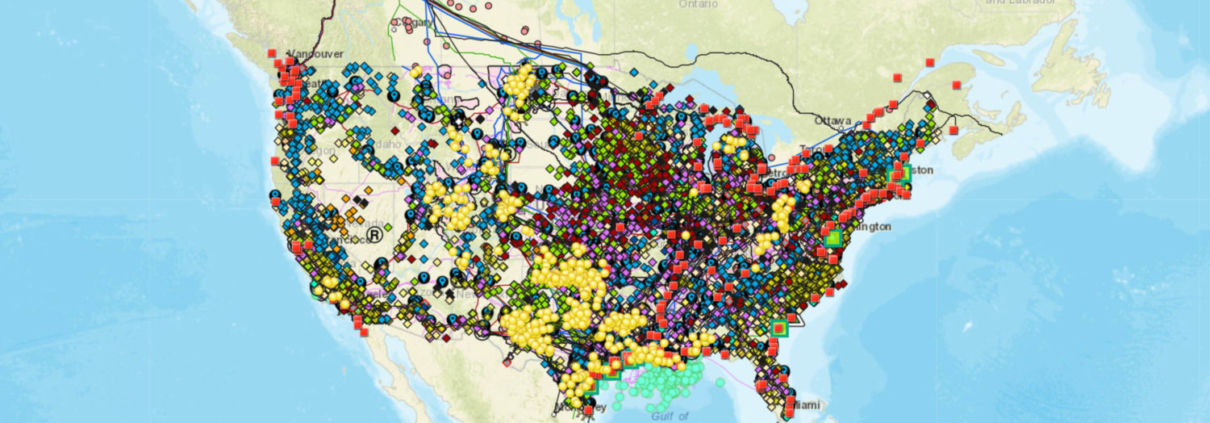
Out of all available biofuels it is ethanol that accounts for a lion’s share of North American biofuel production (See US Renewables Map Below). This trend is largely because most Americans put the E-10 blends in their tanks (10% ethanol).3 Additionally, the Energy Independence and Security Act of 2007 calls for ethanol production to reach 36 billion gallons by 2022, which would essentially double the current capacity (17.9 billion gallons) and require the equivalent of an additional 260 refineries to come online by then (Table 1, bottom).
US Facilities Generating Energy from Biomass and Waste along with Ethanol Refineries and Wind Farms
View map fullscreen | How FracTracker maps work
But more to the point… the language, tax regimes, and potential costs of both ethanol production and fracking are remarkably similar. (As evidenced by the quotes scattered throughout this piece.) Interestingly, some of the similarities are due to the fact that “Big Ag” and “Big Oil” are coupled, growing more so every year:
The shale revolution has resulted in declining natural gas and oil prices, which benefit farms with the greatest diesel, gasoline, and natural gas shares of total expenses, such as rice, cotton, and wheat farms. However, domestic fertilizer prices have not substantially fallen despite the large decrease in the U.S. natural gas price (natural gas accounts for about 75-85 percent of fertilizer production costs). This is due to the relatively high cost of shipping natural gas, which has resulted in regionalized natural gas markets, as compared with the more globalized fertilizer market. (USDA, 2016)
For background, below is a timeline of important events and publications related to ethanol regulation in the U.S. in the last four decades:
[Bill] Clinton justified the ethanol mandate by declaring that it would provide “thousands of new jobs for the future” and that “this policy is good for our environment, our public health, and our nation’s farmers—and that’s good for America.” EPA administrator Carol Browner claimed that “it is important to our efforts to diversify energy resources and promote energy independence.” – James Bovard citing Peter Stone’s “The Big Harvest,” National Journal, July 30, 1994.
Of the 270 ethanol refineries we had sufficient data for, we estimate these facilities employ 235,624 people or 873 per facility and payout roughly $6.18-6.80 billion in wages each year, at an average of $22.9-25.2 million per refinery. These employees spend roughly 423,000 hours at the plant or at associated operations earning between $14.63 and $16.10 per hour including benefits. Those figures amount to 74-83% of the average US income. In all fairness, these wages are 13-26% times higher than the farming, fishing, and forestry sectors in states like Minnesota, Nebraska, and Iowa, which alone account for 33% of US ethanol refining.
Additional benefits of ethanol refineries include the nearly 179 million tons of CO2 left in the field as stover each year, which amounts to 654,532 tons per refinery. Put another way – these amounts are equivalent to the annual emissions of 10.7 million and 39,194 Americans, respectively.
Finally, what would a discussion of ethanol refineries be without an estimate of how much gasoline is produced? It turns out that the 280 refineries (for which we have accurate estimates of capacity) produce an average of 71.93 million gallons per year and 20.1 billion gallons in total. That figure represents 14.3% of US gasoline demand.
Direct Costs
Biofuel expansions such as those listed in the timeline above and those eluded to by the likes of the IPCC have several issues associated with them. One of which is what Pimentel et al. considered an insufficient – and to those of us in the fracking NGO community, familiar sounding – “breadth of relevant expertise and perspectives… to pronounce fairly and roundely on this many-sided issue.”
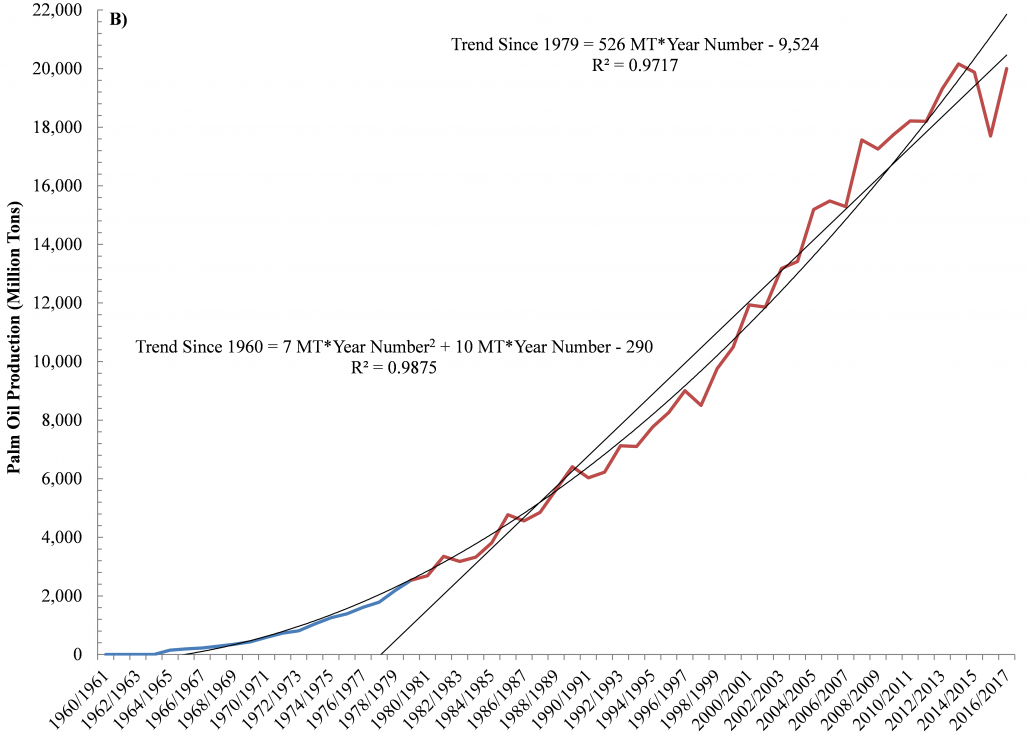
The above acts and reports in the timeline prompted many American farmers to double down on corn at the expense of soybeans, which caused Indirect Land Use Change (ILUC); the global soy market skyrocketed. This, in turn, prompted the clearing and/or burning of large swaths of the Amazonian rainforests and tropical savannas in Brazil, the world’s second-leading soy producer. More recently, large swaths of Indonesia and Malaysia’s equally biodiverse peatland forests have been replaced by palm oil plantations (Table 2 and Figure 3, bottom). In the latter countries, forest displacement is increasing by 2.7-5.3% per year, which is roughly equal to the the rate of land-use change associated with hydraulic fracturing here in the US4 (Figure 1).

There is an increasing amount of connectivity between disparate regions of the world with respect to energy consumption, extraction, and generation. These connections also affect how we define renewable or sustainable:
In a globalized world, the impacts of local decisions about crop preferences can have far reaching implications. As illustrated by an apparent “corn connection” to Amazonian deforestation, the environmental benefits of corn-based biofuel might be considerably reduced when its full and indirect costs are considered. (Science, 2007)
These authors pointed to the fact that biofuel expectations and/or mandates fail to account for costs associated with atmospheric – and leaching – emissions of carbon, nitrogen, phophorus, etc. during the conversion of lands, including diverse rainforests, peatlands, savannas, and grasslands, to monocultures. Also overlooked were:
Sacrificing long-term ecological/food security in the name of short-term energy security has caused individuals and governments to focus on taking land out of food production and putting it into biofuels.
The rationale for ethanol subsidies has continually changed to meet shifting political winds. In the late 1970s ethanol was championed as a way to achieve energy independence. In the early 1980s ethanol was portrayed as salvation for struggling corn farmers. From the mid and late 1980s onward, ethanol has been justified as saving the environment. However, none of those claims can withstand serious examination. (James Bovard, 1995)
This is instead of going the more environmentally friendly route of growing biofuel feedstocks on degraded or abandoned lands. An example of such an endeavor is the voluntary US Conservation Reserve Program (CRP), which has stabilized at roughly 45-57 thousand square miles of enrolled land since 1990, even though the average payout per acre has continued to climb (Figure 2).
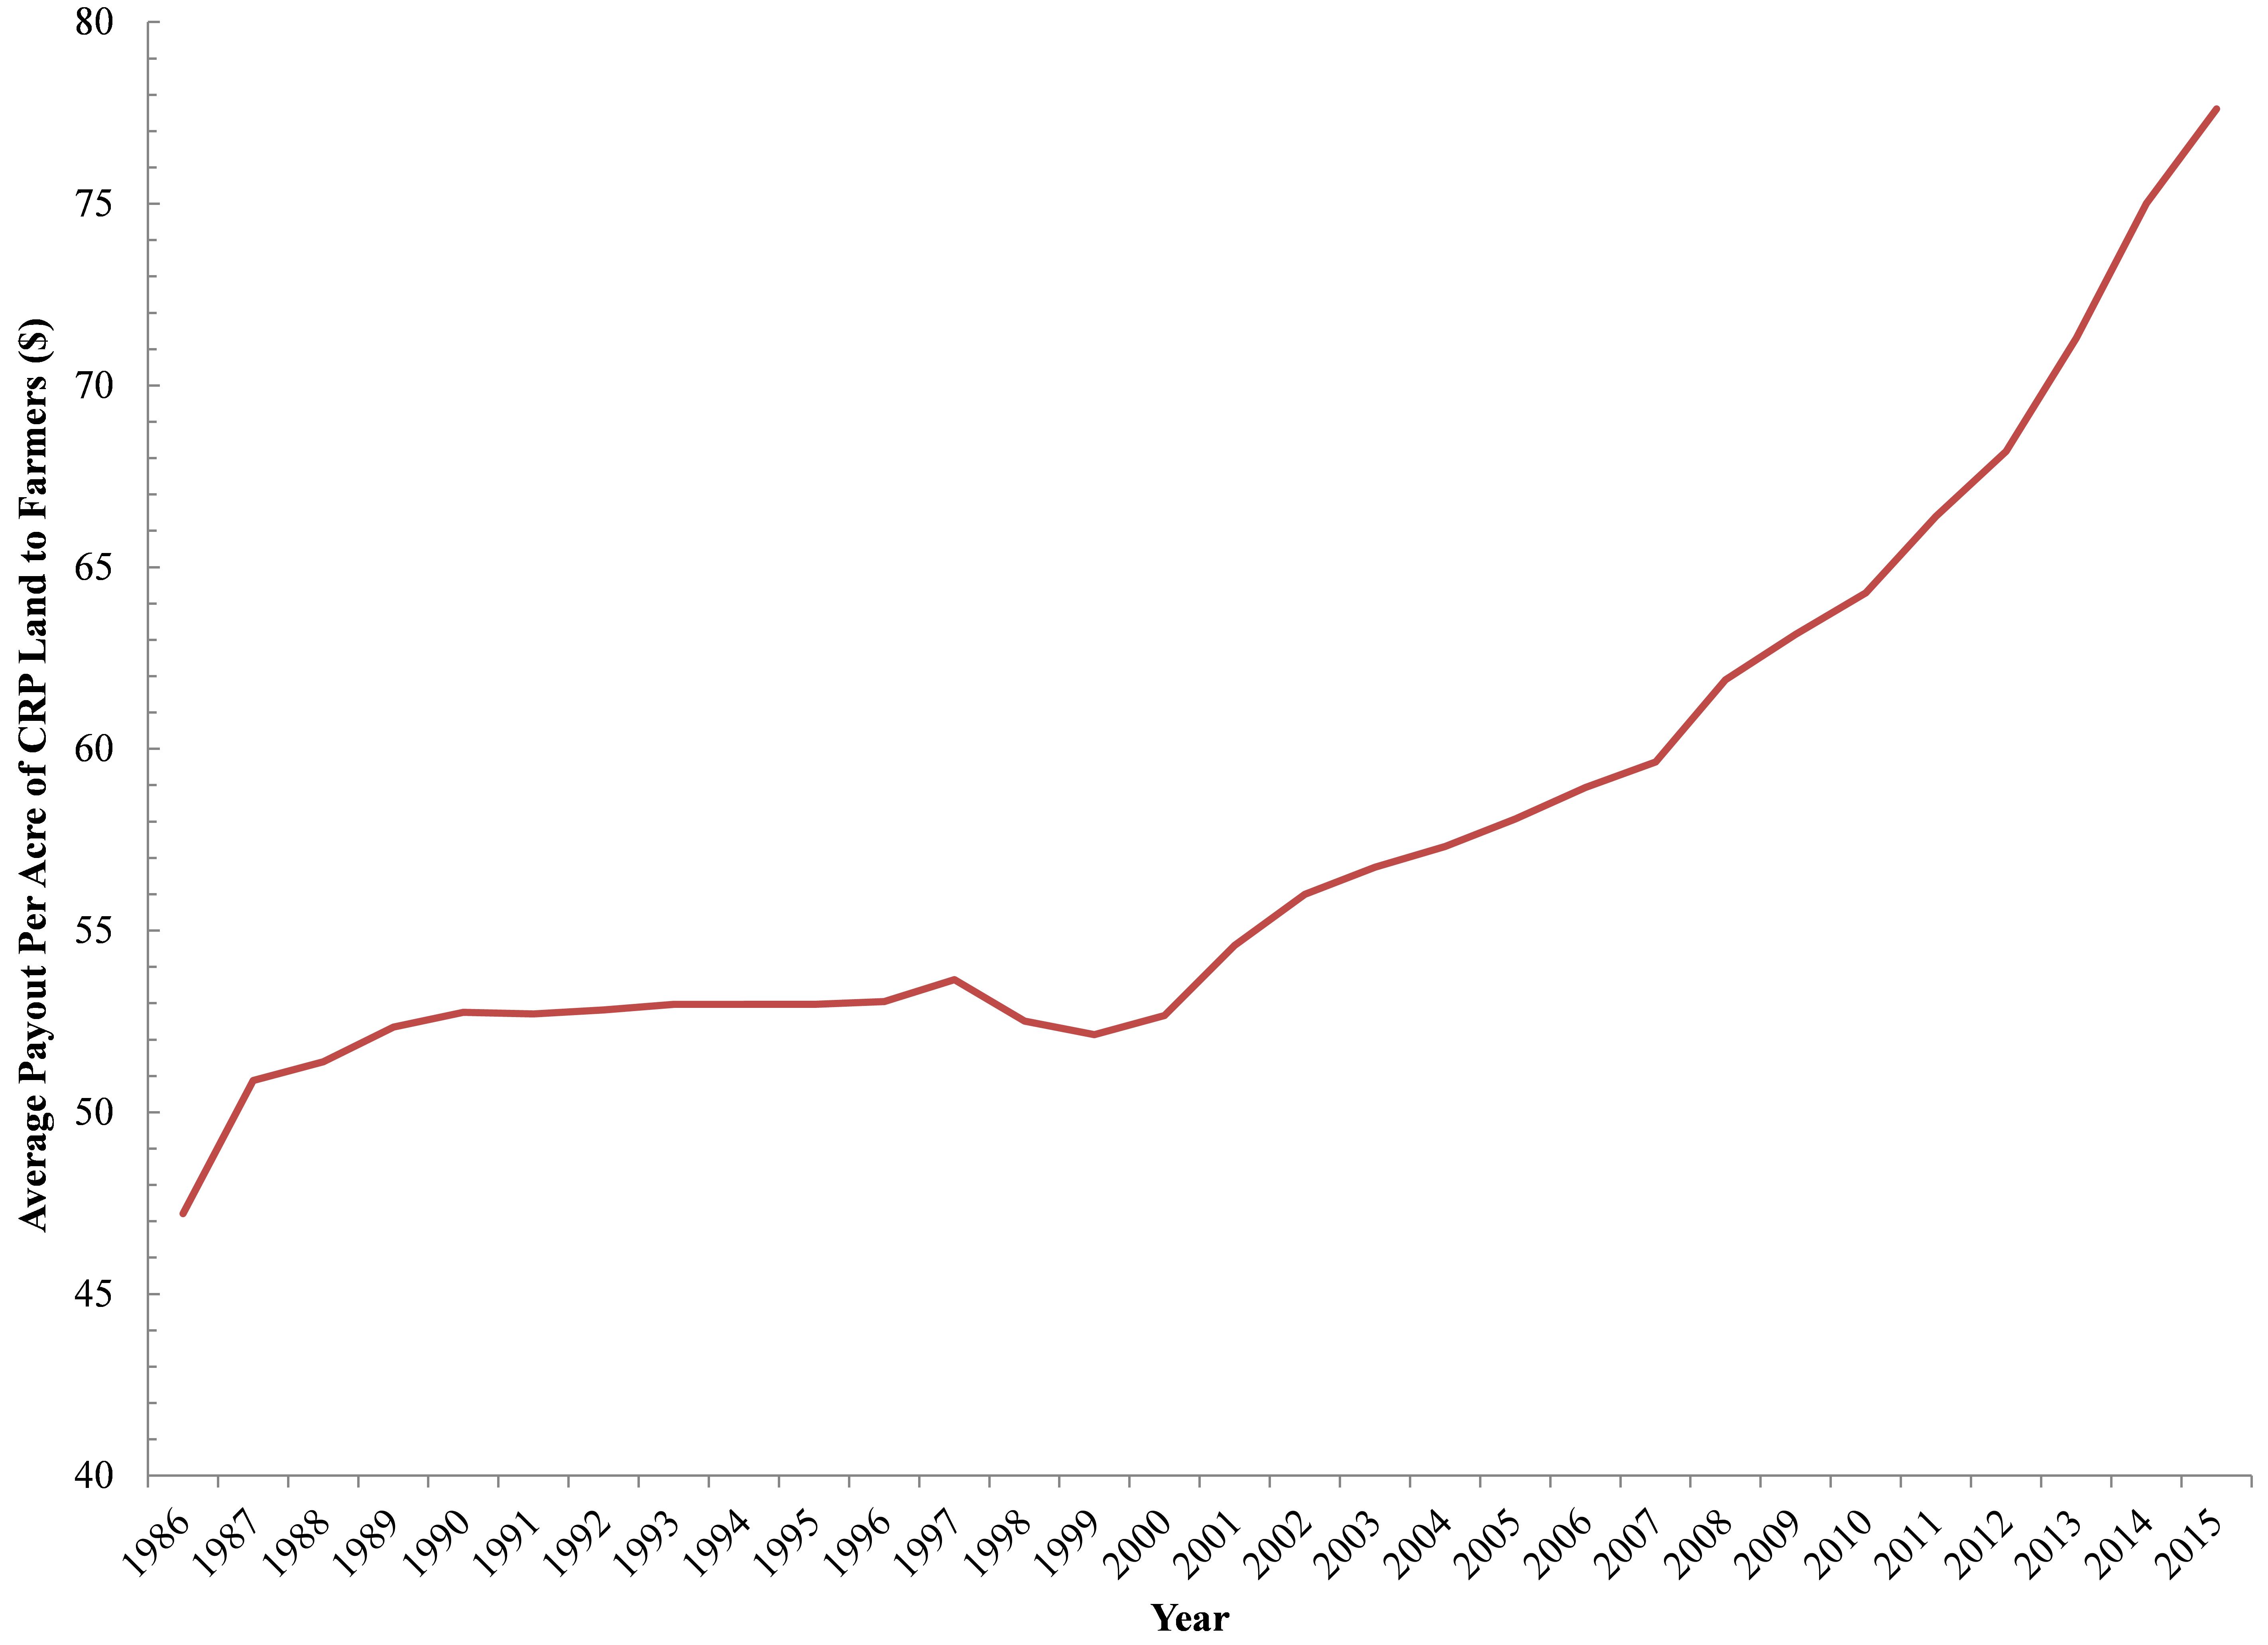
Figure 2. The Average Subsidy to Farmers Per Acre of Conservation Reserve Program (CRP) between 1986 and 2015.
The primary goals of the CRP program are to provide an acceptable “floor” for commodity prices, reduce soil erosion, enhance wildlife habitat, ecosystem services, biodiversity, and improve water quality on highly erodible, degraded, or flood proned croplands. Interestingly CRP acreage has declined by 27% since a high of 56 thousand square miles prior to the Energy Independence and Security Act of 2007 being passed. Researchers have pointed to the fact that corn ethanol production on CRP lands would create a carbon debt that would take 48 years to repay vs. a 93 year payback period for ethanol on Central US Grasslands.
To quote Fred Magdoff in The Political Economy and Ecology of Biofuels:
Alternative fuel sources are attractive because they can be developed and used without questioning the very workings of the economic system — just substitute a more “sustainable,” “ecologically sound,” and “renewable” energy for the more polluting, expensive, and finite amounts of oil. People are hoping for magic bullets to “solve” the problem so that capitalist societies can continue along their wasteful growth and consumption patterns with the least disruption. Although prices of fuels may come down somewhat — with dips in the business cycle, higher rates of production, or a burst in the speculative bubble in the futures market for oil — they will most likely remain at historically high levels as the reserves of easily recovered fuel relative to annual usage continues to decline.
Indirect Costs: Ethanol, Fertilizers, and the Gulf of Mexico Dead Zone
This is the Midwest vs. the Middle East. It’s corn farmers vs. the oil companies. – Dwaney Andreas in Big Stink on the Farm by David Greising
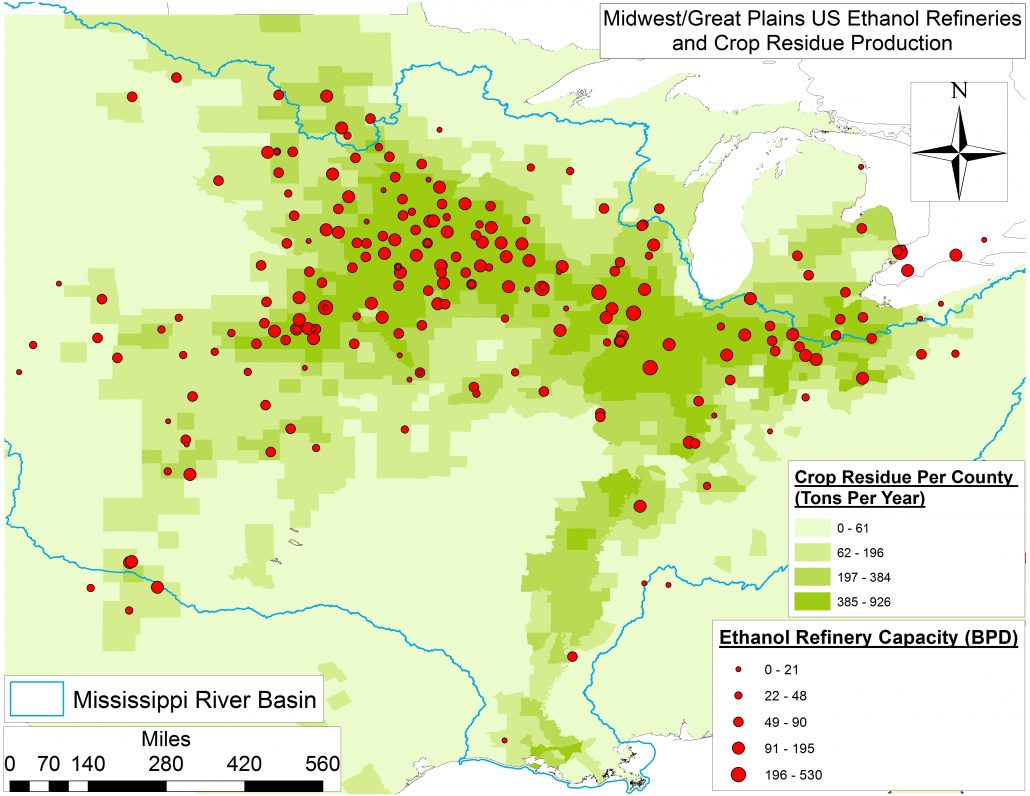
Sixty-nine percent6 of North America’s ethanol refineries are within the Mississippi River Basin (MRB). These refineries collectively rely on corn that receives 1.9-5.1 million tons of nitrogen each year, with a current value of $1.06-2.91 billion dollars or 9,570-26,161 tons of nitrogen per refinery per year (i.e. $5.42-14.81 million per refinery per year). These figures account for 27-73% of all nitrogen fertilizer used in the MRB each year. More importantly, the corn acreage receiving this nitrogen leaches roughly 0.81-657 thousand tons of it directly into the MRB. Such a process amounts to 5-44% of all nitrogen discharged into the Gulf of Mexico each year and 1.7-13.8 million tons of algae responsible for the Gulf’s growing Dead Zone.
Leaching of this nitrogen is analogous to flushing $45.7-371.6 million dollars worth of precious capital down the drain. Put another way, these dollar figures translate into anywhere between 55% and an astonishing 4.53 times Direct Costs to the Gulf’s seafood and tourism industries of the Dead Zone itself.
These same refineries rely on corn acreage that also receives 0.53-2.61 million tons of phosphorus each year with a current value of 0.34-1.66 billion dollars. Each refinery has a phosphrous footprint in the range of 2,700 to 13,334 tons per year (i.e., $1.72-8.47 million). We estimate that 25,399-185,201 tons of this fertilizer phosphorus is leached into the the MRB, which is equivalent to 19% or as much as 1.42 times all the phosphorous dischared into the Gulf of Mexico per year. Such a process means $16.13-117.60 million is lost per year.
Together, the nitrogen and phosphorus leached from acreage allocated to corn ethanol have a current value that is between 75% and nearly 6 times the value lost every year to the Gulf’s seafood and tourism industries.
Indirect Costs: Fertilizer and Herbicide Costs and Leaching
The 270 ethanol refineries we have quality production data for are relying on corn that receives 367,772 tons of herbicide and insecticide each year, with a current value of $6.67 billion dollars or 1,362 tons of chemical preventitive per refinery per year (i.e. $24.7 million per refinery per year). More importantly the corn acreage receiving these inputs leaches roughly 15.8-128.7 thousand tons of it directly into surrounding watersheds and underlying aquifers. Leaching of these inputs is analogous to flushing $287 million to $2.3 billion dollars down the drain.
During the recent Trump administration EPA, USDA, DOE administrator hearings, the Renewable Fuel Standard (RFS) was cited as critical to American energy independence by a bipartisan group of 23 senators. Among these were Democratic senator Amy Klobuchar and Republican Chuck Grassley, who co-wrote a letter to new EPA administrator Scott Pruitt demanding that the RFS remains robust and expands when possible. In the words of Democratic Senator Heidi Heitkamp – and long-time ethanol supporter – straight from the heart of the Bakken Shale Revolution in North Dakota:
The RFS has worked well for North Dakota farmers, and I’m fighting to defend it. As we’re doing today in this letter, I’ll keep pushing in the U.S. Senate for the robust RFS [and Renewable Volume Obligations (RVOs)] we need to support a thriving biofuels industry and stand up for biofuels workers. Biofuels create good-paying jobs in North Dakota and help support our state’s farmers, who rely on this important market – particularly when commodity prices are challenging.
Furthermore, the entire Iowa congressional delegation including the aforementioned Sen. Grassley joined newly minted USDA Secretary Sonny Perdue when he told the Iowa Renewable Fuels Association:
You have nothing to worry about. Did you hear what he said during the campaign? Renewable energy, ethanol, is here to stay, and we’re going to work for new technologies to be more efficient.
How this advocacy will play out and how the ethanol industry will respond (i.e., increase productivity per refinery or expand the number of refineries) is anybody’s guess. However, it sounds like the same language, lobbying, and advertising will continue to be used by the Ethanol and Unconventional Oil and Gas industries. Additional parallels are sure to follow with specific respect to water, waste, and land-use.
Furthermore, as both industries continue their ramp up in research and development, we can expect to see productivity per laborer to continue on an exponential path. The response in DC – and statehouses across the upper Midwest and Great Plains – will likely be further deregulation, as well.
From a societal perspective, an increase in ethanol production/grain diversion away from people’s plates has lead to a chicken-and-egg positive feedback loop, whereby our farmers continue to increase total and per-acre corn production with less and less people. In rural areas, mining and agriculture have been the primary employment sectors. A further mechanization of both will likely amplify issues related to education, drug dependence, and flight to urban centers (Figures 4A and B).
We still don’t know exactly how efficient ethanol refineries are relative to Greenhouse Gas Emissions per barrel of oil. By merging the above data with facility-level CO2 emissions from the EPA Facility Level Information on Greenhouse gases Tool (FLIGHT) database we were able to match nearly 200 of the US ethanol refineries with their respective GHG emissions levels back to 2010. These facilities emit roughly:
Emissions from ethanol will increase to 74.35 million tons in 2022 if the Energy Independence and Security Act of 2007’s prescriptions run their course. Such an upward trend would be equivalent to the GHG emissions of somewhere between that of Seattle and Detroit.
What was once a singles match between Frackers and Sheikhs may turn into an Australian Doubles match with the Ethanol Lobby and Farm Bureau joining the fray. This ‘game’ will only further stress the food, energy, and water (FEW) nexus from California to the Great Lakes and northern Appalachia.
We are on a thinner margin of food security, just as we are on a thinner margin of oil security… The [World] Bank implicitly questions whether it is wise to divert half of the world’s increased output of maize and wheat over the next decade into biofuels to meet government “mandates.” – Ambrose Evans-Pritchard in The Telegraph
Will long-term agricultural security be sacrificed in the name of short-term energy independence?
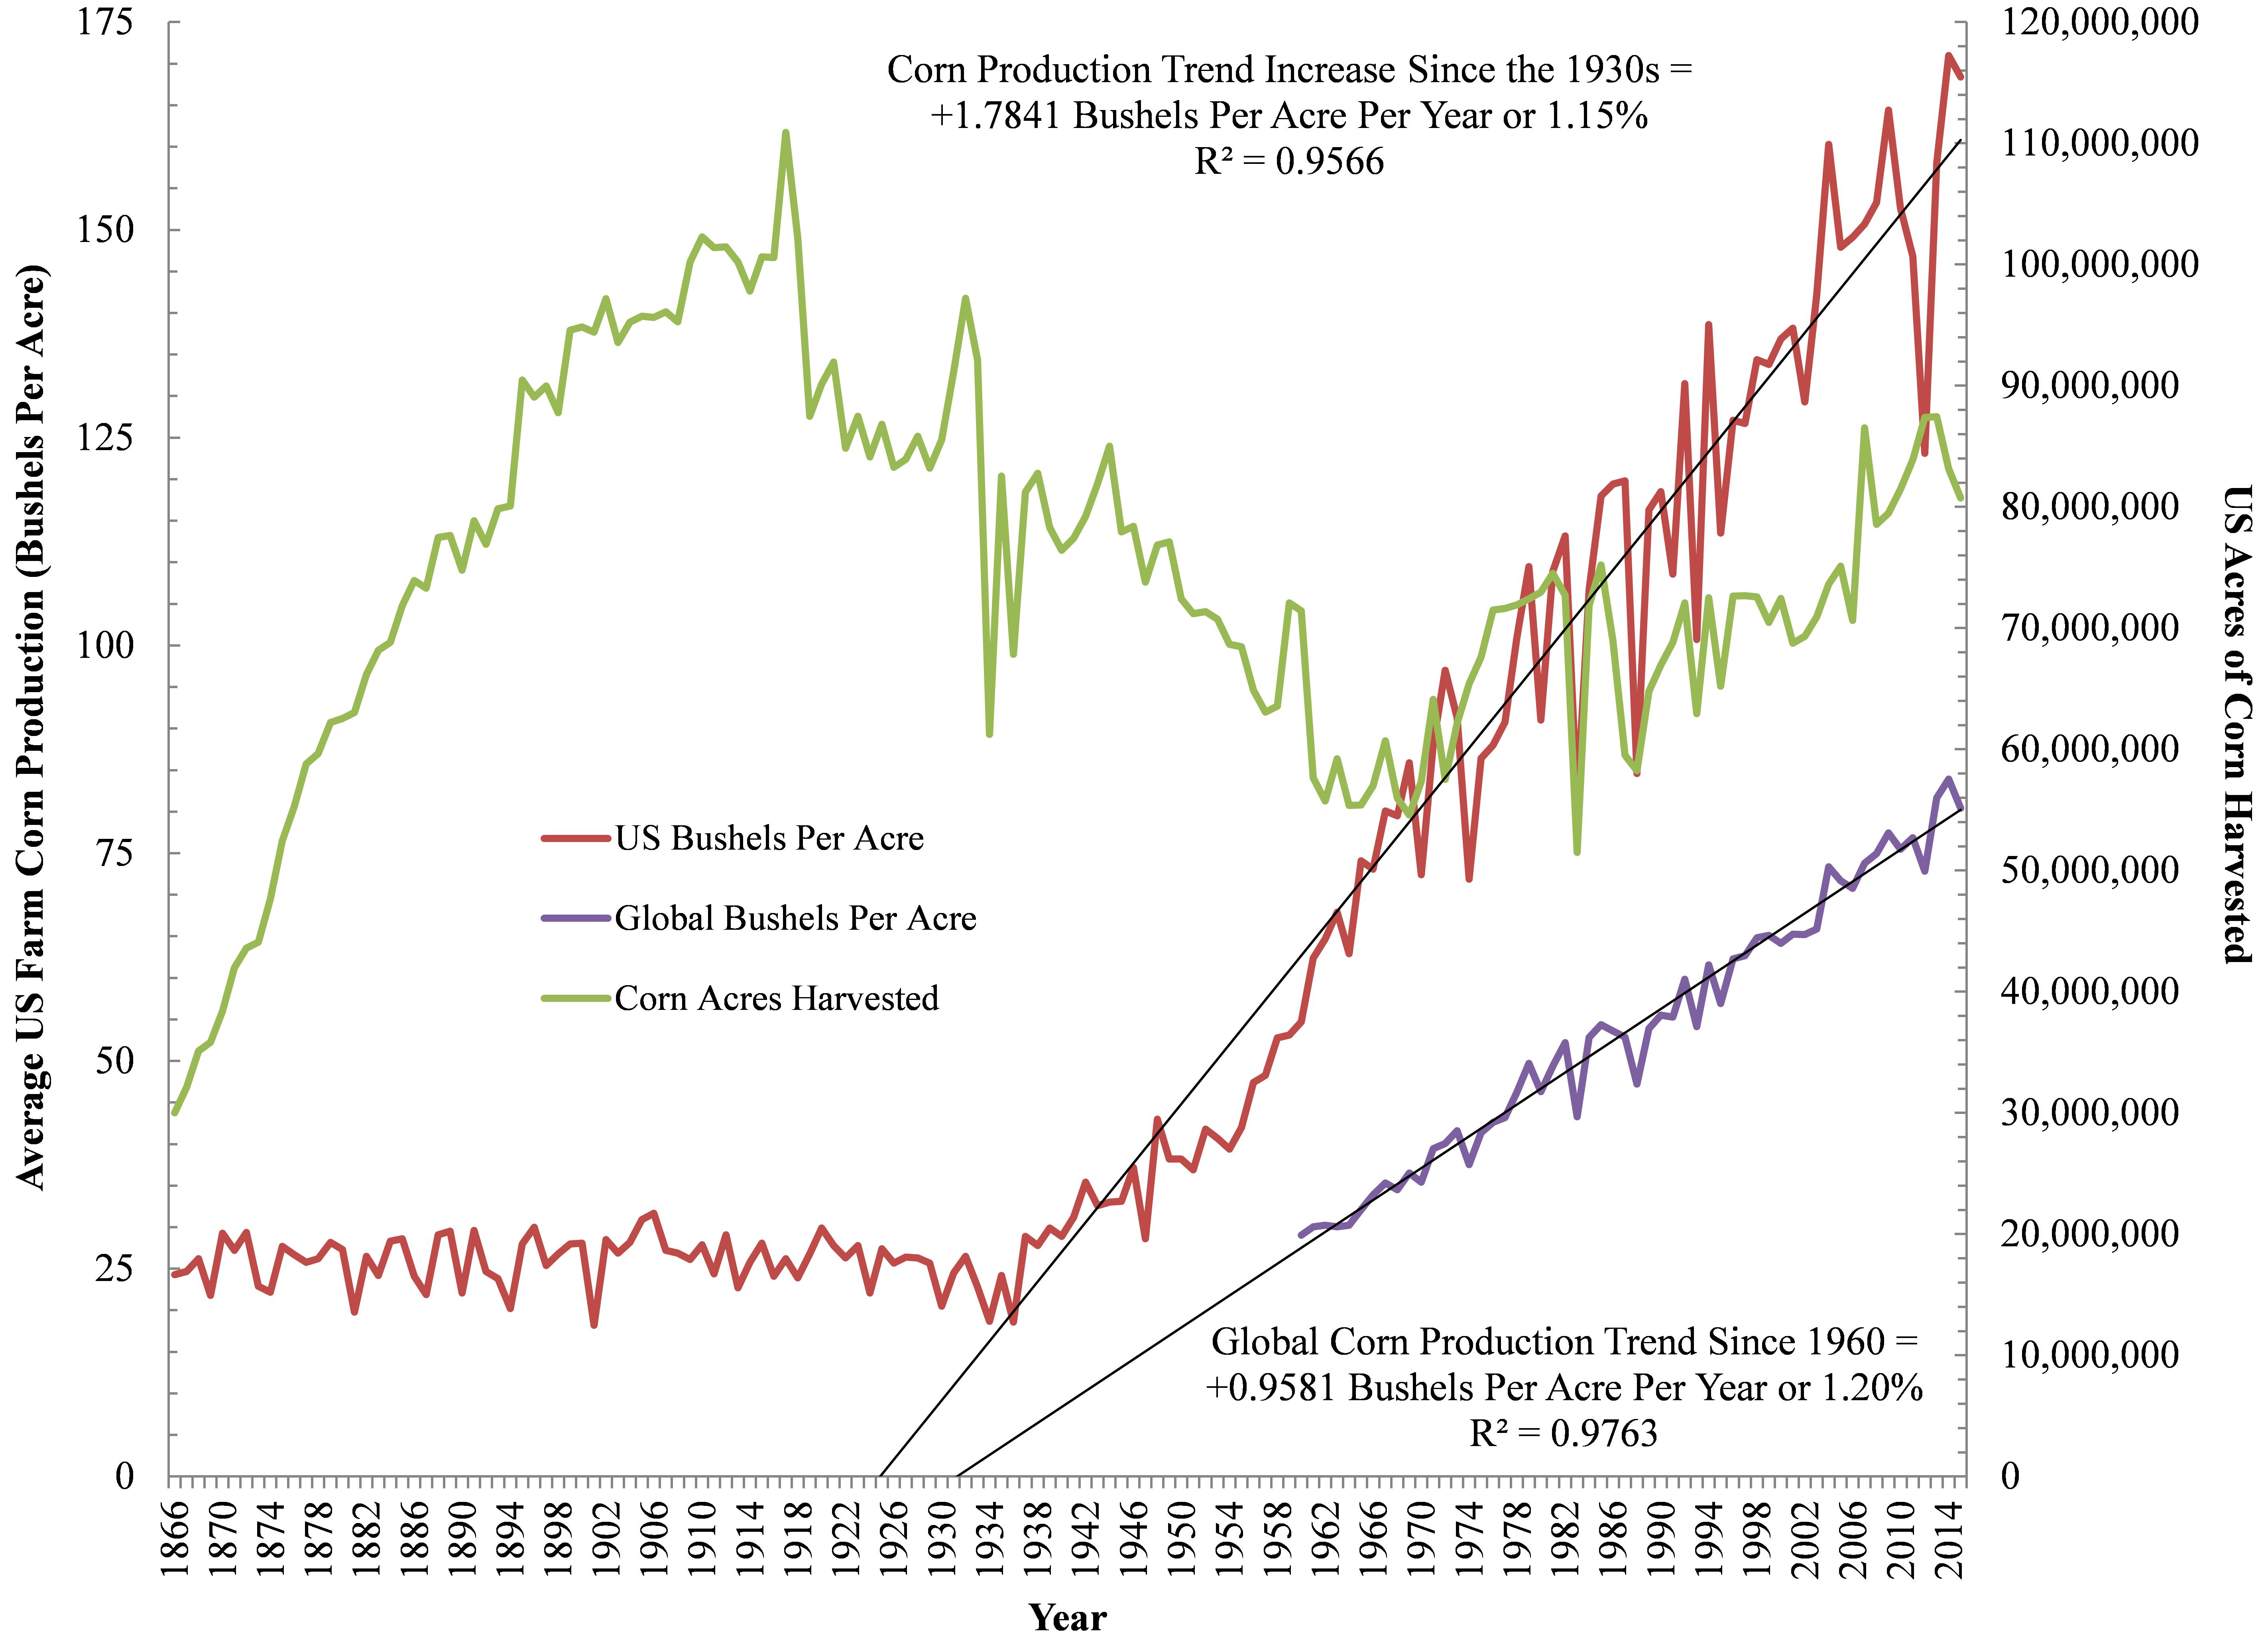
Figure 3. US and Global Corn Production and Acreage between 1866 and 2015.
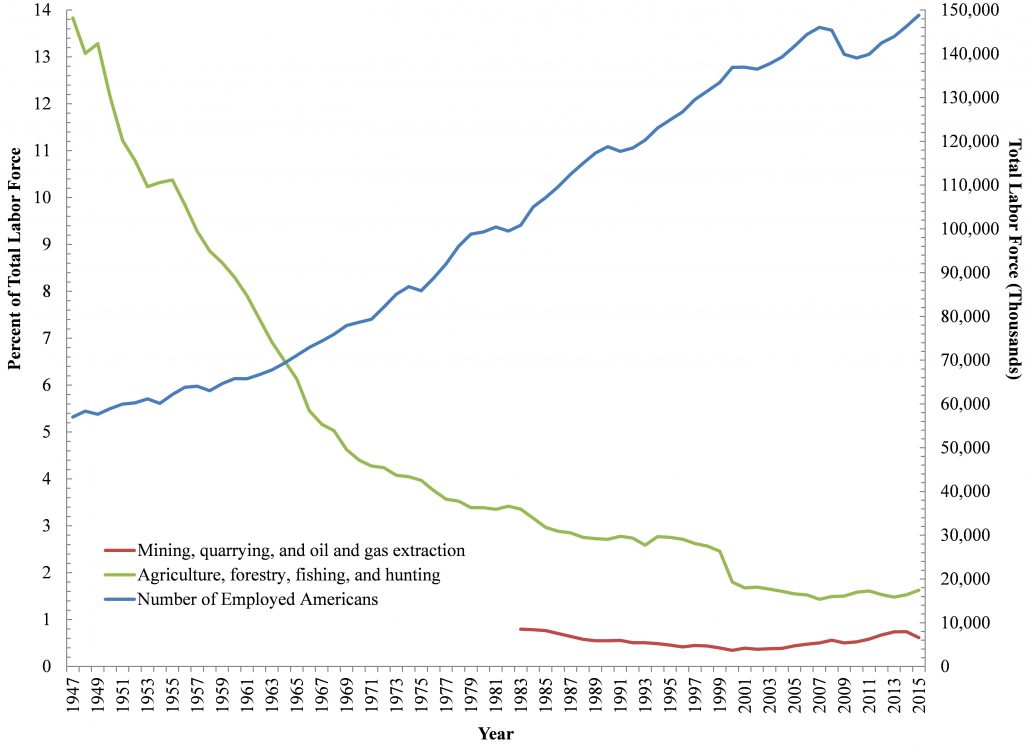
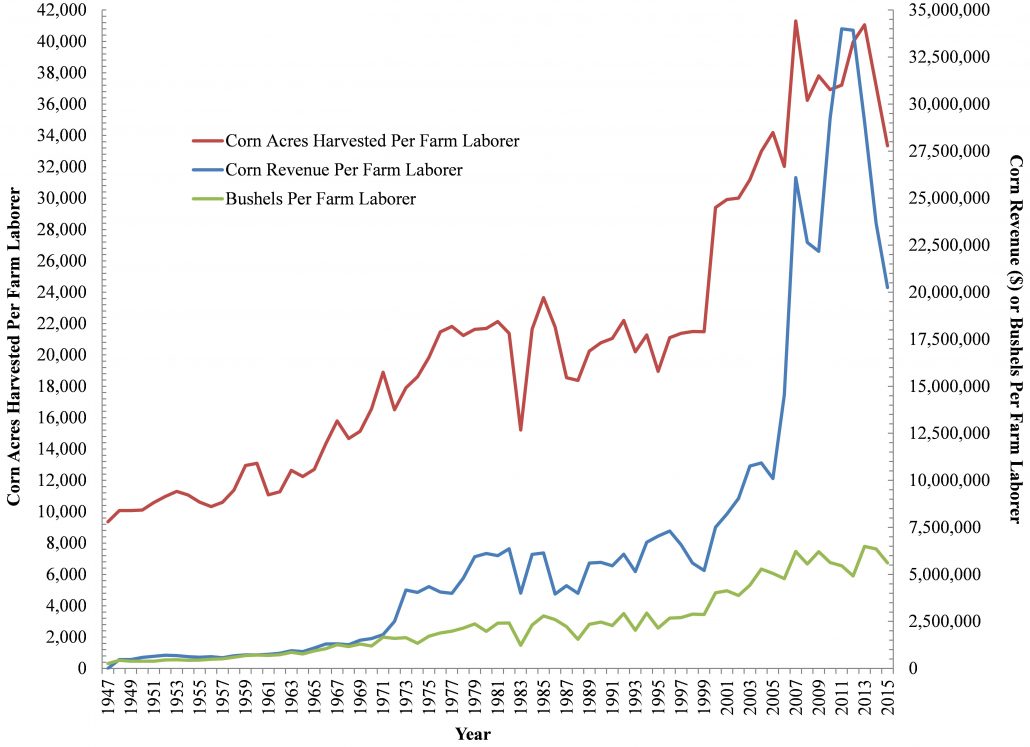
Figures 4A and 4B. A) Number of Laborers in the US Mining, Oil and Gas, Agriculture, Forestry, Fishing, and Hunting sector and B) US Corn Production Metrics Per Farm Laborer between 1947 and 2015.
Table 1. Summary of our Corn Ethanol Production, Land-Use, and Water Demand analysis
| Gallons of Corn Ethanol Produced Per Year | 17,847,616,000 |
| Bushels of Corn Needed | 6,374,148,571 |
| Percent of US Production | 44.73% |
| Land Needed | 104,372,023 acres |
| “” | 163,081 square miles |
| Percent of Contiguous US Land | 5.51% |
| Percent of US Agricultural Land | 11.28% |
| Gallons of Water Needed | 49.76 trillion (i.e. 3.55 million swimming pools) |
| Gallons of Water Per Gallon of Oil | 2,788 |
| Average and Total Site/Industry Capacity | |
| Average Corn Ethanol Production Per Existing or Under Construction Facility (n = 257) | 69,717,250 |
| Gallons of Corn Ethanol Produced Per Year | 17,847,616,000 |
| Difference Between 2022 Energy Independence and Security Act of 2007 36 Billion Gallon Mandate | 18,152,384,000 |
| # of New Refineries Necessary to Get to 2022 Levels | 260 |
| Percent Increase Over Current Facility Inventory | 1.7 |
| IEA 2009 World Energy Outlook 250-620% Increase Predictions for 2030 | |
| 250% | 44,619,040,000 |
| # of New Refineries Necessary | 640 |
| Percent Increase Over Current Facility Inventory | 150.00 |
| 620% | 110,655,219,200 |
| # of New Refineries Necessary | 1,587 |
| Percent Increase Over Current Facility Inventory | 520.00 |
Table 2. Global Population Growth and Corn and Soybean Productivity Trends.
| Percent Change | Metric |
| +1.13% | Global Population Growth Trend |
| Corn (Bushels Per Acre) | |
| +1.15% Per Year | United States |
| +1.20% Per Year | Global |
| Soybean (Tons Per Acre) | |
| +0.9% Per Year | United States |
| +1.5% Per Year | Brazil |
| Palm Oil (Tons) | |
| +5.1% Per Year | Indonesia |
| +2.7% Per Year | Malaysia |
By Ted Auch, PhD, Great Lakes Program Coordinator, FracTracker Alliance
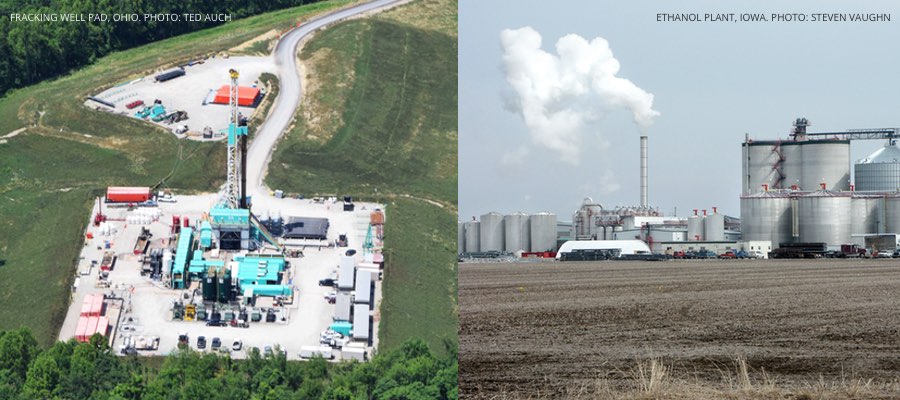
Cover photo, left: Oil and gas well pad, Ohio. Photo by Ted Auch.
Cover photo, right: A typical ethanol plant in West Burlington, Iowa. Photo by Steven Vaughn.
Click on the links below to download the datasets used to create the maps in this article.
![]()
216 Franklin St, Suite 400, Johnstown, PA 15901
Phone: +1 (717) 303-0403 | info@fractracker.org
FracTracker Alliance is a 501(c)3 non-profit: Tax identification number: 80-0844297
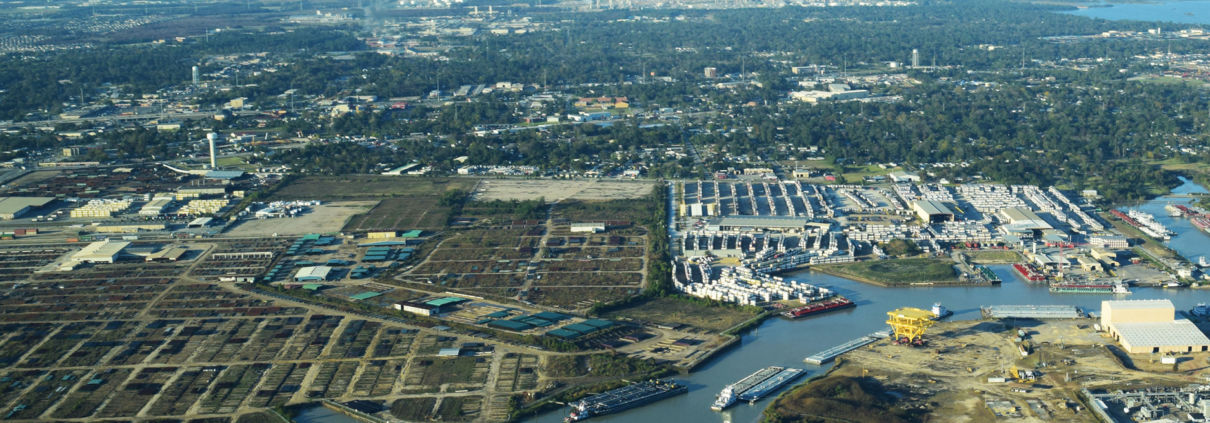 Photo by Ted Auch, FracTracker Alliance, with aerial support by LightHawk