Governor Newsom Must Do More to Address the Cause of Oil Spill Surface Expressions
Chevron and other oil and gas companies in western Kern County have drilled so many oil and gas wells that they have essentially turned this area of California into a block of Swiss cheese. As a result, several of the most over-developed oil fields (in the world!) are suffering from gushing oil seeps known as surface expressions. Since May of 2019, one surface expression alone has spilled over 1.3 million gallons of oil and wastewater in the Cymric Field in southwestern California. Thirteen known surface expressions have been reported actively flowing in the Cymric field in 2019, one for over 15 years (GS5).
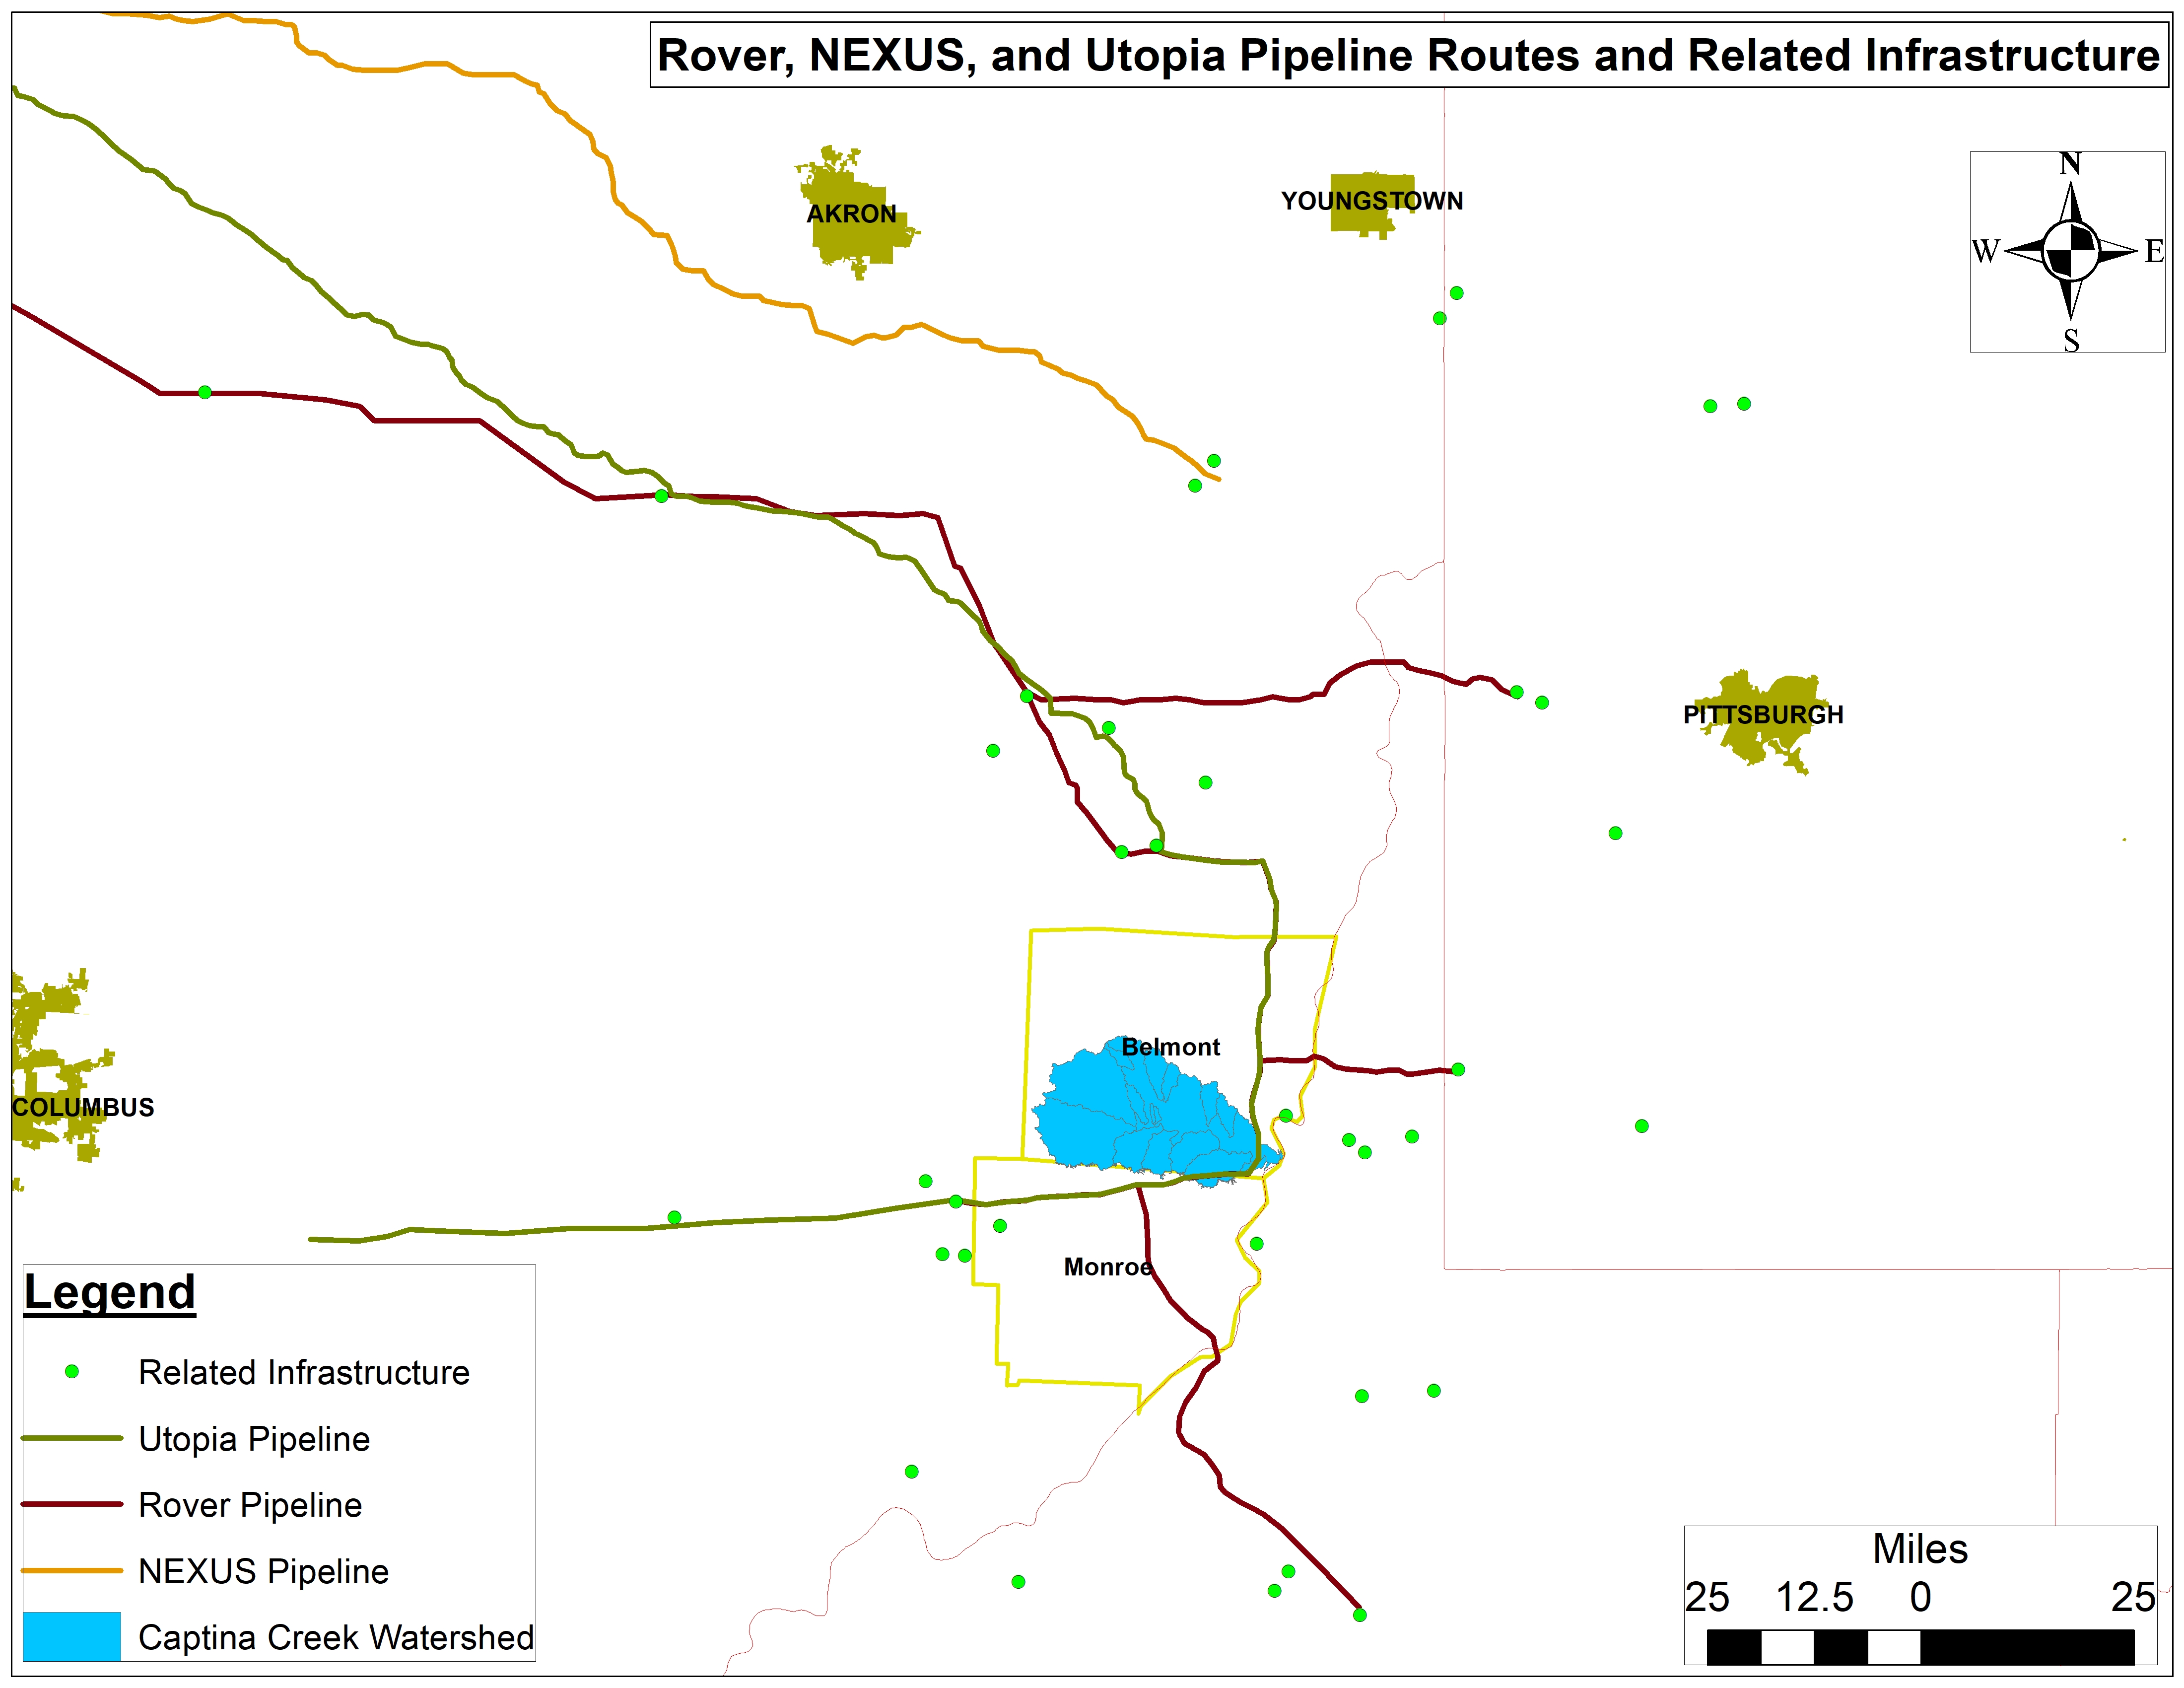
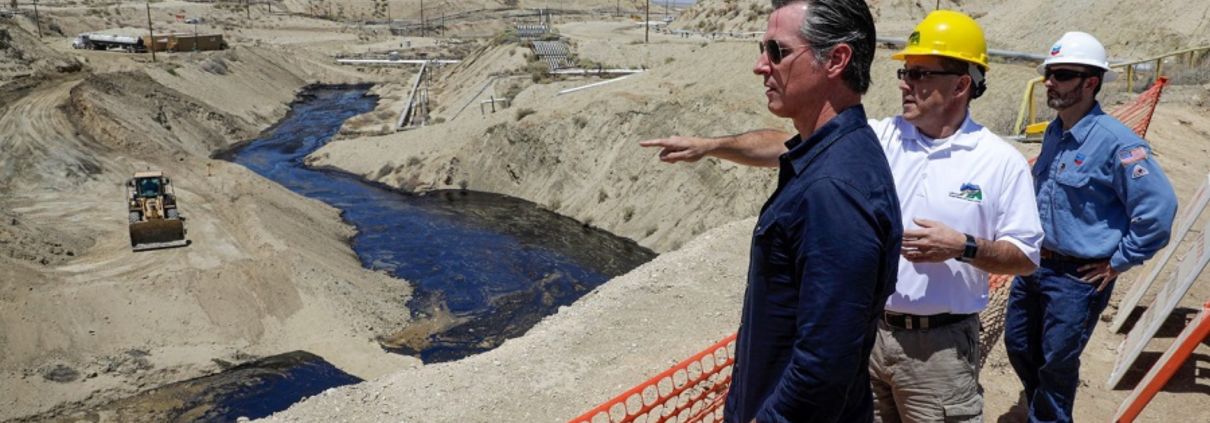
Regulators and Governor Newsom’s administration have attempted to address the issue but their response is not enough. Chevron was fined $2.7 million and Governor Newsom personally told Chevron to stop this spill, the location of which is shown below on the map in Figure 1. Oil and gas companies have also been ordered to lower their maximum injection pressures on new wells, limiting a technique called high pressure steam injection. Yet the state has continued to permit new cyclic steam and steam injection wells, the main cause of the surface expressions, including many in the same fields as the active surface expressions. Furthermore, data on new permit applications shows that Chevron and other operators intend to continue expanding their already bloated well counts. These new wells will increase the flow of oil to the surface via the over-abundance of existing older wells that serve as man-made pathways for toxic fluids.
Although Governor Newsom has made positive steps by halting new permits for higher pressure injections, the moratorium’s focus on injection pressure does not address all of the root causes of this epidemic of surface expressions, including over-development of these oil fields. Reducing the maximum injection pressures without also addressing the growing number of injection wells does nothing to reduce the pathways oil uses to travel to the surface. The Governor can reduce the active expressions and limit the risk for future expressions by halting permits for all new oil and gas wells, banning the existing use of steam injection, and forcing oil companies to plug and properly abandon older wells before they fail.
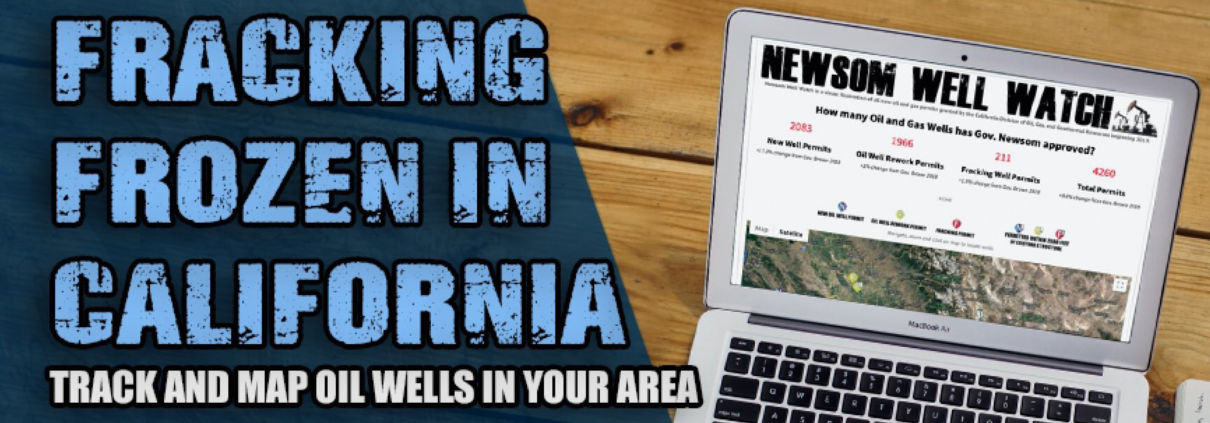
(To see Governor Newsom’s track record on permitting new oil and gas wells, see FracTracker Alliance’s collaboration with Consumer Watchdog at NewsomWellWatch.com)
View map fullscreen | How FracTracker maps work
Figure 1. Map of 2018-2019 Cymric Oil Field Surface Expressions. The map includes the locations of surface expressions as well as the locations of new injections wells permitted in 2019 and current applications submitted since November 19, 2019.
Background
Steam injection is used more commonly in California than hydraulic fracturing, due to the nature of California’s abundant geological activity. Steam injection wells include wells devoted solely to injection and others, called cyclic steam wells, that alternate between injection of steam and production of oil and gas. It requires an extreme amount of energy to accomplish this, so they are considered energy intensive. These operations are known collectively as enhanced oil recovery (EOR) wells.
Steam injection wells increase the volume of oil produced when compared to conventional methods. They do this by injecting steam and water into the low-quality heavy crude produced in California in order to decrease the viscosity and push it towards the bottom holes of the production wells. The steam also pushes oil in other directions unintentionally, such as to the surface where it can spill out becoming a surface expression.
Some of the most notable negative impacts caused by EOR wells in California include greenhouse gas contributions, air and water contamination, and risks to workers.
Environmental Impacts
In addition to the creation of greenhouse gases from burning the fossil fuels extracted from California oil fields, oil and gas operators cause surface expressions and emit methane and other greenhouse gases as they leak out of the ground. The leaking natural gas is full of toxic and carcinogenic volatile organic compounds that degrade the local and regional air quality and exacerbate climate change. The majority of these expressions have not been documented by regulators and the emissions are not considered. The expressions also push oil and wastewater upwards through groundwater, leaving it contaminated. When the oil gets to the surface, it destroys terrestrial habitat for native plants and endangered species such as the long nosed leopard lizard. The seeps are also a major hazard to migratory birds that confuse the pooling oil for water sources.
Worker Safety
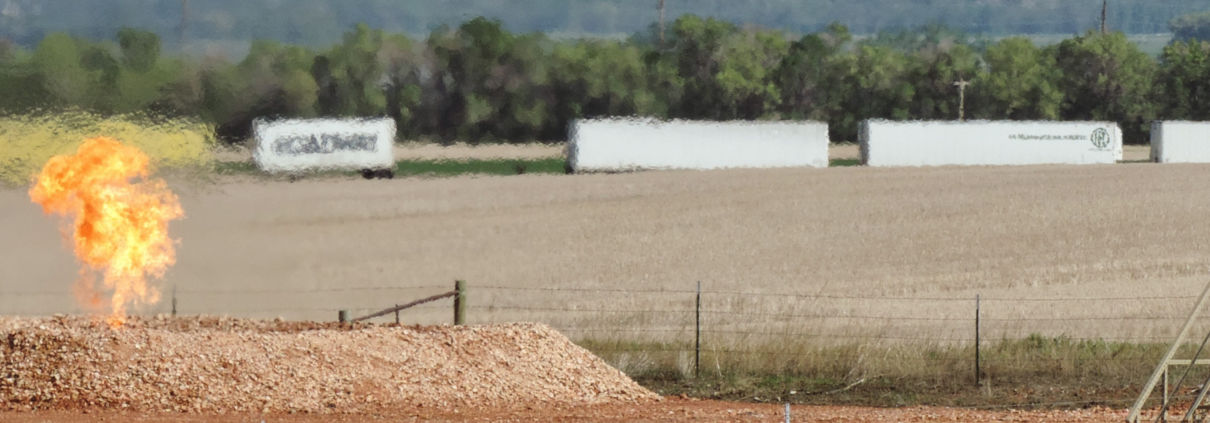
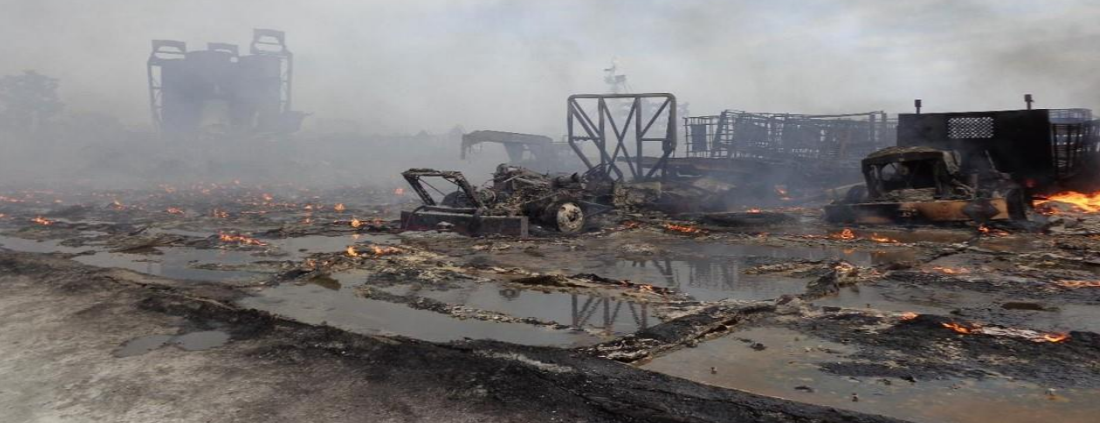
Surface expressions do not just ooze oil. When the pressure spreads underground beyond the target formation, it can cause oil, water, steam, rocks, and natural gas to shoot from the ground, presenting a deadly hazard to worker safety. Stories from oil field workers describe periods when oil companies increase steam injection volumes and activity as bringing chaos to the oil fields. “Engineers across the region engaged in a high-stakes version of whack-a-mole, rushing to plug one geyser while others broke through elsewhere,” according to Julie Cart with the LA Times.
A construction supervisor for Chevron named David Taylor was killed by such an event in the Midway-Sunset oil field near Bakersfield, CA. According to the LA Times, Chevron had been trying to control the pressure at the well-site. The company had stopped injections near the well, but neighboring operators continued injections into the pool. As a result, migration pathways along old wells allowed formation fluids to saturate the Earth just under the well-site. Tragically, Taylor fell into a 10-foot diameter crater of 190° fluid and hydrogen sulfide.
High Pressure Steaming
The practice of high pressure steam injection is incredibly similar to hydraulic fracturing, but unfortunately is not regulated under the current rules established by State Bill 4 (SB4). The technique is used to stimulate increased production from “unconventional” target formations such as the Monterey Shale. Steam is injected at high pressures, fracturing shale and other sedimentary rocks. High pressure steam injection both opens new pathways in the source rock and decreases the viscosity of heavy crude, allowing crude to flow more easily to the borehole of the well.
In 2016, the oil and gas industry was able to introduce an exemption in the regulations to allow for the stimulation of wells without an SB4 permit, as long as it was using steam, even when the injection pressure was greater than the fracture gradient of the target formation. For the last three years the practice existed in a legal grey area without any oversight. Then, in July of 2019, Governor Newsom’s administration adopted new underground injection control regulations, which explicitly allowed steam injection at pressures above the fracture gradient of the formation (1724.10.3. Maximum Allowable Surface Injection Pressure). That means operators were essentially “fracking”, but using steam to fracture the targeted shale formation instead of water (hydraulic). With the formal approval of the practice, operators ramped up operations resulting in numerous new surface expressions forming and the flow rates of existing surface expressions increasing.
Governor Newsom’s Response
On November 19, 2019, California Governor Gavin Newsom released a press statement outlining the work his administration is planning to address issues with oil and gas drilling such as surface expressions. Along with two other strategies, the Governor called for an immediate end to high pressure cyclic steaming. This new ban was meant to stop the existing surface expressions in oil fields, and prevent any new ones. Unfortunately, the activities of Chevron and the other operators in these fields are likely to prevent the Governor’s intervention from having the intended impact. These operators are planning to drill many new injection wells in close proximity to the surface expressions, in effect increasing the flow of current surface expressions and increasing the risk of more in the future. From the time of the press release to the end of 2019, oil and gas operators applied for permits authorizing 184 new steam injection wells. The majority of these permits are in the same fields as the surface expressions.
Injection Pressure
The oil and gas industry has blamed the surface expressions entirely on the geology of the oil fields in the southwestern region of Kern, specifically on the brittle diatomite crust that lies above many of Central California’s oil formations. The thing is, diatomite is common throughout the Monterey Shale. In fact, the entire Monterey formation of the Santa Barbara-Ventura coast generally consists of an upper siliceous member (diatomaceous) (Stanford, 2013; Issacs 1981). The risk is not unique to just the Cymric, McKittrick and Midway-Sunset Fields, yet these three fields, along with the Lost Hills field to the north, have the highest counts of reported surface expressions, as shown in the map below in Figure 2.
View map fullscreen | How FracTracker maps work
Figure 2. Map of California well density and surface expressions. The map visualizes California Department of Conservation (CA DOC) data summing surface expressions by oil field. Locations of new injections permit applications submitted since November 19, 2019 are also shown, summed by section.
These fields also have the highest concentration of wells in the state. Surface expressions in the oil fields of western Kern County provide a warning for the rest of the state. Over-development of an oil field is a major contributor to the potential for surface expressions. In the case of the Cymric field, there are simply too many wells drilled in a limited area. This is the reason Chevron shut down injection wells within 1,000’ of the surface expression, but even then the seep did not stop.
The map in Figure 2 shows that the Cymric field has the highest density of active and abandoned oil and gas wells in the state, providing plenty of man-made pathways to the surface. Our analysis shows that there are at least 319 reported wells drilled within 1,000’ of the 1Y surface expression. Another 154 wells are drilled within 1,000’ of the GS5 expression that has been actively flowing since 2003, including 11 active steam injection wells.
Wells in the Cymric field have been drilled in such numbers and in such close proximity that downhole communication between the wells is unavoidable. “Downhole communication” occurs when wells drilled in close proximity leak oil, natural gas and other formation materials between boreholes. This is a dangerous situation, for public health and worker safety. Downhole communication with unknown and known abandoned wells with brittle casings or active wells with poorly engineered casing that shear could even “blow sky high.”
To understand the spatial distribution of oil and gas wells in California, FracTracker used GIS to conduct a hot spot analysis. The parameters included all oil and gas wells in the state of California using California Department of Conservation (CA DOC) data (updated 1/4/20). Results of the analysis are shown in the map in Figure 2. Areas where the analysis showed statistically significant clusters of wells in high density are shown in purple, from low levels of statistical significance to high. Of note, the region with the highest level of statistically significant well density is located along the western side of Kern County. It is in the very same localized area as the eight surface expressions in the Cymric field, and includes the Cymric, McKittrick, and north end of the Midway-Sunset fields.
| Field | New Steam Well Permit Count |
|---|---|
| Midway-Sunset | 427 |
| Cymric | 197 |
| Belridge, South | 150 |
| Kern River | 125 |
| McKittrick | 105 |
| Coalinga | 88 |
| Poso Creek | 71 |
| San Ardo | 69 |
| Kern Front | 43 |
| Lost Hills | 20 |
| Arroyo Grande | 15 |
| Cat Canyon | 10 |
| Edison | 5 |
| Orcutt | 4 |
| Placerita | 1 |
| Grand Total | 1130 |
Table 1. Count of new steam well permits approved in 2019, by field. Data taken from CA DOC Weekly Summary of Permits Data (ftp://ftp.consrv.ca.gov/pub/oil/).
| Operator | New Steam Well Permit Count |
|---|---|
| Aera Energy LLC | 381 |
| Chevron U.S.A Inc. | 360 |
| Berry Petroleum Company, LLC | 276 |
| Sentinel Peak Resources California LLC | 112 |
| E & B Natural Resources Management Corporation | 65 |
| Seneca Resources Management Corporation | 61 |
| California Resources Production Corporation | 46 |
| Vaquero Energy, Inc. | 10 |
| Crimson Resource Management Corp. | 5 |
| Naftex Operating Company | 5 |
| Kern River Holdings, Inc. | 4 |
| Santa Maria Energy, LLC | 4 |
| Grand Total | 1329 |
Table 2. Count of new steam well permits approved in 2019, by operator. Data taken from CA DOC Weekly Summary of Permits Data (ftp://ftp.consrv.ca.gov/pub/oil/).
State’s Response
On November 19, 2019, California Governor Gavin Newsom released a press statement outlining his administration’s plan to address several issues with oil and gas drilling. Among them, the Governor called for an immediate moratorium on issuing new permits for “high pressure cyclic steaming.” This new moratorium was meant curb the rise of surface expressions. Unfortunately the activities of Chevron and the other operators in these fields are likely to undermine the Governor’s action. These operators are planning to drill many new injection wells in close proximity to the surface expressions, in effect increasing the flow of current surface expressions and increasing the risk of more in the future. From the time of the press release to the end of 2019, oil and gas operators applied for permits authorizing 184 new steam injection wells. The majority of these permits are in the same fields as the surface expressions. While the newly implemented moratorium will prevent future permits, permits issued prior to November 19, 2019 remain valid and will continue injecting at high pressure.
The regulatory agency, formerly DOGGR and now CalGEM, has already approved 1,330 new steam injection wells during Governor Newsom’s first year in office; 874 in the Cymric, McKrittrick, and Midway-Sunset fields alone where there are already over 9,300 operating. For summaries of new steam well permits approved in 2019 by field and operator, see Table 1 and 2 below. Even though Chevron stated that they ceased operations within 1,000 feet of the surface expressions (see map in Figure 1), 17 new steam injection wells have been permitted within 1,000 feet in 2019 alone. After the death of David Taylor in 2015, regulators established an 800’ safety buffer zone from that expression, but that safety measure has been ignored for more recent spills. Today, 27 steam injection wells continue to operate and three new permits are being considered within 800’ of the largest 2019 spill. Regulators are now considering permits for an additional 83 new steam injection wells in the same sections of the Cymric oil field closest to these recent surface expressions.
Conclusions and Recommendations
The state’s current solution for reducing surface expressions – a moratorium on high pressure steam injection – is not enough. Chevron and regulators say that it is unclear what exactly is causing the surface expressions, but the data speaks for itself. Too many wells have been drilled in too close proximity. Lowering the injection pressures of individual injection wells alone will not improve the situation if more injection wells are approved into the same formation. Governor Newsom can begin the remediation by stopping the state from permitting new oil and gas wells, banning existing steam injection, and properly plugging and abandoning the leaking wells in these fields. If this is not a priority, California will undoubtedly experience more of these situations, where the density of wells leads to dangerous conditions and increased emissions in more fields, such as the Ventura, Oxnard, and Kern River. It is clear that in addition to high injection pressures, these impacts are the result of over-development via lackadaisical permit reviews and irresponsible environmental policy.
By Kyle Ferrar, MPH, Western Program Coordinator, FracTracker Alliance
Feature Photo by Irfan Khan/LA Times via AP, Pool.
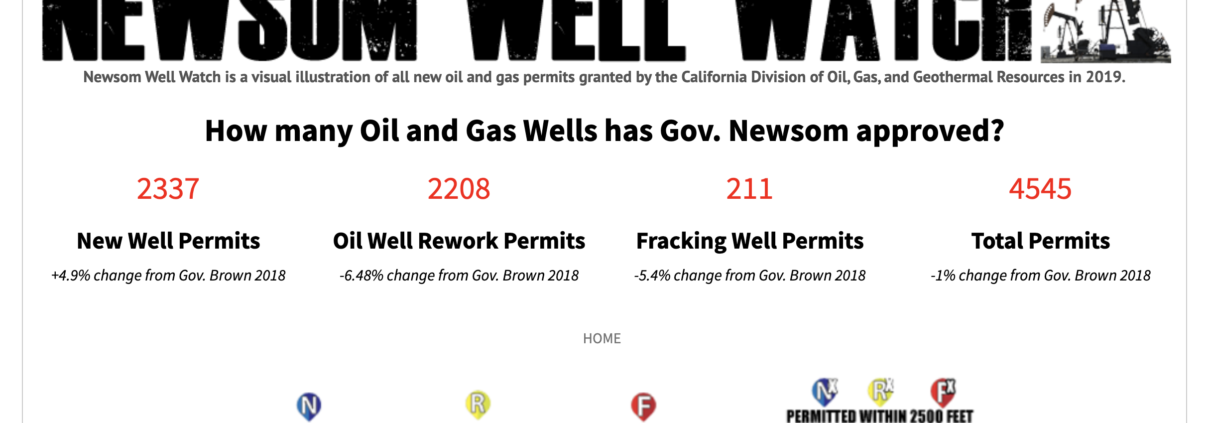

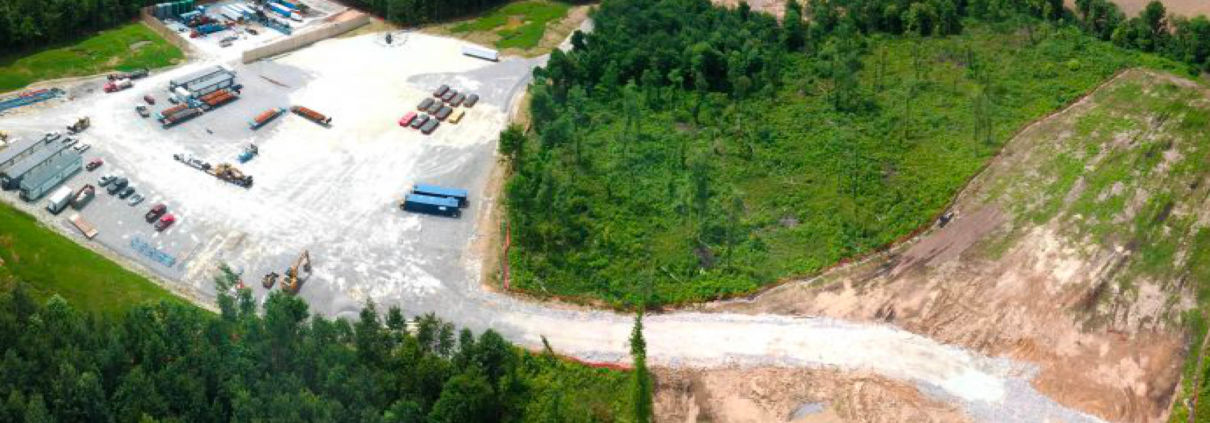
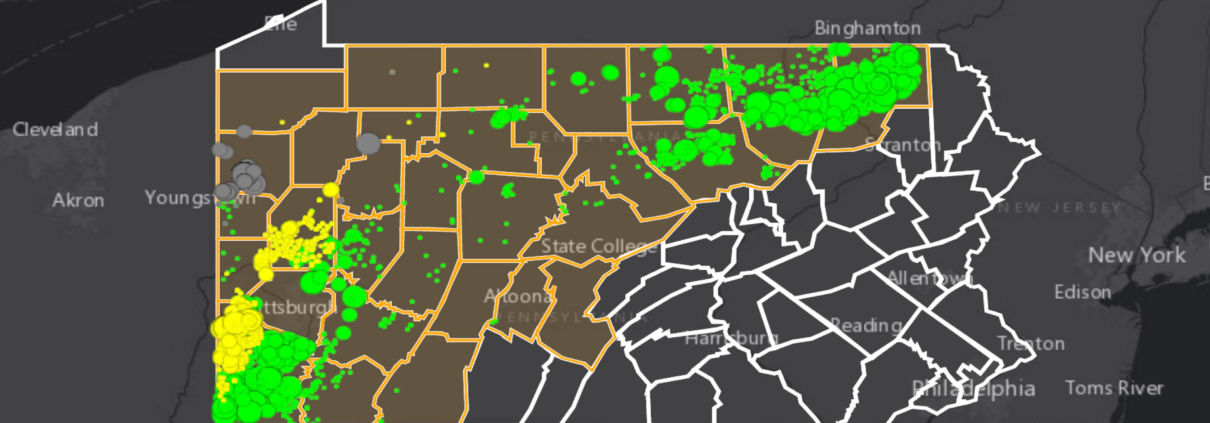
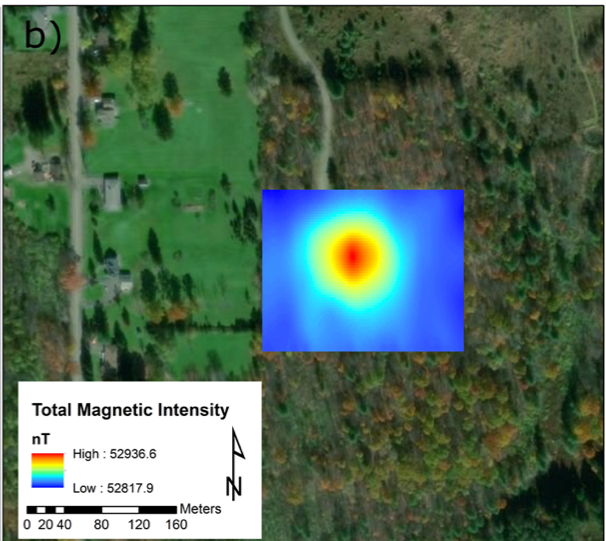
 Photo by Ted Auch, FracTracker Alliance