Rapid Pipeline Development Affecting Pennsylvanians
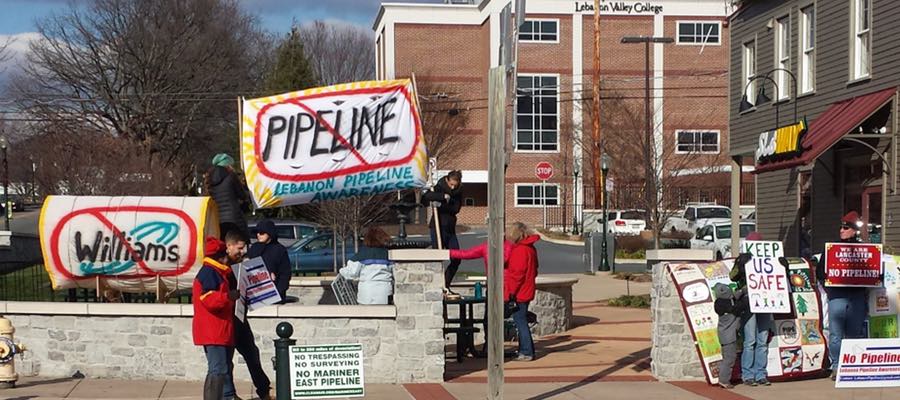
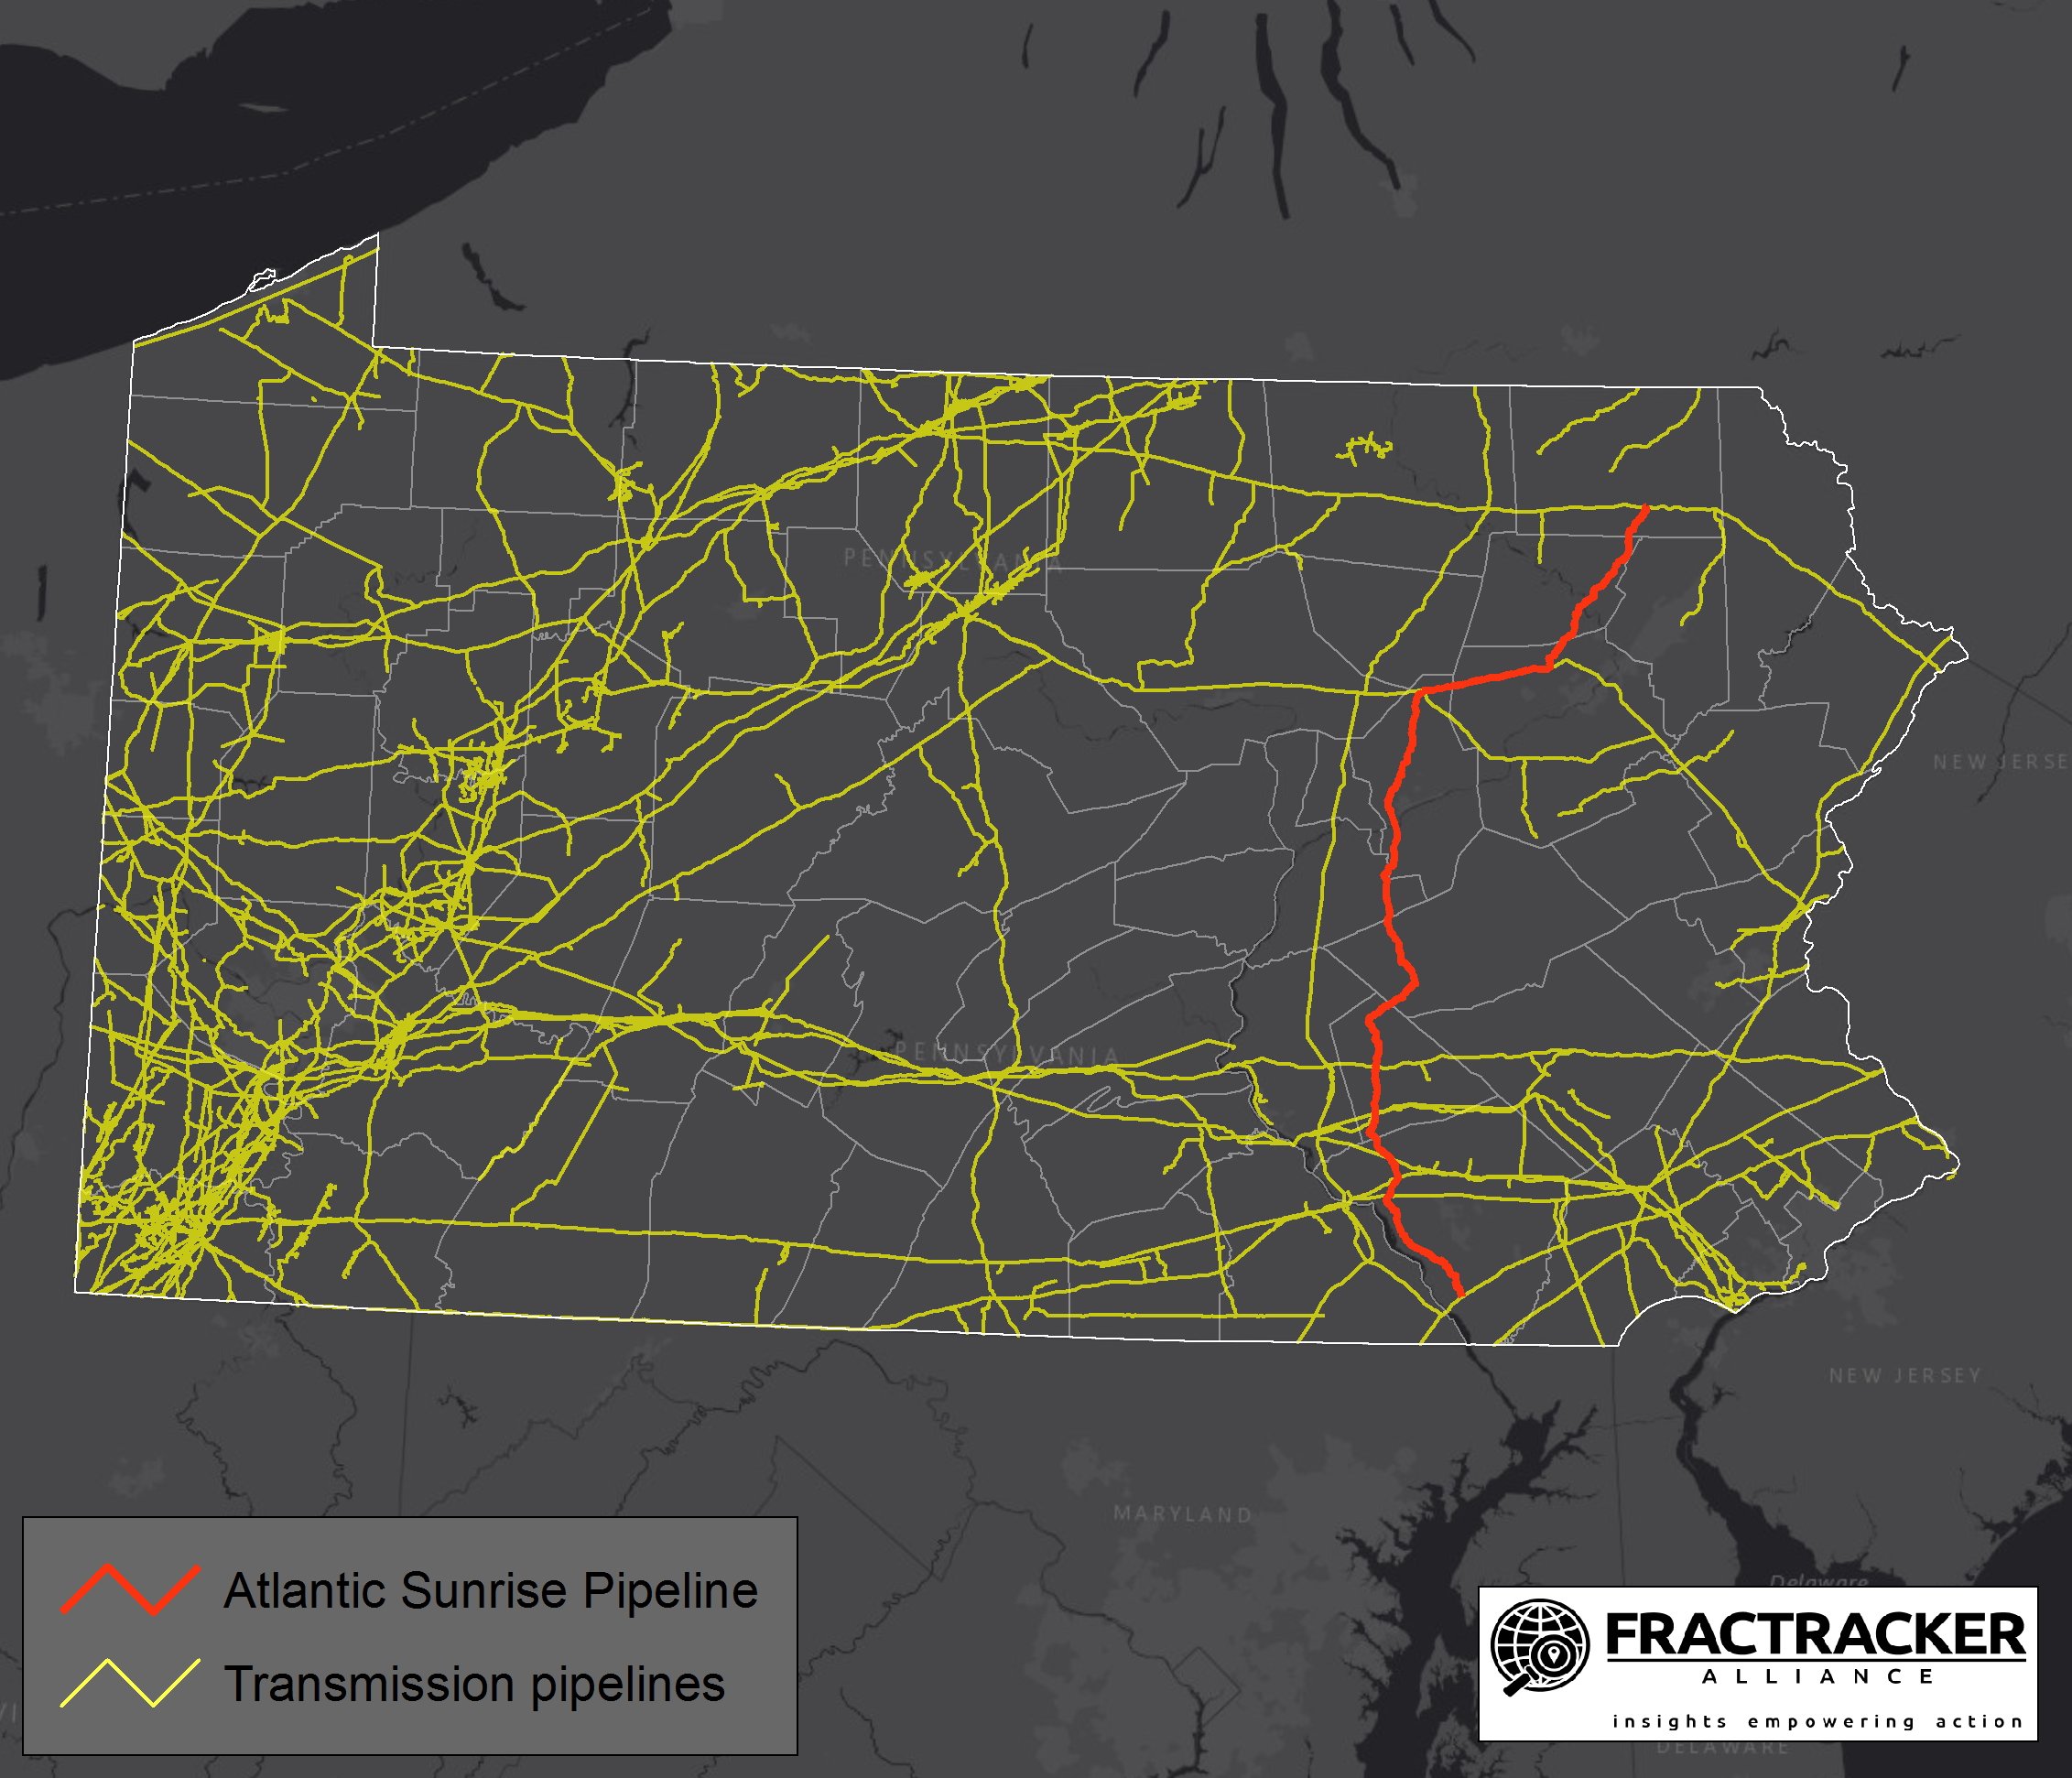
In recent years, Pennsylvanians have had to endure numerous massive pipeline projects in the Commonwealth. Some of these, such as the Mariner East 2, the Revolution, and the Atlantic Sunrise, have been beset with continuous problems. In fact, both the Mariner East 2 and the Revolution projects had their operations suspended in 2018. The operators have struggled to grapple with a variety of issues – ranging from sinkholes near houses, erosion and sediment issues, hundreds of bentonite spills into the waters and upland areas of Pennsylvania, and more.
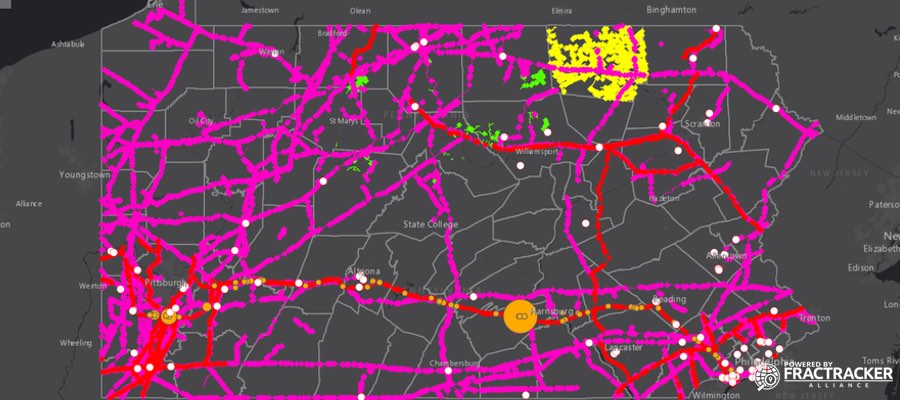
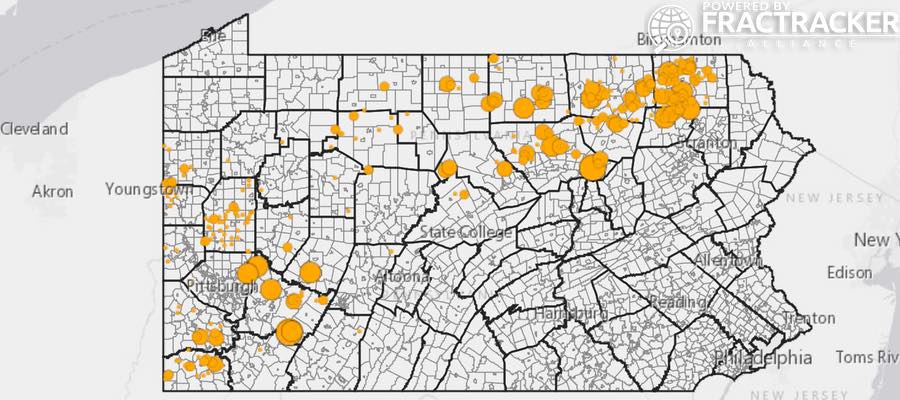
Part of the reason for the recent spate of incidents is the fact that so many pipelines are being built right now. These lines are traversing through undermined areas and land known to have underground karst formations, which are prone to subsidence and sinkholes. With more than 90,000 miles of pipelines and 84,000 miles of streams in Pennsylvania, substantial erosion and runoff issues are unfortunately quite common.
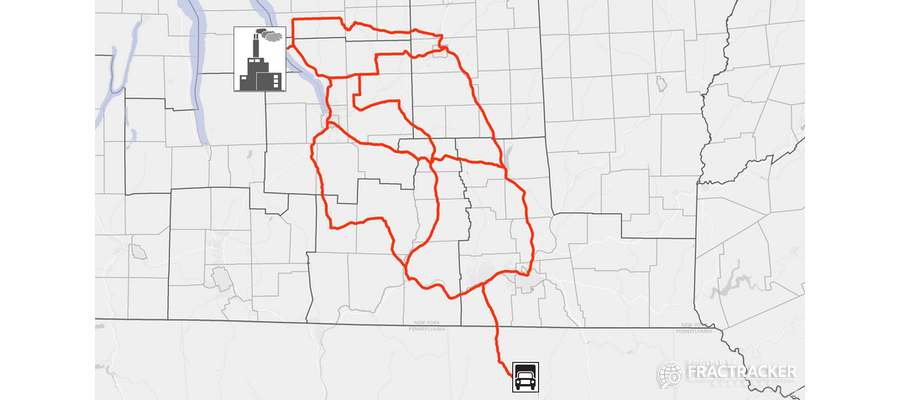
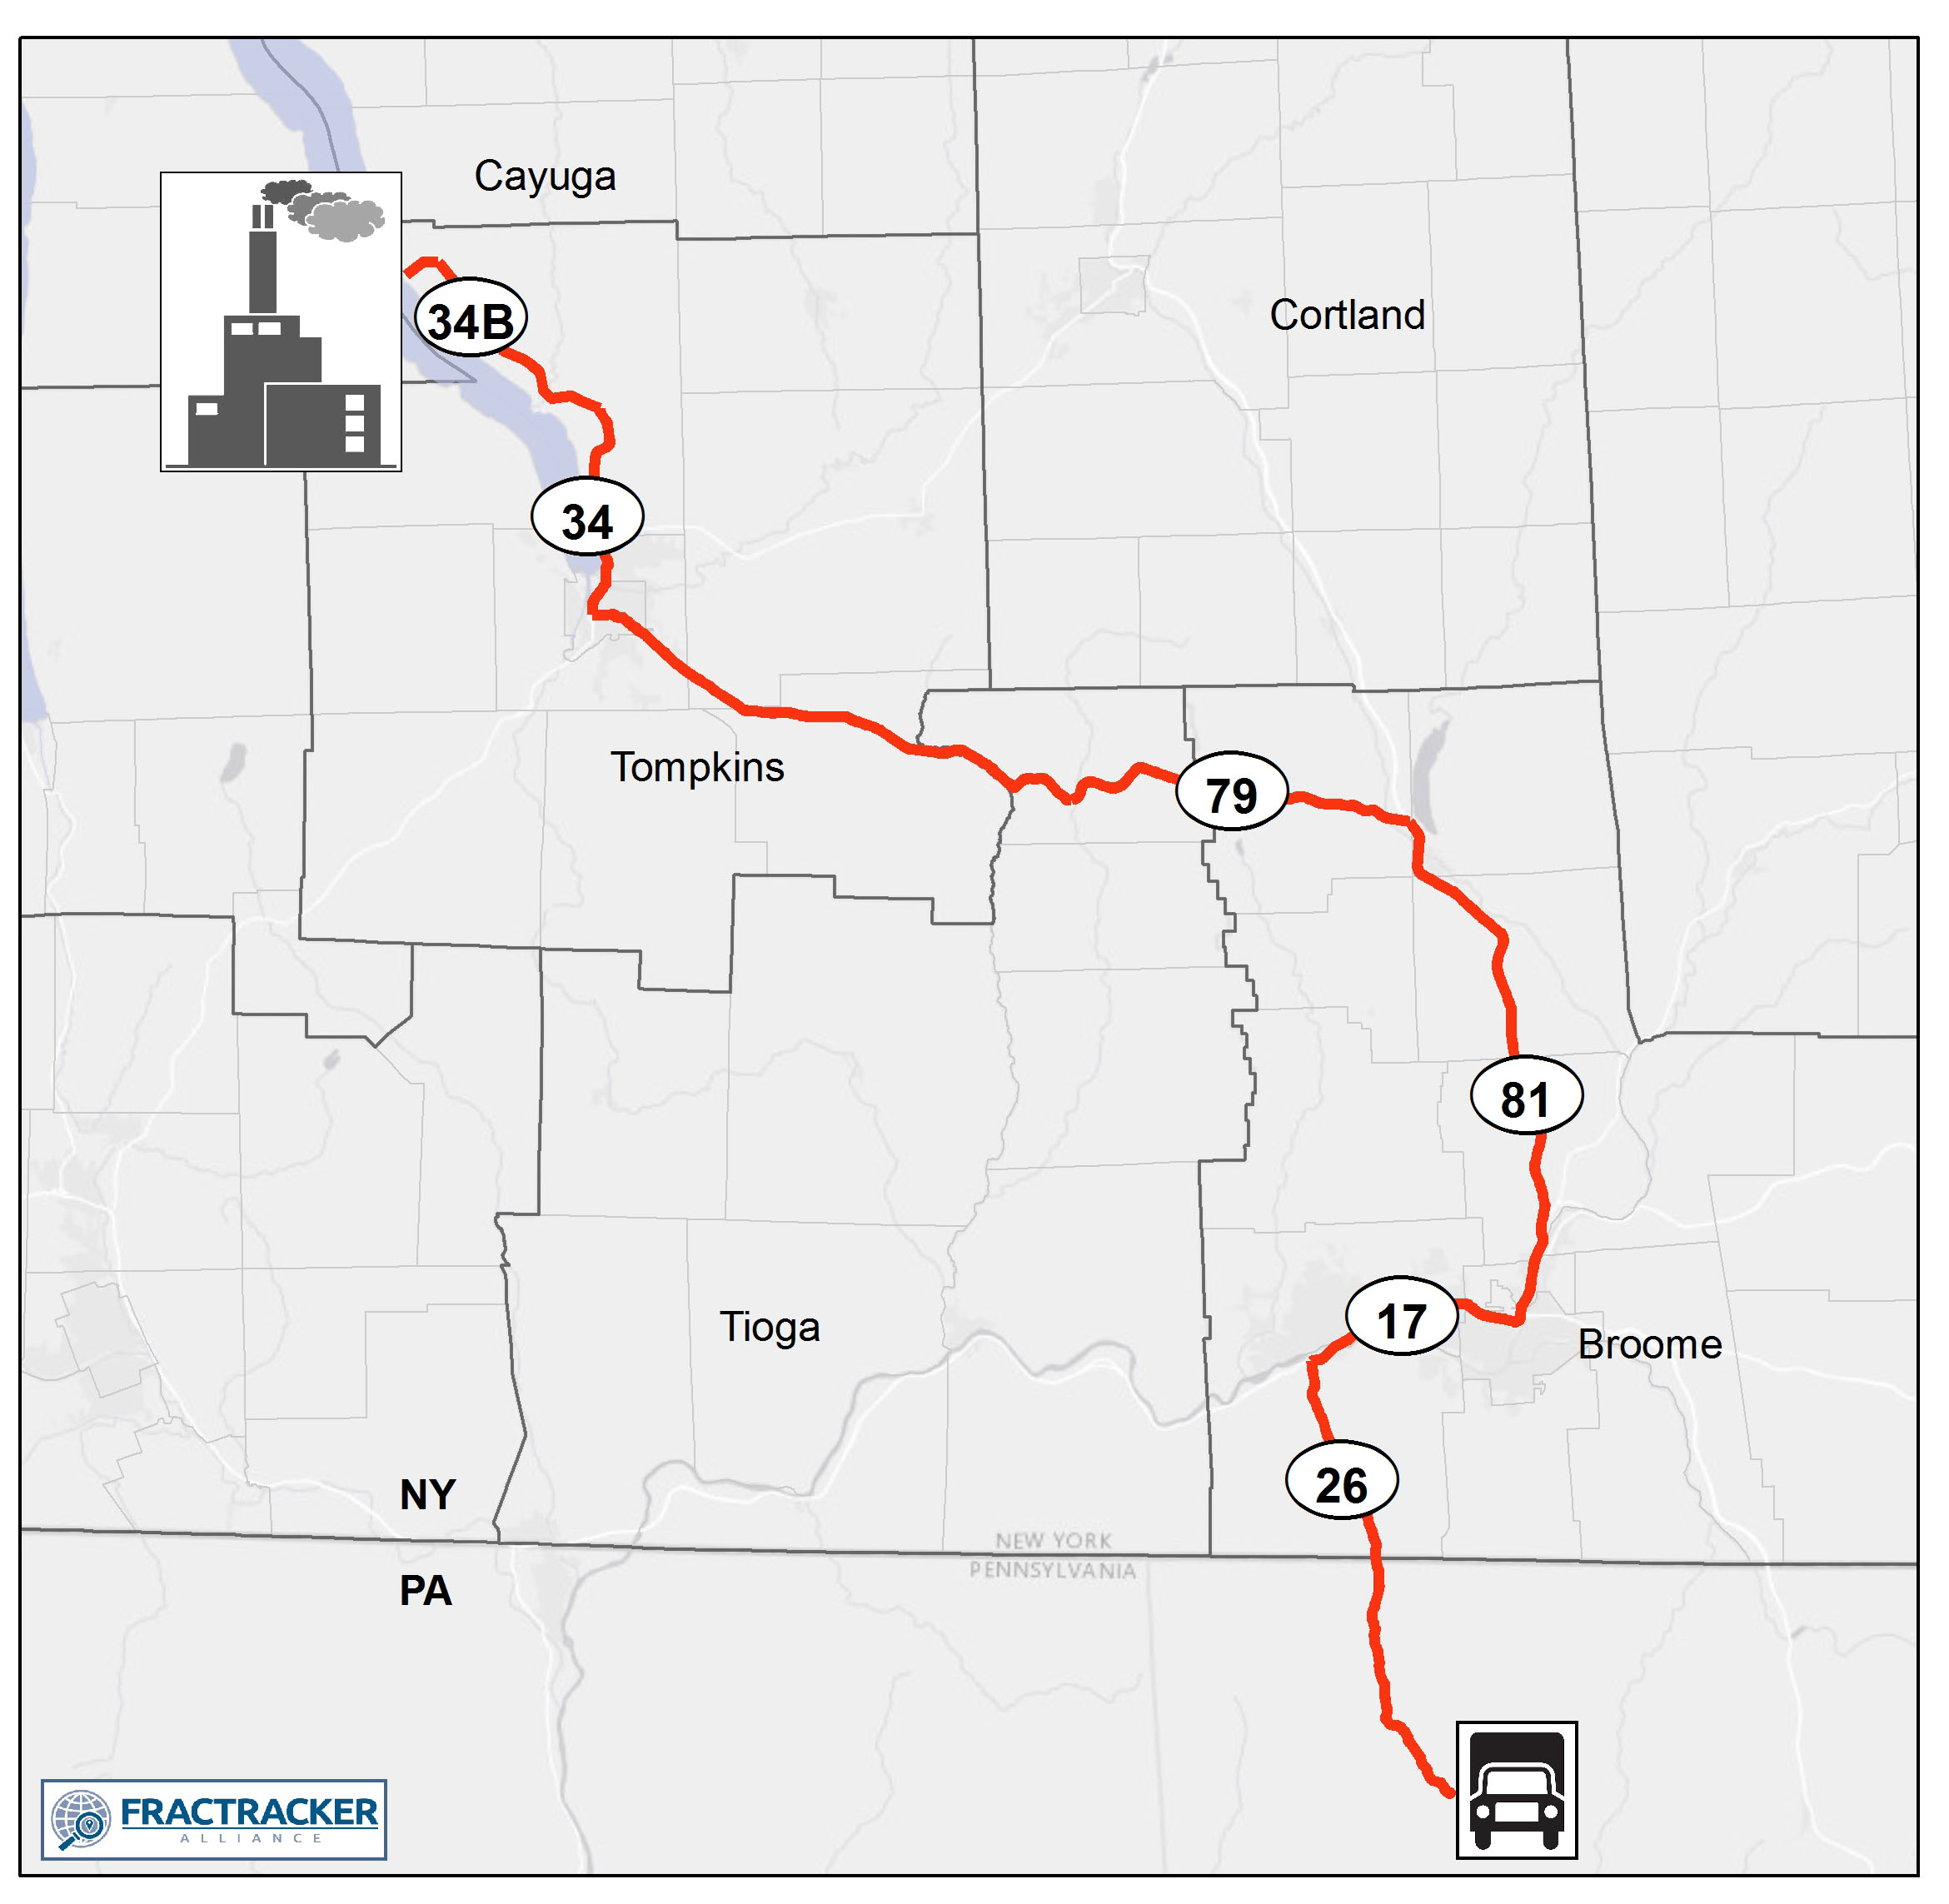
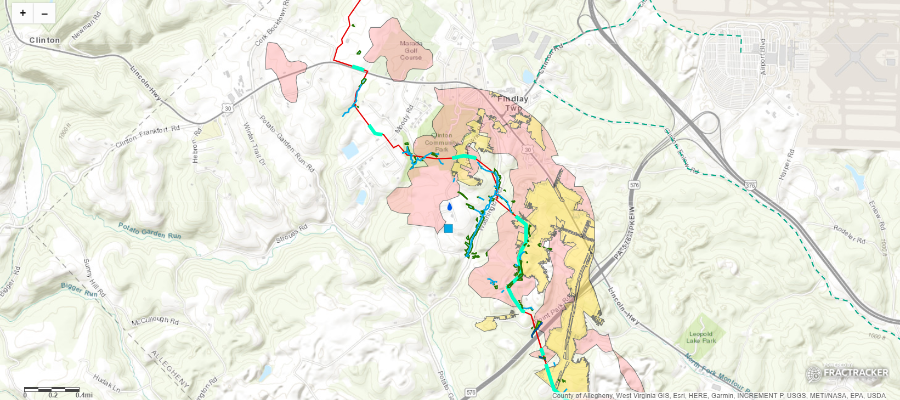
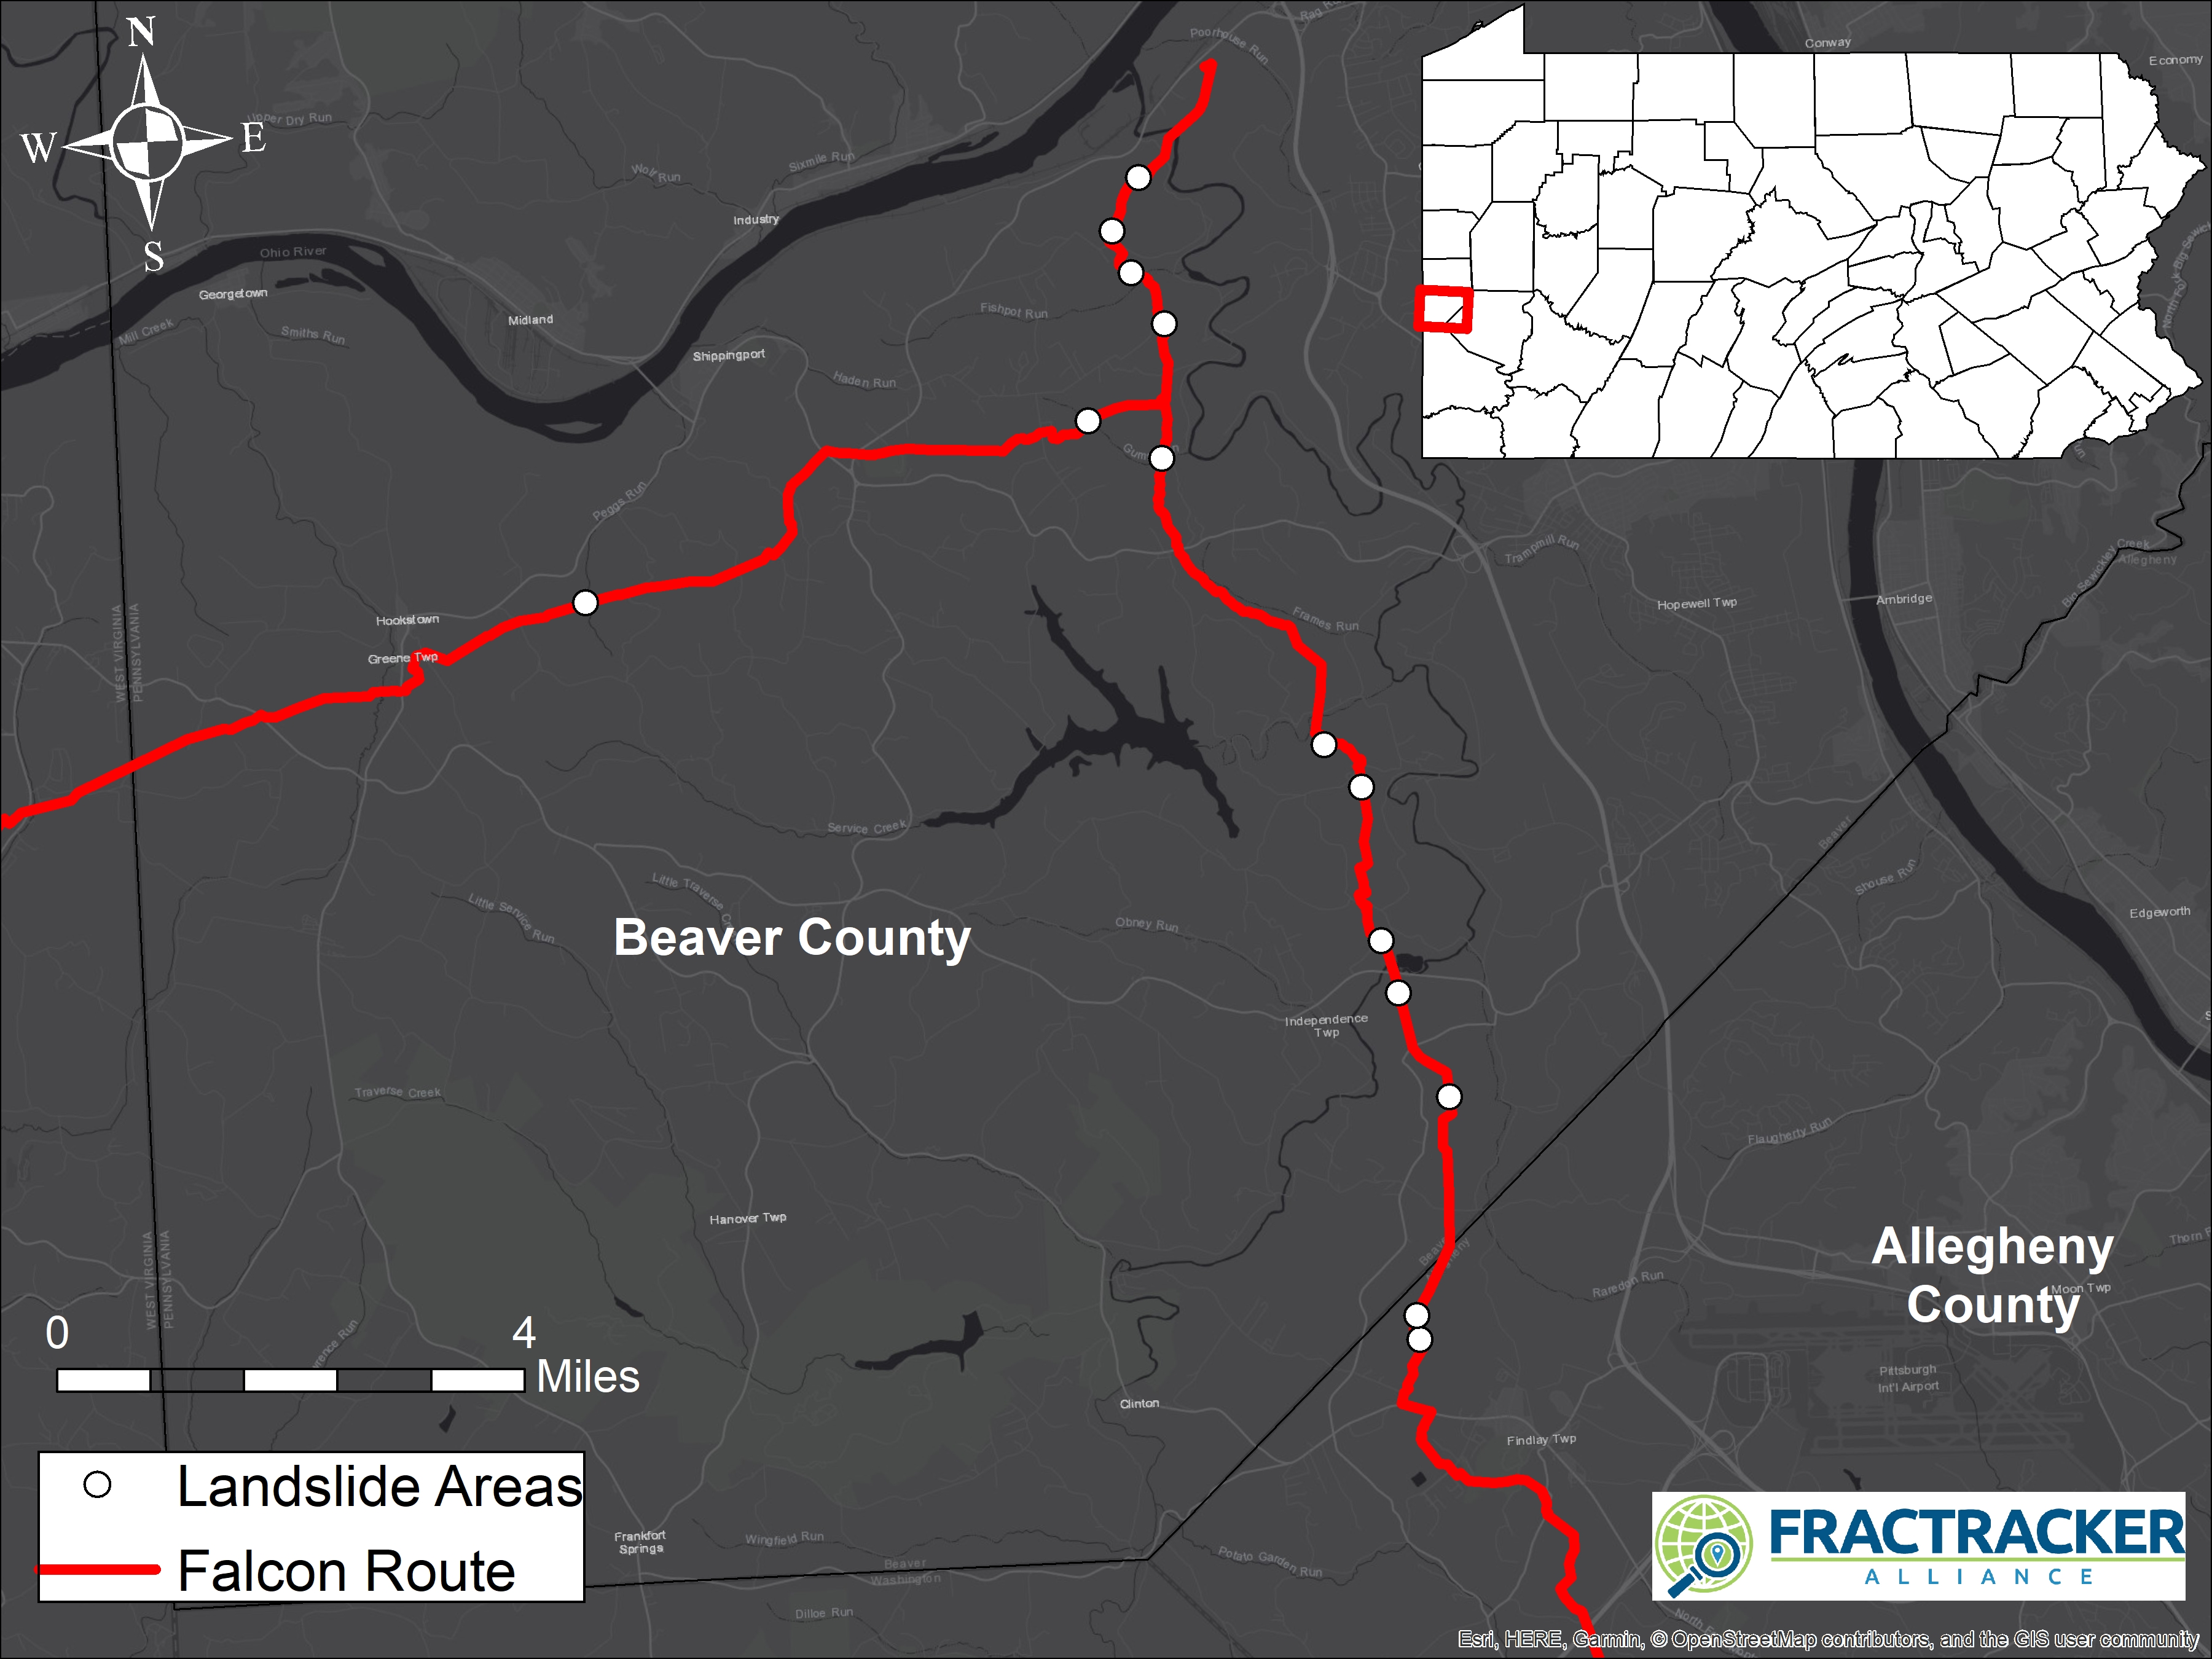
Map of pipeline routes in southwestern PA, various pipeline incidents, and karst formations:
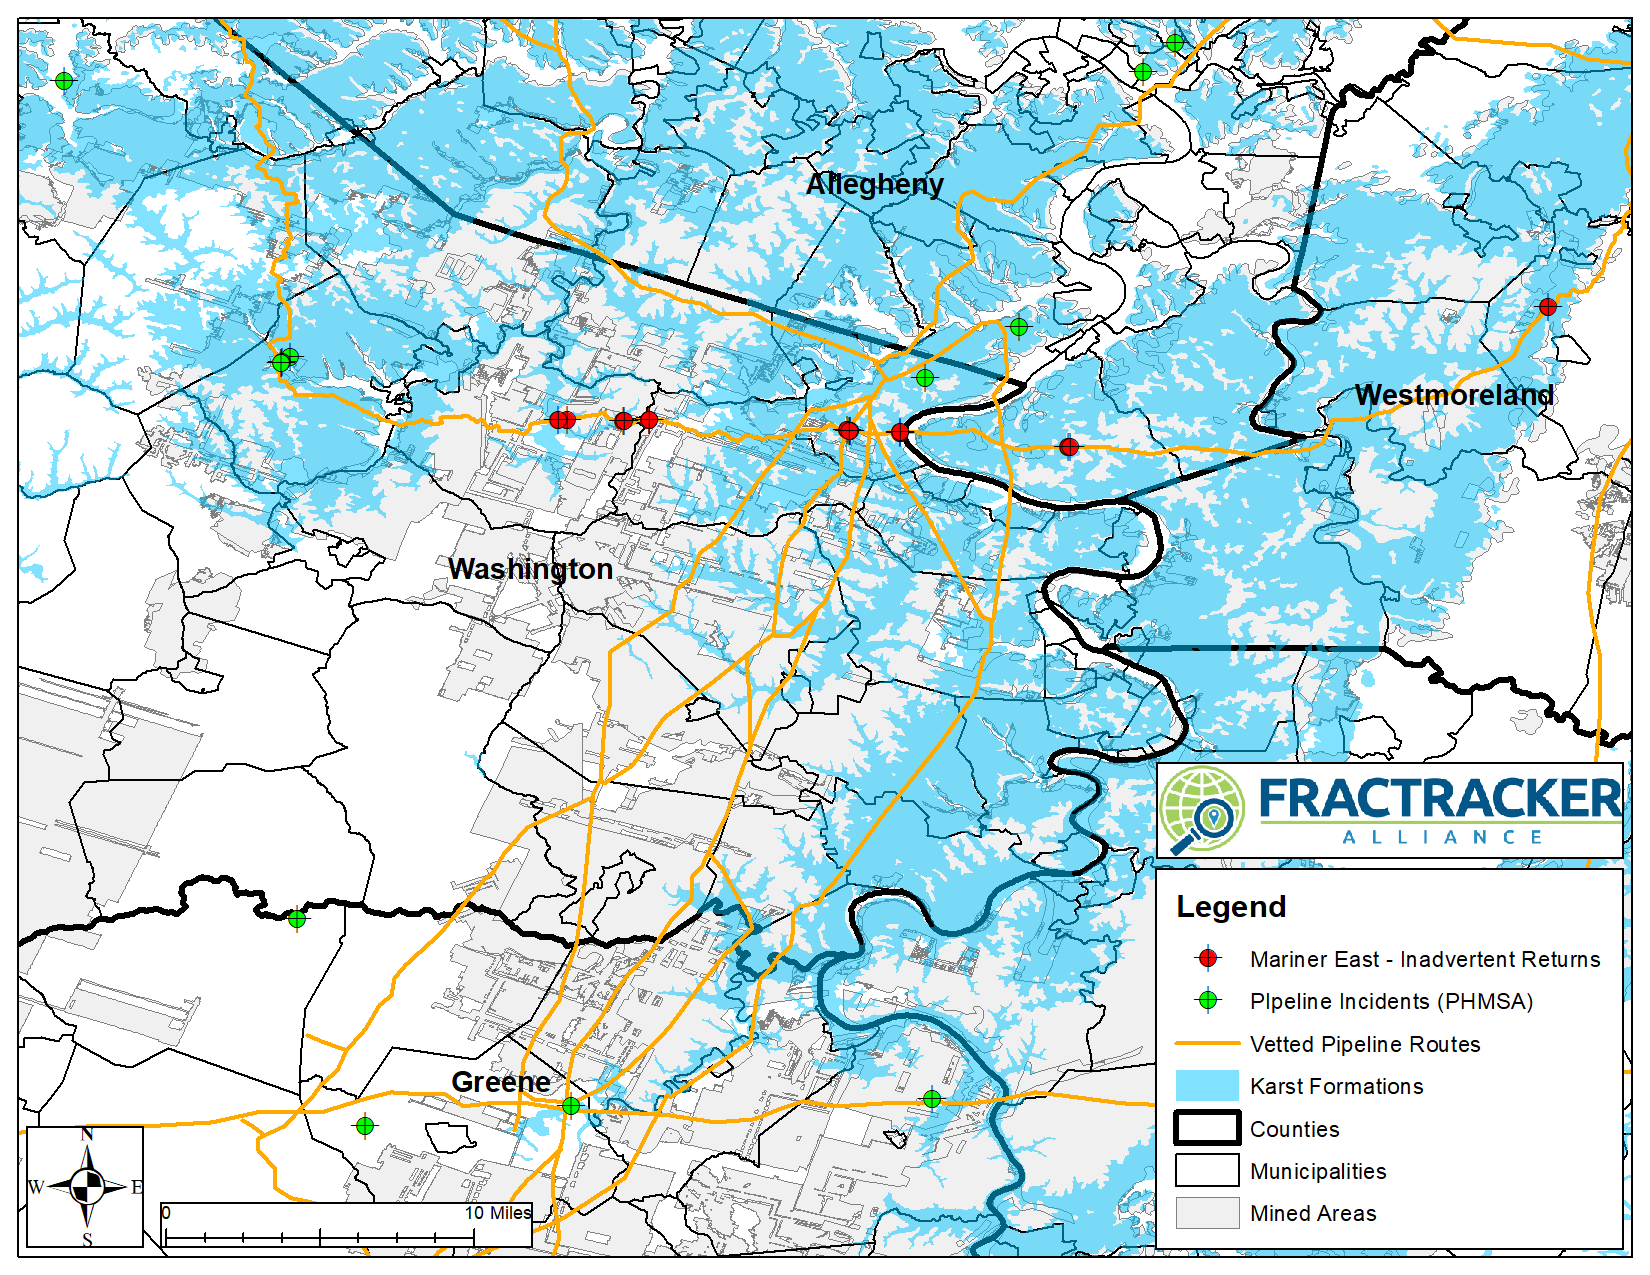
Click here to learn more about recent pipeline incidents in Pennsylvania, along with how users of the FracTracker App have helped to chronicle problems associated with them.
Residents keeping track
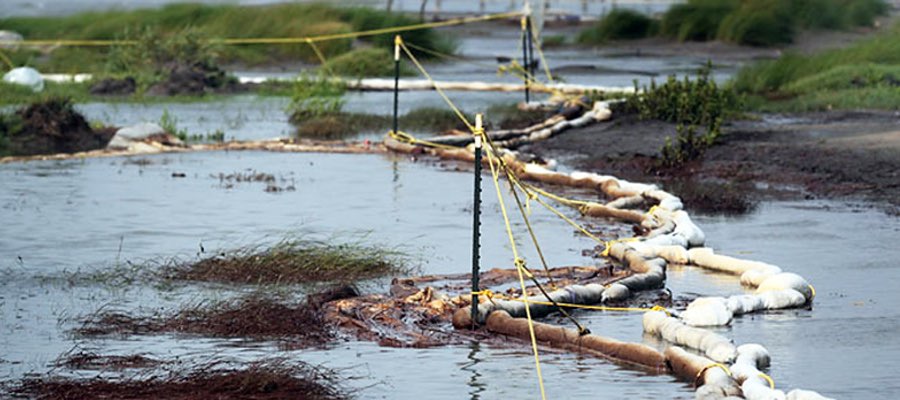
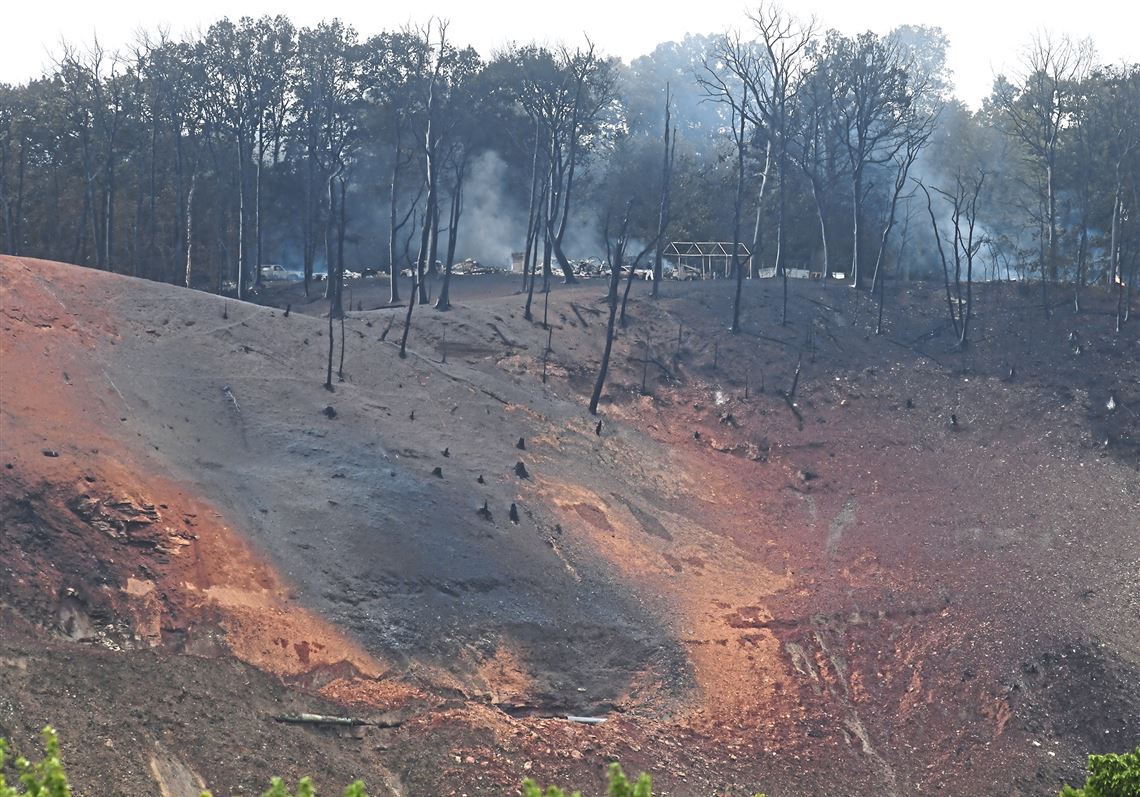
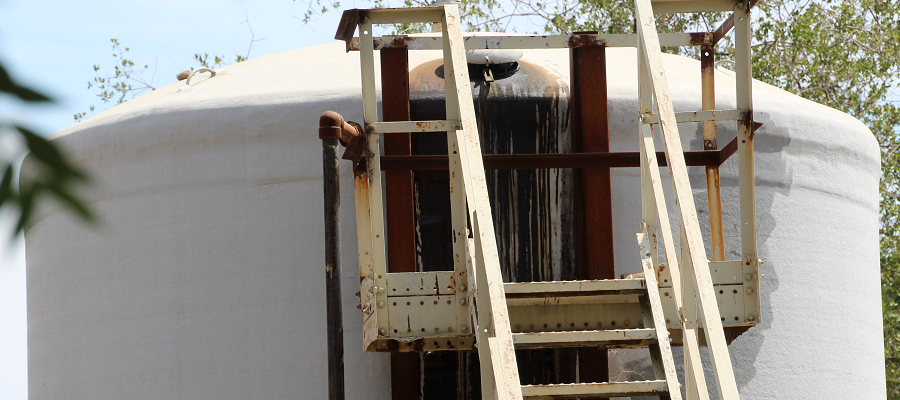
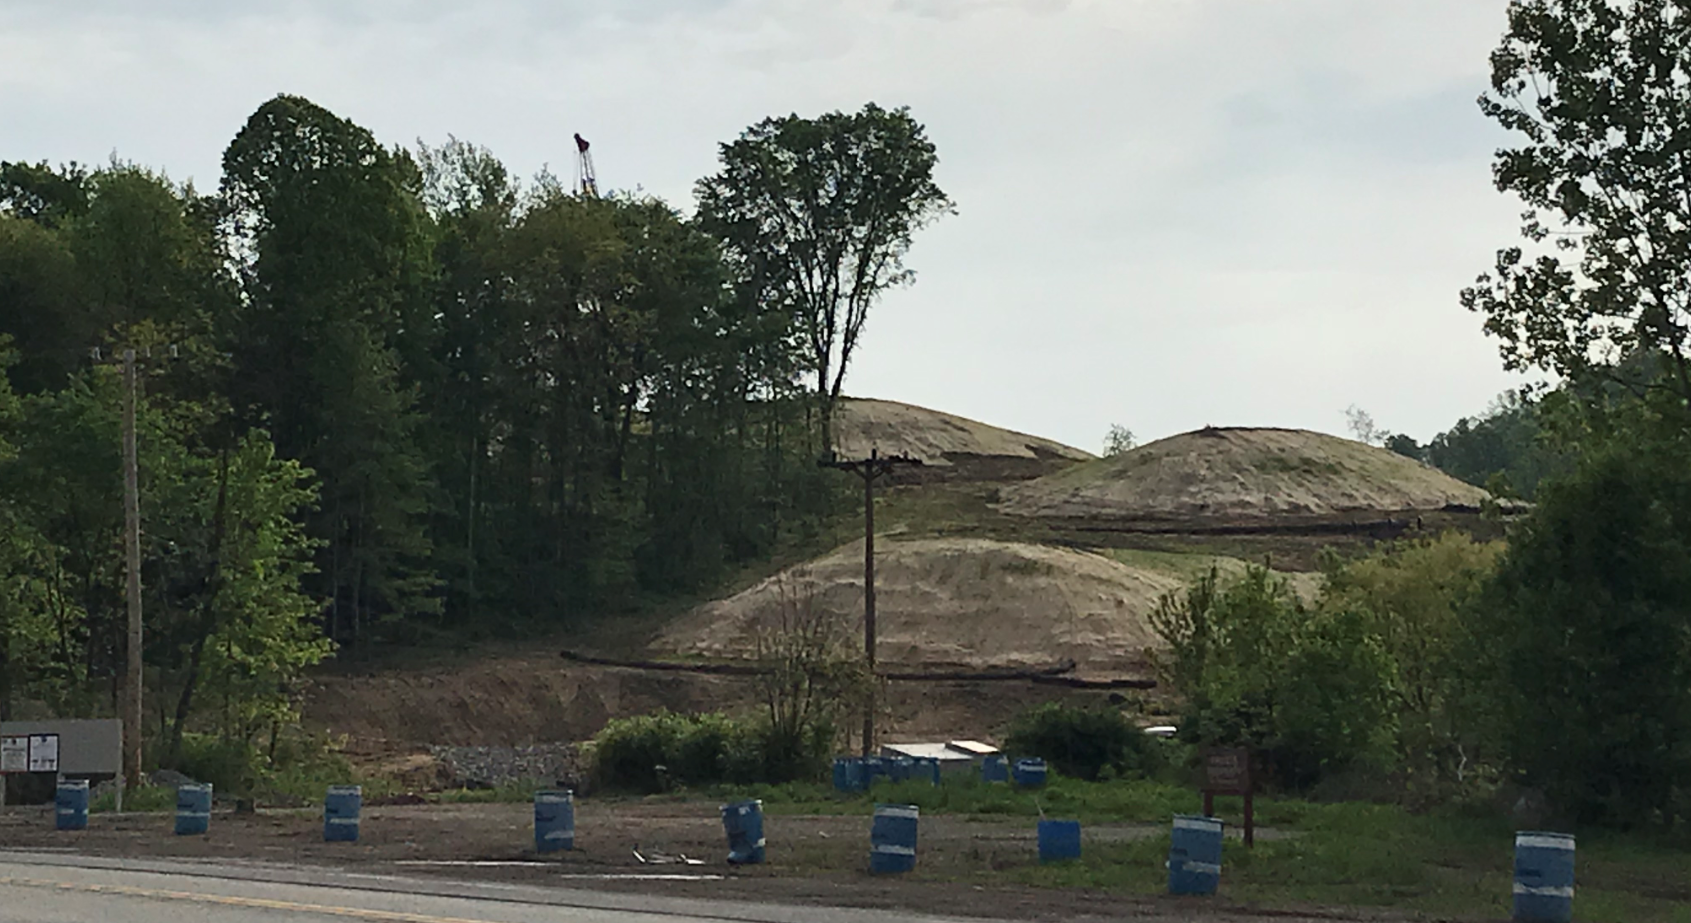
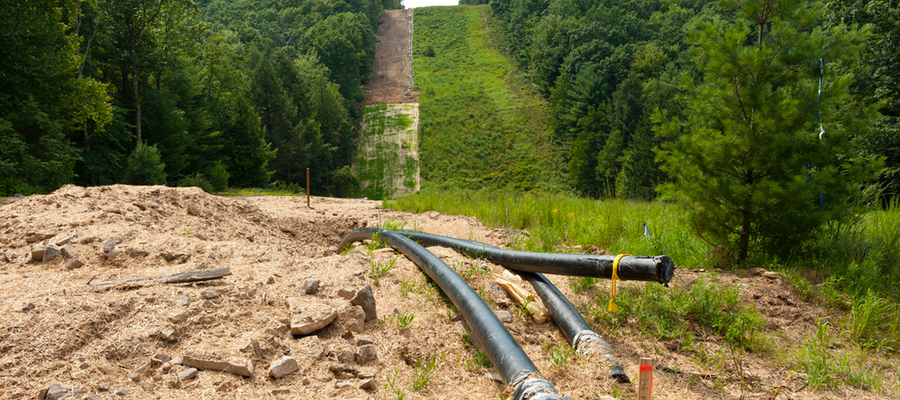
Many residents have been trying to document issues in their region of Pennsylvania for a long time. Any pipeline incident should be reported to the Department of Environmental Protection (DEP), but in some instances, people want other residents to know and see what is going on, and submission to DEP does not allow for that. FracTracker’s Mobile App allow users to submit a detailed report, including photographs, which are shared with the public. App users have submitted more than 50 photographs of pipelines in Pennsylvania, including these images below.


The FracTracker Mobile App uses crowd-sourced data to document and map a notoriously nontransparent industry. App users can also report violations, spills, or whatever they find striking. For example, the first image shows construction of the Mariner East 2 in extreme proximity to high density housing. While regulators did approve this construction, and it is therefore not a violation, the app user wanted others to see the impact to nearby residents. Other photos do show incidents, such as the second photo on the second row, showing the sinkhole that appeared along the Mariner East 1 during the construction of the nearby Mariner East 2 pipeline.
Please note that app submissions are not currently shared with DEP, so if you happen to submit an incident on our app that you think they should know about, please contact their office, as well. The FracTracker Mobile App provides latitude and longitude coordinates to make it easier for regulators to find the issue in question.
Why have there been so many problems with pipelines in recent years?
Drillers in Pennsylvania’s Marcellus Shale and other unconventional formations predicted that they would find a lot of natural gas, and they have been right about that. However, the large resulting supply of natural gas from this industrial-scaled drilling is more than the region can use. As a result, gas prices remain low, making drilling unprofitable in many cases, or keep profit margins very low in others.
The industry’s solution to this has been two-pronged. First, there is a massive effort underway to export the gas to other markets. Although there are already more than 2.5 million miles of natural gas pipelines in the United States, or more than 10 times the distance from the Earth to the Moon, it was apparently an insufficient network to achieve the desired outcome in commodity prices. The long list of recent and proposed pipeline projects, complete with information about their status, can be downloaded from the Energy Information Administration (Excel format).
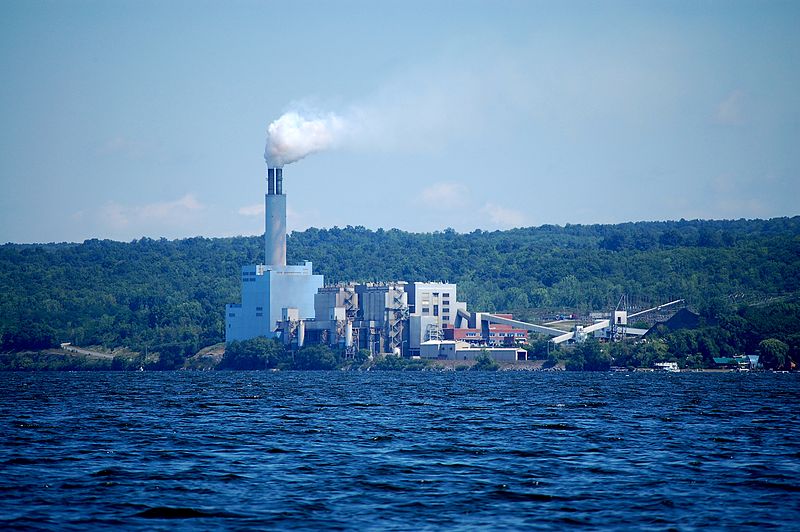
The industry’s other grand effort is to create demand for natural gas liquids (NGLs, mostly ethane, propane, and butane) that accompanies the methane produced in the southwestern portion of the state. The centerpiece of this plan is the construction of multiple ethane crackers, such as the one currently being built in Beaver County by Royal Dutch Shell, for the creation of a new plastics industry in northern Appalachia. These sites will be massive consumers of NGLs which will have to be piped in through pressurized hazardous liquid routes, and would presumably serve to lock in production of unconventional gas in the region for decades to come.
Are regulators doing enough to help prevent these pipeline development problems?
In 2010, the Pipeline and Hazardous Materials Safety Administration (PHMSA) led the formation of an advisory group called Pipelines and Informed Planning Alliance (PIPA), comprised mostly of industry and various state and local officials. Appendix D of their report includes a long list of activities that should not occur in pipeline rights-of-way, from all-terrain vehicle use to orchards to water wells. These activities could impact the structural integrity of the pipeline or impede the operator’s ability to promptly respond to an incident and excavate the pipe.
However, we find this list to be decidedly one-directional. While the document states that these activities should be restricted in the vicinity of pipelines, it does not infer that pipelines shouldn’t be constructed where the activities already occur:
This table should not be interpreted as guidance for the construction of new pipelines amongst existing land uses as they may require different considerations or limitations. Managing land use activities is a challenge for all stakeholders. Land use activities can contribute to the occurrence of a transmission pipeline incident and expose those working or living near a transmission pipeline to harm should an incident occur.
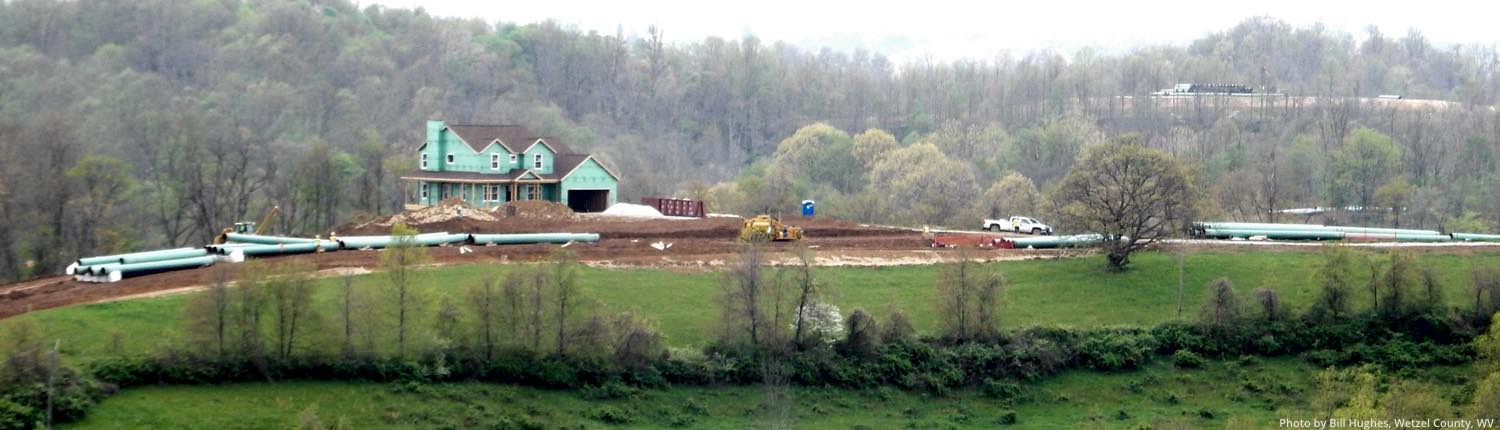
Pipeline being constructed near a home
While we understand the need to be flexible, and we certainly agree that every measure should be taken by those engaging in the dozens of use types listed in the PIPA report, it equally makes sense for the midstream industry to take its own advice, and refrain from building pipelines where these other land uses are already in place, as well. If a carport is disallowed because, “Access for transmission pipeline maintenance, inspection, and repair activities preclude this use,” then what possible excuse can there be to building pipelines adjacent to homes?
What distance is far enough away to escape catastrophic failure in the event of a pipeline fire or blast?
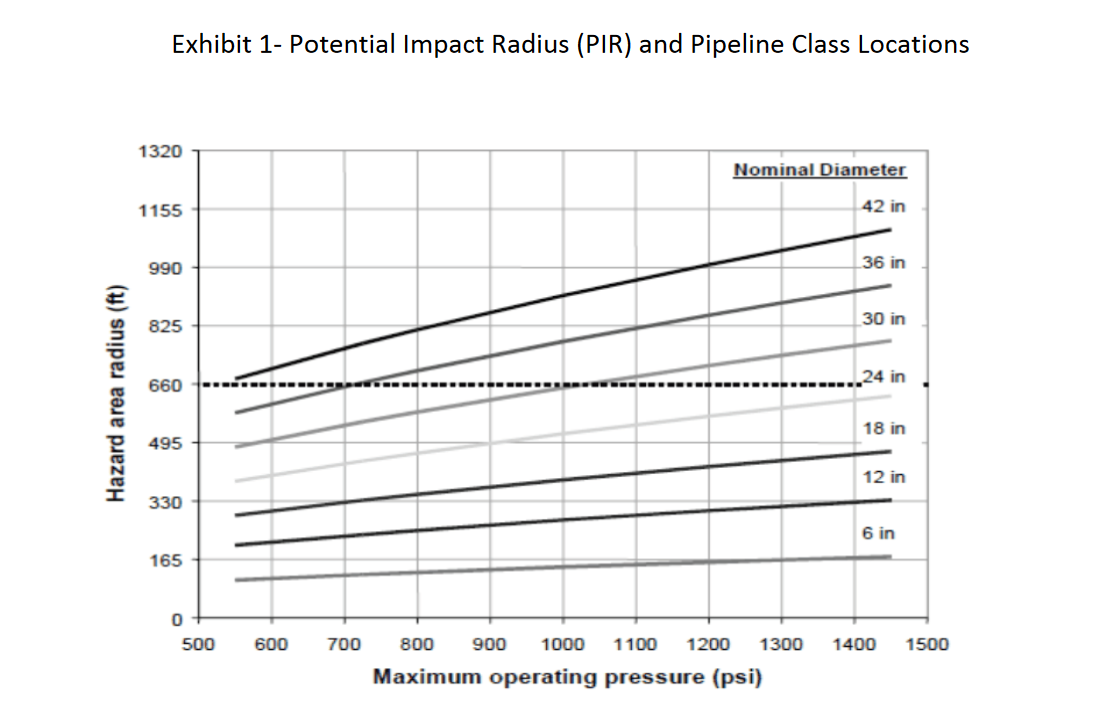
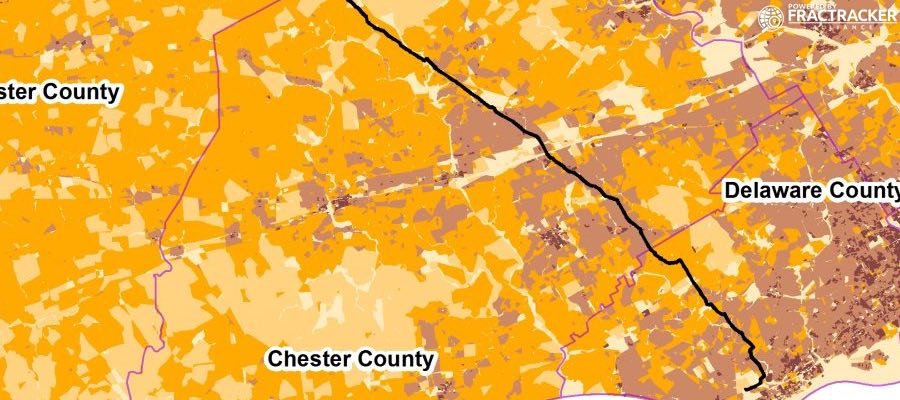
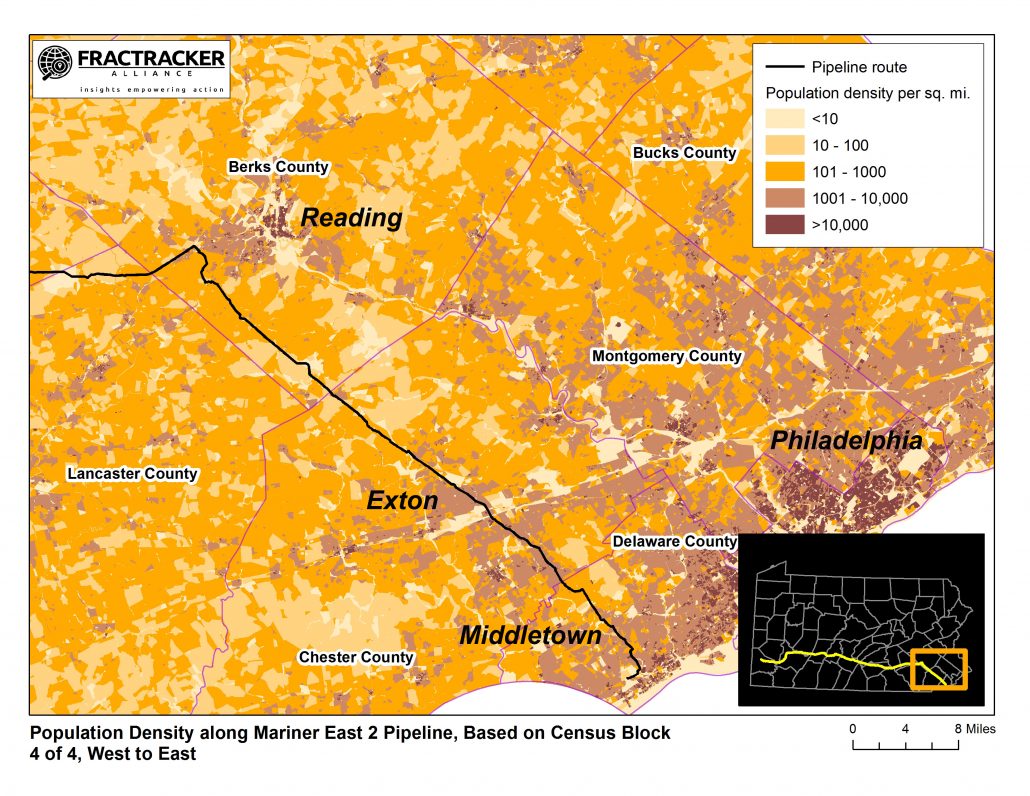
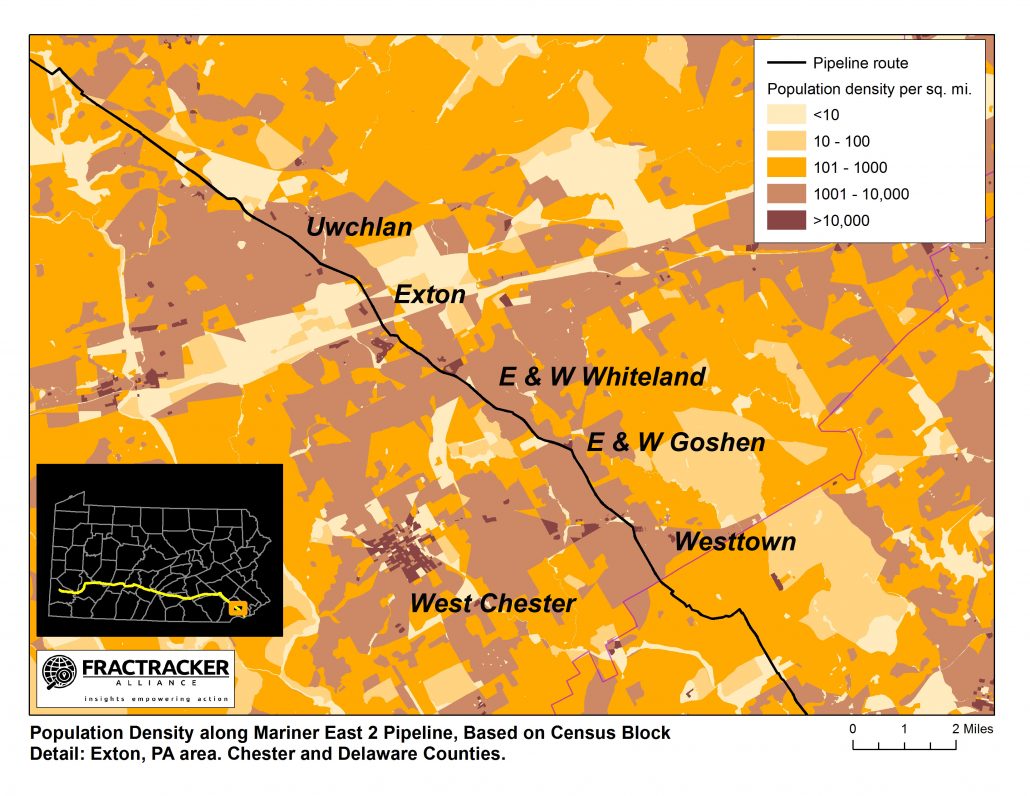
This chart shows varying hazard distances from natural gas pipelines, based on the pipe’s diameter and pressure. Source: Mark J. Stephens, A Model for Sizing High Consequence Areas Associated with Natural Gas Pipelines
It turns out that it depends pretty dramatically on the diameter and pressure of the pipe, as well as the nature of the hydrocarbon being transported. A 2000 report estimates that it could be as little as a 150-foot radius for low-pressure 6-inch pipes carrying methane, whereas a 42-inch pipe at 1,400 pounds per square inch (psi) could be a threat to structures more than 1,000 feet away on either side of the pipeline. There is no way that the general public, or even local officials, could know the hazard zone for something so variable.
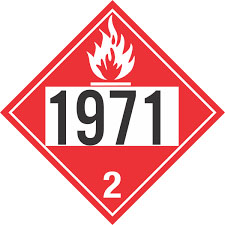
While contacting Pennsylvania One Call before any excavation is required, many people may not consider a large portion of the other use cases outlined in the PIPA document to be a risk, and therefore may not know to contact One Call. To that end, we think that hazard placards would be useful, not just at the placement of the pipeline itself, but along its calculated hazard zone, so that residents are aware of the underlying risks.
Valve spacing
If there is an incident, it is obviously critical for operators to be able to respond as quickly as possible. In most cases, a part of this process will be shutting off the flow at the nearest upstream valve, thereby stopping the flow of the hydrocarbons to the atmosphere in the case of a leak, and cutting the source of fuel in the event of a fire. Speed is only one factor in ameliorating the problem, however, with the spacing between shutoff valves being another important component.
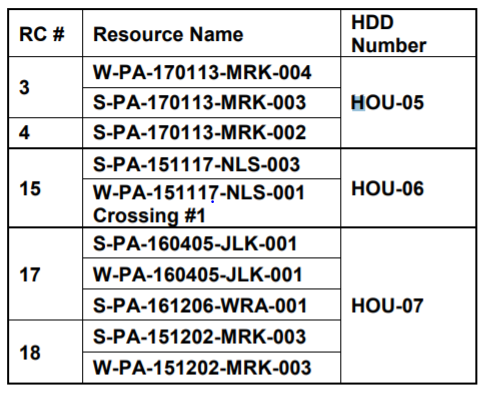
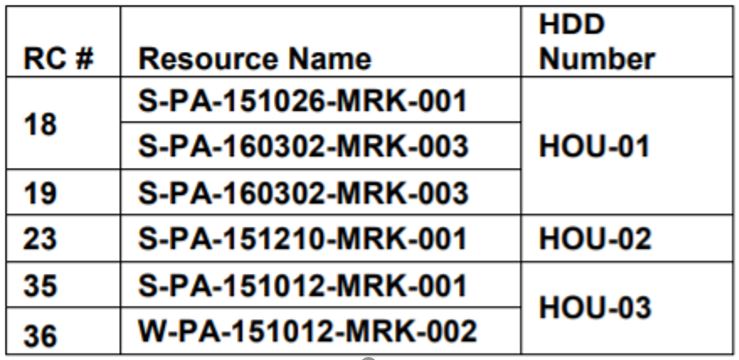
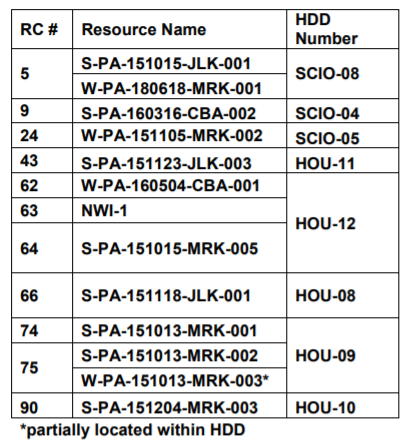
Comprehensive datasets on pipeline valves are difficult to come by, but in FracTracker’s deep dive into the Falcon ethane pipeline project, which is proposed to supply the Shell ethane cracker facility under construction Beaver County, we see that there are 18 shutoff valves planned for the 97.5 mile route, or one per every 5.4 miles of pipe. We also know that the Falcon will operate at a maximum pressure of 1,440 psi, and has pipe diameters ranging from 10 to 16 inches. The amount of ethane that could escape is considerable, even if Shell were able to shut the flow off at the valve instantly. It stands to reason that more shutoff valves would serve to lessen the impact of releases or the severity of fires and explosions, by reducing the flow of fuel to impacted area.
Conclusion
Groups promoting the oil and gas industry like to speak of natural gas development as clean and safe, but unless we are comparing the industry to something else that is dirtier or more dangerous, these words are really just used to provoke an emotional response. Even governmental agencies like PHMSA are using the rhetoric.
PHMSA’s mission is to protect people and the environment by advancing the safe transportation of energy and other hazardous materials that are essential to our daily lives.
If the safe transportation of hazardous materials sounds oxymoronic, it should. Oil and gas, and related processed hydrocarbons, are inherently dangerous and polluting.
| Report | Events | Fatalities | Injuries | Explosions | Evacuees | Total Damages |
| Gas Distribution | 29 | 8 | 19 | 12 | 778 | $6,769,061 |
| Gas Transmission / Gathering | 30 | 0 | 2 | 2 | 292 | $51,048,027 |
| Hazardous Liquids | 49 | 0 | 0 | 1 | 48 | $9,115,036 |
| Grand Total | 108 | 8 | 21 | 15 | 1,118 | $66,932,124 |
Impacts of pipeline incidents in Pennsylvania from January 1, 2010 through July 13, 2018. National totals for the same time include 5,308 incidents resulting 125 fatalities, 550 injuries, 283 explosions, and nearly $4 billion in property damage.
Current investments in large-scale transmission pipelines and those facilitating massive petrochemical facilities like ethane crackers are designed to lock Pennsylvania into decades of exposure to this hazardous industry, which will not only adversely the environment and the people who live here, but keep us stuck on old technology. Innovations in renewable energy such as solar and wind will continue, and Pennsylvania’s impressive research and manufacturing capacity could make us well positioned to be a leader of that energy transformation. But Pennsylvania needs to make that decision, and cease being champions of an industry that is hurting us.
By Matt Kelso, Manager of Data and Technology
This is the second article in a two-part series. Explore the first article: PA Pipelines and Pollution Events.