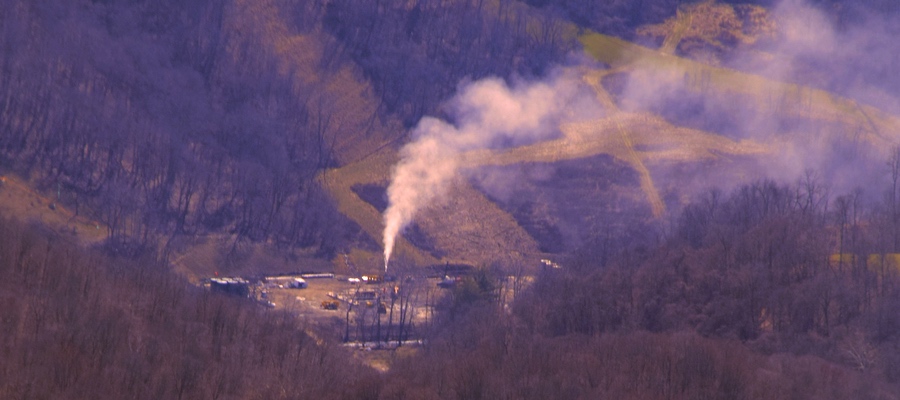
On February 15, 2018, officials evacuated residents after XTO Energy’s Schnegg gas well near Captina Creek exploded in the Powhatan Point area of Belmont County, Ohio. More than two weeks later, the well’s subsequent blowout has yet to be capped, and people want to know why. Here is what we know based on various reports, our Ohio oil and gas map, and our own fly-by on March 5th.
March 19th Update: This is footage of the Powhatan Point XTO Well Pad Explosion Footage from Ohio State Highway Patrol’s helicopter camera the day after the incident:
Powhatan Point XTO well pad explosion footage from Ohio State Highway Patrol
Cause of the Explosion
The well pad hosts three wells, one large Utica formation well, and two smaller ones. XTO’s representative stated that the large Utica well was being brought into production when the explosion occurred. The shut-off valves for the other two wells were immediately triggered, but the explosion caused a crane to fall on one of those wells. The representative claims that no gas escaped that well or the unaffected well.
Observers reported hearing a natural gas hiss and rumbling, as well as seeing smoke. The Powhatan Point Fire Chief reported that originally there was no fire, but that one later developed on the well pad. To make matters worse, reports later indicated that responders are/were dealing with emergency flooding on site, as well.
As of today, the Utica well that initially exploded is still releasing raw gas.
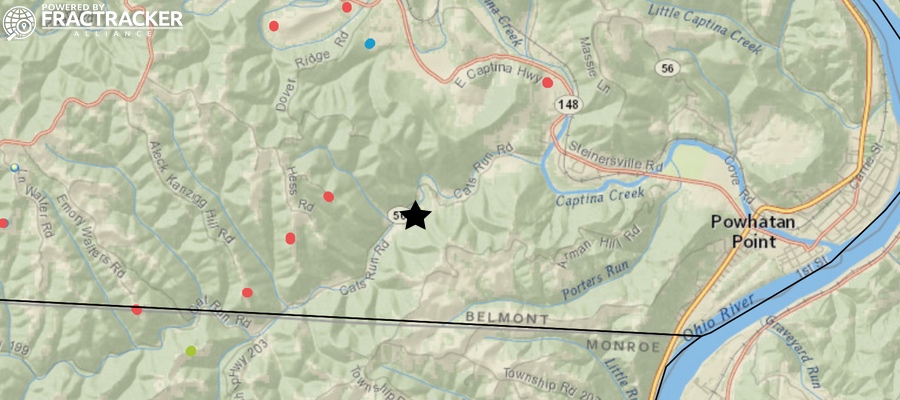
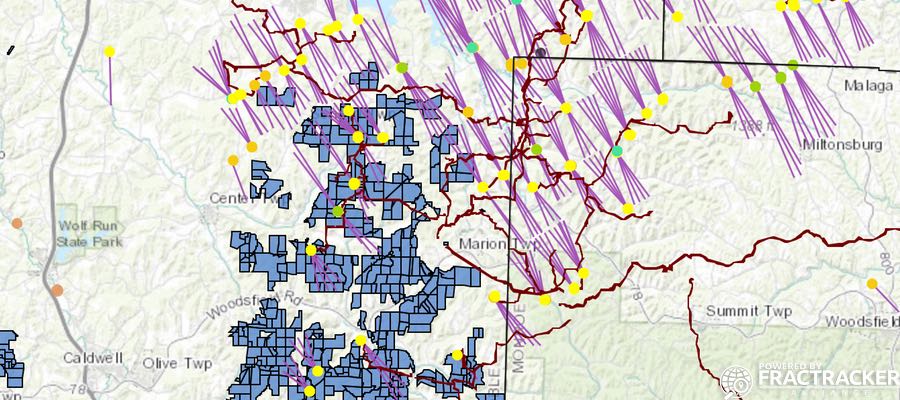
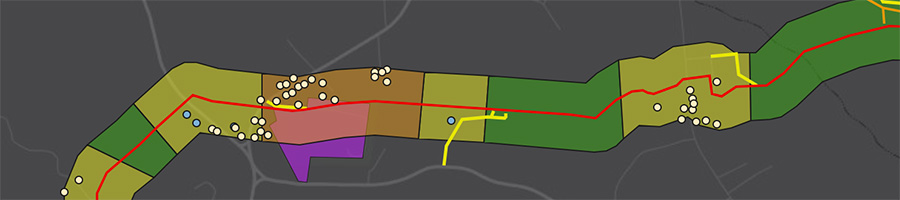
Map of drilling operations in southeast Ohio, with the Feb 15, 2018 explosion on XTO Energy’s Schnegg gas well pad marked with a star. View dynamic map
Public Health and Safety
No injuries were reported after the incident. First responders from all over the country are said to have been called in, though the mitigation team is not allowed to work at night for safety reasons.
The evacuation zone is for any non-responders within a 1-mile radius of the site, which is located on Cat’s Run Road near State Route 148. Thirty (30) homes were originally evacuated within the 1-mile zone according to news reports, but recently residents within the outer half-mile of the zone were cleared to return – though some have elected to stay away until the issue is resolved completely. As of March 1, four homes within ½ mile of the well pad remain off limits.
The EPA conducted a number of site assessments right after the incident, including air and water monitoring. See here and here for their initial reports from February 17th and 20th, respectively. (Many thanks to the Ohio Environmental Council for sharing those documents.)
Much of the site’s damaged equipment has been removed. Access roads to the pad have been reinforced. A bridge was recently delivered to be installed over Cats Run Creek, so as to create an additional entrance and exit from the site, speaking to the challenges faced in drilling in rural areas. A portion of the crane that fell on the adjacent wellhead has been removed, and workers are continuing their efforts in removing the rest of the crane.
The above video by Earthworks is optical gas imaging that makes visible what is normally invisible pollution from XTO’s Powhatan Point well disaster. The video was taken on March 3, 2018, almost 3 weeks after the accident that started the uncontrolled release. Learn more about Earthworks’ video and what FLIR videos show.
An early estimate for the rate of raw gas being released from this well is 100 million cubic feet/day – more than the daily rate of the infamous Aliso Canyon natural gas leak in 2015/16. Unfortunately, little public information has been provided about why the well has yet to be capped or how much gas has been released to date.
Bird’s Eye View
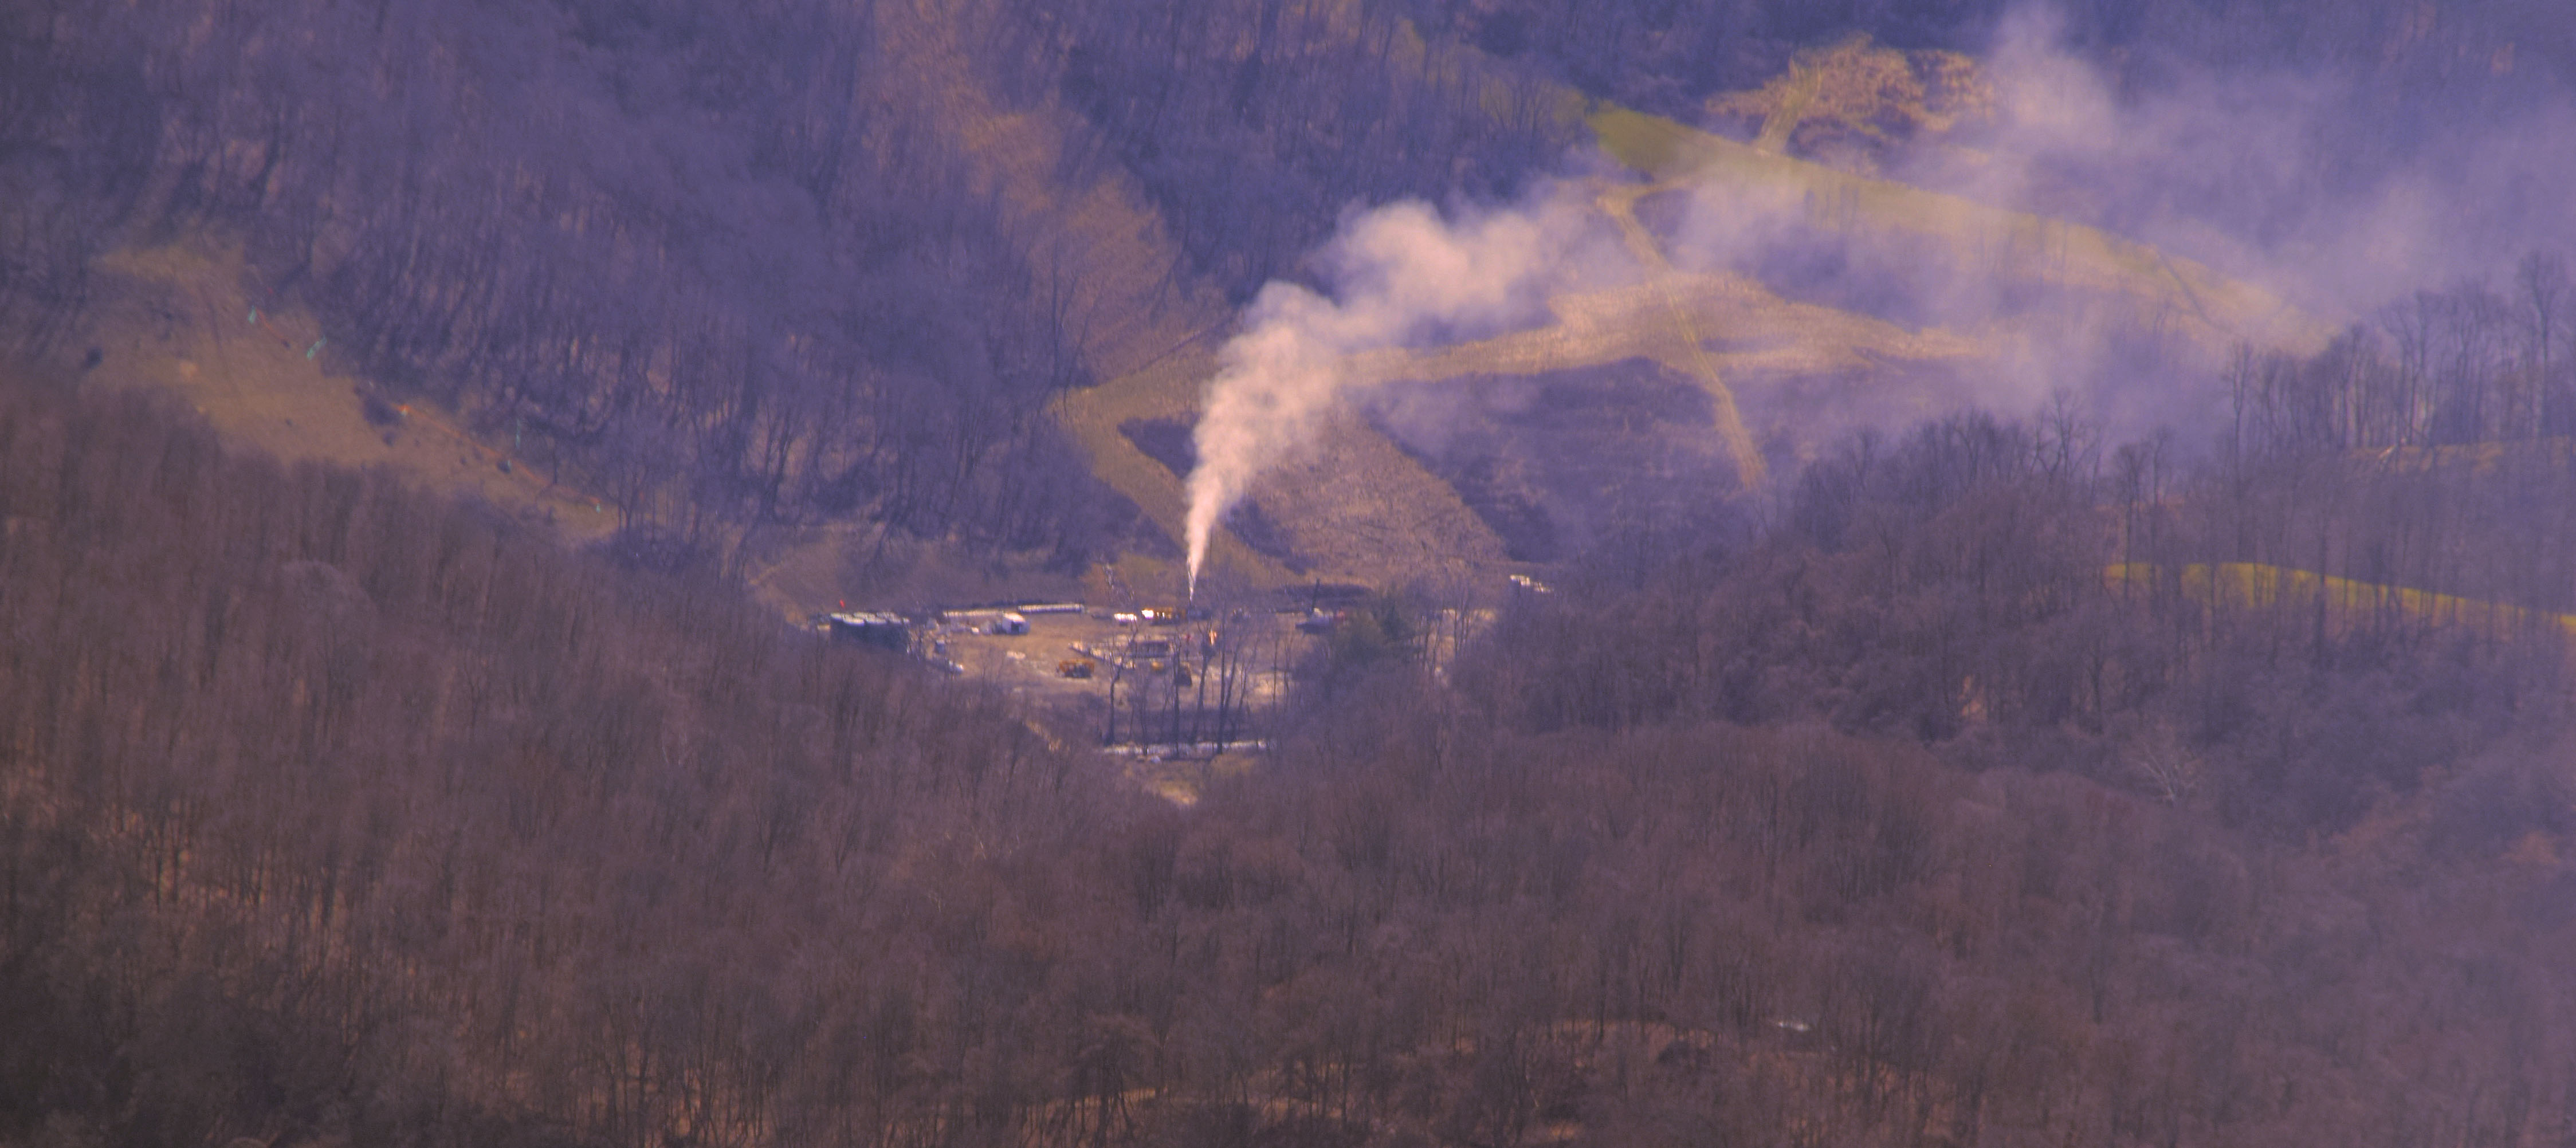
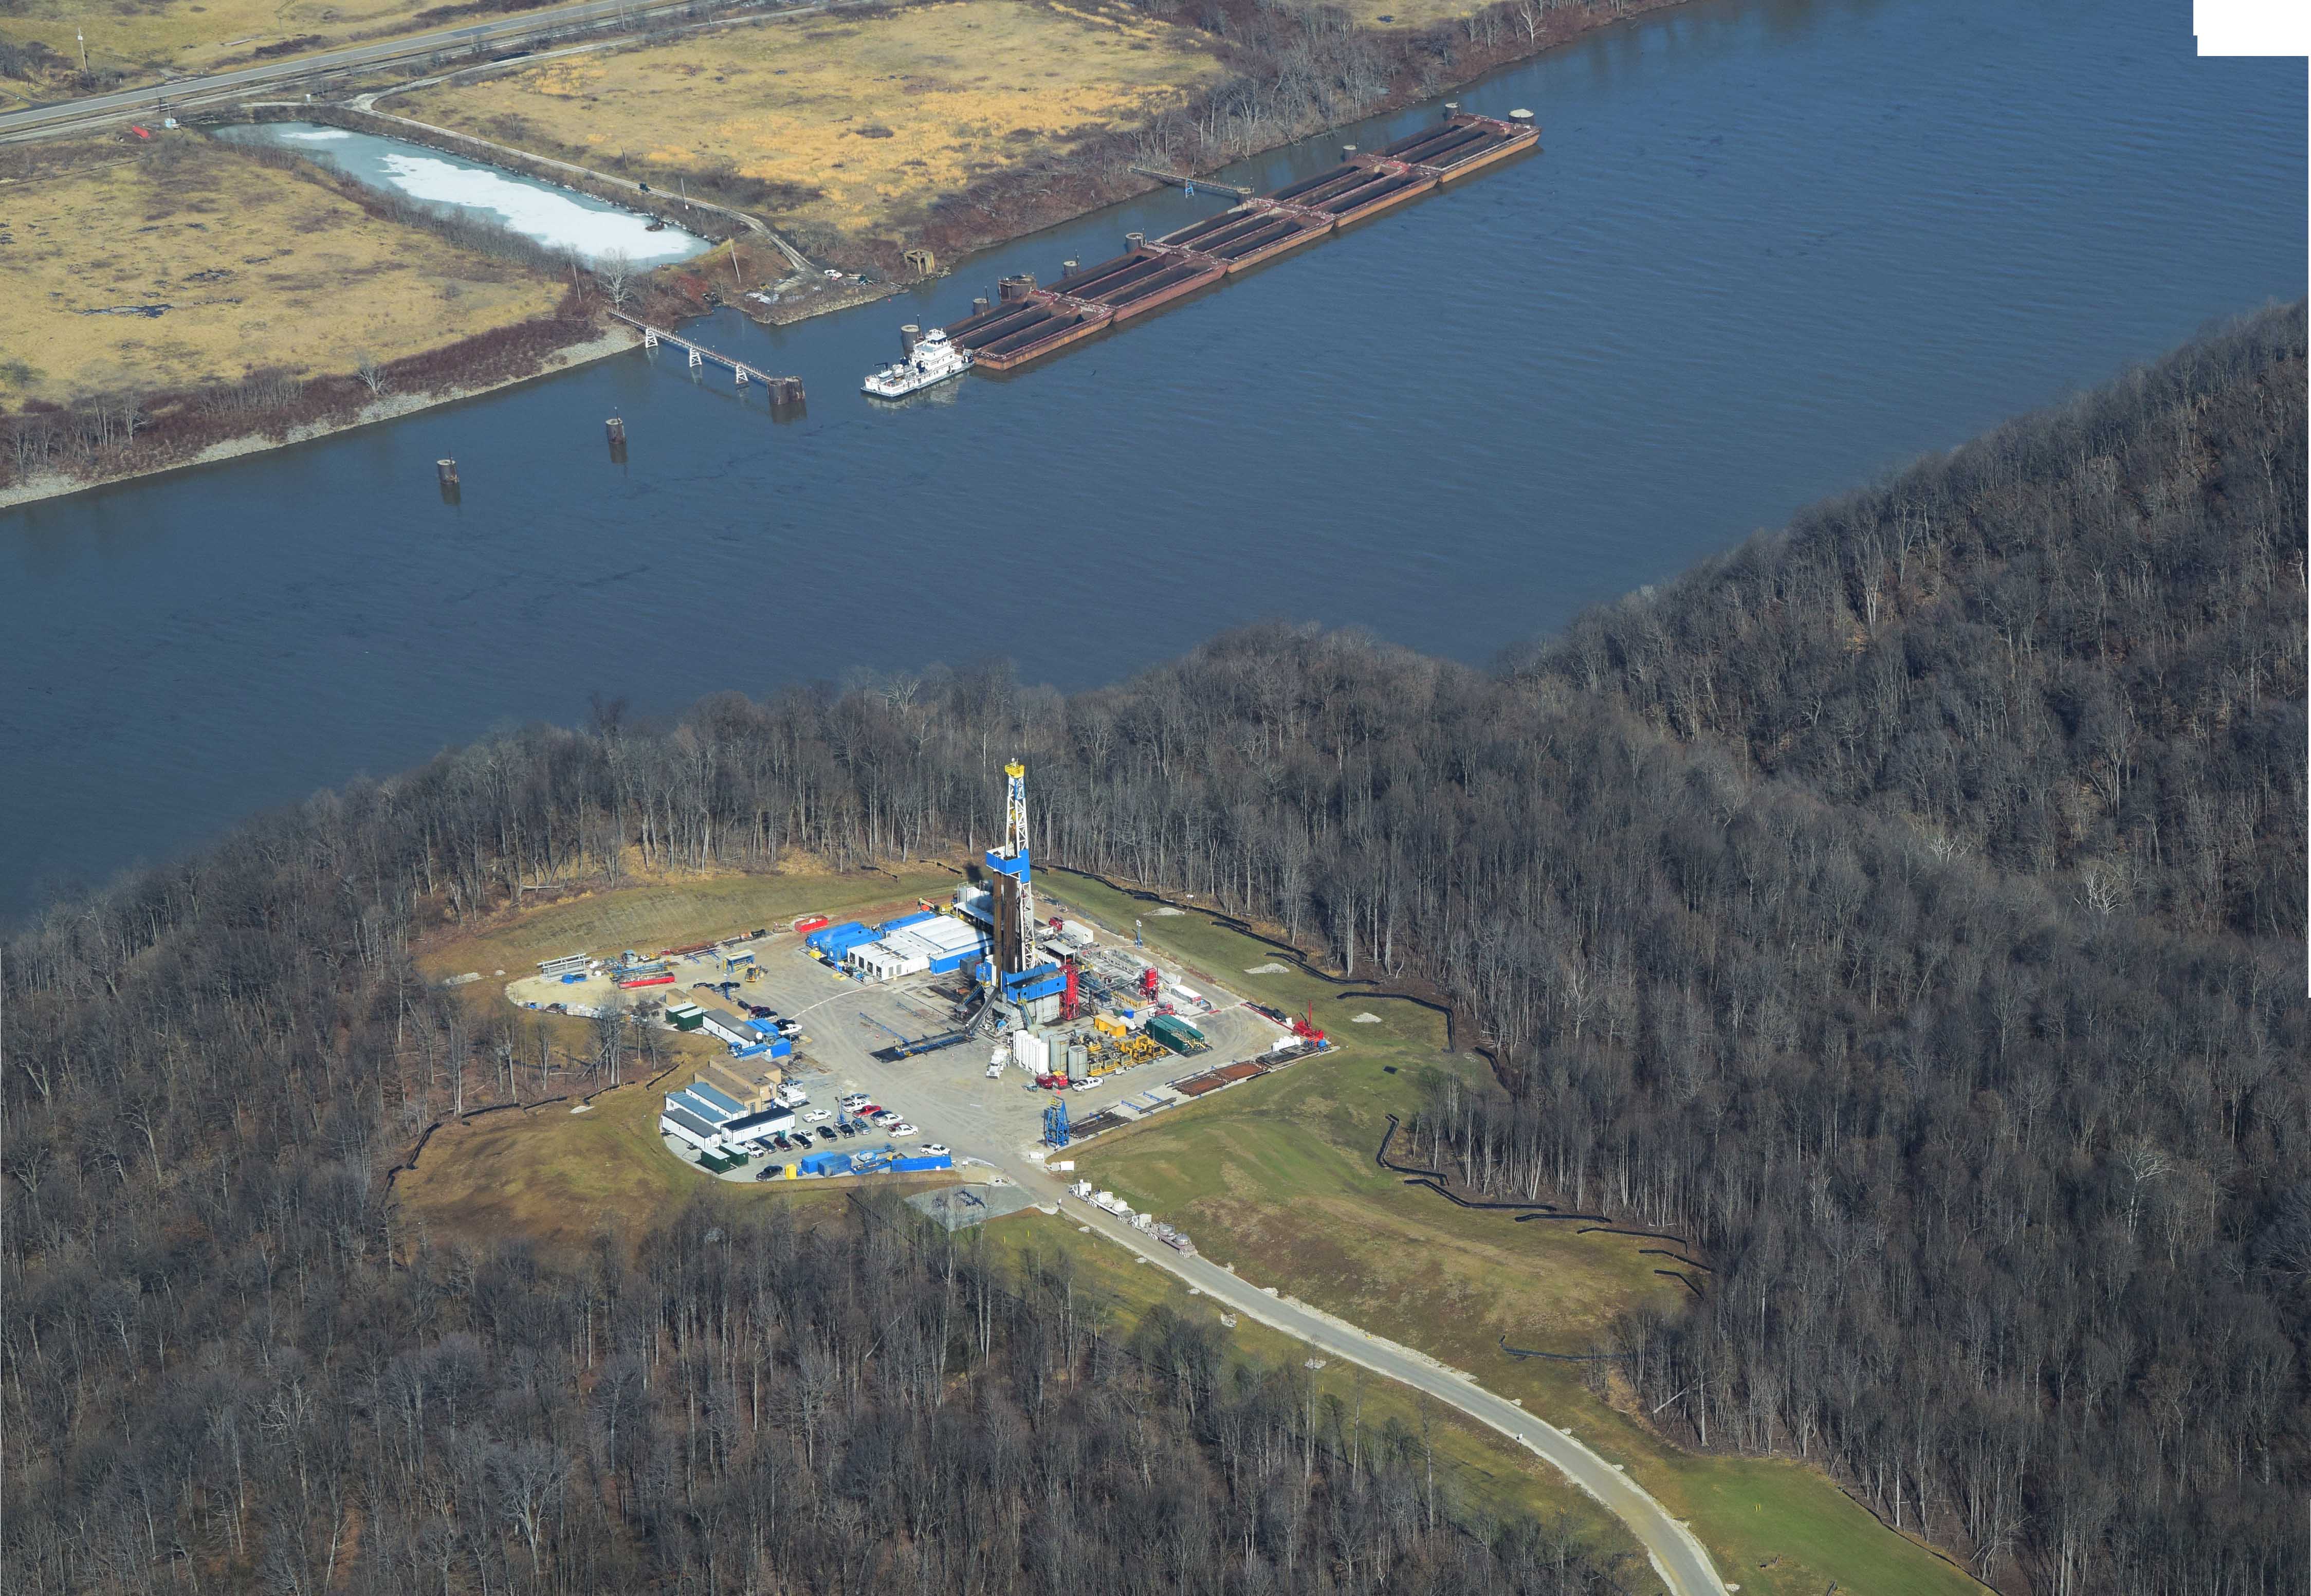
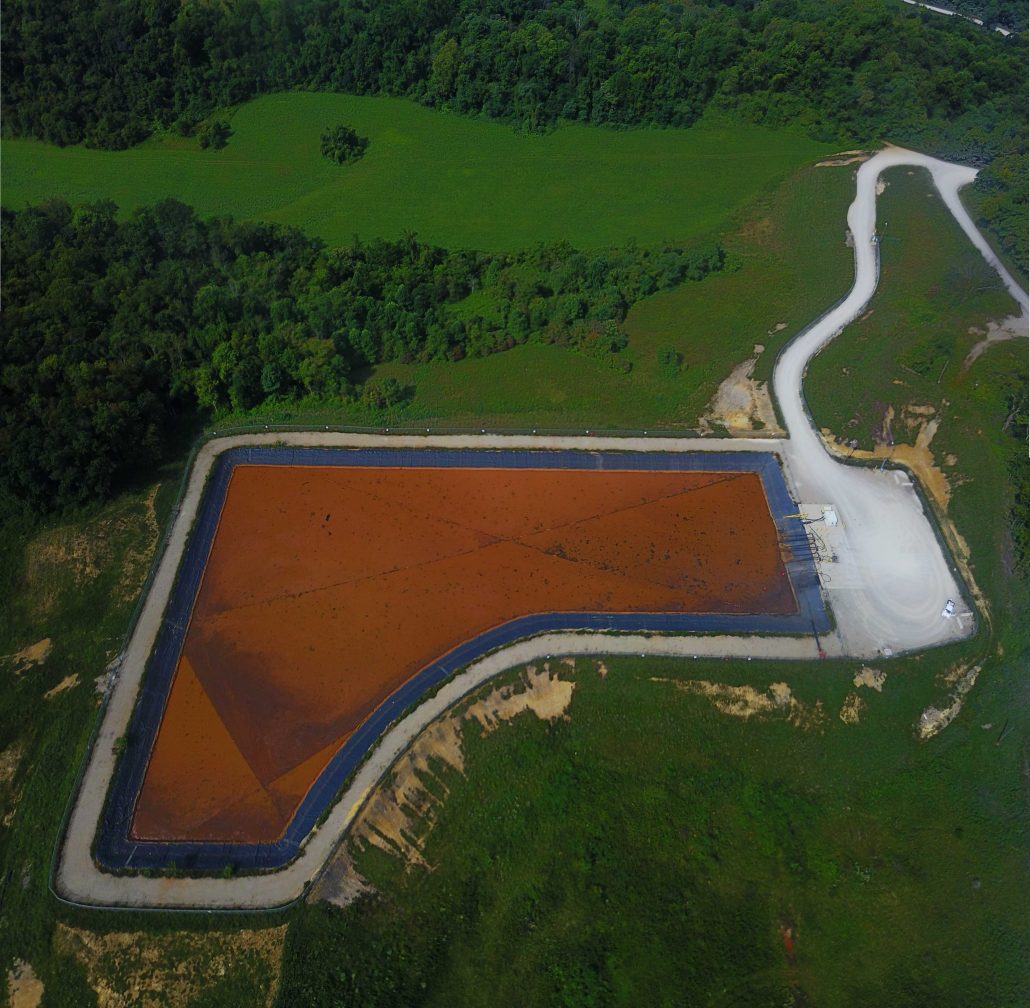
On February 26, a two-mile Temporary Flight Restriction (TFR) was enacted around the incident’s location. The TFR was supposed to lapse during the afternoon of March 5, however, due to complications at the site the TFR was extended to the evening of March 8. On March 5, we did a flyover outside of the temporary flight restriction zone, where we managed to capture a photo of the ongoing release through a valley cut. Many thanks to LightHawk and pilot Dave Warner for the lift.
XTO Energy well site and ongoing emissions after the explosion over two weeks ago. Many are still waiting on answers as to why the well has yet to be capped. Photo by Ted Auch, FracTracker Alliance, March 5, 2018. Aerial support provided by LightHawk
Additional resources
Per the Wheeling Intelligencer – Any local residents who may have been impacted by this incident are encouraged to call XTO’s claims phone number at 855-351-6573 or visit XTO’s community response command center at the Powhatan Point Volunteer Fire Department, located at 104 Mellott St. or call the fire department at 740-312-5058.
https://www.fractracker.org/a5ej20sjfwe/wp-content/uploads/2018/03/XTO-Incident-Feature.jpg400900FracTracker Alliancehttps://www.fractracker.org/a5ej20sjfwe/wp-content/uploads/2025/09/2025-Wordmark-Logo.pngFracTracker Alliance2018-03-06 15:53:362021-04-15 15:01:25Waiting on Answers Weeks after a Well Explosion in Belmont County Ohio
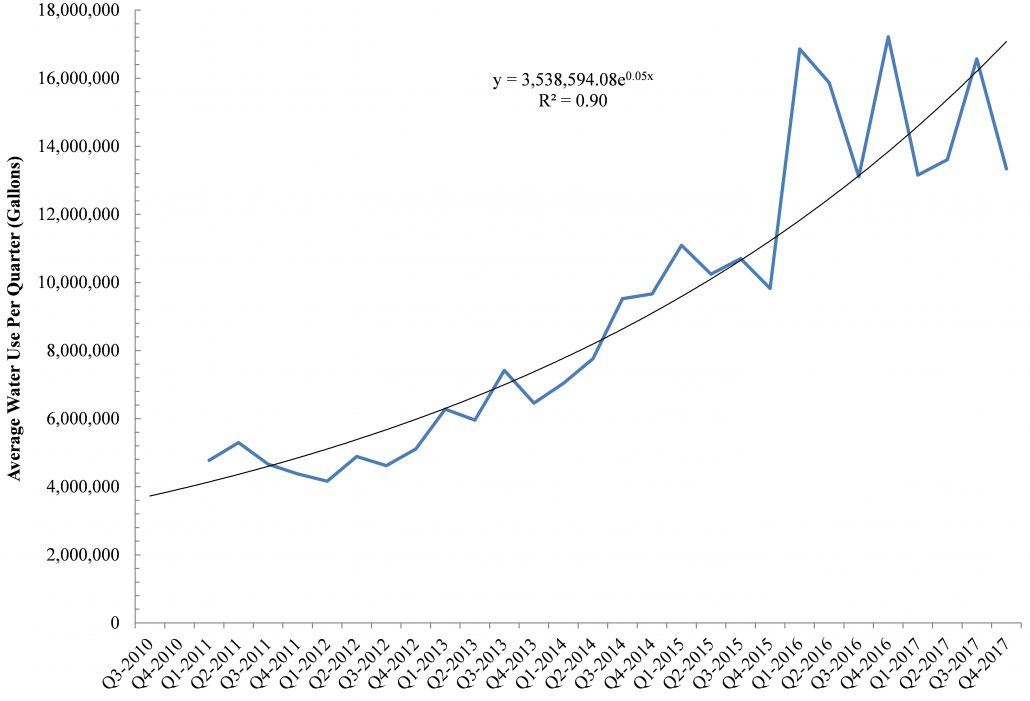
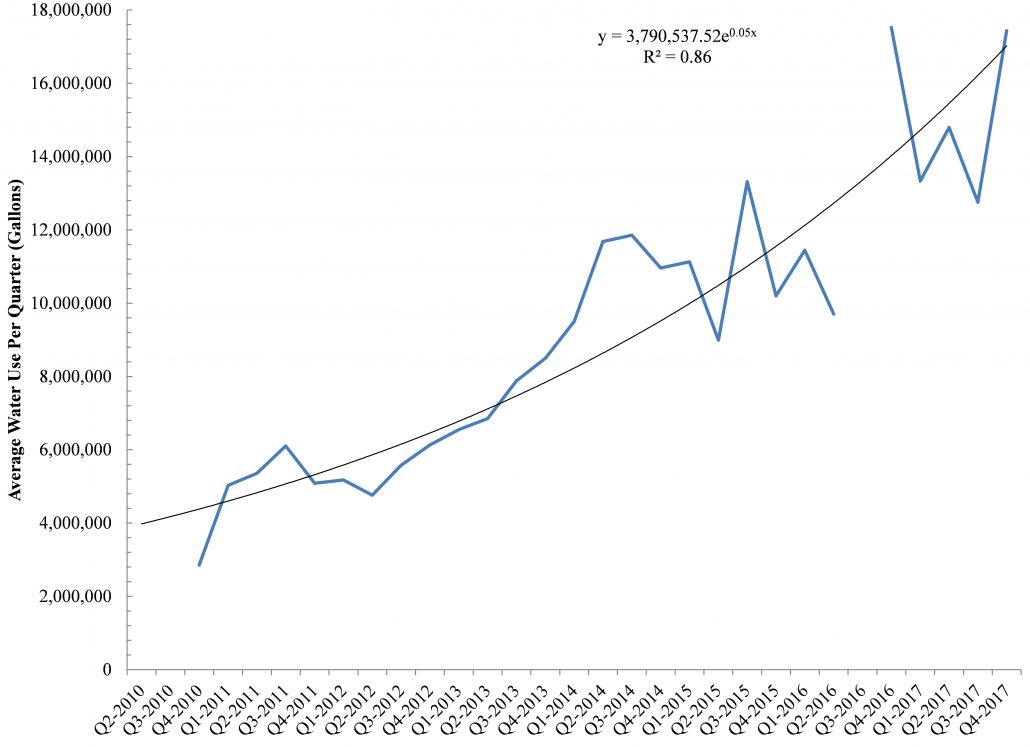
Water is the key ingredient in the hydraulic fracturing process, and its usage – in total and per well – is increasing at an exponential rate. Below, FracTracker takes a look at water withdrawal and use for fracking across 23 Eastern Ohio counties between 2010 and 2016.
Mapping Hydraulic Fracturing Freshwater Supply and Demand in Ohio
Below is a map of annual and cumulative water withdrawal volumes by the hydraulic fracturing industry across Ohio between 2010 and 2016. It displays 312 unique sites, as well as water usage per lateral. The digital map, which can be expanded fullscreen for more features, includes data up until May 2017 for 1,480 Ohio laterals (vertical wells can host more than one lateral well).
The primary take-home message from this analysis and the resulting map is that we can only account for approximately 73% of the industry’s more than 13-billion-gallon freshwater demand by considering withdrawals alone. Another source or sources must be supplying water for these hydraulic fracturing operations.
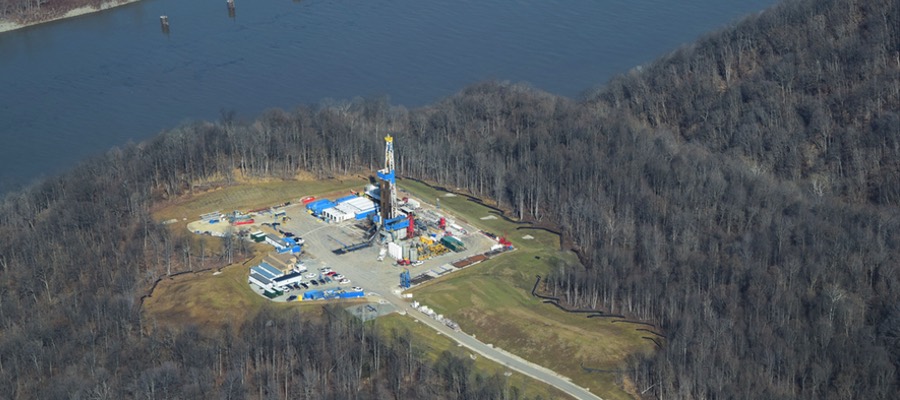
Hydraulic fracturing rig on the banks of the Ohio River in Marshall County, West Virginia, Winter 2018 (Flight provided by SouthWings)
When Leatra Harper at Freshwater Accountability Project and Thriving Earth Exchange and I brought up this issue with Ohio Division of Water Resources Water Inventory and Planning Program Manager, Michael Hallfrisch, the following correspondence took place on January 24, 2018:
Mr. Hallfrisch: “Where did the water usage per lateral data come from? Does the water usage include reused/recycled water? I know that many of the larger operators reuse a significant amount of their flow back because of the high cost of disposal in class II injection wells.”
FracTracker: “[We’]ve been looking at Class II disposal economics in several states and frankly the costs here in Ohio are quite cheap and many of the same players in Ohio operate in the other states [We]’ve looked at. Granted they usually own their own Class II wells in those other states (i.e., OK, or CO) but the fact that they are “vertically integrated” still doesn’t excuse the fact that the cost of disposing of waste in Ohio is dirt cheap. As for recycling that % was always a rounding error and last [we] checked the data it was going down by about 0.25-0.35% per year from an average of about 5.5-8.0%. [We respectfully] doubt the recycling % would fill this 25% gap in where water is coming from. This gap lends credence to what Lea and [FracTracker] hear time and again in counties like Belmont, Monroe, Noble etc with people telling us about frequent trenches being dug in 1st and 2nd order streams with operators topping off their demands in undocumented ways/means. Apologies for coming down hard on this thing but we’ve been looking/mapping this thing since 2012 and increasingly frustrated with the gap in our basic understanding of flows/stocks of freshwater and waste cycling within Ohio and coming into the state from PA and WV.”
The fracking industry in Ohio uses roughly 10-14 million gallons per well, up from 4-5 million gallon demands in 2010, which means that freshwater demand for this industry is increasing 15% per year (Figures 1 and 2). (This rate is more than double the volumes cited in a recent publication by the American Chemical Society, by the way.) If such exponential growth in hydraulic fracturing’s freshwater demand in Appalachia continues, by 2022 each well in Ohio and West Virginia will likely require[1*]at least 43 million gallons of freshwater (Table 1).
Table 1. Projected annual average freshwater demand per well (gallons) for the hydraulic fracturing industry in Ohio and West Virginia based on a 15% increase per year.
Year
Water Use Per Well (gallons)
Ohio
West Virginia
2019
19,370,077
19,717,522
2020
23,658,666
23,938,971
2021
28,896,760
29,064,215
2022
35,294,582
35,286,756
2023
43,108,900
42,841,519
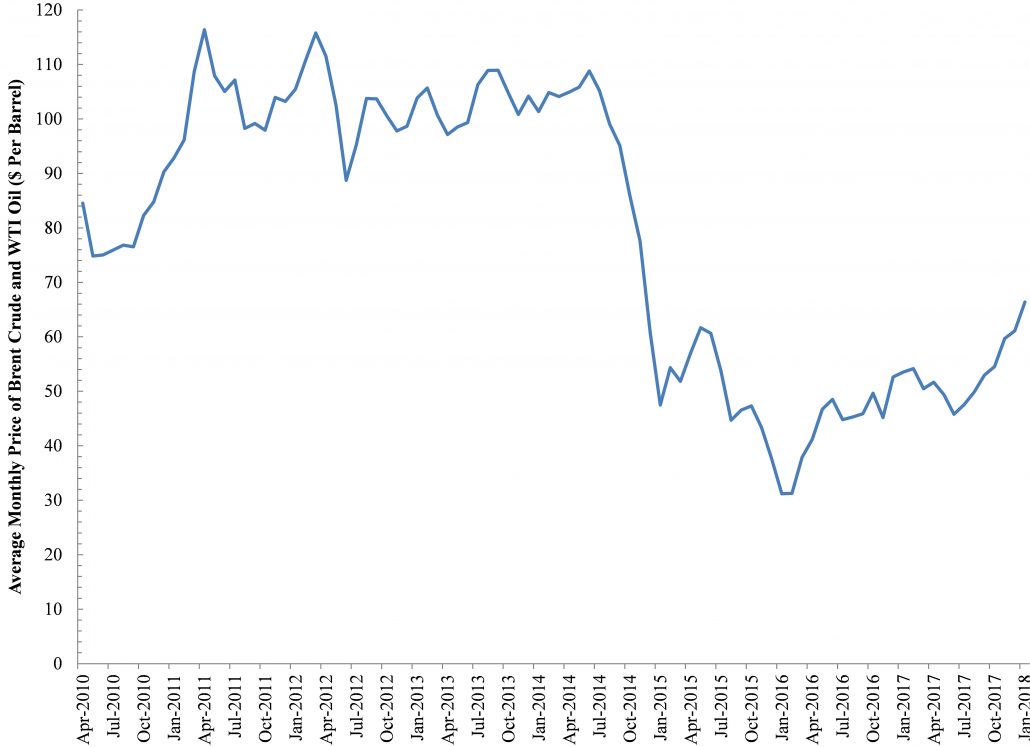
Water quantity and associated watershed security issues are both acute and chronic concerns at the local level, where fracking’s freshwater demands equal 14% of residential demands across Ohio. These quantities actually exceed 85% of residential demand in several Ohio counties (e.g., Carroll and Harrison), as well as West Virginia (e.g., Doddridge, Marshall, and Wetzel). Interestingly the dramatic uptick in Ohio freshwater demand that began at the end of 2013 coincides with a 50% decline in the price of oil and gas (Figure 3). The implication here is that as the price of gas and oil drops and/or unproductive wells are drilled at an unacceptable rate, the industry uses more freshwater and sand to ensure acceptable financial returns on investments.
To date, the fracking industry has taken on average 90 million gallons of freshwater per county out of Ohio’s underlying watersheds, resulting in the production of 9.6 million gallons of brine waste that cannot be reintroduced into waterways. This massive waste stream is destined for one of Ohio’s Class II Injection wells, but the industry spends less than 1.25% of available capital on water demand(s) and waste disposal. All of this means that the current incentive (cost) to become more efficient is too low. Sellers of water to the industry like the Muskingum Watershed Conservancy District, which we’ve chronicled frequently in the past[2], have actually dropped their price for every 1,000 gallons of water – from roughly $9 to now just $4-6 – for the fracking industry in recent years.
Hydraulic fracturing’s demand is becoming an increasingly larger component of total water withdrawals in Ohio, as other industries, agriculture, and mining become more efficient. Oil and gas wells drilled at the perimeter of the Utica Shale are utilizing 1.25 to 2.5 times more water than those that are staged in the shale “Sweet Spots.” Furthermore, the rise in permitting of so called “Super Laterals” would render all of our water utilization projections null and void. Laterals are the horizontal wells that extend out underground from the vertical well. Most well pads are home to multiple laterals in the range of 4-7 laterals per pad across Ohio and West Virginia.
These laterals, which can reach up to 21,000 feet or almost 4 miles, demand as much as 87 million gallons of freshwater each.
Even accounting for the fact that the super laterals are 17-21,000 feet in length – vs. an average of 7,452 feet – such water demand would dwarf current demands and their associated pressures on watershed security and/or resilience; typically, Ohio’s hydraulically fractured laterals require 970-1,080 gallons of freshwater per lateral foot (GPLF), but super laterals would need an astounding 4,470 GLPF.
Conclusions and Next Steps
The map above illustrates the acute pressures being put upon watersheds and public water supplies in the name of “energy independence.” Yet, Ohio regulators and county officials aren’t putting any pressure on the high volume hydraulic fracturing (HVHF) industry to use less water and produce less waste. We can’t determine exactly how water demand will change in the future. The problem is not going away, however, especially as climate change results in more volatile year-to-year fluctuations in temperature and precipitation. This means that freshwater that was/is viewed as a surplus “commodity” will become more valuable and hopefully priced accordingly.
Furthermore, the Appalachian Ohio landscape is undergoing dramatic transformations at the hands of the coal and more recently the HVHF industry with strip-mines, cracking plants, cryogenic facilities, compressor stations, gas gathering lines – and more – becoming ubiquitous.
We are seeing significant acreage of deciduous forests, cropland, or pasture that once covered the region replaced with the types of impervious surfaces and/or “clean fill” soil that has come to dominate HVHF landscapes in other states like North Dakota, Texas, and Oklahoma.
This landscape change in concert with climate change will mean that the region will not be able to receive, processes, and store water as effectively as it has in the past.
It is too late to accurately and/or more holistically price the HVHF’s current and past water demand in Ohio, however, such holistic pricing would do wonders for how the industry uses freshwater in the future. After all, for an industry that believes so devotedly in the laws of supply and demand, one would think they could get on board with applying such laws to their #1 resource demand in Appalachia. The water the HVHF industry uses is permanently removed from the hydrological cycle. Now is the time to act to prevent long term impacts on Ohio’s freshwater quantity and quality.
Relevant Data
Ohio hydraulic fracturing lateral freshwater demand by individual well between 2010 and the end of 2016. Download
Ohio hydraulic fracturing lateral freshwater withdrawals by site between 2010 and the end of 2016. Download
Endnotes
*Certainty, with respect to this change in freshwater demand, is in the range of 86-90% assuming the exponential functions we fit to the Ohio and West Virginia data persist for the foreseeable future. Downing, Bob, 2014, “Ohio Drillers’ Growing Use of Fresh Water Concerns Environmental Activists”, March 19th, Akron, Ohio
Downing, Bob, 2014, “Group Reacts to Muskingum Watershed Leasing Deal with Antero”, April 22nd, Akron, Ohio
By Ted Auch, Great Lakes Program Coordinator, FracTracker Alliance
https://www.fractracker.org/a5ej20sjfwe/wp-content/uploads/2018/02/Rig-River-Feature.jpg400900Ted Auch, PhDhttps://www.fractracker.org/a5ej20sjfwe/wp-content/uploads/2025/09/2025-Wordmark-Logo.pngTed Auch, PhD2018-02-28 11:12:392021-04-15 15:01:25Fracking’s Freshwater Supply and Demand in Eastern Ohio
The head of Murray Energy Corporation, Robert Murray, is very close to the highest office in the land. Such an association demands a close look at the landscape from which this corporation and its founder arouse.
Belmont County, Ohio’s most famous tycoon Robert Murray has established a close relationship with the Trump administration. This connection dates back to his $300,000 contribution to Trump’s inauguration. The intimacy of this relationship has been given new weight recently when it was revealed that a hug between Mr. Murray and the Department of Energy’s Secretary Rick Perry preceded a meeting where Mr. Murray presented the administration with a memo outlining a 16-point plan for removing some of the burdensome regulations put in place by Mr. Murray’s least favorite person former President Barack Obama.
Among the few consistent themes from this most inconsistent of presidents has been a fondness for coal and steel, where brawny men do essential work and are threatened not by shifting economics, but by greenies and weenies who want to shut them down. Mr Trump and Mr Murray both want environmental rules rolled back—Mr Murray because it would be good for his bottom line, and Mr Trump because a second consistent aim of his presidency is to reverse anything done by Barack Obama. It is doubtful whether policy shifts alone could revive coal mining, but the attempt to do so says much about how vested interests operate in this administration… Mr Trump played a hard-nosed businessman on TV, but Mr Murray is the real thing. – The Economist, 2018
Not only has Mr. Murray succeeded in capturing the hearts and minds of the Trump administration, he has demanded that his $300,000 contribution get his longtime Oklahoman lawyer, and former aide to the senate’s chief climate skeptic James M. Inhofe of Oklahoma, the #2 spot behind Scott Pruitt at the EPA. Mr. Murray is so powerful that he managed to get Perry & Co. to fire the photographer that took the photo of the tender moment between Messrs. Perry and Murray.
Awkwardness aside, these situations could reasonably lead one to conclude that Perry and Pruitt are competing for Murray’s favor in the event they choose to run for higher office and need a patron with deep pockets. Mr. Murray would be in a real pickle if they both chose to run for the highest office in the land, with two fawning candidates potentially offering to one-up the other in terms of incentives and/or regulatory carve outs for Mr. Murray’s beloved King Coal.
Once the heart of Ohio Coal Country, Belmont Co. is now a major player on the hydraulic fracturing landscape, as well.
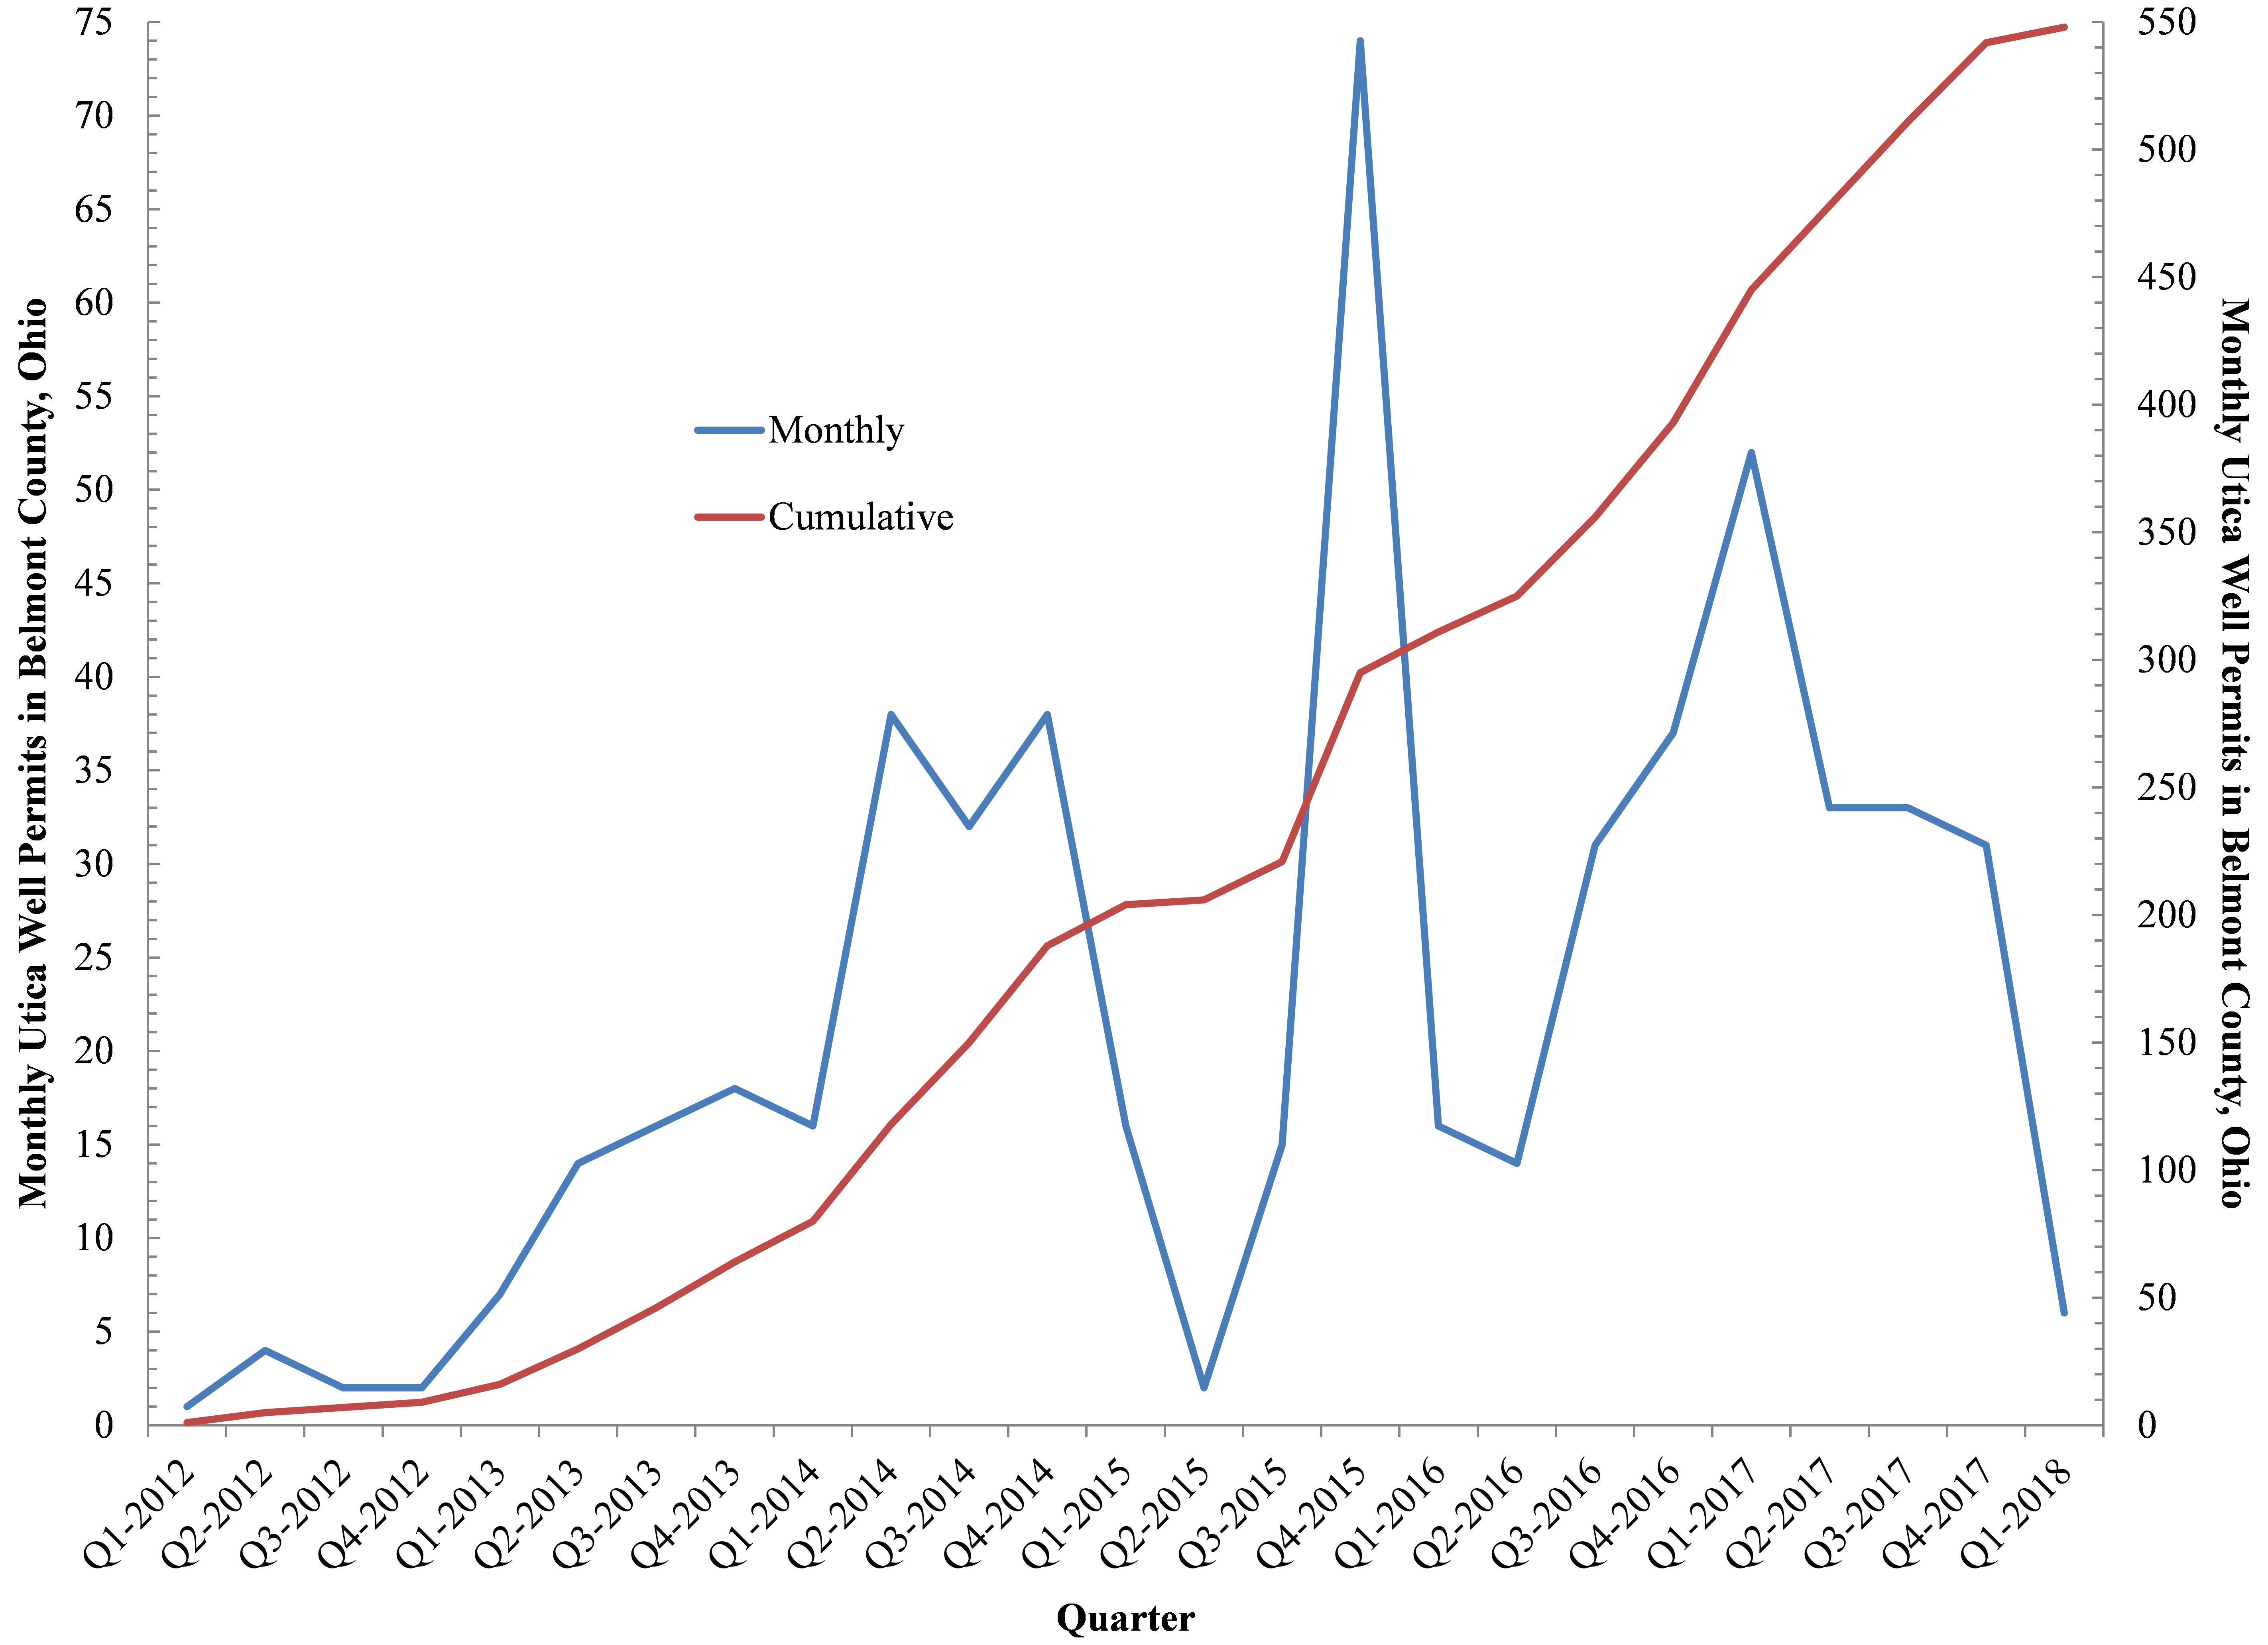
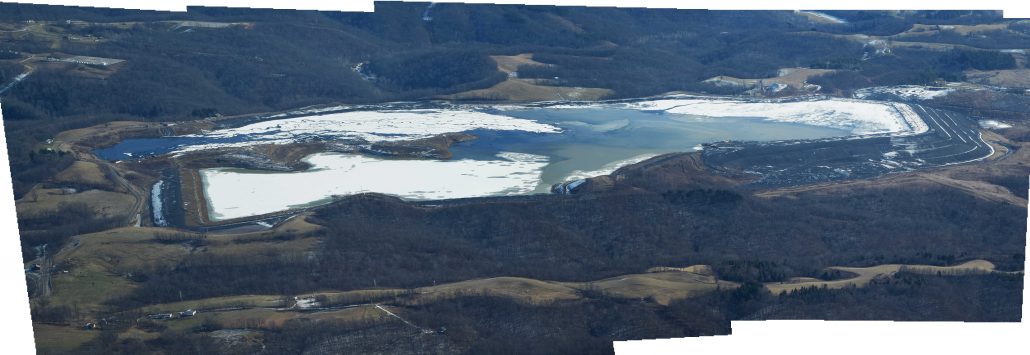
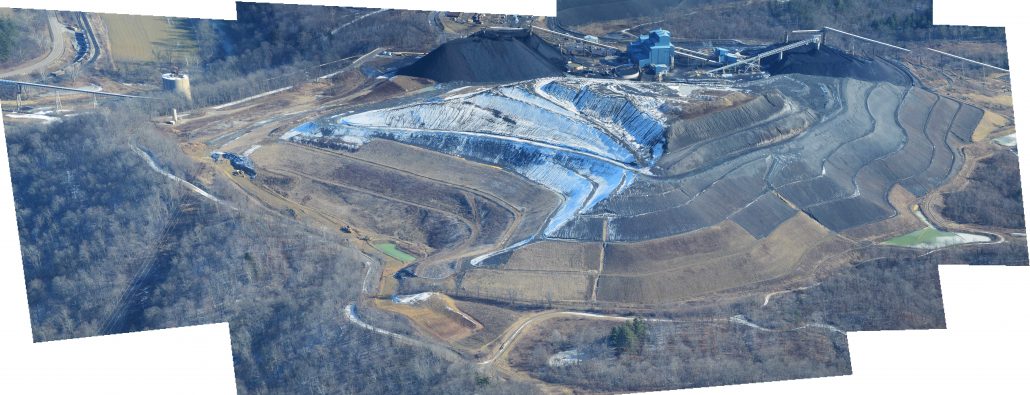
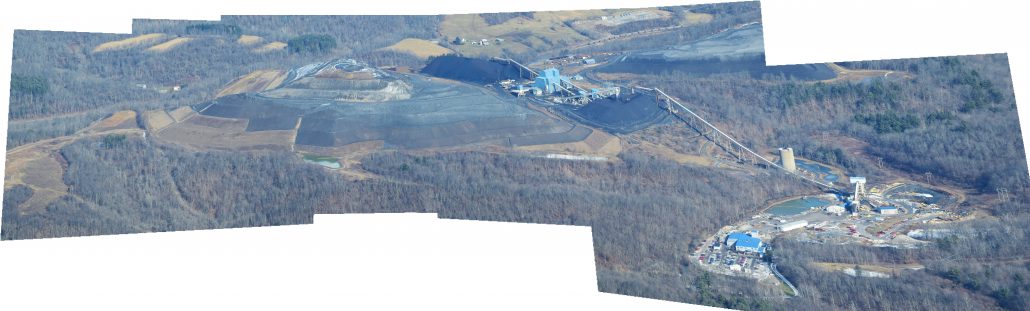
Given the growing influence of Mr. Murray and the coal industry writ large we thought it was time to do a deep dive into how Mr. Murray’s Appalachian Ohio home county of Belmont and surrounding counties have been altered by coal mining. We were also interested in how the coal industry has come to interact with the hydraulic fracturing industry, which has drilled 542 Utica wells in Belmont County alone since March 2012. These wells amount to 20% of all fracked wells in Ohio as of January 2018. The rate at which Utica wells are being permitted in Belmont County is actually increasing by about 1.5 to 2 permits per month or 5.5 to 7.8 times the statewide average (Figure 1).
Belmont County also happens to be the “all-time leader in coal production in Ohio” having produced 825 million tons since 1816 (ODNR, 2005). All of this means that the Ohio county that produces the most coal is also now The Buckeye State’s most actively drilled county.
Figure 1. Monthly and cumulative hydraulically fractured wells in Belmont County, Ohio between Q1-2012 and Q1-2018
However, the days of coal’s dominance – and easily mineable coal – in Ohio appear to be coming to an end.
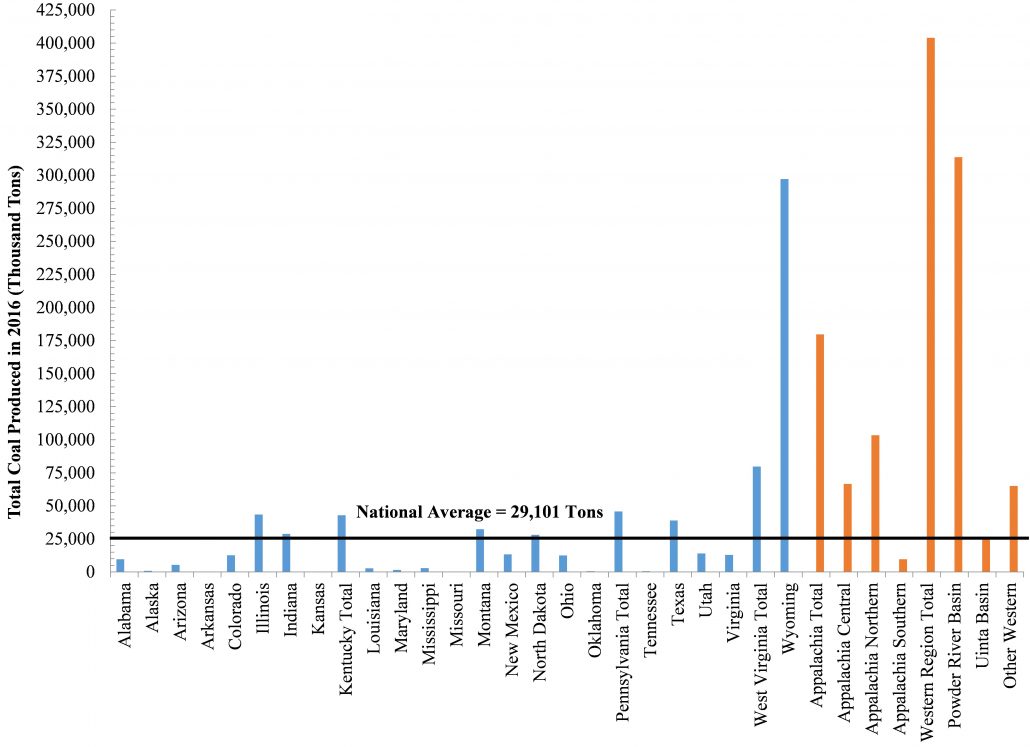
Per mine, Ohio’s mines produce about 30% of the national average and 43% of the state averages (Figure 2). Ohio’s mines only produce about 10% of what the mega Western mines produce on a per-mine basis, and much less than states like New Mexico and Texas, as well.
Even with automation, the barriers to a return of coal in Appalachia are formidable given that most of the easily recoverable coal has already been mined. Additionally, the landscape is more formidable and not as conducive to the large strip-mine and dragline operations of the Powder River Basin, which produce roughly 8.5 million tons of coal per mine, compared to an average of 330,000 tons per mine in Appalachia. (Figure 2).
The below map depicts parcels owned by coal mining companies in the Ohio counties of Belmont, Noble, Guernsey, and Muskingum, as well as previously mined and/or potential parcels based on owner and proximity to existing mines.
We also incorporated production data (2001 to 2016) for 116 surface and strip coal mines in these and surrounding counties, natural gas pipelines, hydraulically fractured laterals, and Class II Salt Water Disposal (SWD) injection wells as of January 2018.
There are few areas in the United States where underground coal mining and fracking are taking place simultaneously and on top of each other. What could possibly go wrong when injecting massive amounts of fracking waste at high pressures into the geology below, while simultaneously pumping billions of gallons of water into hydraulically fractured laterals and mining coal at similar depths?
In the coming months and years we will be monitoring Belmont County, Ohio as an unfortunate case-study in determining the answer to such a unique question.
At the present time:
Murray Energy, its subsidiaries, and other coal companies own approximately 15% of Belmont County.
Coal companies and their associated real-estate firms and subsidiaries have mined or own approximately 5,615 square miles across the Noble, Belmont, Guernsey, and Muskingum counties.
The 116 mines in this map have mined an average of 3.22 million tons of coal since 2001 and more than 373 million tons in total. Mr. Murray’s mines account for 50% of this amount, producing nearly 15 times more coal per mine than the other 112 mines.
Collectively, these mines have contributed 1.09 billion tons of CO2 and CH4+N2O in CO2 equivalents to atmospheric climate change, or 68 million tons per year (MTPY). This volume is equivalent to the annual emissions of nearly 60 million Americans or 19% of the population.
Murray’s mines alone have contributed enough greenhouse gases (CO2+CH4+N2O) to account for the emissions of 9.2% of the US population since 2001. Each Murray mine is belching out 8.41 million tons of greenhouse gases per year or roughly equivalent to the emissions of 463,489 Americans.
Relevant data for this map can be found at the end of this article.
Broader Implications
Robert Murray’s influence and mining impacts extend well beyond Appalachian Ohio.
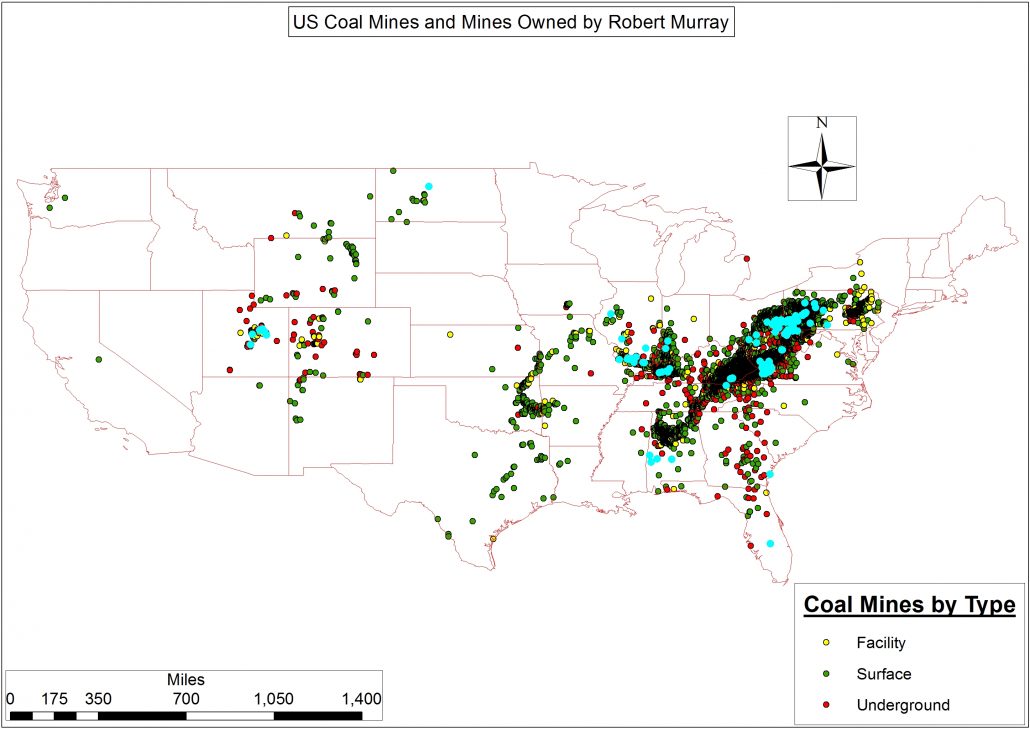
Mr. Murray’s is the primary owner of 157 mines and associated facilities1 across eleven states – and five of the six major Lower 48 coal provinces – from Utah and North Dakota to Alabama, Georgia, and Florida (Figure 3). Mr. Murray likes to highlight his sage purchases of prime medium and high volatility bituminous coal real-estate over the years on his company’s website. However, nowhere in his corporate overview does he mention his most notorious mine: the abandoned and sealed underground Crandal Canyon Mine, Emery County, Utah. It was at this mine on August 6, 2007 that a collapse trapped six miners and resulted in their deaths, along with the deaths of three rescue workers. Mr. Murray told the BBC that he had had an emotional breakdown and hadn’t deserted anyone living in a little trailer adjacent to the mine’s entrance every day following the collapse. Furthermore, Mr. Murray blames such events on subsidiaries like Grenwal Resources Inc., which happens to be the owner of record for the Crandal Canyon Mine and is one of thirty-three unique subsidiaries owned by Mr. Murray (data download).
Figure 3. US Coal Mines by type and Mines Owned by Robert Murray highlighted in turquoise
Table 1. Robert Murray coal mine ownership by mine status
Status
Number of Mines
Abandoned
68
Abandoned and Sealed
62
Active
12
Non-Producing
10
Temporarily Idled
5
Total
157
The Politics of Energy
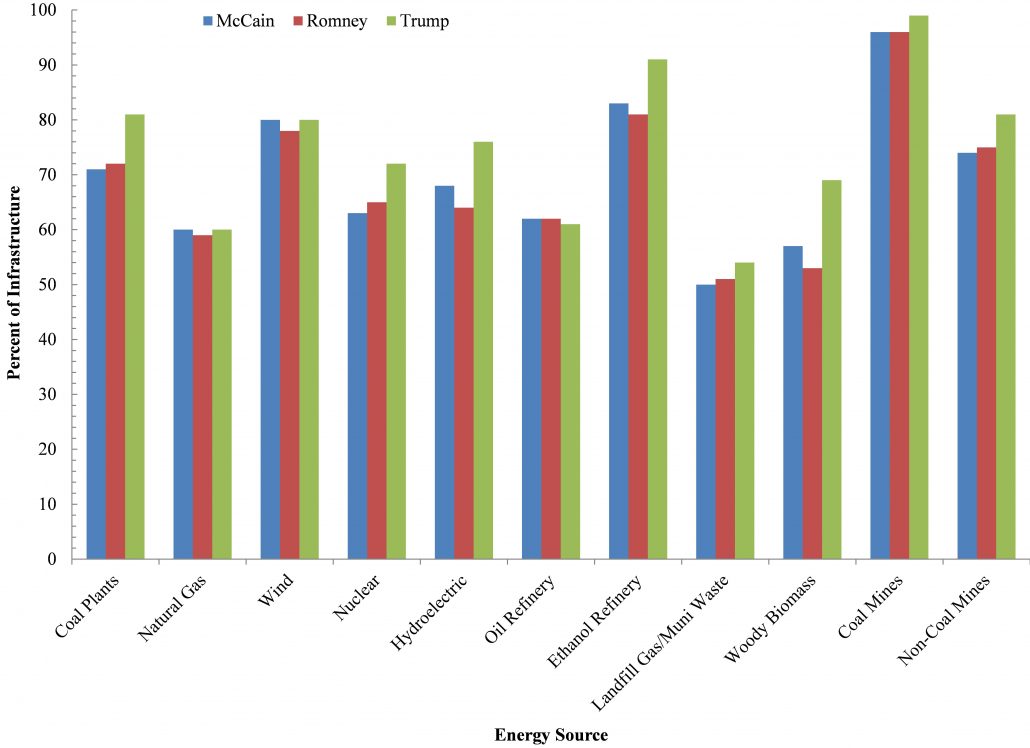
Robert Murray and his fellow fossil fuel energy brethren’s bet on Trump paid off, with Trump winning 99% of the vote in congressional districts where coal mines exist (Figure 4). Such a performance bested the previous GOP candidates of McCain and Romney even though they had achieved an impressive 96% of the vote. Interestingly, Trump did nearly as well in congressional districts dominated by wind farms and ethanol refineries where more than 87% of the electorate was white.
Figure 4. Presidential election results for GOP candidates in voting districts where various forms of energy are produced and/or processed, 2016, 2012, and 2008
Trump & Co. promised these districts that his administration would breathe life into the fossil fuel industry. True, Trump, Pruitt, Perry, and Interior Secretary Ryan Zinke are greasing the skids for the industry’s revival. In terms of annual production, however, it is far from certain that such moves will translate into the types of boost in employment promised by Trump during the 2016 campaign. Even if production does return, executives like Murray admit that the advent of efficiencies and extraction technologies means that the industry is mining more coal per miner than ever before:
“Trump has consistently pledged to restore mining jobs, but many of those jobs were lost to technology rather than regulation and to competition from natural gas and renewables, which makes it unlikely that he can do much to significantly grow the number of jobs in the industry,” said Murray. “I suggested that he temper his expectations. Those are my exact words,” said Murray. “He can’t bring them back.” – The Guardian, March 27, 2017
Conclusions and Next Steps
It remains to be seen how the coal mining and fracking industry’s battle for supremacy will play out from a socioeconomic, health, environmental, and regulatory perspective. While many people understand that coal jobs aren’t coming back, we shouldn’t doubt the will of the Trump administration and friends like Robert Murray to make sure that profits can still be extracted from Appalachia.
Will the fracking industry and coal barons agree to get along, or will they wage a war on multiple fronts to marginalize the other side? Will this be another natural resource conflagration? If so, how will the people – and species like the “near-threatened” Hellbender Salamander (Cryptobranchus alleganiensis) or the region’s recovering Bald Eagle (Haliaeetus leucocephalus) population that live in the disputed Appalachian communities respond? How will their already stressed day-to-day existence be affected? To this point, the fossil fuel industry has managed to blame everyone but itself for the tepid to non-existent job growth in their sectors.
The Appalachian landscape has been deeply scarred and fragmented by coal mining, and now it is experiencing a new colonizing force in the form of the hydraulic fracturing industry. When Appalachia realizes that automation, globalization, and natural gas, are the key drivers to the downfall of coal, will they bring fire, brimstone, and pitchforks to the doorstep of Murray Energy of the fracking companies? Or is Appalachia’s future merely that of an extraction colony?
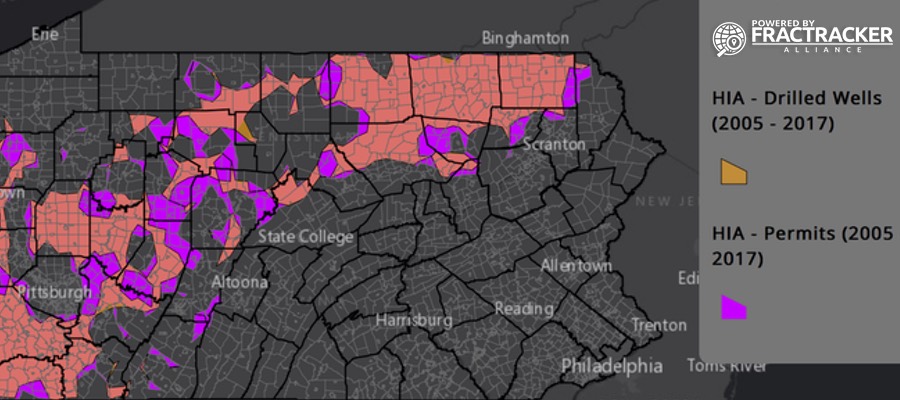
FracTracker Alliance has been mapping the impacts of unconventional oil and gas (O&G) drilling activity in Pennsylvania since 2010, and the Pennsylvania Shale Viewer is our most complete map to show the impacts of the industry.
While it can rightly be said that the development of the Marcellus Shale and other unconventional formations have affected half the state since 2005, this analysis takes a look at high impact areas, as well as a closer look at areas that have been avoided so far.
By Matt Kelso, Manager of Data and Technology, FracTracker Alliance
https://www.fractracker.org/a5ej20sjfwe/wp-content/uploads/2018/01/HighImpactAreas-PA-Feature.jpg400900Matt Kelso, BAhttps://www.fractracker.org/a5ej20sjfwe/wp-content/uploads/2025/09/2025-Wordmark-Logo.pngMatt Kelso, BA2018-02-05 11:47:352026-04-28 14:01:27High Impact Areas and Donut Holes – A Look at Unconventional O&G Activity in PA
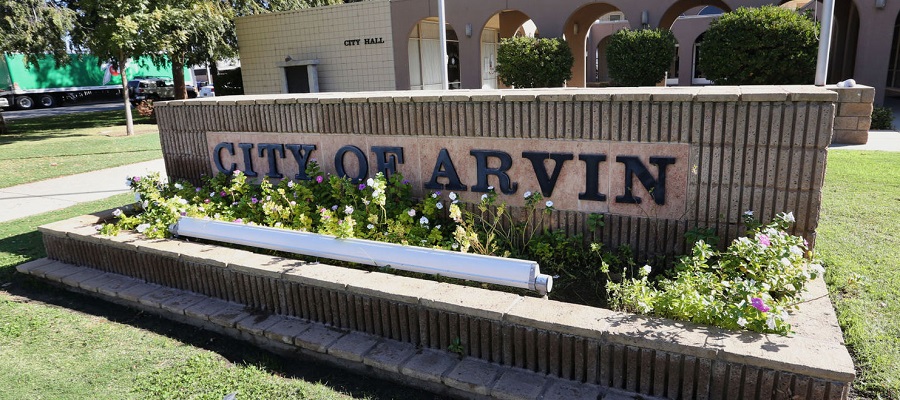
The City of Arvin, with a population of about 20,000, is located in Kern County, California just 15 miles southeast of Bakersfield. Nicknamed ‘The Garden in the Sun,’ Arvin is moving forward with establishing new regulations that would limit oil and gas development within the city limits.
Setback Map
The new ordinance proposes setback distances for sensitive sites including hospitals and schools, as well as residentially and commercially zoned parcels. The proposal establishes a 300-foot buffer for new development and 600’ for new operations.
In the map below, FracTracker Alliance has mapped out the zoning districts in Arvin and mapped the reach of the buffers around those districts. The areas where oil and gas well permits will be blocked by the ordinance are shown in green, labeled “Buffered Protected Zones.” The “Unprotected Zones” will still allow oil and gas permits for new development.
There are currently 13 producing oil and gas wells within the city limits of Arvin, 11 of them are located in the protected zones. Those within the protected zones are operated by Sun Mountain Oil and Gas and Petro Capital Resources. They were all drilled prior to 1980, and are shown in the map below.
Information on the public hearings and proposals can be found in the Arvin city website, where the city posts public notices. As of January 24, 2018, these are the current documents related to the proposed ordinance that you will find on the webpage:
In December of 2016, Committee for a Better Arvin, Committee for a Better Shafter, and Greenfield Walking Group, represented by Center for Race, Poverty and the Environment, sued Kern County. The lawsuit was filed in coordination with EarthJustice, Sierra Club, Natural Resources Defense Council, and the Center for Biological Diversity.
The Importance of Local Rule
Self-determination by local rule is fundamental of United States democracy, but is often derailed by corporate industry interests by the way of state pre-emption. There is a general understanding that local governments are able to institute policies that protect the interests of their constituents, as long as they do not conflict with the laws of the state or federal government. Typically, local municipalities are able to pass laws that are more constrictive than regional, state, and the federal government.
Unfortunately, when it comes to environmental health regulations, states commonly institute policies that preserve the rights of extractive industries to access mineral resources. In such cases, the state law “pre-empts” the ability of local municipalities to regulate. Local laws can be considered the mandate of the people, rather than the influence of outside interest on representatives. Therefore, when it comes to land use and issues of environmental health, local self-determination must be preserved so that communities are empowered in their decision making to best protect the health of their citizens.
https://www.fractracker.org/a5ej20sjfwe/wp-content/uploads/2018/01/Arvin_bakersfield_re.jpg400900Kyle Ferrar, MPHhttps://www.fractracker.org/a5ej20sjfwe/wp-content/uploads/2025/09/2025-Wordmark-Logo.pngKyle Ferrar, MPH2018-01-30 11:59:072021-04-15 15:01:28Arvin, CA – a City in the Most Drilled County in the Country – files for a Setback Ordinance
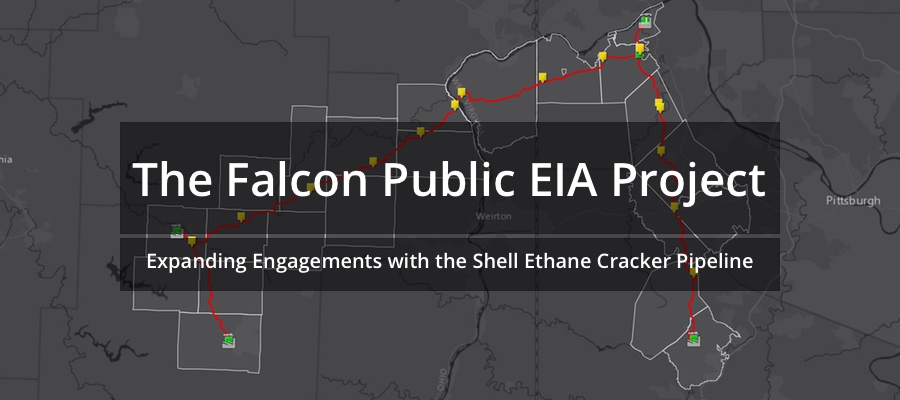
Pittsburgh, Pennsylvania – Jan. 29 – FracTracker Alliance has released a detailed environmental impact assessment (EIA), including digital maps, of the Falcon Ethane Pipeline being built to feed Shell Appalachia’s ethylene cracker plant in Beaver County, PA.
FracTracker’s Falcon Public EIA Project offers a rich series of interactive maps and articles detailing the Falcon’s proposed route through PA, WV, and OH, likely impacts to waterways, potential blast zones, ecological footprint, proximity to hazardous industrial areas, and more.
Given the issues associated with Mariner East 2 – a PA-based natural gas liquids pipeline whose history has been fraught with citations, public scrutiny is a crucial facet of pipeline construction. The Falcon Public EIA Project represents the first time that public stakeholders have been given such a significant amount of time and detail to investigate a proposed pipeline, including access to specific location information. Public comments are being accepted by the PA Department of Environmental Protection on the Falcon’s permit until February 20th.
“Companies are generally not required to publicly disclose GIS data when applying for permits,” remarked Kirk Jalbert, project lead and Manager of Community Based Research and Engagement at FracTracker. “While concerned citizens can stitch together paper maps provided by companies in their applications, that process can be complex and very labor intensive.”
Early access to what is being proposed for the Falcon pipeline will enable nearby communities to better understand how its construction and the associated ethane cracker facility, which will produce 1 million tons of ethylene annually for making plastics, will affect their lives. Upon analyzing the data, FracTracker uncovered a number of particularly noteworthy statistics, for example:
There are 97.5 miles of pipeline proposed to be built through 22 townships in 3 states.
2,000 properties have been surveyed; 765 easements executed.
Falcon will intersect 319 streams and 174 wetlands, with hundreds more proximate to work areas.
550 family residences, 20 businesses, 240 groundwater wells, 12 public parks, 5 schools, 6 daycare centers, and 16 emergency response centers are within potential risk areas.
“Extreme levels of risk and injustice are commonplace in petrochemical pipeline siting, as well as in where their contents come from and how they get used. This project provides context for the importance of reducing these impacts, both for curtailing environmentally unfriendly plastics as well as for moving away from fossil fuel dependencies,” said Brook Lenker, Executive Director of FracTracker.
The Falcon Public EIA Project is meant to expand public dialogue about what should be included in EIAs and how they should apply to petrochemical pipelines. The project also serves as a model for how regulatory agencies can be more transparent with data when engaging the public. This is especially important in the case of the Falcon pipeline, which will be exempt from Federal Energy Regulatory Commission (FERC) scrutiny and, therefore, not be subject to a full environmental impact assessment.
https://www.fractracker.org/a5ej20sjfwe/wp-content/uploads/2018/01/Falcon-Public-EIA-Project-Feature-1.jpg400900FracTracker Alliancehttps://www.fractracker.org/a5ej20sjfwe/wp-content/uploads/2025/09/2025-Wordmark-Logo.pngFracTracker Alliance2018-01-29 07:45:292021-04-15 15:01:56Wingspan of the Falcon Pipeline
Pipelines are categorized by what they carry — natural gas, oil, or natural gas liquids (NGLs) — and where they go — interstate or intrastate. The regulatory system is complicated. This primer is a quick guide to the agencies that may be involved in Falcon’s permit reviews.
Regulating Pipelines
The siting of natural gas pipelines crossing state or country boundaries is regulated by the Federal Energy Regulatory Commission (FERC). Meanwhile, determination of the location of natural gas routes that do not cross such boundaries are not jurisdictional to FERC, instead determined by the owner pipeline company. Hazardous liquids and NGL pipelines are not regulated for siting by FERC regardless of their location and destination. However, FERC does have authority over determining rates and terms of service in these cases. The U.S. Army Corps of Engineers gets involved when pipelines cross navigable waters such as large rivers and state Environmental Protection Agencies.
Pipeline design, operation, and safety regulations are established by the Pipeline and Hazardous Materials Safety Administration (PHMSA), but these regulations may vary state-by-state as long as minimal federal standards are met by the pipeline project. Notably, PHMSA’s oversight of safety issues does not determine where a pipeline is constructed as this is regulated by the different agencies mentioned above – nor are PHMSA’s safety considerations reviewed simultaneously in siting determinations done by other agencies.
An excerpt from the U.S. Army Corps’ EIS of the Atlantic Sunrise pipeline
An EIS is based on surveying and background research conducted by the company proposing the project, then submitted to agencies as an Environmental Impact Assessment (EIA). An EIS can exceed hundreds of pages and can go through many drafts as companies are asked to refine their EIA in order to qualify for approval.
An excerpt from the PA DEP’s review of water crossings for the Mariner East 2 pipeline
Pipeline proposals are also evaluated by state and local agencies. In Pennsylvania, for instance, the PA DEP is responsible for assessing how to minimize pipeline impacts. The DEP’s mission is to protect Pennsylvania’s air, land and water from pollution and to provide for the health and safety of its citizens through a cleaner environment. The PA Fish and Boat Commission oversees the avoidance or relocation of protected species. Local township zoning codes can also apply, such as to where facilities are sited near zoned residential areas or drinking reservoirs, but these can be overruled by decisions made at the federal level, especially when eminent domain is granted to the project.
Regulating the Falcon
For the Falcon pipeline, an interstate pipeline that will transport ethane (an NGL), FERC will likely have authority over determining rates and terms of service, but not siting. Construction permitting will be left state agencies and PHMSA will retain its federal authority with the Pennsylvania Public Utilities Commission (PUC) acting as PHMSA’s state agent to ensure the project complies with federal safety standards and to investigate violations. The Army Corps will almost certainly be involved given that the Falcon will cross the Ohio River. As far as we know, the Falcon will not have eminent domain status because it supplies a private facility and, thus, does not qualify as a public utility project.
Questioning Impact Assessments
The contents of EIAs vary, but are generally organized along the lines of the thematic categories that we have created for assessing the Falcon data, as seen above. However, there is also much that EISs fail to adequately address. The Army Corp’s assessment of the Atlantic Sunrise is a good example. The final EIS resulting from the operators EIA includes considerations for socioeconomic impacts, such effects on employment and environmental justice, as seen in the excerpt below. But potential negative impact in these areas are not necessarily linked to laws requiring special accommodations. For instance, federal regulations mandate achieving environmental justice by “identifying and addressing, as appropriate, disproportionately high and adverse human health or environmental effects” of projects subject to NEPA’s EIS requirement. However, there are no laws that outline thresholds of unacceptable impact that would disallow a project to proceed.
An excerpt from the Atlantic Sunrise EIS addressing environmental justice concerns
Furthermore, the narratives of EIAs are almost always written by the companies proposing the project, using sources of data that better support their claims of minimal or positive impact. This is again seen in the Atlantic Sunrise EIS, where several studies are cited on how pipelines have no affect on property values or mortgages, with no mention of other studies that contradict such findings. Other factors that may be important when considering pipeline projects, such as concerns for sustainability, climate change, or a community’s social well-being, are noticeably absent.
Complicating matters, some pipeline operators have been successful in skirting comprehensive EIAs. This was seen in the case of the Mariner East 2 pipeline. Despite being the largest pipeline project in Pennsylvania’s history, a NEPA review was never conducted for ME2.
In this segment of the Falcon Public EIA Project, we first focus on the route of the pipeline and prior routes that were considered. We take a closer look at the properties along the route that required easement agreements from landowners. Finally, we locate facilities that will be built as part of the project, such as metering stations and shut-off valves, as well as the pipeline’s construction areas and access roads.
Quick Falcon Facts
97.5 miles of proposed pipeline (an additional 200+ miles surveyed during the process)
2,000 parcels of land surveyed; 765 easements executed; 469 will be needed to execute the route
1,273 acres required for construction space; 650 acres for the permanent right-of-way
Map of Falcon pipeline routes, properties, and facilities
The following map will serve as our guide in breaking down these first components. Expand the map full-screen to explore its contents in greater depth. Some layers only become visible at closer zoom levels. Click the “details” tab in full-screen mode to read how the different layers were created.
Pipeline operators must consider a variety of factors when searching for a viable right of way (ROW) for their project—the continuous stretch of land needed to construct, maintain, and operate the pipeline. This process begins with reviewing data and maps made available by federal, state, and local agencies in order to identify features that would complicate the project. These might include such things as protected wetlands, drinking water sources, abandoned mines, or heavily populated areas.
A second step is to conduct manual field surveys along their planned route. During this stage, engineers do precise measurements to determine how the pipeline will cross individual properties as well as locate site-specific concerns that need to be accounted for, such as the presence of endangered species or archeological sites. FracTracker previously produced a guide to pipeline surveying, which can be found here.
The process of finding a viable pipeline route can undergo dozens of revisions and take months or years to complete. The example image seen below, taken from our interactive map at the top of the page, shows a few of the many different 50ft. ROWs considered by Shell. These were documented every few months as the data changed.
A section of the Falcon route with prior routes considered
The most recent route is highlighted in red, totaling 97.5 miles (Shell’s original press releases stated 94 miles). Segments that represent alternative routes considered in certain places are shown in blue (these earlier divergences total 19 miles). Other areas surveyed at some point in the process are shown in dotted purple (totaling 91.3 miles). Given that the route has changed very little in recent months, as well as the fact that Shell has submitted their permit applications for project, we believe that the route in red is likely the route proposed to regulatory agencies.
Note that, in the interactive map, there is an additional “Air Liquide” pipeline (this is the name of a gas products company) proposed by Shell that will run from the ethane cracker south for about .5 miles. Based on comments made by Shell at public hearings, we assume this will be a nitrogen pipeline feeding the plant from an unknown source.
Acquiring Easements
Perhaps the most significant factor that can determine a pipeline route is finding landowners amenable to having their land surveyed and, ultimately, willing to sign easements to allow the pipeline on their property. In some instances, pipeline companies can be granted eminent domain as a “public utility” to take land by force (ME2). However, Shell has stated publicly that eminent domain in not an option for Falcon, due to the fact that the pipeline services a private facility. FracTracker previously produced a guide for landowners who might be approached by pipeline operators seeking to survey their properties.
The Falcon pipeline will have a permanent ROW of 50ft that will cross 10 municipalities in Pennsylvania, 12 townships in Ohio, as well as northern Hancock County, West Virginia. More than 2,000 individual parcels of land were surveyed across this region. Of those 2,000, Shell approached landowners for 765 unique parcels at some point in the process to obtain easements, either for the pipeline ROW itself or for access roads.
To date, Shell has executed 572 easements. Of these, 469 will be needed to execute the current proposed route. However, as of this time, 14 parcels along the proposed route are still listed as “landowner contacted,” meaning that the easement has not yet been executed. The image below is a page from Shell’s permit applications to the PA DEP listing properties pending in Pennsylvania.
Pending PA easements from Shell’s permit applications
Media sources have reported on some of the details of Shell’s Pipeline easement agreements. In some instances, contracts stated a transactional price of $10 per linear foot as a “placeholder” to get the process started. In other cases, Shell has paid landowners as much as $75 per linear foot of pipeline. These agreements also state that Shell reserved the right to “lay, construct, test, maintain, inspect, operate, repair, renew, relocate, replace, substitute, change the size of, upgrade, alter, mark, protect and remove or abandon in place” any pipelines on the property. Below is an example of how our interactive map represents these parcels and their status. For instance, executed easements are in green and pending or stalled agreements in yellow.
Parcels along the Falcon route and their easement status
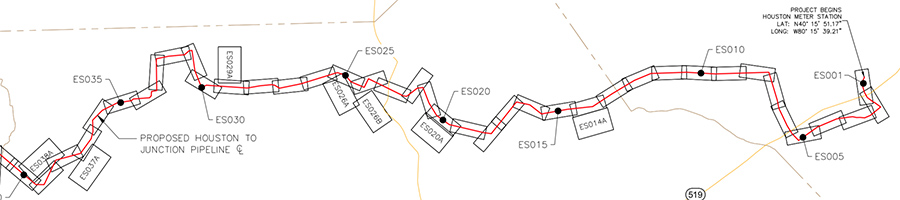
Valves & Metering Stations
Pipelines require a number of facilities to properly manage the flow and pressure of gas from one end of the line to another. For instance, metering stations are installed to measure how much gas is in the pipeline system at given points. Falcon has five “pads” where metering stations will be located. Three of these are co-located at the origin points of the pipeline (the MarkWest separator facilities) and a fourth at the ethane cracker end-point. However, the fifth meter stations will be located where the two legs of the pipeline meet in northeast Raccoon Township, Beaver County, PA. This site is called the “Junction” meter pad.
Shut-off valves will also placed along the route—18 in all for Falcon—in order to section off lengths of the pipeline that can be turned off as needed. These valves will be located at fairly regular intervals of 8-10 miles in most places, but are also found just before and after sensitive locations, such as the Oho River crossing and areas and where the lines juncture.
The Risks of Proximity
Metering stations and shut-off valves bring particular risks. For instance, when valves are closed at a section of pipeline for maintenance, or in the event of an emergency, excess gasses must vented to relieve pressure. This is one reason why communities have become concerned about the location of these facilities, such as with a Mariner East 2 pipeline valve in West Goshen Township, PA. Similarly, the Falcon pipelines’ valve in New Somerset, OH, is especially close to residential areas, seen below.
A proposed Falcon shut-off valve site in New Somerset, Ohio
Workspaces & Access Roads
Finally, pipeline operators must identify in their permit applications the “workspace” needed for construction. Shell’s temporary ROW for workspace is approximately 100ft in most stretches along the Falcon’s route, similar to what is shown in the image below. Site-specific conditions, such as road, railroad crossings, and buildings make the workspace narrower in some instances, but much larger workspaces will be needed around sites like metering stations and shut-off valves.
A typical pipeline workspace; this one from the Mariner East 2
The locations of access roads must also be identified in permit applications. Access roads come in two categories and typically require a 25ft ROW. Temporary access roads are used during the construction process and often utilize existing private driveways, farm roads, or are built after clearing land acquired in the easement process. Permanent roads allow long-term access to facilities, such as valves and pumping stations, as well as for bringing in equipment to maintain the pipeline’s ROW. Shell’s plan proposes 111 temporary access roads (28 miles) and 21 permanent access roads (2.3 miles).
Shell’s permit applications state that the total disturbed workspace needed for construction and access roads is approximately 1,273 acres. About half of this will remain cleared for the permanent right-of-way and permanent access roads.
A Closer Look
When a pipeline project is subject to regulatory review, alternative routes are typically offered up by the operator for consideration in weighing different costs and benefits. Major reroutes typically deviate from the proposed route for significant distances in order to avoid significant impediments such as large cities or protected lands. Minor alternatives are shorter in length and used to avoid specific areas of concern, such as a protected wetland. An alternative route might also be selected in order to utilize an existing ROW from other pipelines.
Ohio River Crossing
As noted, there are a number of places along the Falcon route where we see examples of major route changes. Many of these reroutes appear to be due to landowners along the preferred path not signing easements for one reason or another. One of the more significant change occurred at the location where the Falcon crosses the Ohio River in Hancock County, West Virginia, seen below. For many months, Shell’s maps showed a planned crossing south of the current proposed route, but later took a dramatic diversion to the north, apparently due to an easement not having been executed for a single property. What is notable about the new route is that it utilizes property owned by the popular Mountaineer Casino, Racetrack, and Resort.
The current and former Falcon route crossing the Ohio River
Fort Cherry Golf Course Reroute
In another instance, we see a reroute near the Fort Cherry Golf Course in McDonald, Washington County, PA. An earlier route took the Falcon straight through the course, whereas the current proposed route goes further east, disrupting a smaller number of fairways. Notice in the image below that a temporary access road for the pipeline’s construction will also still utilize Fort Cherry Golf Course’s driveway.
The current and former Falcon routes crossing the Ft. Cherry Golf Course
Montour Trail Intersections
Finally, we bring attention to what appears to be some of the few remaining properties with easements not yet settled in order to begin construction. As noted in the excerpt from Shell’s permit application at the top of this page, a number of parcels owned by the Montour Trail Council have a status of: “in negotiation and depended on submitted crossing permit applications,” presumably meaning they would agree to the easement if PA DEP approved Shell’s permits.
Falcon intersections with the Montour Trail
The Montour Trail is a 46-mile long multi-use non-motorized recreational rail-trail located in Washington and Allegheny County, PA, used by more than 400,000 people annually. It also makes up part of the Great Allegheny Passage (GAP), a trail system that stretches over 335 miles from Pittsburgh to Washington, DC. The trail is managed by the nonprofit Montour Trail Council with support from state agencies such as the Pennsylvania Department of Conservation and Natural Resources (DCNR).
We were surprised to find that the Montour Trail will be crossed by the Falcon in 9 locations: 5 by the pipeline itself, 3 by temporary access roads, and 1 by a permanent access road, as illustrated in the image above. Two of the pipeline intersections will be executed using HDD boring. The trail and its intersection with the Falcon can be seen by activating these layers on FracTracker’s interactive map, as illustrated in the image above.
In this section of the Falcon Public EIA Project, we explore the hydrological and geological conditions of the pipeline’s construction areas. We first identify the many streams, wetlands, and ponds the Falcon must cross, as well as describe techniques Shell will likely use in these water crossings. The second segment of this section highlights how the areas in the Falcon’s path are known for their complex geological features, such as porous karst limestone and shallow water tables that can complicate construction.
Quick Falcon Facts
Intersects 319 streams; 361 additional streams located only 500ft from construction areas
Intersects 174 wetlands; 470 additional wetlands located only 500ft from construction areas
Majority of crossings will be open cuts and dry-ditch trenching
A total of 19 horizontal directional drilling (HDD) sites; 40 conventional boring sites
25 miles of pipeline overlap karst limestone formations, including 9 HDD sites
240 groundwater wells within 1/4 mile of the pipeline; 24 within 1,000ft of an HDD site
Map of Falcon water crossings and hazards
The following map will serve as our guide in breaking down the Falcon’s risks to water bodies. Expand the map full-screen to explore its contents in greater depth. Some layers only become visible as you zoom in. A number of additional features of the map are not shown by default, but can be turned on in the “layers” tab. These include information on geological features, water tables, soil erosion characteristics, as well as drinking reservoir boundaries. Click the “details” tab in full-screen mode to read how the different layers were created.
The parts of Pennsylvania, West Virginia, and Ohio where the Falcon pipeline will be built lie within the Ohio River Basin. This landscape contains thousands of streams, wetlands, and lakes, making it one of the most water rich regions in the United States. Pipeline operators are required to identify waters likely to be impacted by their project. This two-step process involves first mapping out waters provided by the U.S. Geological Survey’s national hydrological dataset. Detailed field surveys are then conducted in order to locate additional waters that may not yet be accounted for. Many of the streams and wetlands we see in our backyards are not represented in the national dataset because conditions can change on the ground over time. Yet, plans for crossing these must also be present in pipeline operator’s permit applications.
Streams
Streams (and rivers) have three general classifications. “Perennial” streams flow year-round, are typically supplied by smaller up-stream headwaters, and are supplemented by groundwater. In a sense, the Ohio River would be the ultimate perennial stream of the region as all smaller and larger streams eventually end up there. “Intermittent” streams flow for only a portion of the year and are dry at times, such as during the summer when water tables are low. Finally, “ephemeral” streams flow only during precipitation events.
These classifications are important because they can determine the extent of aquatic habitat that streams can support. Working in streams that have no dry period can put aquatic lifeforms at elevated risk. For this and other reasons, many states further designate streams based on their aquatic life “use” and water quality. In Pennsylvania, for instance, the PA DEP uses the designations: Warm Water Fishes (WWF), Trout Stocked (TSF), Cold Water Fisheries (CWF) and Migratory Fishes (MF). Streams with exceptional water quality may receive an additional designation of High Quality Waters (HQ) and Exceptional Value Waters (EV).
Wetlands
Similar to streams, wetlands also have unique designations. These are based on the U.S. Fish and Wildlife Services’ national wetlands inventory. Wetlands are generally defined as “lands transitional between terrestrial and aquatic systems where the water table is usually at or near the surface or the land is covered by shallow water.” As such, wetlands are categorized by their location (such as a tidal estuary or an inland wetland that lacks flowing water), its substrate (bedrock, sand, etc.), and plant life that might be present. While there are hundreds of such categories, only four pertain to the wetlands present in the regions where the Falcon pipeline will be built. Their designations roughly translate to the following:
Palustrine Emergent (PEM): Marshes and wet meadows hosting perennial small trees, shrubs, mosses, or lichens
Palustrine Shrub (PSS): Similar to PEMs, but characterized by also having well-established shrubs
Palustrine Forested (PFO): Similar to PEMs and PSSs, but having trees larger than 6 meters high
Palustrine Unconsolidated Bottom (PUB) and Palustrine Opem Water (POW) (aka ponds)
Pipeline operators are required to report the crossing length of each wetland they will encounter, as well as the area of permanent and temporary disturbance that would occur in each of these wetlands. When building the pipeline, operators are required to ensure that all measures are taken to protect wetlands by minimizing impacts to plant life, as well as by taking “upland protective measures” to prevent sedimentation runoff during precipitation events. When undergoing FERC EIA scrutiny, operators are also required to limit the width of wetland construction areas to 75 feet or less.
Crossing Methods
Open-Cut Trenching
Pipeline operators use a variety of methods when crossing streams, wetlands, and ponds. Shorter length crossings often employ a rudimentary trench. After the cuts, construction crews attempts to repair damage done in the process of laying the pipeline. For longer crossings, operators can use boring techniques to go underneath water features.
Open-cut trenching
There are two general types of trenches. The first, “open-cut” crossings, are typically used for smaller waterbodies, such as in intermittent streams where flow may not be present during time of construction, or when construction can be completed in a short period of time (typically 24-48 hours). In this process, a trench is laid through the water body without other provisions in place.
The second type, “dry-ditch” crossing, are required by FERC for waterbodies up to 30 feet wide “that are state-designated as either coldwater or significant coolwater or warmwater fisheries, or federally-designated as critical habitat.” In these spaces, pumps are used to transfer stream flow around the area where trenching occurs. In places where sensitive species are present, dry-ditches must include a flume to allow these species to pass through the work area.
Conventional Boring
Conventional boring consists of creating a tunnel for the pipeline to be installed below roads, waterbodies, and other sensitive resources. Bore pits are excavated on either sides of the site. A boring machine is then used to tunnel under the resource and the pipeline is pushed through the bore hole.
Horizontal Directional Drilling
In more difficult or lengthy crossings, operators may choose to bore under a water feature, road, or neighborhood. Horizontal directional drilling (HDD) involves constructing large staging areas on either side of the crossing. A large drill bit is piloted through the ground along with thousands of gallons of water and bentonite clay for lubricant (commonly referred to as drilling muds). HDDs are designed to protect sensitive areas, but operators prefer not to use them as HDDs can be expensive and require in-depth planning in order for things to go well.
Bentonite sediment pollutes a stream at a Mariner East HDD spill site
(source: Washington, PA, Observer-Reporter)
An example of what happens when things are rushed can be seen in Sunoco’s Mariner East 2 pipeline. The PA DEP has cited Sunoco for over 130 inadvertent returns (accidental releases of drilling muds) since construction began. These spills led to damaged water wells and heavy sedimentation in protected streams, as exemplified in the image above. Making matters worse, Sunoco later violated terms of a settlement that required them to re-survey before recommencing construction. See FracTracker’s article on these spills.
Footprint of the Falcon
The overwhelming majority of Falcon’s water body crossings will be executed with either open-cut or dry-ditch methods. There are 40 locations where conventional boring will be used, but only a 3 are used for crossing water resources. Shell intends to use 19 HDDs and, of these, only 13 are used for crossing water bodies of some kind (the longest of which crosses the Ohio River). All other conventional and HDD boring locations will be used to cross under roads and built structures. This is not entirely unusual for pipelines. However, we noted a number of locations where one would expect to see HDDs but did not, such as in the headwaters of the Ambridge and Tappen Reservoirs, as was seen in the images above.
Stream Impacts
Shell identified and/or surveyed a total of 993 stream sections in planning for the Falcon’s construction. As shown on FracTracker’s map, the pipeline’s workspace and access roads will directly intersect 319 of these streams with the following classifications: perennial (96), ephemeral (79), and intermittent (114). An additional 361 streams are located only 500ft from construction areas.
A number of these streams have special designations assigned by state agencies. For instance, in Pennsylvania, we found 10 stream segments listed as Trout Stocked (TS), which are shown on our interactive map.
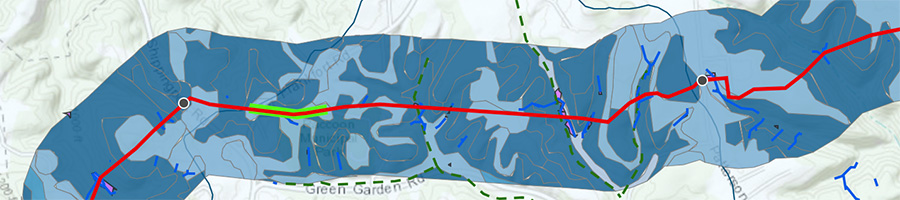
Crossing HQ headwater streams of the Ambridge Reservoir
Perhaps more concerning, the Falcon will cross tributaries to the Service Creek watershed 13 times. These feed into three High Quality Cold Water Fishes (HQ/CWF) headwater streams of the Ambridge Reservoir in Beaver County, PA, shown in the image above. They also support the endangered Southern Redbelly Dace (discussed in greater depth here). On the eastern edge of the watershed, the Falcon will cross the raw water line leading out of the reservoir.
The reservoir supplies 6.5 million gallons of water a day to five townships in Beaver County (Ambridge, Baden, Economy, Harmony, and New Sewickley) and four townships in Allegheny County (Leet, Leetsdale, Bell Acres & Edgeworth). This includes drinking water services to 30,000 people.
We found a similar concern in Ohio where the Falcon will cross protected headwaters in the Tappan Reservoir watershed at six different locations. The Tappan is the primary drinking water source for residents in Scio. Below is a page from Shell’s permit applications to the PA DEP outlining the crossing of one of the Ambridge Reservoir’s CWF/HQ headwater streams.
Wetland Impacts
Shell identified a total of 682 wetland features relevant to Falcon’s construction, as well as 6 ponds. Of these, the pipeline’s workspace and access roads will directly intersect 174 wetlands with the following classifications: PEM (141), PSS (13), PFO (7), PUB (10), POW (3). An additional 470 of these wetlands, plus the 6 ponds, are located only 500ft from construction areas.
Example 1: Lower Raccoon Creek
A few wetland locations stand out as problematic in Shell’s construction plans. For instance, wetlands that drain into Raccoon Creek in Beaver County will be particularly vulnerable in two locations. The first is in Potter Township, where the Falcon will run along a wooded ridge populated by half a dozen perennial and intermittent streams that lead directly to a wetland of approximately 14 acres in size, seen below. Complicating erosion control further, Shell’s survey data shows that this ridge is susceptible to landslides, shown in the first map below in dotted red.
Landslide areas along Raccoon Creek wetlands and streams
This area is also characterized by the USGS as having a “high hazard” area for soil erosion, as seen in this second image. Shell’s engineers referenced this soil data in selecting their route. The erosion hazard status within 1/4 mile of the Falcon is a layer on our map and can be activated in the full-screen version.
High erosion hazard zones along Raccoon Creek
Shell’s permit applications to the PA DEP requires plans be submitted for erosion and sedimentation control of all areas along the Falcon route. Below are the pages that pertain to these high hazard areas.
Example 2: Independence Marsh
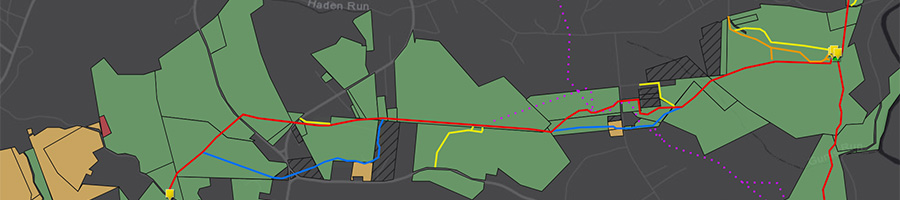
The other wetland area of concern along Raccoon Creek is found in Independence Township. Here, the Falcon will go under the Creek using horizontal drilling (highlighted in bright green), a process discussed in the next section. Nevertheless, the workspace needed to execute the crossing is within the designated wetland itself. An additional 15 acres of wetland lie only 300ft east of the crossing but are not accounted for in Shell’s data.
This unidentified wetland is called Independence Marsh, considered the crown jewel of the Independence Conservancy’s watershed stewardship program. Furthermore, the marsh and the property where the HDD will be executed are owned by the Beaver County Conservation District, meaning that the CCD signed an easement with Shell to cross publicly-owned land.
Independence Marsh, unidentified in Shell’s survey data
Groundwater Hazards
The Falcon’s HDD locations offer a few disturbing similarities to what caused the Mariner East pipeline spills. Many of Sunoco’s failures were due to inadequately conducted (or absent) geophysical surveys prior to drilling that failed to identify karst limestone formations and shallow groundwater tables, which then led to drilling muds entering nearby streams and groundwater wells.
Karst Limestone
Karst landscapes are known for containing sinkholes, caves, springs, and surface water streams that weave in and out of underground tunnels. Limestone formations are where we are most likely to see karst landscapes along the Falcon’s route.
In fact, more than 25 of the Falcon’s 97 pipeline miles will be laid within karst landscapes, including 9 HDD sites. However, only three of these HDDs sites are identified in Shell’s data as candidates for potential geophysical survey areas. The fact that the geology of the other 10 HDD sites will not be investigated is a concern.
One site where a geophysical survey is planned can be seen in the image below where the Falcon crosses under PA Highway 576. Note that this image shows a “geological formations” layer (with limestone in green). This layer shows the formation types within 1/4 mile of the Falcon and can activated in the full-screen version of our interactive map.
A potential HDD geophysical survey area in karst limestone
Water Tables
We also assessed the Falcon’s HDDs relative to the groundwater depths and nearby private groundwater wells. The USGS maintains information on minimum water table depths at different times of the year. In the image below we see the optional “water table depth” layer activated on the FracTracker map. The groundwater at this HDD site averages 20ft on its western side and only 8ft deep on the eastern side.
Shallow groundwater and private wells near a planned HDD site
Groundwater Wells
Also seen in the above image is the “groundwater wells” layer from the FracTracker map. We found 240 private water wells within 1/4 mile of the Falcon. This data is maintained by the PA Department of Natural Resources as well as by the Ohio Department of Natural Resources. Comparable GIS data for West Virginia were not readily available thus not shown on our map.
While all of these wells should be assessed for their level of risk with pipeline construction, the subset of wells nearest to HDD sites deserve particular attention. In fact, Shell’s data highlights 24 wells that are within 1,000 feet of a proposed HDD site. We’ve isolated the groundwater wells and HDD sites in a standalone map for closer inspection below. The 24 most at-risk wells are circled in blue.
In this segment of the Falcon Public EIA Project we begin to explore the different ways that pipelines are assessed for potential risk to populated areas. We outline a methods dictated by the Pipeline and Hazardous Materials Safety Administration (PHMSA) called Class Locations. This methods identifies occupied structures in proximity to a pipeline.
Quick Falcon Facts
67% of the Falcon route will qualify as Class 1, 27% as Class 2, and 3% as Class 3.
More than 557 single family residences and 20 businesses within 660ft of the pipeline.
Three recreational parks and a planned luxury housing development also at risk.
Map of Falcon Class Locations
The following map will serve as our guide in breaking down the Falcon’s Class Locations. Expand the map full-screen to explore its contents in greater depth. Some layers only become visible as you zoom in. A number of additional layers are not shown by default, but can be turned on in the “layers” tab. Click the “details” tab in full-screen mode to read how the different layers were created.
Pipeline “Class locations” determine certain aspects of how a pipeline is constructed. Essentially, a pipeline’s route is segmented into lengths that are each given different classifications as outlined in PHMSA guidelines. In general terms, a segment’s Class is established by first calculating a buffer that extends 220 yards (660ft) on either side of the pipeline’s center in 1-mile continuous lengths. This buffer area is then analyzed for how many building structures are present. Classes are then assigned to each 1-mile segment using the follow criteria:
Class 1: a segment with 10 or fewer buildings intended for human occupancy
Class 2: a segment with more than 10, but less than 46 buildings intended for human occupancy
Class 3: a segment with 46 or more buildings intended for human occupancy, or where the pipeline lies within 100 yards of any building, or small well-defined outside area occupied by 20 or more people on at least 5 days a week for 10 weeks in any 12-month period (i.e. schools, businesses, recreation areas, churches)
Class 4: a segment where buildings with four or more stories aboveground are prevalent
The finer details of these calculations and their adjustments are complex, however. For instance, Class locations can be shortened to less than 1-mile lengths if building densities change dramatically in an certain area. The example image below shows one of the ways available to operators for doing this, called the “continuous sliding” method:
Calculating Class Locations
(source: PHMSA)
Class location designations may also be adjusted over time as densities change. For instance, if new homes were built in proximity to a previously constructed pipeline, the operator may be required to reduce their operating pressure, strengthen the pipeline, or conduct pressure tests to ensure the segment would technically meet the requirements of a higher Class. Alternatively, operators can apply for a special permit to avoid such changes.
What Class Locations Dictate
Pipeline segments with higher Classes must meet more rigorous safety standards, which are enforced either by PHMSA or by their state equivalent, such as the Pennsylvania Utility Commission. These include:
Soil depth: Class 1 locations must be installed with a minimum soil depth of 30 inches (18 inches in consolidated rock). Class 2, 3, and 4 locations require a minimum soil depth of 36 inches (24 inches in consolidated rock)
Shut-off valves: Class locations determine the maximum distance from shut-off valves to populated areas, as follows: Class 1 (10 miles), Class 2 (7.5 miles), Class 3 (4 miles), and Class 4 (2.5 miles).
Operating pressure: Classes also regulate the maximum allowable operating pressure (MAOP) of pipeline segments
Structural integrity: Classes determine where thicker walled materials must be used to withstand higher pressures, as well as different structural testing methods used in safety inspections
By replicating the 600 foot buffer from the Falcon’s centerline (used as the standard distance for determining Class Locations) we found that 67% of the Falcon route will qualify as Class 1, 27% as Class 2, and 3% as Class 3. These are represented on our interactive maps as green, yellow, and orange segments, respectively. An additional segment is marked as having an “unknown” Class on our maps (shaded in gray). This is the stretch crossing the Ohio River, where Shell’s Class location analysis has not been updated to reflect the route change that occurred in the summer of 2017.
Residential Structures
In total, there are 557 single family residences, 20 businesses, and a church within the 660ft buffer. Shell’s data also identify non-occupied structures along the route, such as sheds, garages, and other outbuildings. There are 535 such structures, but we did not have the time to replicate the locations of these sites. It is also important to note that the points on our interactive map represent only those identified by Shell, which we believe is an incomplete assessment of occupied structures based on our quick review of satellite maps.
Three residential structures lie directly within the 50-foot right-of-way. One of these homes, located in a Class 2 segment in Independence Township, is shown below. The Falcon will come as close as 20 feet to the edge of the structure and surround the home on three sides.
An occupied residence in the right-of-way
Neighborhoods in the following five communities account for the entirety of Falcon’s Class 3 locations. These would be considered the most “at risk” areas along the route in terms of proximity to the number of occupied structures. For instance, below is a satellite view of the Class 3 section of Raccoon Township.
Rumley Township, Harrison OH
Knox Township, Jefferson County OH
Raccoon Township, Beaver County PA
Independence Township, Beaver County PA
Mount Pleasant Township, Washington County PA
Raccoon Township residences & Municipal Park in a Class 3
Recreational Areas
In the above image we also see the location of Raccoon Township Municipal Park (in purple), home to a number of ballfields. Two similar recreation areas are located in the 660ft Class Location buffer: Mill Creek Ballpark, in Beaver County PA, and Clinton Community Park, in Allegheny County PA.
However, the Raccoon Township park is notable in that the Falcon cuts directly through its property boundary. Shell intends to bore under the park using HDD techniques, as stated in their permit applications, “to avoid disturbance to Beaver County baseball field/recreational park,” also stating that, “this HDD may be removed if the recreational group will allow laying the pipeline along the entrance roadway.”
New Housing Developments
One discovery worth attention is that the Falcon runs straight through an under-construction luxury housing development. Located in Allegheny County, PA, its developer, Maronda Homes, bills this growing community as having “picturesque landscapes, waterfront views and a peaceful collection of homes.” Shell mentions this development in their permit applications, stating:
Maronda Homes is in the planning and design stage of a very large housing development and SPLC [Shell Pipeline LC] worked closely with the developer and the Project was rerouted to avoid most of the housing sites.
It stands to reason that this neighborhood will eventually rank as one of the densest Class 3 areas along the Falcon route. Whether or not the pipeline is updated with higher safety standards as a result remains to be seen. The image below illustrates where the Falcon will go relative to lots marked for new homes. This property lots diagram was obtained from Shell’s GIS data layer and can be viewed on the FracTracker interactive map as well.
The Falcon intersects a luxury home development
1/31/18 Note: the Pittsburg Post-Gazette obtained newer lot line records for a portion of the Maronda Farms during their investigation into this story. These new records appear to have some alterations to the development, as seen below.
Maronda Farms, updated lot lines
Issues with Setbacks
There are no setback restrictions for building new homes in proximity to a pipeline. Parcels will eventually be sectioned off and sold to home buyers, begging the question of whether or not people in this community will realize a hazardous liquid pipeline runs past their driveways and backyards. This is a dilemma that residents in a similar development in Firestone, Colorado, are now grappling with following a recent pipeline explosion that killed two people, seen below, due to inadequate building setbacks.
A pipeline explodes in a Colorado home development
(source: InsideEnergy, CO)
Interestingly, we researched these same Maronda Farms parcels in FracTracker’s Allegheny County Lease Mapping Project only to discover that Maronda Homes also auctioned off their mineral rights for future oil and gas drilling. New homeowners would become victims of split-estate, where drilling companies can explore for oil and gas without having to seek permission from property owners, amplifying their level of risk.


