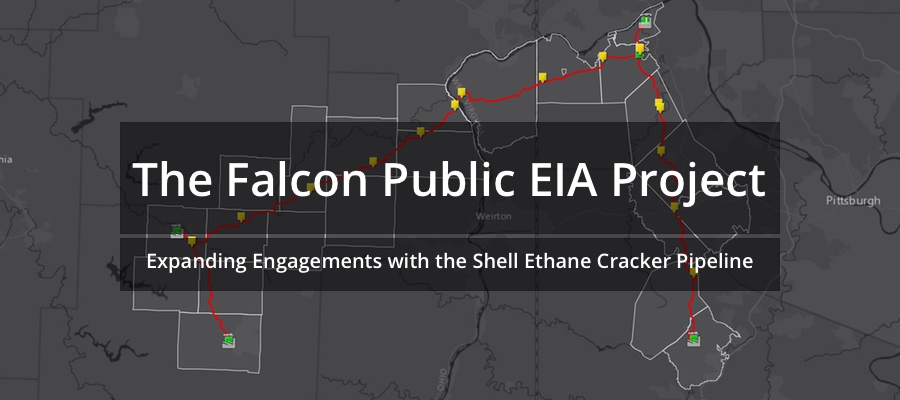
The Falcon: High Consequence Areas & Potential Impact Zones
Part of the Falcon Public EIA Project
In this segment of the Falcon Public EIA Project we continue to explore the different ways that pipelines are assessed for potential risk – in this case, relative to population centers, drinking water systems, and sensitive habitats. We outline methods dictated by the Pipeline and Hazardous Materials Safety Administration (PHMSA) called “high consequence areas” (HCAs) and how they determine potential impact zones for highly volatile liquid (HVL) pipelines. These methods are then applied to the Falcon to understand its possible dangers.
Quick Falcon Facts
Map of Falcon High Consequence Areas
The following map will serve as our guide in breaking down the Falcon’s High Consequence Areas. Expand the map full-screen to explore its contents in greater depth. Some layers only become visible as you zoom in. A number of additional layers are not shown by default, but can be turned on in the “layers” tab. Click the “details” tab in full-screen mode to read how the different layers were created.
View Map Fullscreen | How FracTracker Maps Work
High Consequence Areas
While Class Locations, discussed in a prior project article, dictate the construction and maintenance of a pipeline, high consequence areas (HCAs) designate when operators must implement integrity management programs (IMP) where pipeline failures could cause major impacts to populated areas, as well as drinking water systems and ecological resources — otherwise defined as unusually sensitive areas (USAs).
Populated Areas
Two considerations are used when determining pipeline proximity to population centers:
- High Population Areas – an urbanized area delineated by the Census Bureau as having 50,000 or more people and a population density of at least 1,000 people per square mile; and
- Other Populated Areas – a Census Bureau designated “place” that contains a concentrated population, such as an incorporated or unincorporated city, town, village, or other designated residential or commercial area – including work camps.
USAs: Drinking Water
PHMSA’s definition of drinking water sources include things such as:
- Community Water Systems (CWS) – serving at least 15 service connections and at least 25 year-round residents
- Non-transient Non-community Water Systems (NTNCWS) – schools, businesses, and hospitals with their own water supplies
- Source Water Protection Areas (SWPA) for a CWS or a NTNCWS
- Wellhead Protection Areas (WHPA)
- Sole-source karst aquifer recharge areas
These locations are typically supplied by regulatory agencies in individual states.
With the exception of sole-source aquifers, drinking water sources are only considered if they lack an alternative water source. However, PHMSA is strict on what alternative source means, stating that they must be immediately usable, of minimal financial impact, with equal water quality, and capable of supporting communities for at least one month for a surface water sources of water and at least six months for a groundwater sources.
One very important note in all of these “drinking water” USA designations is that they do not include privately owned groundwater wells used by residences or businesses.
USAs: Ecological Resource
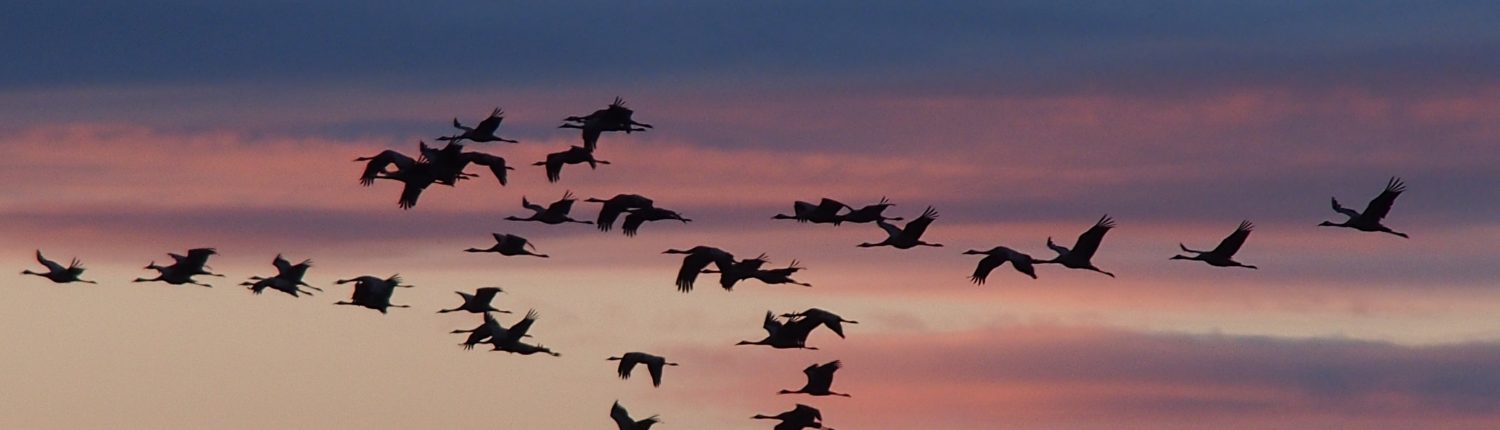
Ecological resource areas are established based on any number of qualities with different variations. In general terms, they contain imperiled, threatened, or endangered aquatic or terrestrial species; are known to have a concentration of migratory waterbirds; or are a “multi-species assemblage” area (where three or more of the above species can be found).
Calculating HCAs
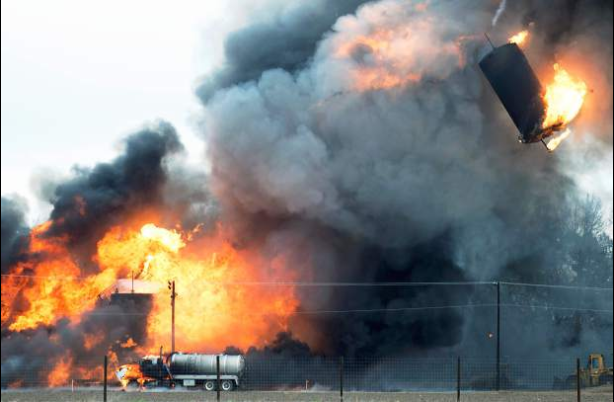
Like Class locations, HCAs are calculated based on proximity. The first step in this process is to determine the pipeline’s Potential Impact Radius (PIR) — the distance beyond which a person standing outdoors in the vicinity of a pipeline rupture and fire would have a 99% chance of survival; or in which death, injury, or significant property damage could occur. PIR is calculated based on the pipeline’s maximum allowable operating pressure (MAOP), diameter, and the type of gas. An example of this calculation is demonstrated in FracTracker’s recent article on the Mariner East 2 pipeline’s PIR.
Once the PIR is known, operators then determine HCAs in one of two ways, illustrated in the image below:
- Method 1: A Class 3 or Class 4 location, or a Class 1 or Class 2 location where “the potential impact radius is greater than 660 feet (200 meters), and the area within a potential impact circle contains 20 or more buildings intended for human occupancy”; or a Class 1 or Class 2 location where “the potential impact circle contains an “identified site.”
- Method 2: An area within PIR containing an “identified site” or 20 or more buildings intended for human occupancy.

In these definitions, “identified sites” include such things as playgrounds, recreational facilities, stadiums, churches, office buildings, community centers, hospitals, prisons, schools, and assisted-living facilities. However, there is a notable difference in how HCAs are calculated for natural gas pipelines vs. hazardous liquid pipelines.
Beyond just looking at what lies within the PIR, pipelines that contain gasses such as ethane potentially impact a much broader area as vapors flow over land or within a river, stream, lake, or other means. A truly accurate HCA analysis for an ethane pipeline leak requires extensive atmospheric modeling for likely vapor dispersions, such as seen in the example image below (part of a recent ESRI GIS conference presentation).

What HCAs Dictate
HCAs determine if a pipeline segment is included in an operator’s integrity management program (IMP) overseen by PHMSA or its state equivalent. IMPs must include risk assessments that identify the most likely impact scenarios in each HCA, enhanced management and repair schedules, as well as mitigation procedures in the event of an accident. Some IMPs also include the addition of automatic shut-off valves and leak detection systems, as well as coordination plans with local first responders.
The Falcon Risk Zones
Shell’s permit applications to the PA DEP state the pipeline:
…is not located in or within 100 feet of a national, state, or local park, forest, or recreation area. It is not located in or within 100 feet of a national natural landmark, national wildlife refuge, or federal, state, local or private wildlife or plant sanctuaries, state game lands. It is also not located in or within 100 feet of a national wild or scenic river, the Commonwealth’s Scenic Rivers System, or any areas designated as a Federal Wilderness Area. Additionally, there are no public water supplies located within the Project vicinity.
This is a partial truth, as “site” and “vicinity” are vague terms here. A number of these notable areas are within the PIR and HCA zones. Let’s take a closer look.
The PIR (or “Blast Zone”)
![]() Shell’s permit applications state a number of different pipeline dimensions will be used throughout the project. Most of the Falcon will be built with 12-inch steel pipe, with two exceptions: 1) The segment running from the Cadiz, OH, separator facility to its junction with line running from Scio, OH, will be a 10-inch diameter pipe; 2) 16-inch diameter pipe will be used from the junction of the Falcon’s two main legs located four miles south of Monaca, PA, to its end destination at the ethane cracker. We also know from comments made by Shell in public presentations that the Falcon’s maximum allowable operating pressure (MOAP) will be 1,440 psi. These numbers allow us to calculate the Falcon’s PIR which, for a 16″ ethane pipeline at 1,440psi, is about 940 feet. We’ve termed this the “blast zone” on our maps.
Shell’s permit applications state a number of different pipeline dimensions will be used throughout the project. Most of the Falcon will be built with 12-inch steel pipe, with two exceptions: 1) The segment running from the Cadiz, OH, separator facility to its junction with line running from Scio, OH, will be a 10-inch diameter pipe; 2) 16-inch diameter pipe will be used from the junction of the Falcon’s two main legs located four miles south of Monaca, PA, to its end destination at the ethane cracker. We also know from comments made by Shell in public presentations that the Falcon’s maximum allowable operating pressure (MOAP) will be 1,440 psi. These numbers allow us to calculate the Falcon’s PIR which, for a 16″ ethane pipeline at 1,440psi, is about 940 feet. We’ve termed this the “blast zone” on our maps.
The HCA (or “Vapor Zone”)
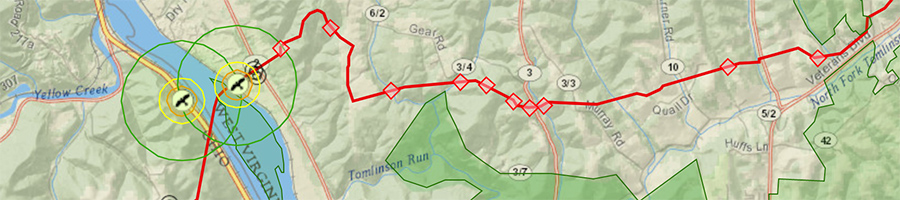
![]() Shell’s analysis uses an HCA impact radius of 1.25 miles. This much larger buffer reflects the fact that vapors from hazardous liquid pipelines can travel unpredictably at high concentrations for long distances before ignition. This expanded buffer might be called the “vapor zone,” a term we used on our map. Within the HCA “vapor zone” we find that 60 of the Falcon’s 97 miles qualify as high consequence areas, with 35 miles triggered due to their proximity to drinking water sources, 25 miles trigger for proximity to populated areas, and 3 miles for proximity to ecological areas.
Shell’s analysis uses an HCA impact radius of 1.25 miles. This much larger buffer reflects the fact that vapors from hazardous liquid pipelines can travel unpredictably at high concentrations for long distances before ignition. This expanded buffer might be called the “vapor zone,” a term we used on our map. Within the HCA “vapor zone” we find that 60 of the Falcon’s 97 miles qualify as high consequence areas, with 35 miles triggered due to their proximity to drinking water sources, 25 miles trigger for proximity to populated areas, and 3 miles for proximity to ecological areas.
Populated Areas
Shell’s HCA buffer intersects 14 US Census-designated populated areas, shown in the table below. Falcon’s right-of-way directly intersects two of these areas: Cadiz Village in Harrison County, Ohio, and Southview CDP (Census Designated Place) in Washington County, PA. These areas are listed below. Additionally, we included on the FracTracker map the locations of public facilities that were found inside the HCA buffer. These include 5 public schools, 6 daycare centers, 10 fire stations, and 6 EMS stations.
| Area | Population | State | HCA |
| Pittsburgh Urbanized Area | High | PA | Indirect |
| Weirton-Steubenville Urbanized Area | High | WV/OH/PA | Indirect |
| Scio Village | Other | OH | Indirect |
| Cadiz Village* | Other | OH | Direct |
| Amsterdam Village | Other | OH | Indirect |
| Shippingport Borough | Other | PA | Indirect |
| Industry Borough | Other | PA | Indirect |
| Hookstown Borough | Other | PA | Indirect |
| Midway Borough | Other | PA | Indirect |
| Clinton CDP | Other | PA | Indirect |
| Imperial CDP | Other | PA | Indirect |
| Southview CDP* | Other | PA | Direct |
| Hickory CDP | Other | PA | Indirect |
| Westland CDP | Other | PA | Indirect |
| * Indicates an area the Falcon’s right-of-way will directly intersect | |||
While it is difficult to determine the actual number of people living in the PIR and HCA vapor zone, there are ways one can estimate populations. In order to calculate the number of people who may live within the HCA and PIR zones, we first identified U.S. Census blocks that intersect each respective buffer. Second, we calculated the percentage of that census block’s area that lies within each buffer. Finally, we used the ratio of the two to determine the percentage of the block’s population that lies within the buffer.
![]() Based on 2010 Census data, we estimate that 2,499 people live within a reasonable projection of the Falcon’s PIR blast zone. When expanded to the HCA vapor zone, this total increases to 8,738 people. These numbers are relatively small compared to some pipelines due to the fact that a significant portion of the Falcon runs through fairly rural areas in most places.
Based on 2010 Census data, we estimate that 2,499 people live within a reasonable projection of the Falcon’s PIR blast zone. When expanded to the HCA vapor zone, this total increases to 8,738 people. These numbers are relatively small compared to some pipelines due to the fact that a significant portion of the Falcon runs through fairly rural areas in most places.
| PIR est. pop. | HCA est. pop. | |
| OHIO | ||
| Carroll County | 11 | 47 |
| Harrison County | 274 | 915 |
| Jefferson County | 334 | 1,210 |
| Total | 619 | 2,172 |
| WEST VIRGINIA | ||
| Hancock County | 242 | 1,155 |
| Total | 242 | 1,155 |
| PENNSYLVANIA | ||
| Allegheny County | 186 | 969 |
| Beaver County | 990 | 3,023 |
| Washington County | 461 | 1,419 |
| Total | 1,637 | 5,410 |
| Grand Total | 2,499 | 8,738 |
Drinking Water Sources
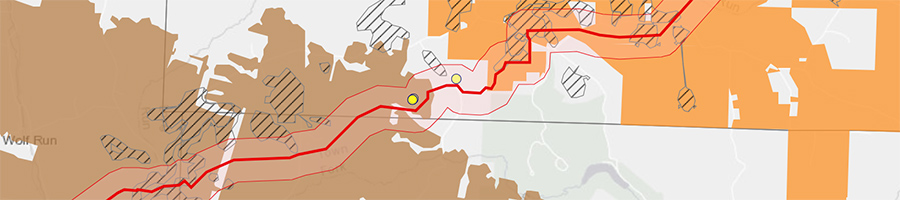
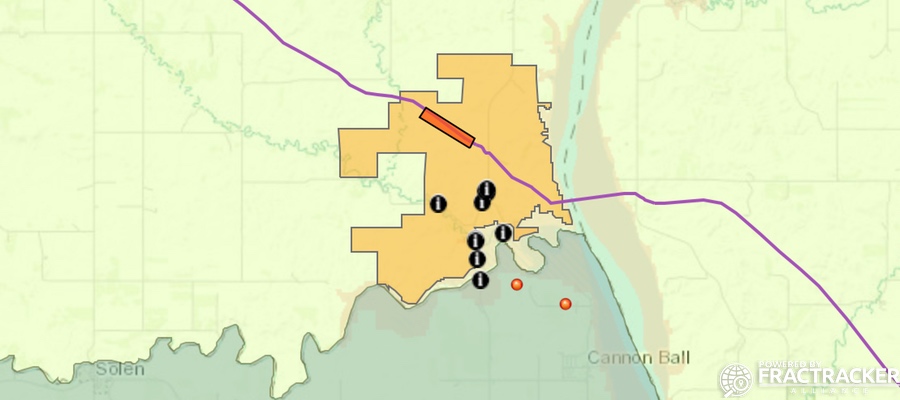
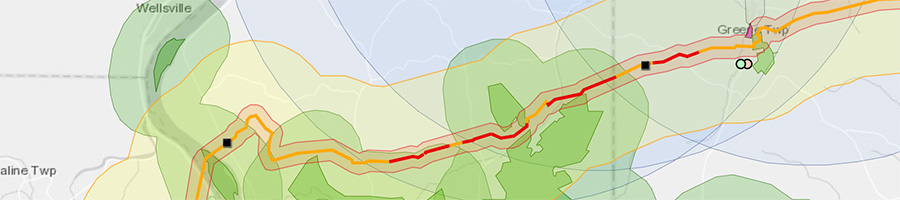
Shell’s data identified a number of drinking water features considered in their HCA analysis. Metadata for this information show these sites were obtained from the Ohio Division of Drinking and Ground Waters, the West Virginia Source Water Assessment and Wellhead Protection Program, and the Pennsylvania DEP Wellhead Protection Program. The exact locations of public drinking water wells and intake points are generally protected by states for safety reasons. However, we duplicated the 5-mile buffer zones used on Shell’s map around these points, presumably denoting the boundaries of source water protection areas, wellhead protection areas, or intake points.

As shown on FracTracker’s interactive map, five of these areas serve communities in the northern portions of Beaver County, shown in the image above, as well as the Cadiz and Weirton-Steubenville designated populated areas. Recall that HCA drinking water analysis only requires consideration of groundwater wells and not surface waters. This is an important distinction, as the Ambridge Reservoir is within the HCA zone but not part of Shell’s analysis — despite considerable risks outlined in our Falcon article on water body crossings.
Ecological Areas
Shell’s permits state that they consulted with the U.S. Fish and Wildlife Service (USFWS), Pennsylvania Game Commission (PGC), Pennsylvania Fish & Boat Commission (PFBC), and the Pennsylvania Department of Conservation and Natural Resources (DCNR) on their intended route in order to determine potential risks to protected species and ecologically sensitive areas.
DCNR responded that the pipeline had the potential to impact six sensitive plant species: Vase-vine Leather-Flower, Harbinger-of-spring, White Trout-Lily, Purple Rocket, Declined Trillium, and Snow Trillium. PFBC responded that the project may impact the Southern Redbelly Dace, a threatened temperate freshwater fish, within the Service Creek watershed. PGC responded that the pipeline had potential impact to habitats used by the Short-Eared Owl, Northern Harrier, and Silver-Haired Bat. Finally, the USFWS noted the presence of freshwater mussels in a number of water features crossed by the Falcon.
The presence of these species, as well as the proximity of protected lands illustrated on our map, factored into the Falcon’s HCA designations. A more detailed analysis of these issues is provided in the Falcon Public EIA Project article on Protected Habitats & Species of Concern.
* * *
Related Articles
By Kirk Jalbert, FracTracker Alliance