Wayne National Forest Could Be Deforested – Again
Guest article by Becca Pollard
Eighty years ago, Southeastern Ohio was a wasteland of barren, eroding hills. During the 18th and 19th centuries this once heavily forested area in the Appalachian foothills had been clear cut and mined beyond recognition. When the Great Depression struck, lowering crop prices made farming unprofitable in the area, and 40% of the population moved away.
In 1933, President Franklin Delano Roosevelt established the Civilian Conservation Corps (CCC), a public work relief program that employed men aged 18-25 to do manual labor related to conservation and development of natural resources such as planting trees, constructing trails, roads, and lodges, fighting wildfires, and controlling erosion. The following year, Ohio’s legislature agreed to allow the federal government to purchase land in the state for the purpose of establishing a national forest. The Forest Service was tasked with restoring the land for what is now called Wayne National Forest (WNF). A tree nursery was established near Chillicothe, and with the help of the CCC and volunteers, including members of the Daughters of the American Revolution, garden clubs, and school children, reforestation began.


Photos Credit: US Forest Service
An Area on the Mend
Today, WNF comprises three units that span 12 Ohio counties in the Unglaciated Allegheny Plateau. The hills are covered in biologically diverse mixed mesophytic forest, which includes approximately 120 species of trees and provides habitat for at least 45 species of mammals, 158 species of birds, 28 species of reptiles, 29 species of amphibians, and 87 species of fish. The US Forest Service estimates that 240,000 people visit this ecological wonder annually, according to Forest Recreation Program Manager, Chad Wilberger, in Nelsonville, Ohio. The restoration of barren public land to its current state is a great achievement. If it continues to be protected, Wayne could one day resemble the old growth forest that thrived here before the arrival of European settlers.
The Bureau of Land Management (BLM), however, has recently decided to lease up to 40,000 acres of Wayne to gas and oil companies for horizontal hydraulic fracturing, or fracking. The first auction took place last December resulting in the lease of 700 acres. A second auction this March leased another 1,200 acres. Nearly all of this land lies within the 60,000 acre Marietta Unit of the forest. This brings Oil & Gas Expressions of Interest (EOI) acreage to roughly 7.5% of all WNF owned parcels in this unit.
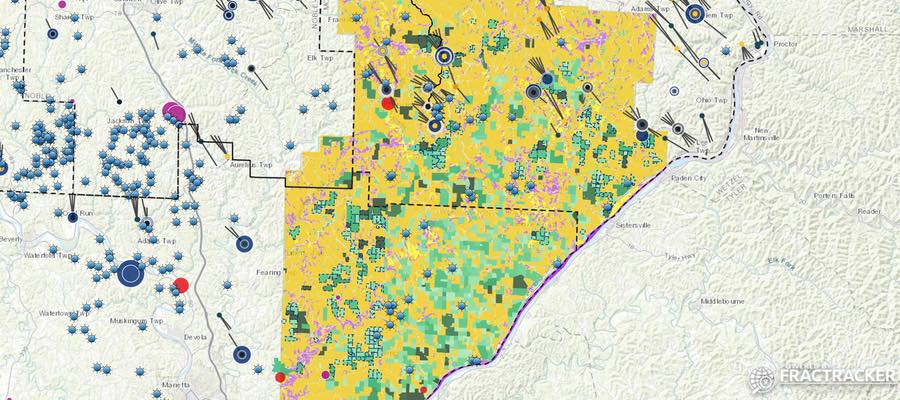
Wayne National Forest and Adjacent Existing Oil and Gas Infrastructure
Below is a map of the Wayne National Forest, along with parcels owned by WNF (shown in gray) and those that might be subject to unconventional oil and gas development (gray parcels outlined with dashes). We also include existing unconventional oil and gas infrastructure near the park. Explore the map below, or click here to view the map fullscreen.
View map fullscreen | How FracTracker maps work
Not new, not old
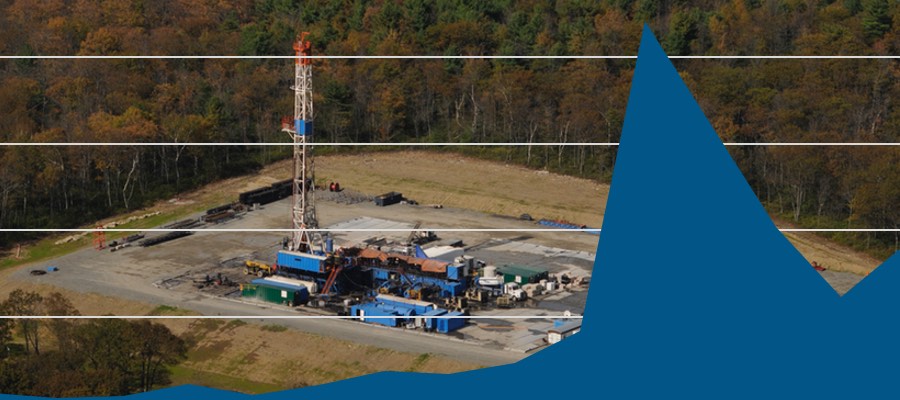
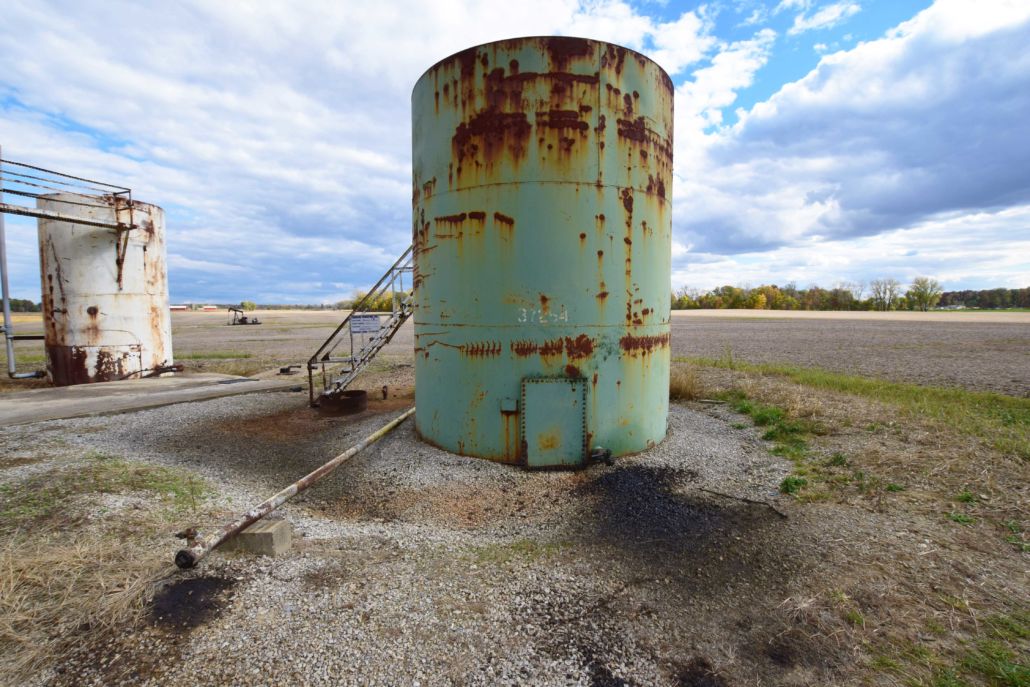
Gas and oil development is not new to the Wayne. Since the passage of The Federal Land Policy and Management Act of 1976, the US Forest Service’s land management plan for WNF has included conventional drilling, and derricks are a common sight on both public and private land in southeastern Ohio.
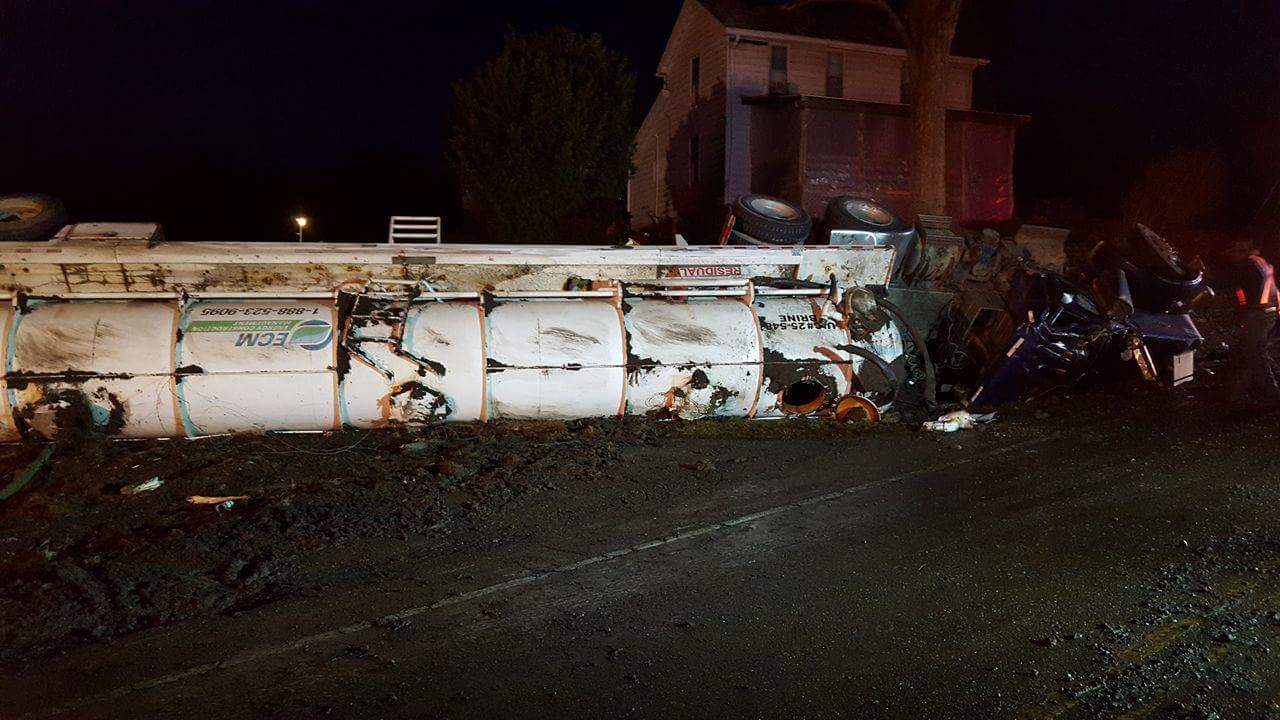
Fracking (unconventional drilling), however, has a far greater impact, requiring clear cutting of large areas of land for the construction of concrete well pads, and the use of millions of gallons of water that will become contaminated during the process and then transported by truck to injection wells. Accidents can be catastrophic for workers and nearby residents, and fracking and waste water disposal have been linked to earthquakes in Ohio.
In 2012, BLM updated its WNF Land and Resource Management Plan to allow fracking in the forest without conducting new impact studies.
What is at risk?
The Marietta Unit of the WNF is located in Monroe, Perry, and Washington counties in Southeastern Ohio along the Ohio River. Within its boundary are a wealth of trails used for hiking, backpacking, horseback riding, and mountain biking, campgrounds, and waterways ideal for kayaking and fishing. Both the highest and lowest points in the Wayne lie in this unit, as does the Irish Run Natural Bridge. The area is also known for its exceptional wildflowers, as shown in the photos below.


")
")
")
")
")
")

")

")


")
")
One popular recreation area, Lamping Homestead, lies directly within an oil and gas Expression Of Interest (EOI) parcel #3040602400 (See Map Above), one of the areas under consideration for lease. In the 1800s, it was the site of the Lamping family’s farm, but today all that remains of the settlers is a small cemetery with an iron gate atop a hill overlooking a small lake. Six campsites are situated around the western side of the lake, and two intersecting hiking loops rise into the wooded hills to the east. On the western side of the parking lot is a covered picnic area. A creek flows out of the lake and into Clear Fork, a tributary of the Little Muskingum River, across the road from the parking lot.
Both the lake and stream are popular boating and fishing areas. Lamping is an excellent spot for wildlife viewing. The lake, the creeks that flow in and out of it, and the surrounding wooded hills support an impressive variety of plant and animal species. During the day, visitors might spot ducks, geese, great blue herons, red-winged blackbirds, summer tanagers, red spotted newts, box turtles, northern water snakes, garter snakes, deer, rabbits, and muskrats. At night, they could be greeted by a cacophony of voices from frogs, owls, and coyotes.
Species of trees, plants, and fungus are also numerous. In winter, stands of white pine pop out against the bare branches of oak, hickory, maple, buckeye, and other deciduous trees. In spring, eye-catching splotches of blooming dogwood and redbud contrast against the many shades of green. But hikers who pull their gaze away from the brightly colored canopy and look down are rewarded with an abundance of wildflowers and the butterflies they attract, as well as many varieties of mushrooms and fungus, including such edible varieties as morels, wood ear, and dryad’s saddle.
Estimating Disturbances
It is unclear how much surface disturbance would occur on public land if this parcel were to be fracked, but even if the well pad and pipelines were constructed on private land adjacent to the forest, in order to drill under the forest, the public land and its inhabitants and visitors would certainly be impacted.
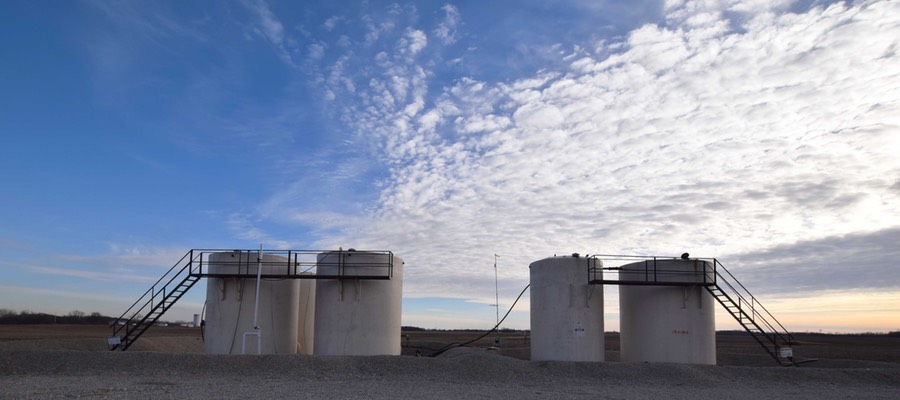
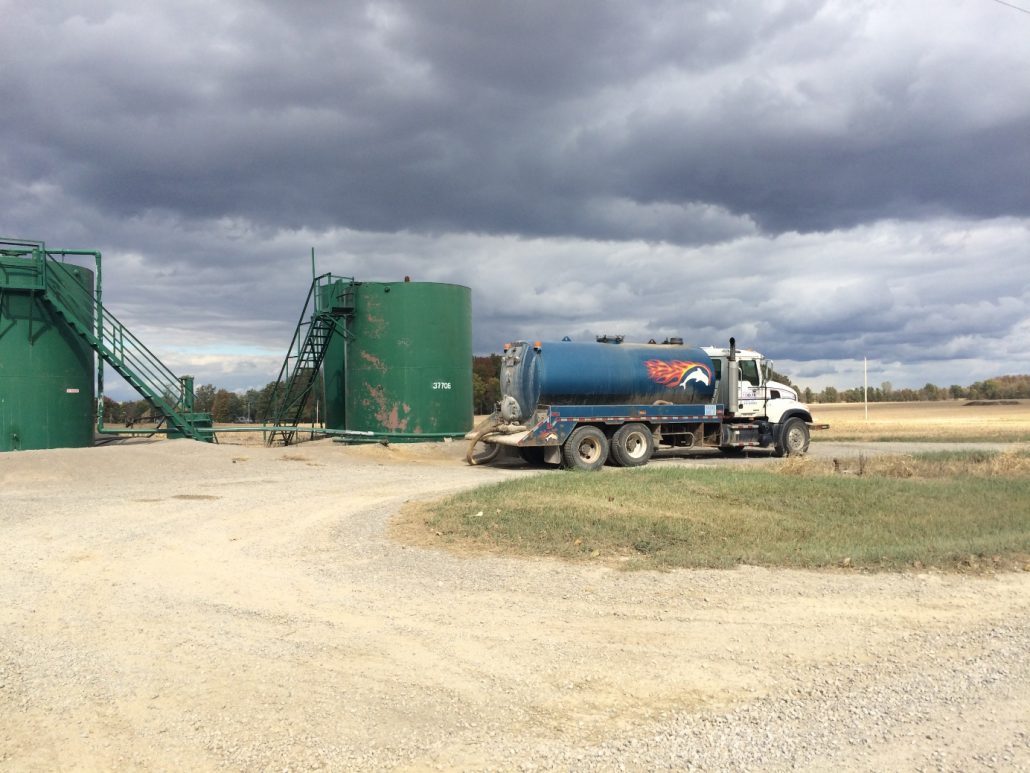
There is no question that noise and air pollution from traffic and construction would be disruptive both to wildlife and to human visitors. Explore various photos of the oil and gas industry in the gallery below:


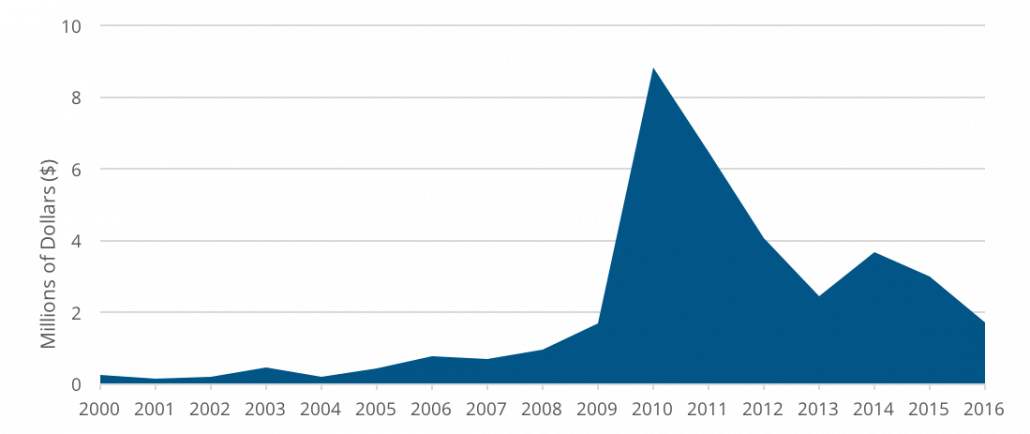
The extraction process requires 2 million to 6 million gallons of fresh water each time a well is fracked. The rate at which hydraulic fracturing’s water demand is increasing on a per-well basis here in Ohio reached an exponential state around Q4-2013 and Q1-2014 and continues to rise at a rate of 3.1 million gallons per well per year (Figure 1).

Ohio Hydraulic Fracturing Total and Per Well Freshwater Demand between Q3-2010 and Q3-2016.
In Ohio, oil and gas companies are allowed to pull this water directly from streams and rivers at no cost. All this is possible, despite the fact that after its use it is so contaminated that it must be disposed of via injection wells and is permanently removed from the water cycle. The industry is already pulling water from streams in the Marietta Unit of the WNF for use in fracking on private land. Fracking public land simply means water withdrawals will occur on a much larger scale.
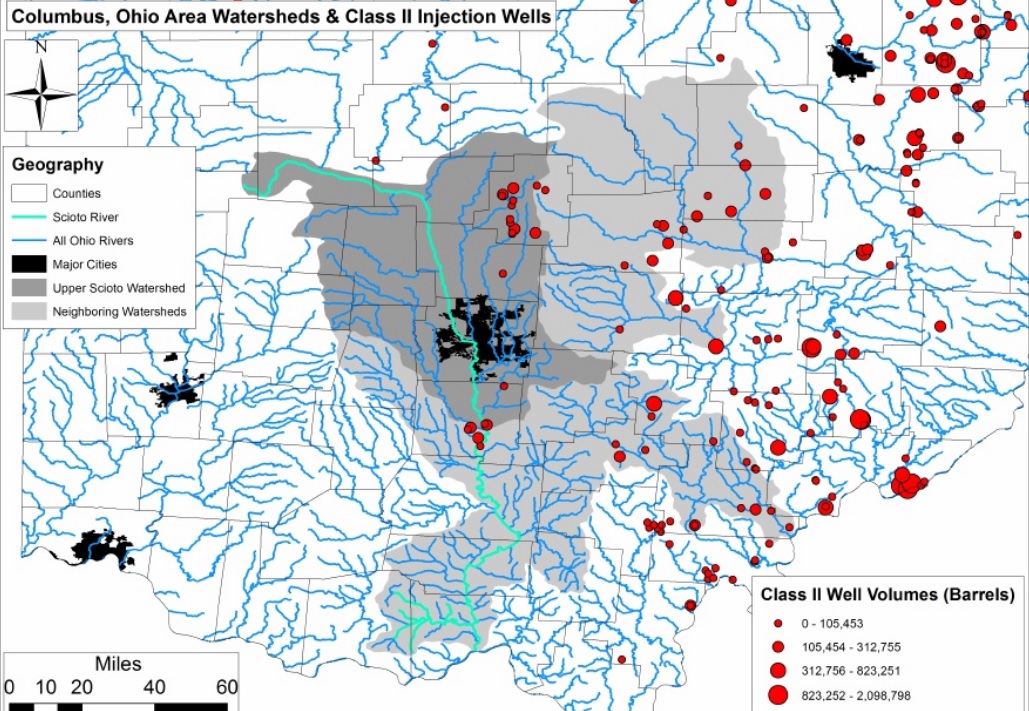
Ohio and West Virginia Shale Water Demand and Injection Waste Disposal
This map shows Utica wells weighted by water demand and disposal (and/or production). It also depicts water, sand, and chemical usage as well as injection waste and oil production. Explore the map below, or click here to view map fullscreen.
View map fullscreen | How FracTracker maps work
Inevitable methane leaks, in addition to contributing to climate change, affect humans and wildlife in their immediate vicinity, causing headaches and nausea and even killing trees and plants.
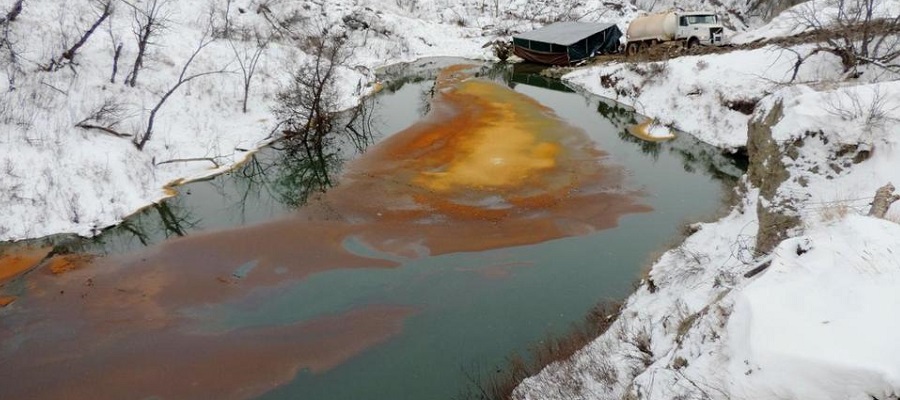
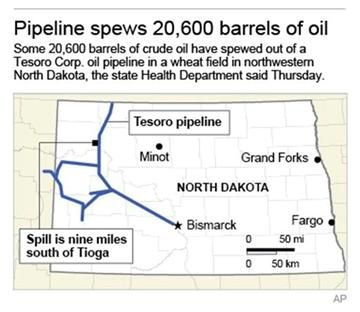
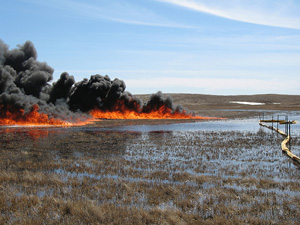
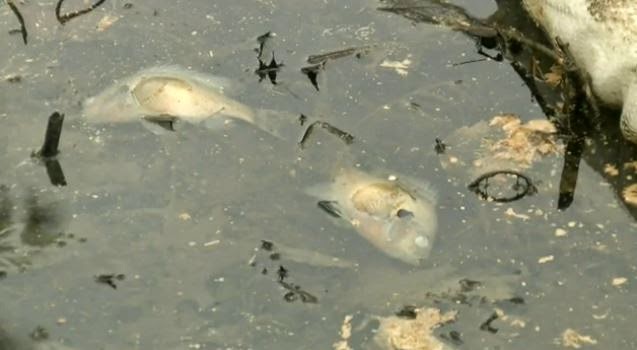
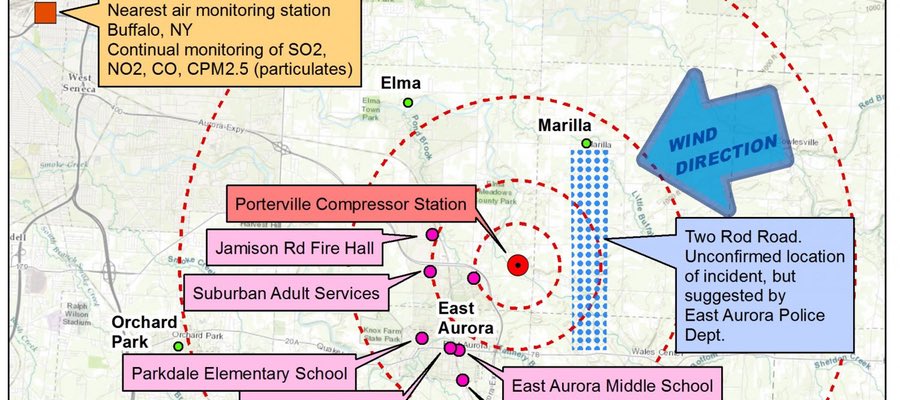
In addition to the anticipated harm that fracking inflicts upon a natural area, there is also a risk of accidents with potentially devastating consequences. Residents of Monroe County have already seen a few in recent years from fracking on private land. In 2014, a well pad fire in the village of Clarington resulted in a chemical spill that contaminated nearby Opossum Creek, killing 70,000 fish. The same year a large gas leak 15 miles south in the village of Sardis resulted in the evacuation of all homes within half mile radius.
Recent studies have shown that extraction wells, in addition to injection wells, can cause earthquakes. Unsurprisingly, Monroe County has seen a spike in seismic activity with the increase in fracking activity in the area. The most recent incident was a 3.0 magnitude earthquake in the forest less than five miles from Lamping Homestead in April of this year.
Supporters of Wayne National Forest
Many people have repeatedly spoken out against BLM’s plan, submitting a petition with more than 100,000 signatures, and protesting outside Wayne National Forest Headquarters and Athens Ranger Station in Nelsonville. They have even organized voters to call and write letters to Regional Forester Kathleen Atkinson and legislators, including Senators Sherrod Brown and Rob Portman, and Governor John Kasich. BLM has not budged on its decision, unfortunately, insisting that leasing this land for fracking, and associated infrastructure buildout, will have “no significant impact.”
This May, the Center for Biological Diversity, Ohio Environmental Council, Ohio Sierra Club, and Heartwood, a regional organization focused on protecting forests, filed a lawsuit against BLM, aiming to void BLM leases and halt all fracking operations within the national forest.
Concerned citizens continue to organize raise awareness as they await the outcome of the suit.
Becca Pollard is Freelance Journalist and Co-founder of Keep Wayne Wild
Data Downloads
Click on the links below to download the data used to create this article’s maps:
- Wayne National Forest Oil & Gas Expressions Of Interest (EOI) Parcels, April, 2017
- All Wayne National Forest Owned Parcels, April, 2017
- Wayne National Forest’s Marietta Unit Landcover
- Ohio’s Hydraulic Fracturing Producing Wells 2011 to Q3-2016
- Freshwater demand across 1,500 of Ohio’s Hydraulic Fracturing Wells