Oklahoma and Kansas Class II Injection Wells and Earthquakes
By Ted Auch, Great Lakes Program Coordinator, FracTracker Alliance
In collaboration with Caleb Gallemore, Assistant Professor in International Affairs, Lafayette University
The September 3rd magnitude 5.8 earthquake in Pawnee, Oklahoma, is the most violent example of induced seismicity, or “man-made” earthquakes, in U.S. history, causing Oklahoma governor Mary Fallin to declare a state of emergency. This was followed by a magnitude 4.5 earthquake on November 1st prompting the Oklahoma Corporation Commission (OCC) and U.S. EPA to put restrictions on injection wells within a 10-mile radius of the Pawnee quake.

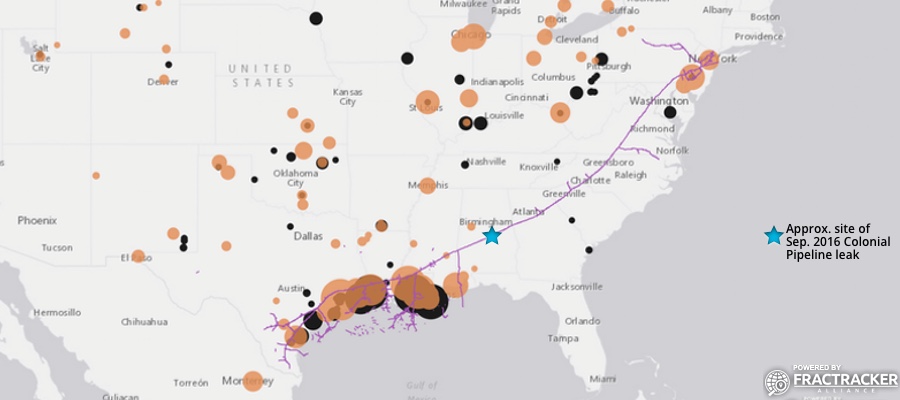
And then on Sunday, November 6th, a magnitude 5.0 earthquake shook central Oklahoma about a mile west of the Cushing Hub, the largest commercial crude oil storage center in North America capable of storing 54 million barrels of crude. This is the equivalent of 2.8 times the U.S. daily oil refinery capacity and 3.1 times the daily oil refinery capacity of all of North America. This massive hub in the North American oil landscape also happens to be the southern terminus of the controversial Keystone pipeline complex, which would transport 590,000 barrel per day over more than 2,000 miles (Fig. 1). Furthermore, this quake demonstrated the growing connectivity between Class II injection well associated induced seismicity and oil transport/storage in the heart of the US version of Saudi Arabia’s Ghawar Oil Fields. This increasing connectivity between O&G waste, production, and processing (i.e., Hydrocarbon Industrial Complex) will eventually impact the wallets of every American.
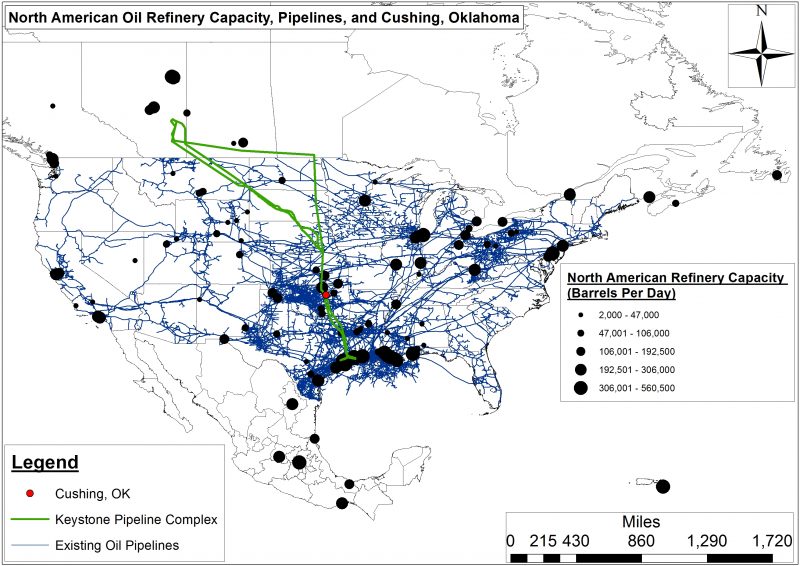
Figure 1. The Keystone Pipeline would transport 590,000 bpd over more than 2,000 miles.
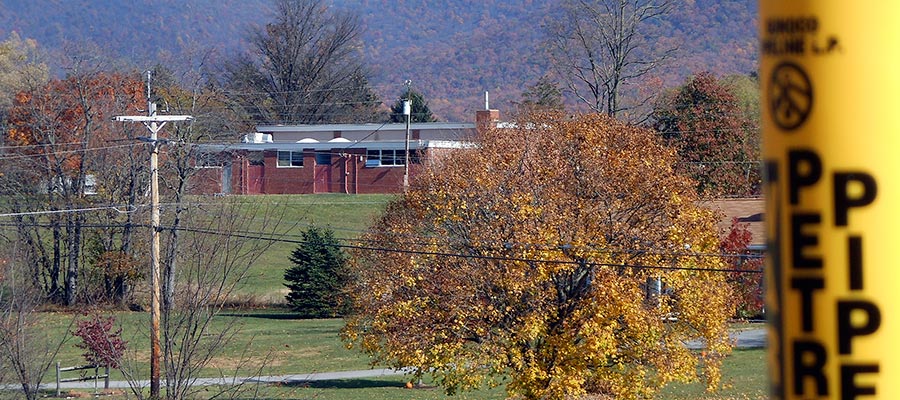
This latest earthquake caused Cushing schools to close. Magellan Midstream Partners, the major pipeline and storage facility operator in the region, also shut down in order to “check the integrity of our assets.” Compounding concerns about induced seismicity, the Cushing Hub is the primary price settlement point for West Texas Intermediate that, along with Brent Crude, determines the global price of crude oil and by association what Americans pay for fuel at the pump, at their homes, and in their businesses.
Given the significant increase in seismic activity across the U.S. Great Plains, along with the potential environmental, public health, and economic risks at stake, we thought it was time to compile an inventory of Class II injection well volumes. Because growing evidence points to the relationship between induced seismicity and oil and gas waste disposal, our initial analysis focuses on Oklahoma and Kansas. The maps and the associated data downloads in this article represent the first time Class II injection well volumes have been compiled in a searchable and interactive fashion for any state outside Ohio (where FracTracker has compiled class II volumes since 2010). Oklahoma and Kansas Class II injection well data are available to the public, albeit in disparate formats and diffuse locations. Our synthesis makes this data easier to navigate for concerned citizens, policy makers, and journalists.
Induced Seismicity Past, Present, and Future
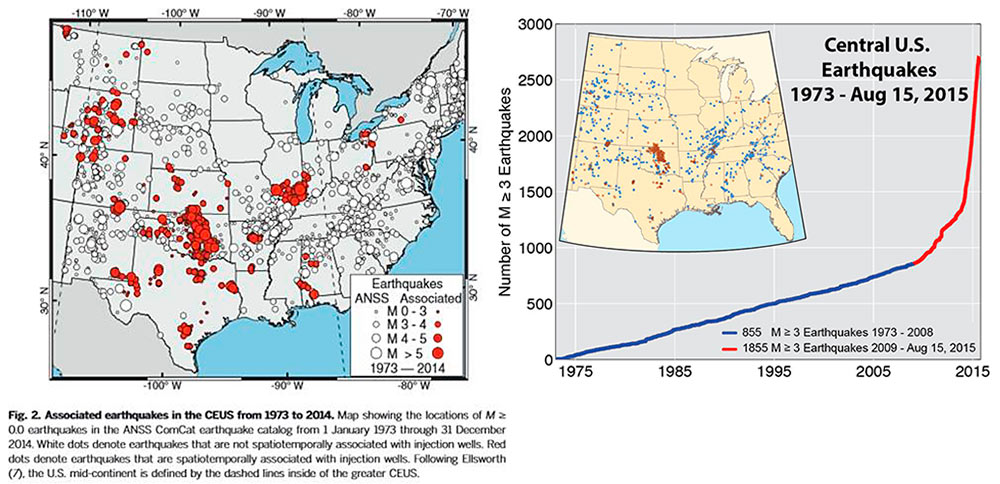
Figure 2. Central U.S. earthquakes 1973-August 15, 2015 according to the U.S. Geological Survey (Note: Based on our analysis this exponential increasing earthquakes has been accompanied by a 300 feet per quarter increase in the average depth of earthquakes across Oklahoma, Kansas, and Texas).
Oklahoma, along with Arkansas, Kansas, Ohio, and Texas, is at the top of the induced seismicity list, specifically with regard to quakes in excess of magnitude 4.0. However, as the USGS and Virginia Tech Seismological Observatory (VTSO)[1] have recently documented, an average of only 21 earthquakes of magnitude 3.0 or greater occurred in the Central/Eastern US between 1973 and 2008. This trend jumped to an average of 99 between 2009 and 2013. In 2014 there were a staggering 659 quakes. The exponential increase in induced seismic events can be seen in Figure 2 from a recent USGS publication titled “High-rate injection is associated with the increase in U.S. mid-continent seismicity,” where the authors note:
“An unprecedented increase in earthquakes in the U.S. mid-continent began in 2009. Many of these earthquakes have been documented as induced by wastewater injection…We find that the entire increase in earthquake rate is associated with fluid injection wells. High-rate injection wells (>300,000 barrels per month) are much more likely to be associated with earthquakes than lower-rate wells.”
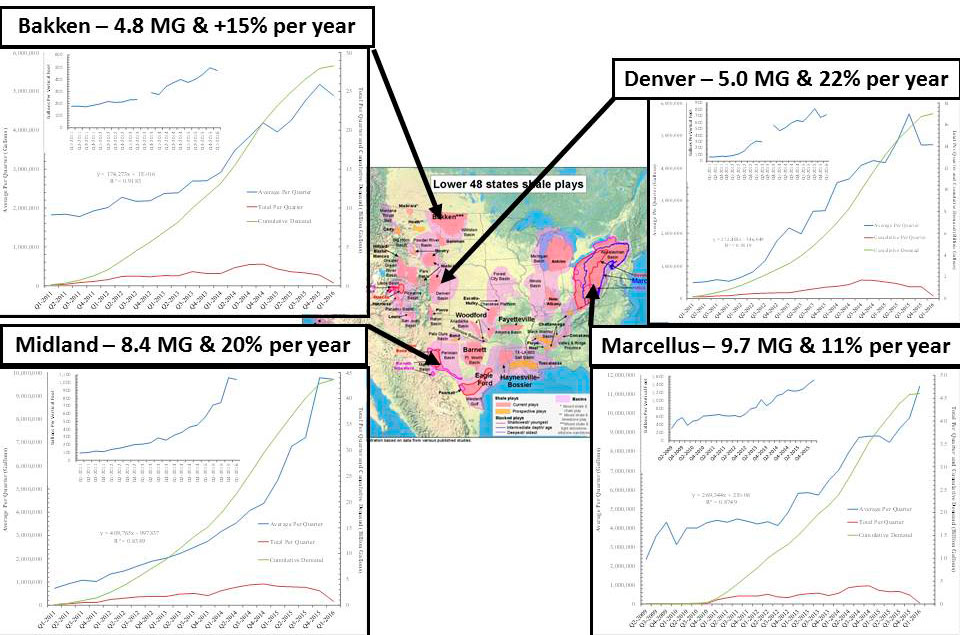
Figure 3. Average freshwater demand per hydraulically fractured well across four U.S. shale plays and the annual percent increase in each of those plays.
This trend suggests that induced seismicity is the new normal and will likely increase given that: 1) freshwater demand per hydraulically fractured well is rising all over the country, from 11-15% per year in the Marcellus and Bakken to 20-22% in the Denver and Midland formations, 2) the amount of produced brine wastewater parallels these increases almost 1-to-1, and 3) the unconventional oil and gas industry is using more and more water as they begin to explore the periphery of primary shale plays or in less productive secondary and tertiary plays (Fig. 3).
Oklahoma
The September, 2016, Pawnee County Earthquake
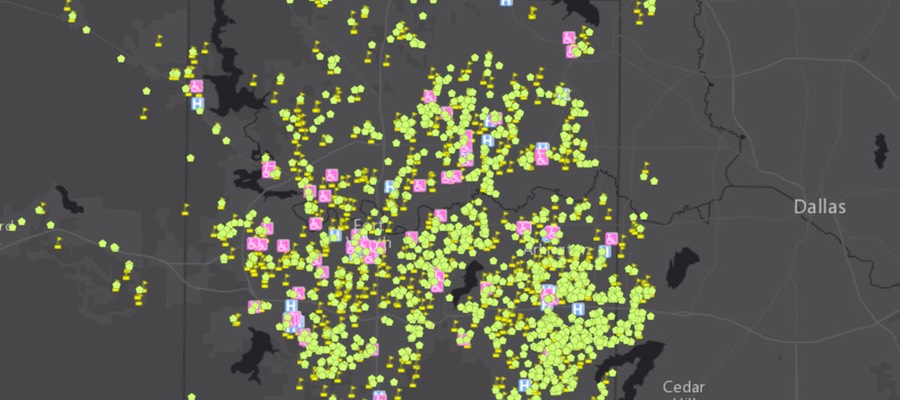
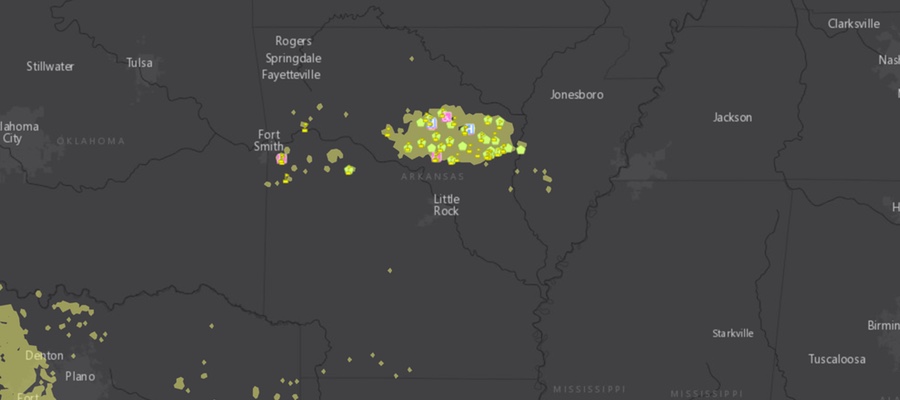
This first map focuses on the September, 2016 Pawnee, OK Magnitude 5.8 earthquake that many people believe was caused by injecting high volume hydraulic fracturing (HVHF) waste into class II injection wells in Oklahoma and Kansas. This map includes all Oklahoma and Kansas Class II injection wells as well as Oklahoma’s primary geologic faults and fractures.
Oklahoma and Kansas Class II injection wells and geologic faults
View map fullscreen | How FracTracker maps work
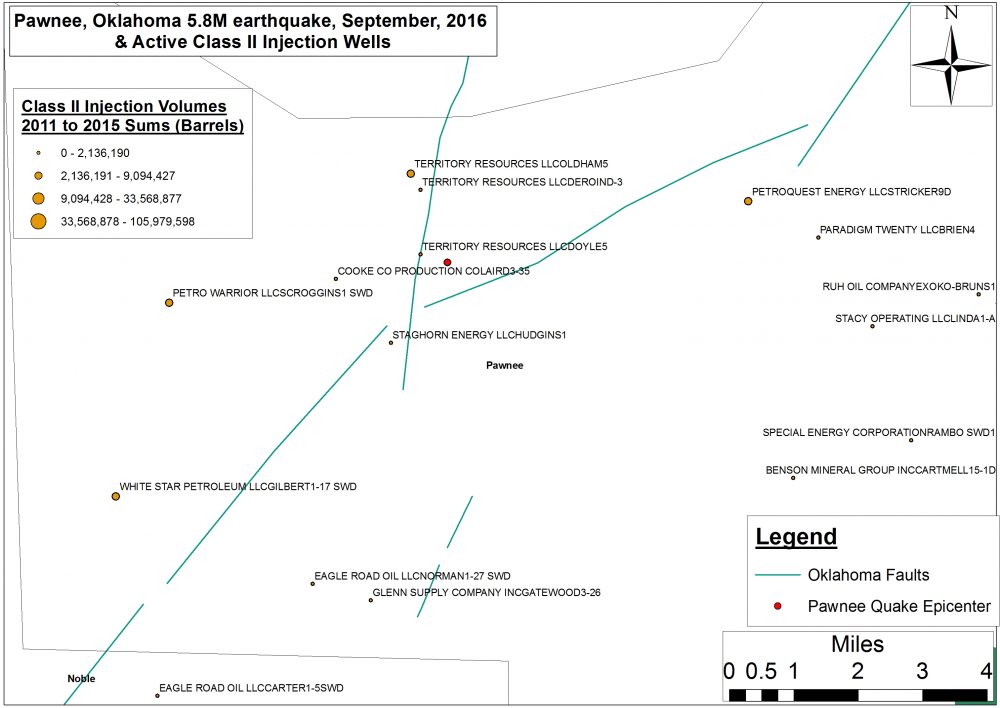
Figure 4. The September, 2016 Pawnee, Oklahoma 5.8M earthquake, neighboring active Class II injection wells, underlying geologic faults and fractures.
Of note on this map is the geological connectivity across Oklahoma resulting from the state’s 129 faults and fractures. Also present are several high volume wells including Territory Resources LLC’s Oldham #5 (1.45 miles from the epicenter, injecting 257 million gallons between 2011 and 2014) and Doyle #5 wells (0.36 miles from the epicenter, injecting 61 million gallons between 2011 and 2015), Staghorn Energy LLC’s Hudgins #1 well (1.43 miles from the epicenter, injecting 11 million gallons between 2011 and 2015 into the Red Fork formation), and Cooke Co Production Co.’s Laird #3-35 well (1.41 miles from the epicenter, injecting 6.5 million gallons between 2011 and 2015). Figure 4 shows a closeup view of these wells relative to the location of the Pawnee quake.
Class II Salt Water Disposal (SWD) Injection Well Volumes
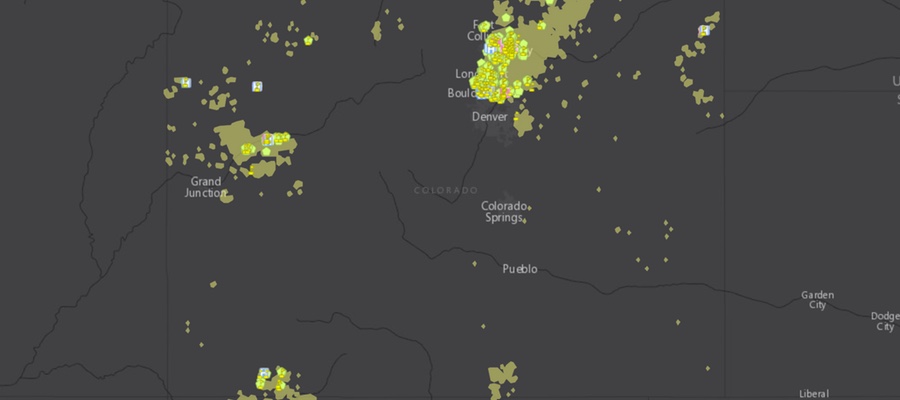
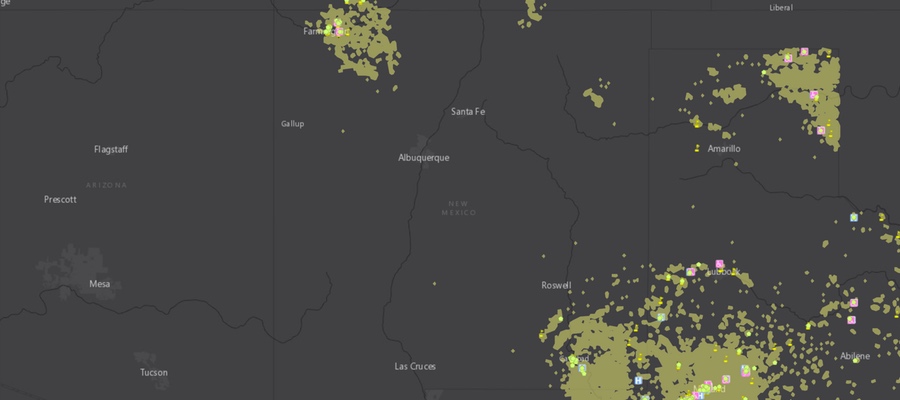
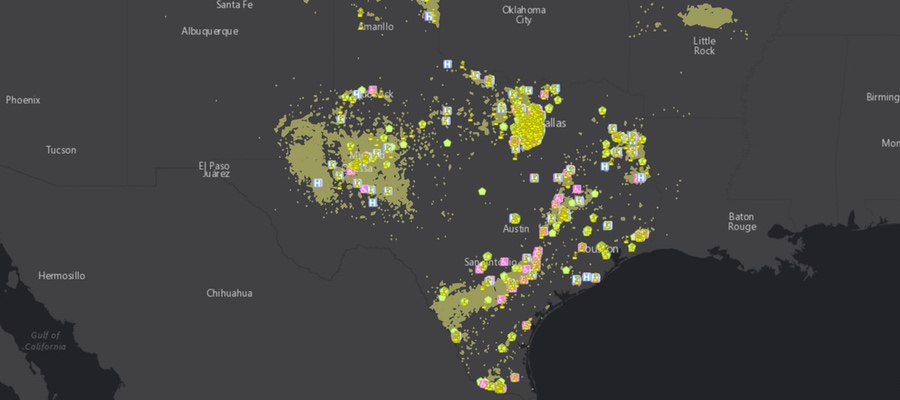
This second map includes annual volumes of disposed wastewater across 10,297 Class II injection wells in Oklahoma between 2011 and 2015 (Note: 2015 volumes also include monthly totals). Additionally, we have included Oklahoma’s geologic faults and fractures for context given the recent uptick in Oklahoma and Kansas’ induced seismicity activity.
Annual volumes of class II injection wells disposal in Oklahoma (2011-2015)
View map fullscreen | How FracTracker maps work | Download map data
Oklahoma statistics for 2011 to 2015 (Table 1):
- Maximum volume to date (for a single Class II injection well): 105,979,598 barrels, or 4,080,214,523 gallons (68,003,574 gallons per month), for the New Dominion, LLC “Chambers #1” well in Oklahoma County.
- Total Volume to Date: 10,655,395,179 barrels or 410,232,714,392 gallons (6,837,211,907 gallons per month).
- Mean volume to date across the 10,927 Class II injection wells: approximately 975,144 barrels per well or 37,543,044 gallons (625,717 gallons per month).
- This map also includes 632 Class II wells injecting waste into the Arbuckle Formation which is believed to be the primary geological formation responsible for the 5.0 magnitude last week in Cushing.

Kansas
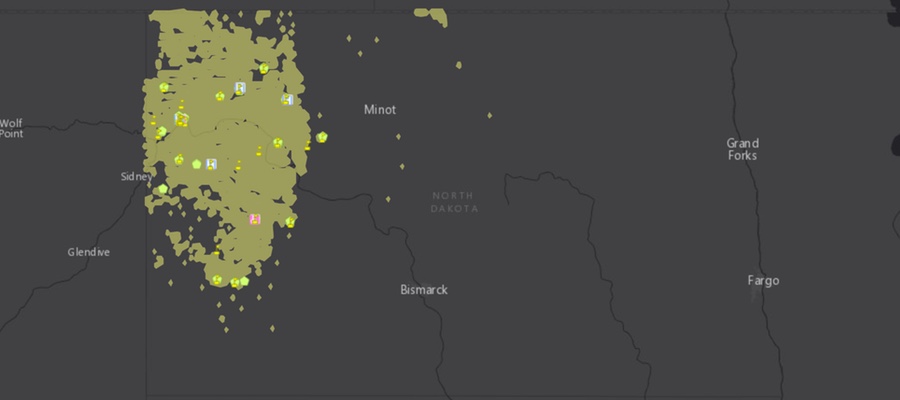
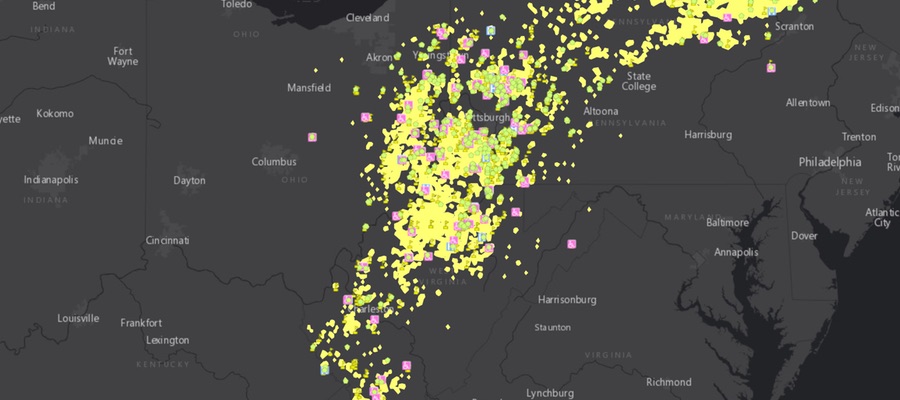
Below is an inventory of monthly oil and gas waste volumes (barrels) disposed across 4,555 Class II injection wells in Kansas between 2011 and 2015. This map will be updated in the Spring of 2017 to include 2016 volumes. A preponderance of this data comes from 2015 with a scattering of volume reports across Kansas between 2011 and 2014.
Monthly Class II injection wells volumes in Kansas (2011-2015)
View map fullscreen | How FracTracker maps work | Download map data
Kansas statistics for 2015 (Table 1):
- Maximum volume to date (for a single Class II injection well): 9,016,471 barrels, or 347,134,134 gallons (28,927,845 gallons per month), for the Sinclair Prairie Oil Co. “H.J. Vohs #8” well in Rooks County. This is a well that was initially permitted and completed between 1949 and 1950.
- Total Volume to date: 1,060,123,330 barrels or 40,814,748,205 gallons (3,401,229,017 gallons per month).
- Mean volume to date across the 4,555 Class II injection wells: approximately 232,738 barrels per well or 8,960,413 gallons (746,701 gallons per month).
Table 1. Summary of Class II SWD Injection Well Volumes across Kansas and Oklahoma
|
|
Sum | Average | Maximum | |||
| No. of Class II SWD Wells |
Barrels | Sum To Date | Per Year | Sum To Date | Per Year | |
| Kansas* | 4,555 | 1.06 BB | 232,738 | … | 9.02 MB | … |
| Oklahoma** | 10,927 | 10.66 BB | 975,143 | 195,029 | 105.98 MB | 21.20 MB |
* Wells in the counties of Barton (279 wells), Ellis (397 wells), Rooks (220 wells), Russell (199 wells), and Ness (187 wells) account for 29% of Kansas’ active Class II wells.
** Wells in the counties of Carter (1,792 wells), Creek (946 wells), Pontotoc (684 wells), Seminole (476 wells), and Stephens (1,302 wells) account for 48% of Oklahoma’s active Class II wells.
Conclusion

If the U.S. EPA’s Underground Injection Control (UIC) estimates are to be believed, the above Class II volumes account for 19.3% of the “over 2 billion gallons of brine…injected in the United States every day,” and if the connectivity between injection well associated induced seismicity and oil transport/storage continues to grow, this issue will likely impact the lives of every American.
Given how critical the Cushing Hub is to US energy security and price stability one could easily argue that a major accident there could result in a sudden disruption to fuel supplies and an exponential increase in “prices at the pump” that would make the 240% late 1970s Energy Crisis spike look like a mere blip on the radar. The days of $4.15 per gallon prices the country experienced in the summer of 2008 would again become a reality.
In sum, the risks posed by Class II injection wells and are not just a problem for insurance companies and residents of rural Oklahomans and Kansans, induced seismic activity is a potential threat to our nation’s security and economy.
Downloads
FracTracker Induced Seismicity Infographic (print quality)
Oklahoma Class II SWD Injection Well Annual Volumes 2011 to 2015 (Barrels)
Kansas Class II SWD Injection Well Monthly Volumes 2011 to 2015 (Barrels)
Footnotes
[1] To learn more about Induced Seismicity read an exclusive FracTracker two-part series from former VTSO researcher Ariel Conn: Part I and Part II. Additionally, the USGS has created an Induced Earthquakes landing page as part of their Earthquake Hazards Program.


