Report Calculates Impacts from PA’s Planned Natural Gas Infrastructure
FracTracker Alliance released the report: A Hazy Future: Pennsylvania’s Energy Landscape in 2045 today, which details the potential future impacts of a massive buildout of Marcellus Shale wells and associated natural gas infrastructure.
Industry analysts forecast 47,600 new unconventional oil and gas wells may be drilled in Pennsylvania by 2045, fueling new natural gas power plants and petrochemical facilities in PA and beyond. Based on industry projections and current rates of consumption, FracTracker – a national data-driven non-profit – estimates the buildout would require 583 billion gallons of fresh water, 386 million tons of sand, 798,000 acres of land, 131 billion gallons of liquid waste, 45 million tons of solid waste, and more than 323 million truck trips to drilling sites.
“Only 1,801 of the 10,851 unconventional wells already drilled count as a part of this projection, meaning we could see an additional 45,799 such wells in the coming decades,” commented Matt Kelso, Manager of Data and Technology for FracTracker and lead author on the report.
Why the push for so much more drilling? Out of state – and out of country – transport is the outlet for surplus production.
“The oil and gas industry overstates the need for more hydrocarbons,” asserted FracTracker Alliance’s Executive Director, Brook Lenker. “While other countries and states are focusing more on renewables, PA seems resolute to increase its fossil fuel portfolio.”
The report determined that the projected cleared land for well pads and pipelines into the year 2045 could support solar power generation for 285 million homes, more than double the number that exist in the U.S.
“A Hazy Future shows that a fossil fuel-based future for Pennsylvania would come at the expense of its communities’ health, clean air, water and land. It makes clear that a dirty energy future is unnecessary,” said Earthworks’ Pennsylvania Field Advocate, Leann Leiter. Earthworks endorsed FracTracker’s report. She continued, “I hope Governor Wolf reads this and makes the right choices for all Pennsylvanians present and future.”
A Hazy Future reviews the current state of energy demand and use in Pennsylvania, calculates the footprint of industry projections of the proposed buildout, and assesses what that would look like for residents of the Commonwealth.
Started in 2010 as a southwestern Pennsylvania area website, FracTracker Alliance is a national organization with regional offices across the United States in Pennsylvania, the District of Columbia, New York, Ohio, and California. The organization’s mission is to study, map, and communicate the risks of oil and gas development to protect our planet and support the renewable energy transformation. Its goal is to support advocacy groups at the local, regional, and national level, informing their actions to positively shape our nation’s energy future.
Decisions to drill or mine on public lands, however, are often extremely complicated.
By Allison M. Rohrs, Saint Francis University, Institute for Energy
The Commonwealth of Pennsylvania has historically been, and continues to be, home to an abundant array of energy resources like oil, gas, coal, timber, and windy ridgetops. Expectedly, these natural resources are found both on publicly and privately held land.
In Pennsylvania, the bulk of public lands are managed by two separate state agencies: The Department of Conservation and Natural Resources (DCNR), which manages the state’s forest and park system, and the Pennsylvania Game Commission (PGC), which manages the state’s game lands. Both of these state agencies manage oil, gas, and coal extraction as well as timbering on state property. Interestingly, neither of the agencies have utility-scale renewable energy generation on their land.
Some of Pennsylvania’s best wind resources can be found on the mountain ridges in the Commonwealth’s state forests and game lands, however, all proposals to build utility-scale wind farms have been denied by state agencies.
(Note: there are other state and federal agencies managing lands in PA, however, we focused our research on these two agencies specifically.)
Surprised to see that state lands have been greatly developed for different fossil industries but denied for wind energy, The Institute for Energy set out on a yearlong endeavor to collect as much information as we could about energy development on PA public lands. Using formal PA Right to Know requests, we worked with both DCNR and PGC to examine development procedures and management practices. We reviewed hundreds of available state agency reports, scientific documents, and Pennsylvania energy laws and regulations. We also worked with FracTracker Alliance to develop interactive maps that depict where energy development has occurred on state lands.
After a comprehensive review, we realized, like so much in life, the details are much more complicated than a simple yes or no decision to develop an energy project on state lands. Below is a brief summary of our findings, organized by energy extraction method:
Land/Mineral Ownership in Pennsylvania
One of the most significant issues to understand when discussing energy resources on state lands is the complexity of land ownership in Pennsylvania. In many instances, the development of an energy resource on publicly owned land is not a decision, but instead an obligation. In Pennsylvania, property rights are often severed between surface and subsurface ownership. In many cases, surface owners do not own the mineral rights beneath them, and, by PA law, are obligated to allow reasonable extraction of such resource, whether it be coal, oil, or gas. In Pennsylvania, approximately 85% of state park mineral rights are owned by someone other than the Commonwealth (severed rights).
Legal Authority to Lease
It is critical to note that DCNR and PGC are two entirely separate agencies with different missions, legal structures, and funding sources. This plays a significant role in decisions to allow oil, gas, and coal development on their properties. Both agencies have explicit legal authority under their individual statutes that allow them to lease the lands for mineral extraction. This becomes more of an issue when we discuss wind development, where legal authority is less clear, particularly for DCNR.
Oil and Gas Extraction
Oil and gas wells have been spudded on state parks, state forests, and state game lands. The decision to do so is multifaceted and ultimately decided by three major factors:
Mineral ownership of the land,
Legal authority to lease the land, and
Potential impacts to the individual agency.
There is currently a moratorium on new surface leases of DCNR Lands. Moratoriums of such nature have been enacted and removed by different governors since 2010. Although there are no new lease agreements, extraction and production is still occurring on DCNR land from previously executed lease agreements and where the state does not own the mineral rights.
The Game Commission is still actively signing surface and non-surface use agreements for oil and gas extraction when they determine the action is beneficial to achieving their overall mission.
Revenues from the oil and gas industry play a significant role in the decision to drill or not. Both agencies have experienced increasing costs and decreasing revenues, overall, and have used oil and gas development as a way to bridge the gap.
Funds raised from DCNR’s oil and gas activities go back to the agency’s conservation efforts, although from 2009 to 2017, the State Legislature had directed much of this income to the state’s general fund to offset major budget deficits. Just this year, the PA Supreme Court ruled against this process and has restored the funds back to DCNR for conservations purposes.
All revenues generated from oil and gas development on state game lands stays within the Game Commission’s authority.
Along with positive economic benefits, there remains potential health and environmental risks unique to development on these public lands. Some studies indicate that users of these public lands could have potential exposure to pollution both in the air and in the water from active oil and gas infrastructure. The ease of public access to abandoned and active oil and gas infrastructure is a potential risk, as well. On the environmental side, many have argued that habitat fragmentation from oil and gas development is contradictory to the missions of the agencies. Both agencies have independent water monitoring groups specific to oil and gas activities as well as state regulated DEP monitoring. The potential negative effects on ground and surface water quality is an issue, however, mainly due the vast size of public lands and limited dwellings on these properties.
Use the map below to explore the PA state parks, forests, and game lands that have active oil and gas infrastructure.
Thousands of acres of state forests and game lands have been mined for coal. Like oil and gas, this mineral is subject to similar fee simple ownership issues and is governed by the same laws that allow oil and gas extraction. DCNR, has not signed any virgin coal mining leases since the 1990s, but instead focuses on reclamation projects. There are coal mining operations, however, on forest land where DCNR does not own the mineral rights. The Game Commission still enters into surface and non-surface use agreements for mining.
In many circumstances, mining activity and abandoned mines were inherited by the state agencies and left to them to reclaim. Environmental and health impacts of mining specific to state land are generally attributed more to legacy mining and not to new mining operations.
Acid mine drainage and land subsidence has destroyed rivers and riparian habitats on these lands purposed for conservation.
The ease of public access and limited surveillance of public lands also makes abandoned mines and pits a dangerous health risk. Although threats to humans and water quality exist, abandoned mines have been noted for actually creating new bat habitat for endangered and threatened bat species.
Originally, we sought to quantify the total acreage of public lands affected by coal mining and abandoned mines; however, the dataset required to do so is not yet complete.
The Pennsylvania Department of Environmental Protection is currently in the process of digitizing over 84,000 hand drawn maps of mined coal seams in PA, an expected 15-year project.
Today, they have digitized approximately 30,000. The static map below demonstrates the areas with confirmed coal mining co-located on state lands:
Renewables
The discussion about renewable energy development in PA is almost as complex as the fossil industries. There are no utility-scale renewables on state owned land. Both DCNR and the Game Commission have been approached by developers to lease state land for wind development, however all proposals have been denied.
Even when DCNR owns the surface rights, they still cite the lack of legal authority to lease the land for wind, as their statute does not explicitly state “wind turbines” as a lawful lease option.
The Game Commission does have the legal authority to lease its land for wind development, but has denied 19 out of 19 requests by developers to do so, citing many environmental and surface disturbances as the primary reason.
The development of wind projects in PA has slowed in the past five years, with only one new commercial wind farm being built. This is due to a variety of reasons, including the fact that many of windiest locations on private lands have been developed.
We estimate that 35% of the state’s best wind resource is undevelopable simply because it is on public land.
Like all energy development, wind energy has potential environmental and health impacts, too. Wind could cause habitat fragmentation issues on land purposed for conservation. The wind energy industry also has realized negative effects on bird and bat species, most notably, the endangered Indiana bat. Health impacts unique to public lands and wind development include an increased risk of injury to hunters and recreators related to potential mechanical failure or ice throw off the blades. Unlike fossil energies, however, wind energy has potential to offset air emissions.
We estimate that wind development on PA public lands could offset and estimated 14,480,000 tons of CO2 annually if fully developed.
Commercial wind turbines are currently being installed at hub heights of 80-100 meters where the annual average wind resource is 6.5 m/s or greater. The following map demonstrates areas of Pennsylvania where the wind speeds are 6.5 m/s or greater at 100 meters, including areas overlapping state lands, where no utility scale development has occurred.
Biomass is organic material, such as wood, that is considered renewable because of its ability to be replenished. The harvesting of such wood (timber) occurs on both DCNR and PGC lands and provides funding for these agencies.
Small-scale wind, solar, hydro, geothermal, and biomass projects do exist on PA public lands for onsite consumption, however no renewables exist on a commercial or utility scale.
Both the fossil and renewable energy industries are forecasted to grow in Pennsylvania in the years to come. The complex decisions and obligations to develop energy resources on PA public lands should include thoughtful management and fair use of these public lands for all energy resources.
For more information and details, check out the entire comprehensive report on our website: www.francis.edu/energy.
This work was supported by The Heinz Endowments.
https://www.fractracker.org/a5ej20sjfwe/wp-content/uploads/2017/12/PA-State-Lands-Drilling-Lenker.jpg400900Guest Authorhttps://www.fractracker.org/a5ej20sjfwe/wp-content/uploads/2025/09/2025-Wordmark-Logo.pngGuest Author2017-12-19 11:42:542021-04-15 15:02:04Energy development is happening on your state lands, Pennsylvania
We live in a complex environment of local, regional, national, and international issues. We are constantly bombarded with a news cycle that regenerates at increasingly dizzying speeds. How can we possibly know what is truly important when hyped up twitter controversies clog up our news feeds?
In this quantity-over-quality culture, many of the most important issues and fights for civil rights and energy justice become casualties of a regression to ignorance.
At FracTracker, we disagree with this tactic – especially as it relates to the protests at Standing Rock. FracTracker has previously written about these demonstrations (shown in the map above), and has also analyzed and mapped data on oil spills from pipelines in North Dakota. We will continue FracTracker’s coverage of Standing Rock and the Water Protectors who fought – and continue to fight – the Dakota Access Pipeline (DAPL), known as the Black Snake.
Following the Fight
For those unaware, the fight against the Dakota Access Pipeline operated by Energy Transfer Partners, continues. While the project was green-lighted by the Trump Administration and Bakken oil began flowing in June of 2017, the court has returned the permits to the U.S. Army Corps of Engineers. A U.S. District Court judge ruled that the initial approval of the pipeline did not undergo adequate study of its environmental consequences. The finding stated that the Army Corps provided a flawed model, inadequate for predicting the full impacts of a leak under Lake Oahe. The model does not consider what would happen in the event of a leak under the lake. It models only benzene — one of many toxic chemicals present in crude oil — and models its movement in an unrealistic manner. Energy Transfer Partners claims the model is conservative, but it massively underestimates the potential impacts on human health and wildlife. The Army Corps provides no plan to contain an underground leak or clean contaminated soil and groundwater under Lake Oahe.
On a related note, DAPL’s parent company, Energy Transfer Partners, said in a recent annual report that it may not have sufficient liquid assets to finance a major cleanup project and would likely pass those costs onto local landowners and federal taxpayers. Energy Transfer Partners has since filed a racketeering lawsuit seeking $300 million in damages from the Red Warrior Camp at Standing Rock.
… the agency could simply revise or update its environmental review and again conclude that no EIS (environmental impact statement) is required. If that happens, additional legal challenges are likely. The Tribe believes this court decision should trigger a full EIS, including consideration of route alternatives, just as the Obama administration proposed in December.
Normally, when a permit is issued in violation of the National Environmental Protection Act (NEPA), operations are suspended, which would have forced the DAPL to shut down while the review is conducted. Contrary to the usual protocol, on October 11, 2017 a federal judge ruled that the pipeline will remain operational pending the environmental review by the Army Corps. Standing Rock Sioux Chairman Dave Archambault II has said in a statement, however, “Just because the oil is flowing now doesn’t mean that it can’t be stopped.”
More Information and Resources
The Lakota People’s Law Project (LPLP) has been a resource to Lakota country – an area comprised of nine Indian reservation in North and South Dakota – since 2004. The LPLP supports a number of campaigns including divestment and energy justice, and has published several reports:
Special thanks to the Lakota People’s Law Project and Rachel Hallett-Ralston for the information provided.
In January of 2017, 76 Water Protectors including Chase Iron Eyes were arrested on land granted to the Standing Rock Lakota Sioux Tribe under the 1851 Treaty of Fort Laramie. Chase Iron Eyes, Lead Counsel of the Lakota People’s Law Project, has been charged with felony incitement to riot and misdemeanor criminal trespass. In the interview above, Chase Iron Eyes discusses his involvement with Standing Rock and the political pressures to make an example out of him. Read the Lakota People’s Law Project petition here.
By Kyle Ferrar, Western Program Coordinator, FracTracker Alliance
When we hear his call, we hear no mere bird. We hear the trumpet in the orchestra of evolution. He is the symbol of our untamable past, of that incredible sweep of millennia which underlies and conditions the daily affairs of birds and men…” ~ Aldo Leopold, on the Sandhill Crane, in “Marshland Elegy”
Dilbit – or diluted bitumen – is refined from the naturally-occurring tar sands deposits in Alberta, Canada. In March 2017, I applied to the Nebraska Public Service Commission for standing as an intervenor in the Commission’s consideration of TransCanada’s request for a permit to construct a pipeline transporting dilbit – a project referred to as the Keystone XL pipeline. Below are my reflections on the battle against the permitting process, and how FracTracker’s maps ensured the Sandhill Crane’s voice made it into public record.
A Pipeline’s History
The Keystone 1 pipeline carries the dilbit from Alberta, to Steele City, Nebraska, and ultimately to Port Arthur, Texas and export refineries along the Gulf Coast. The state of Montana had already approved the Keystone XL project, as had the state of South Dakota. The decision of the South Dakota Public Utilities Commission was appealed, however, and has now worked its way to the South Dakota Supreme Court, where it is pending.
Resistance to TransCanada’s oil and gas infrastructure projects is not new. Beginning in 2010, some Nebraska farmers and ranchers joined forces with tribal nations in the Dakotas, who were also fighting TransCanada’s lack of proper tribal consultation regarding access through traditional treaty territory. The indigenous nations held certain retained rights as agreed in the 1868 Fort Laramie Treaty between the United States government and the nine tribes of the Great Sioux Nation. The tribes were also protesting TransCanada’s flaunting of the National Historic Preservation Act’s protections of Native American sacred sites and burial grounds. Further, although TransCanada was largely successful in securing the easements needed in Nebraska to construct the pipeline, there were local holdouts refusing to negotiate with the company. TransCanada’s subsequent attempts to exercise eminent domain resulted in a number of lawsuits.
In January of 2015, then-President Barack Obama denied the international permit TransCanada needed. While that denial was celebrated by many, everyone also understood that a new president could well restore the international permit. Indeed, as one of his first actions in January 2017, the new Republican president signed an executive order granting the permit, and the struggle in Nebraska was reignited.
“What Waters Run Through My Veins…”
While I am a long-time resident of New York, I grew up in the Platte River Valley of South Central Nebraska, in a town where my family had and continues to have roots – even before Nebraska became a state. There was never a question in my mind that in this particular permitting process I would request status as an intervenor; for me, the matter of the Keystone XL Pipeline went far beyond the legal and political and energy policy questions that were raised and were about to be considered. It was about who I am, how I was raised, what I was taught, what waters run through my veins as surely as blood, and who my own spirit animals are, the Sandhill Cranes.
Bardaglio (age 3) and her father, along the banks of the Platte River
When we were growing up, our father told us over and over and over about why Nebraska was so green. The Ogallala Aquifer, he said, was deep and vast, and while eight states partially sat atop this ancient natural cistern, nearly all of Nebraska floated on this body. Nebraska was green, its fields stretching to the horizon, because, as our father explained, the snow runoff from the Rockies that flowed into our state and was used eleven times over was cleansed in water-bearing sand and gravel on its way to the Missouri on our eastern boundary, thence to the Mississippi, and finally to the Gulf.
I grew up understanding that the Ogallala Aquifer was a unique treasure, the largest freshwater aquifer in the world, the lifeblood for Nebraska’s agriculture and U.S. agriculture generally, and worthy of protection. I thought about the peril to the aquifer because of TransCanada’s plans, should there be a spill, and the additional threats an accident would potentially pose to Nebraska’s rivers, waterways and private wells.
The Ogallala Aquifer
Knowing that climate change is real, terrifying, and accelerating, I recognized that a warming world would increasingly depend on this aquifer in the nation’s midsection for life itself.
Migration of the Sandhill Cranes
As I thought about how I would fight the KXL, another narrative took shape rising out of my concern for the aquifer. Growing up in the South Central Platte River Valley, I – and I daresay most everyone who lives there – have been captivated by the annual migration of the Sandhill Cranes, plying the skies known as the Central Flyway. As sure as early spring comes, so do the birds. It may still be bitterly cold, but these birds know that it is time to fly. And so they do – the forward scouts appearing in winter grey skies, soon followed by some 500,000 – 600,000 thousand of them, darkening the skies, their cries deafening and their gorgeous archaeopteryx silhouettes coming in wave after wave like flying Roman Legions.
To this day, no matter where I am, the first thing in my sinews and bones when winter begins to give way is the certainty that the birds are coming, I feel them; they are back. They are roosting on the sandbars in the braided river that is the Platte and gleaning in the stubbled fields abutting it… they are home.
Scientists estimate that at least one-third of the entire North American population of Sandhill Cranes breed in the boreal forest of Canada and Alaska…
Scientists estimate that approximately 80 percent of all Sandhill Cranes in North America use a 75-mile stretch of Nebraska’s Platte River during spring migration. From March to April, more than 500,000 birds spend time in the area preparing for the long journey north to their breeding grounds in Canada and Alaska. During migration, the birds may fly as much as 400 miles in one day.
Sandhill Cranes rely on open freshwater wetlands for most of their lifecycle. Degradation of these kinds of wetland habitats is among the most pressing threats to the survival of Sandhill Cranes. (Emphasis added)
Giving Sandhill Cranes a Voice
But how could I make the point about the threat TransCanada posed to the migratory habitat of the Sandhill Cranes (and endangered Whooping Cranes, pelicans, and hummingbirds among the other thermal riders who also migrate with them)? Books, scientific papers, lectures – all the words in the world – cannot describe this ancient rite, this mysterious primal navigation of the unique pathway focusing on this slim stretch of river, when viewed from a global perspective a fragile skein in a fragile web in a biosphere in peril.
In my head I called it a river of birds in the grassland of sky. And I am so grateful to my friend, Karen Edelstein at FracTracker Alliance, for her willingness to help map and illustrate the magnificence of the migration flyway in the context of the three proposed options for the KXL pipeline.
Karen prepared two maps for me, but my favorite is the one above.
It shows an ancient, near-primordial, near-mystical event. Guided by rudders and instinct we can barely comprehend, in concert with earth’s intrinsic and exquisitely-designed balance, and as certain as a sunrise, a sunset or a moon rise, these oldest of crane species find their ways through the heavens. They hew to certainties that eclipse the greed of multinational corporations like TransCanada, who barely even pay lip service to the integrity of anything over which they can’t exert dominion. To say they don’t respect the inherent rights of species other than our own, or to ecological communities that don’t directly include us, is an understatement, and a damning comment on their values.
I was prepared for pushback on these maps from TransCanada. And in truth, the company was successful in an in limine motion to have certain exhibits and parts of my testimony stricken from the official record of the proceedings.
But not the maps.
In fact, too many other intervenors to count, as well as several of the lawyers involved in the proceedings commented to me on the beauty and accuracy of the maps. And not only are they now a part of the permanent record of the Nebraska Public Service Commission, should there be an appeal (which all of us expect), on both sides of the issue, there is a very good possibility they will be incorporated into the formal testimonies by the lawyers as the matter moves through the appeals process.
Taking Action, Speaking Out
Ordinary citizens must figure out how to confront the near-impenetrable stranglehold of multi-national corporations whose wealth is predicated on the continuance of fossil fuels as the primary sources of energy. We have had to become more educated, more activist, and more determined to fight the destruction that is now assured if we fail to slow down the impacts of climate change and shift the aggregate will of nations towards renewable energy.
Many activists do not realize that they can formally intervene at the state level in pipeline and infrastructure permitting processes. In doing so, the voice of the educated citizen is amplified and becomes a threat to these corporations whose business models didn’t account for systematic and informed resistance in public agencies’ heretofore pro forma proceedings. The publicly-available documents and filings from corporations can be important tools for “speaking truth to power” when paired with the creative tools born of necessity by the environmental movement.
Technology is value-neutral, but as I learned – as did many others in the Keystone XL Pipeline fight – in skilled hands it becomes a weapon in the struggle for the greater good.
I will be forever grateful for FracTracker, and will be interested to see how others use this tool in the fights that are sure to come.
EXCELSIOR!
For more background on the natural history of Sandhill Cranes, please view this video produced by The Crane Trust.
Wrexie Bardaglio is a Nebraska native living in Covert, New York. She worked for ten years for a member of Congress as a legislative assistant with a focus on Indian affairs and for a DC law firm as legislative specialist in Indian affairs. She left politics to open a bookstore in suburban Baltimore. She has been active in the Keystone XL fights in Nebraska and South Dakota and in fracking and gas infrastructure fights in New York.
This article’s feature image of a Sandhill Crane is the work of a U.S. Fish and Wildlife Service employee, taken or made as part of that person’s official duties. As a work of the U.S. federal government, the image is in the public domain.
FracTracker Alliance makes hundreds of maps, analyses, and photos available for free to frontline communities, grassroots groups, NGO’s, and many other organizations concerned about the industry to use in their oil and gas campaigns. To address an issue, you need to be able to see it.
However, we rely on funders and donations – and couldn’t do all of this without your help!
https://www.fractracker.org/a5ej20sjfwe/wp-content/uploads/2017/11/Sandhill-Crane-CreativeCommons-Feature.jpg400900Guest Authorhttps://www.fractracker.org/a5ej20sjfwe/wp-content/uploads/2025/09/2025-Wordmark-Logo.pngGuest Author2017-11-08 15:02:182021-04-15 15:02:07Giving Voice to the Sandhill Cranes: Place-based Arguments against Keystone XL
Oil and gas operators are polluting groundwater in Colorado, and the state and U.S. EPA are granting them permission with exemptions from the Safe Drinking Water Act.
FracTracker Alliance’s newest analysis attempts to identify groundwater risks in Colorado groundwater from the injection of oil and gas waste. Specifically, we look at groundwater monitoring data near Class II underground injection control (UIC) disposal wells and in areas that have been granted aquifer exemptions from the underground source of drinking water rules of the Safe Drinking Water Act (SDWA). Momentum to remove amend the SDWA and remove these exemption.
Aquifer exemptions are granted to allow corporations to inject hazardous wastewater into groundwater aquifers. The majority, two-thirds, of these injection wells are Class II, specifically for oil and gas wastes.
The results of this assessment provide insight into high-risk issues with aquifer exemptions and Class II UIC well permitting standards in Colorado. We identify areas where aquifer exemptions have been granted in high quality groundwater formations, and where deep underground aquifers are at risk or have become contaminated from Class II disposal wells that may have failed.
Of note: On March 23, 2016, NRDC submitted a formal petition urging the EPA to repeal or amend the aquifer exemption rules to protect drinking water sources and uphold the Safe Drinking Water Act. Learn more
Research shows injection wells do fail
Class II injection well in Colorado explodes and catches fire. Photo by Kelsey Brunner for the Greeley Tribune.
Disposal of oil and gas wastewater by underground injection has not yet been specifically researched as a source of systemic groundwater contamination nationally or on a state level. Regardless, this issue is particularly pertinent to Colorado, since there are about 3,300 aquifer exemptions in the US (view map), and the majority of these are located in Montana, Wyoming, and Colorado. There is both a physical risk of danger as well as the risk of groundwater contamination. The picture to the right shows an explosion of a Class II injection well in Greeley, CO, for example.
Applicable and existing research on injection wells shows that a risk of groundwater contamination of – not wastewater – but migrated methane due to a leak from an injection well was estimated to be between 0.12 percent of all the water wells in the Colorado region, and was measured at 4.5 percent of the water wells that were tested in the study.
A recent article by ProPublica quoted Mario Salazar, an engineer who worked for 25 years as a technical expert with the EPA’s underground injection program in Washington:
In 10 to 100 years we are going to find out that most of our groundwater is polluted … A lot of people are going to get sick, and a lot of people may die.
Also in the ProPublic article was a study by Abrahm Lustgarten, wherein he reviewed well records and data from more than 220,000 oil and gas well inspections, and found:
Structural failures inside injection wells are routine.
Between 2007-2010, one in six injection wells received a well integrity violation.
More than 7,000 production and injection wells showed signs of well casing failures and leakage.
…groundwater contamination problems related to the subsurface disposal of liquid wastes by deep-well injection have been reviewed in the literature since 1950 (Morganwalp, 1993) and groundwater contamination accordingly is a serious problem.
According to his textbook, a 1974 U.S. EPA report specifically warns of the risk of corrosion by oil and gas waste brines on handling equipment and within the wells. The potential effects of injection wells on groundwater can even be reviewed in the U.S. EPA publications (1976, 1996, 1997).
As early as 1969, researchers Evans and Bradford, who reported on the dangers that could occur from earthquakes on injection wells near Denver in 1966, had warned that deep well injection techniques offered temporary and not long-term safety from the permanent toxic wastes injected.
Will existing Class II wells fail?
For those that might consider data and literature on wells from the 1960’s as being unrepresentative of activities occurring today, of the 587 wells reported by the Colorado’s oil and gas regulatory body, COGCC, as “injecting,” 161 of those wells were drilled prior to 1980. And 104 were drilled prior to 1960!
Wells drilled prior to 1980 are most likely to use engineering standards that result in “single-point-of-failure” well casings. As outlined in the recent report from researchers at Harvard on underground natural gas storage wells, these single-point-of-failure wells are at a higher risk of leaking.
It is also important to note that the U.S. EPA reports only 569 injection wells for Colorado, 373 of which may be disposal wells. This is a discrepancy from the number of injection wells reported by the COGCC.
Aquifer Exemptions in Colorado
According to COGCC, prior to granting a permit for a Class II injection well, an aquifer exemption is required if the aquifer’s groundwater test shows total dissolved solids (TDS) is between 3,000 and 10,000 milligrams per liter (mg/l). For those aquifer exemptions that are simply deeper than the majority of current groundwater wells, the right conditions, such as drought, or the needs of the future may require drilling deeper or treating high TDS waters for drinking and irrigation. How the state of Colorado or the U.S. EPA accounts for economic viability is therefore ill-conceived.
Data Note: The data for the following analysis came by way of FOIA request by Clean Water Action focused on the aquifer exemption permitting process. The FOIA returned additional data not reported by the US EPA in the public dataset. That dataset contained target formation sampling data that included TDS values. The FOIA documents were attached to the EPA dataset using GIS techniques. These GIS files can be found for download in the link at the bottom of this page.
Map 1 above shows the locations of aquifer exemptions in Colorado, as well as the locations of Class II injection wells. These sites are overlaid on a spatial assessment of groundwater quality (a map of the groundwater’s quality), which was generated for the entire state. The changing colors on the map’s background show spatial trends of TDS values, a general indicator of overall groundwater quality.
In Map 1 above, we see that the majority of Class II injection wells and aquifer exemptions are located in regions with higher quality water. This is a common trend across the state, and needs to be addressed.
Our review of aquifer exemption data in Colorado shows that aquifer exemption applications were granted for areas reporting TDS values less than 3,000 mg/l, which contradicts the information reported by the COGCC as permitting guidelines. Additionally, of the 175 granted aquifer exemptions for which the FOIA returned data, 141 were formations with groundwater samples reported at less than 10,000 mg/l TDS. This is half of the total number (283) of aquifer exemptions in the state of Colorado.
When we mapped where class II injection wells are permitted, a total of 587 class II wells were identified in Colorado, outside of an aquifer exemption area. Of the UIC-approved injection wells identified specifically as disposal wells, at least 21 were permitted outside aquifer exemptions and were drilled into formations that were not hydrocarbon producing. Why these injection wells are allowed to operate outside of an aquifer exemption is unknown – a question for regulators.
You can see in the map that most of the aquifer exemptions and injection wells in Colorado are located in areas with lower TDS values. We then used GIS to conduct a spatial analysis that selected groundwater wells within five miles of the 21 that were permitted outside aquifer exemptions. Results show that groundwater wells near these sites had consistently low-TDS values, meaning good water quality. In Colorado, where groundwater is an important commodity for a booming agricultural industry and growing cities that need to prioritize municipal sources, permitting a Class II disposal well in areas with high quality groundwater is irresponsible.
In Map 2, above, the locations of groundwater wells in Colorado are shown. The colors of the dots represent the concentration of TDS on the right and well depth on the left side of the screen. By sliding the bar on the map, users can visualize both. This feature allows people to explore where deep wells also are characterized by high levels of TDS. Users can also see that areas with high quality low TDS groundwater are the same areas that are the most developed with oil and gas production wells and Class II injection wells, shown in gradients of purple.
Statistical analysis of this spatial data gives a clearer picture of which regions are of particular concern; see below in Map 3.
In Map 3, above, the data visualized in Map 2 were input into a hot-spots analysis, highlighting where high and low values of TDS and depth differ significantly from the rest of the data. The region of the Front Range near Denver has significantly deeper wells, as a result of population density and the need to drill municipal groundwater wells.
The Front Range is, therefore, a high-risk region for the development of oil and gas, particularly from Class II injection wells that are necessary to support development.
Methods Notes: The COGCC publishes groundwater monitoring data for the state of Colorado, and groundwater data is also compiled nationally by the Advisory Committee on Water Information (ACWI). (Data from the National Groundwater Monitoring Network is sponsored by the ACWI Subcommittee on Ground Water.) These datasets were cleaned, combined, revised, and queried to develop FracTracker’s dataset of Colorado groundwater wells. We cleaned the data by removing sites without coordinates. Duplicates in the data set were removed by selecting for the deepest well sample. Our dataset of water wells consisted of 5,620 wells. Depth data was reported for 3,925 wells. We combined this dataset with groundwater data exported from ACWI. Final count for total wells with TDS data was 11,754 wells. Depth data was reported for 7,984 wells. The GIS files can be downloaded in the compressed folder at the bottom of this page.
Site Assessments – Exploring Specific Regions
Particular regions were further investigated for impacts to groundwater, and to identify areas that may be at a high risk of contamination. There are numerous ways that groundwater wells can be contaminated from other underground activity, such as hydrocarbon exploration and production or waste injection and disposal. Contamination could be from hydraulic fracturing fluids, methane, other hydrocarbons, or from formation brines.
From the literature, brines and methane are the most common contaminants. This analysis focuses on potential contamination events from brines, which can be detected by measuring TDS, a general measure for the mixture of minerals, salts, metals and other ions dissolved in waters. Brines from hydrocarbon-producing formations may include heavy metals, radionuclides, and small amounts of organic matter.
Wells with high or increasing levels of TDS are a red flag for potential contamination events.
Methods
Groundwater wells at deep depths with high TDS readings are, therefore, the focus of this assessment. Using GIS methods we screened our dataset of groundwater wells to only identify those located within a buffer zone of five miles from Class II injection wells. This distance was chosen based on a conservative model for groundwater contamination events, as well as the number of returned sample groundwater wells and the time and resources necessary for analysis. We then filtered the groundwater wells dataset for high TDS values and deep well depths to assess for potential impacts that already exist. We, of course, explored the data as we explored the spatial relationships. We prioritized areas that suggested trends in high TDS readings, and then identified individual wells in these areas. The data initially visualized were the most recent sampling events. For the wells prioritized, prior sampling events were pulled from the data. The results were graphed to see how the groundwater quality has changed over time.
Case of Increasing TDS Readings
If you zoom to the southwest section of Colorado in Map 2, you can see that groundwater wells located near the injection well 1 Fasset SWD (EPA) (05-067-08397) by Operator Elm Ridge Exploration Company LLC were disproportionately high (common). Groundwater wells located near this injection well were selected for, and longitudinal TDS readings were plotted to look for trends in time. (Figure 1.)
The graphs in Figure 1, below, show a consistent increase of TDS values in wells near the injection activity. While the trends are apparent, the data is limited by low numbers of repeated samples at each well, and the majority of these groundwater wells have not been sampled in the last 10 years. With the increased use of well stimulation and enhanced oil recovery techniques over the course of the last 10 years, the volumes of injected wastewater has also increased. The impacts may, therefore, be greater than documented here.
This area deserves additional sampling and monitoring to assess whether contamination has occurred.
Figures 1a and 1b. The graphs above show increasing TDS values in samples from groundwater wells in close proximity to the 1 Fassett SWD wellsite, between the years 2004-2015. Each well is labeled with a different color. The data for the USGS well in the graph on the right was not included with the other groundwater wells due to the difference in magnitude of TDS values (it would have been off the chart).
Groundwater Contamination Case in 2007
We also uncovered a situation where a disposal well caused groundwater contamination. Well records for Class II injection wells in the southeast corner of Colorado were reviewed in response to significantly high readings of TDS values in groundwater wells surrounding the Mckinley #1-20-WD disposal well.
When the disposal well was first permitted, farmers and ranchers neighboring the well site petitioned to block the permit. Language in the grant application is shown below in Figure 2. The petitioners identified the target formation as their source of water for drinking, watering livestock, and irrigation. Regardless of this petition, the injection well was approved. Figure 3 shows the language used by the operator Energy Alliance Company (EAC) for the permit approval, which directly contradicts the information provided by the community surrounding the wellsite. Nevertheless, the Class II disposal well was approved, and failed and leaked in 2007, leading to the high TDS readings in the groundwater in this region.
Figure 2. Petition by local landowners opposing the use of their drinking water source formation for the site of a Class II injection disposal well.
Figure 3. The oil and gas operation EAC claims the Glorietta formation is not a viable fresh water source, directly contradicting the neighboring farmers and ranchers who rely on it.
Figure 4. The COGCC well log report shows a casing failure, and as a result a leak that contaminated groundwater in the region.
Areas where lack of data restricted analyses
In other areas of Colorado, the lack of recent sampling data and longitudinal sampling schemes made it even more difficult to track potential contamination events. For these regions, FracTracker recommends more thorough sampling by the regulatory agencies COGCC and USGS. This includes much of the state, as described below.
Southeastern Colorado
Our review of the groundwater data in southeastern Colorado showed a risk of contamination considering the overlap of injection well depths with the depths of drinking water wells. Oil and gas extraction and Class II injections are permitted where the aquifers include the Raton formation, Vermejo Formation, Poison Canyon Formation and Trinidad Sandstone. Groundwater samples were taken at depths up to 2,200 ft with a TDS value of 385 mg/l. At shallower depths, TDS values in these formations reached as high as 6,000 mg/l, and 15 disposal wells are permitted in aquifer exemptions in this region. Injections in this area start at around 4,200 ft.
In Southwestern Colorado, groundwater wells in the San Jose Formation are drilled to documented depths of up to 6,000 feet with TDS values near 2,000 mg/l. Injection wells in this region begin at 565 feet, and those used specifically for disposal begin at below 5,000 feet in areas with aquifer exemptions. There are also four disposal wells outside of aquifer exemptions injecting at 5,844 feet, two of which are not injecting into active production zones at depths of 7,600 and 9,100 feet.
Western Colorado
In western Colorado well Number 1-32D VANETA (05-057-06467) by Operator Sandridge Exploration and Production LLC’s North Park Horizontal Niobara Field in the Dakota-Lokota Formation has an aquifer exemption. The sampling data from two groundwater wells to the southeast, near Coalmont, CO, were reviewed, but we can’t get a good picture due to the lack of repeat sampling.
In Northwestern Colorado near Walden, CO and the McCallum oil field, two groundwater wells with TDS above 10,000 ppm were selected for review. There are 21 injection wells in the McCallum field to the northwest. Beyond the McCallum field is the Battleship field with two wastewater disposal wells with an aquifer exemption. West of Grover, Colorado, there are several wells with high TDS values reported for shallow wells. Similar trends can be seen near Vernon. The data on these wells and wells from along the northern section of the Front Range, which includes the communities of Fort Collins, Greeley, and Longmont, suffered from the same issue. Lack of deep groundwater well data coupled with the lack of repeat samples, as well as recent sampling inhibited the ability to thoroughly investigate the threat of contamination.
Trends and Future Development
Current trends in exploration and development of unconventional resources show the industry branching southwest of Weld County towards Fort Collins, Longmont, Broomfield and Boulder, CO.
These regions are more densely populated than the Front Range county of Weld, and as can be seen in the maps, the drinking water wells that access groundwaters in these regions are some of the deepest in the state.
This analysis shows where Class II injection has already contaminated groundwater resources in Colorado. The region where the contamination has occurred is not unique; the drinking water wells are not particularly deep, and the density of Class II wells is far from the highest in the state.
Well casing failures and other injection issues are not exactly predictable due to the variety of conditions that can lead to a well casing failure or blow-out scenario, but they are systemic. The result is a hazardous scenario where it is currently difficult to mitigate risk after the injection wells are drilled.
Allowing Class II wells to expand into Front Range communities that rely on deep wells for municipal supplies is irresponsible and dangerous.
The encroachment of extraction into these regions, coupled with the support of Class II injection wells to handle the wastewater, would put these groundwater wells at particular risk of contamination. Based on this analysis, we recommend that regulators take extra care to avoid permitting Class II wells in these regions as the oil and gas industry expands into new areas of the Front Range, particularly in areas with dense populations.
Feature Image: Joshua Doubek / WIKIMEDIA COMMONS
Article by: Kyle Ferrar, Western Program Coordinator, FracTracker Alliance
October 31, 2017 Edit: This post originally cited the Clean Water Act instead of the Safe Drinking Water Act as the source that EPA uses to grant aquifer exemptions.
https://www.fractracker.org/a5ej20sjfwe/wp-content/uploads/2017/10/kansas_wellpad.jpg400900Kyle Ferrar, MPHhttps://www.fractracker.org/a5ej20sjfwe/wp-content/uploads/2025/09/2025-Wordmark-Logo.pngKyle Ferrar, MPH2017-10-26 14:55:032021-04-15 15:02:07Groundwater risks in Colorado due to Safe Drinking Water Act exemptions
We’d like to give our readers a bit of background on aquifer exemptions, because we’re going to be covering this topic in a few upcoming blog posts. Stay tuned!
Liquid Waste Disposal
Drilling for oil and gas produces both liquid and solid waste that must be disposed of. The liquid waste from this industry is considered a “Class II waste” according to the US EPA. Aquifers are places underground capable of holding or transmitting groundwater. To dispose of Class II waste, operators are granted aquifer exemptions, by the EPA based on the state’s recommendations. The term “exemption,” specifically, refers to the Safe Drinking Water Act, which protects underground sources of drinking water (USDWs).
Therefore, these exemptions grant oil and gas operators the right to contaminate groundwaters, albeit many of the groundwater formations used for disposal in Class II wells are very deep.
There are several qualifiers for a USDW to be granted exempt from the Safe Drinking Water Act. Aquifer exemptions are granted for underground formations that are not currently used as a source of drinking water and meet one of the following criteria:
The formation contains commercially producible minerals or hydrocarbons;
The formation is so deep that recovery of water for drinking water purposes is economically or technologically impractical; or,
The formation is so contaminated that it would be economically or technologically impractical to render the water fit for human consumption.
In some states, aquifer exemptions are not approved for formations with Total Dissolved Solids (TDS*) equal to or less than 3,000 mg/l TDS.
If an underground formation qualifies for an exemption, it does not mean that groundwater cannot be used for drinking water, just that it is not currently a source of drinking water. The most precarious criteria requirement, therefore, is the determination that a USDW is simply not “economically viable” or it is “technologically impractical,” meaning that the cost of drilling a groundwater well to the depth of the aquifer (under the condition of the current need for water) may make the investment impractical. In the near future, this water may be needed and highly valued, however.
TDS = Total dissolved solids are inorganic salts (e.g. calcium, magnesium, potassium, sodium, bicarbonates, chlorides, and sulfates), as well as some organic matter, dissolved in water.
The Lay of the Land
Below, we have put together a map of aquifer exemptions in the U.S. Click on the dots and shaded areas to learn more about a particular aquifer.
By Kyle Ferrar, Western Program Coordinator, FracTracker Alliance
https://www.fractracker.org/a5ej20sjfwe/wp-content/uploads/2015/07/Injection-Feature.jpg400900Kyle Ferrar, MPHhttps://www.fractracker.org/a5ej20sjfwe/wp-content/uploads/2025/09/2025-Wordmark-Logo.pngKyle Ferrar, MPH2017-10-26 09:31:202021-04-15 15:02:09What are aquifer exemptions? Permitted exemptions from the Safe Drinking Water Act
How long will unconventional oil and gas production from PA’s Marcellus Shale continue? The number of active wells may give us a clue.
We have recently updated the PA Shale Viewer, our map of unconventional wells in Pennsylvania. As I updated the statistics to reflect the updated data, I noticed that the number of wells with an active status ticked downward, just as it had for the previous update.
Wells on this map are shown in purple when zoomed out, but are organized by status as you continue to zoom in. The various statuses are shown below, as defined by the Pennsylvania Department of Environmental Protection (DEP).
Active – permit has been issued and well may or may not have been drilled or producing, but has not been plugged.
Proposed but Never Materialized – permit was issued, but expired prior to the commencement of drilling.
Plugged OG Well – permit issued and well has been plugged by well operator.
Operator Reported Not Drilled – permit issued, but operator reported to DEP that they never drilled the well.
DEP Abandoned List – an abandoned well that has been inspected by DEP.
DEP Orphan List – A well abandoned prior to April 18, 1985, that has not been affected or operated by the present owner or operator and from which the present owner, operator or lessee has received no economic benefit other than as a land.
DEP Plugged – a DEP Abandoned or DEP Orphan well that has been plugged by DEP,
Regulatory Inactive Status – a well status that is requested by well operator and has been granted by DEP. Well is capable of producing, but is temporarily shut in. Granted for initial 5 years and must be renewed yearly after first 5 years.
Abandoned – a well that has not been used to produce, extract or inject any gas, petroleum or other liquid within the preceding 12 months; for which equipment necessary for production, extraction or injection has been removed; or considered dry and not equipped for production.
Life Expectancy Stats
Table 1: Unconventional well locations in Pennsylvania by status. The determination of drilled locations was made by the presence of a spud date in the DEP dataset.
Currently, there are 10,586 well locations with an active status, 9,218 of which have been drilled. There 19,617 unconventional well locations in Pennsylvania when considering all status types, 10,652 of which have been drilled. The drill status was determined by whether or not there was an associated spud date in the dataset. The 13 plugged wells that lack spud dates likely represent some minor data entry errors of one sort or another, as a well would logically need to be drilled prior to being plugged.
Using the available data, we can see that 6.5% of drilled unconventional wells have been plugged, and an additional 6.9% have a regulatory inactive status, more commonly known as “shut-in” wells, leaving 86.5% of the drilled wells with an active status. Three wells are classified as abandoned, including two in Washington County attributed to Atlas Resources, LLC, and one operated by EQT Production Co. in Jefferson County. EQT submitted a request to convert the status of this latter well to inactive status in February 2016, but DEP has not made a decision on the application as of yet.
Chart 1: This chart shows the current status of unconventional wells in Pennsylvania, arranged by the year the well was drilled. Note that there are two abandoned wells in 2009 and one more in 2014, although those totals are not visible at this scale.
The top, solid blue line in Chart 1 shows the total number of unconventional wells drilled in Pennsylvania, which is based on the available spud date in the dataset. Focusing on this line for a moment, we can see a huge spike in the number of wells drilled in the early part of this decade. In fact, over 46% of the unconventional wells in the state were drilled between 2010 and 2012, and over 70% were drilled between 2010 and 2014. The 504 unconventional wells drilled in 2016 represents just over one quarter the total from 2011, when 1,959 wells were drilled. The 2017 totals are already slightly higher than 2016, with two months left to go in the year, but will not approach the totals from 2010 to 2014.
This drop-off in drilling since the 2011 peak is usually attributed to the glut of natural gas that these wells produced, and the Marcellus remains a highly productive formation, despite the considerable decline in new wells. Eventually, however, the entire formation will go into decline, which is already happening to the Barnett Shale in Texas and Haynesville Shale, among others, where peak production was several years ago in each case.
While all of three of these formations still produce significant quantities of gas, it is worth remembering that production is only half of the equation. In the Marcellus region, average costs were $6.6 million in 2014, which was projected to decrease to $6.1 million per well in 2015 according to a 2016 EIA document.
With the supply in the northeast outpacing demand, the gas prices stay low, and therefore production per well needs to be considerable to make a given well worthwhile.
Plugging Trends
Chart 2: Average days between spud date and plug date for unconventional wells in PA. Regulatory Inactive wells also include a plug date, and are included here.
Chart 2 shows the average number of days between the spud date and the plug date for wells that currently have either a plugged (n=694) or regulatory inactive (n=737) status. The regulatory inactive wells are relatively consistent in the days between when the well is drilled and temporarily plugged, which makes sense, as the operators of these wells typically intend for these wells to be shut-in upon completion.
However, it is interesting to note that wells are being plugged much more rapidly than they had been in the early part of the Marcellus boom.
Plugged unconventional wells that were drilled in 2005 (n=6) had an average of 3,081 days between these dates, while those drilled in 2016 (n=2) had and average span of 213 days.
The left (orange) axis represents the percentage of wells drilled in each year that are currently drilled. The right (blue) axis marks the total number of wells drilled in each year that are currently drilled.
Obviously there would be no way for a well drilled in 2016 to have been online for 3,081 days before being plugged. However, each of the six plugged wells drilled in 2005 were active for at least 1,899 days before being sealed, which is over five years of activity. In contrast, 99 of the 4,966 unconventional wells drilled in the previous 1,899 days have already been plugged, representing 5.2% of the total wells drilled during that time. This means that we are seeing more “misses” at this point in the formation’s history, where the amount of gas being produced doesn’t justify keeping the well open and offsetting the $6 million or more that it cost to drill the well.
We can also see that the rate of plugged wells increases dramatically after about ten years in operation. Forty-four out of 114 (39%) of unconventional wells that were drilled in 2007 are now plugged. That ratio grows two thirds of the nine wells drilled in 2005. In the industry’s boom period of 2010 to 2010, the raw number of plugged wells are elevated, peaking at 206 in 2011, but the percentage of plugged wells during those years remains proportional to the rest of the trend. The overall trend shows that an unconventional well in Pennsylvania that lasts 11 or more years is unusual.
The data show that older Marcellus wells in Pennsylvania are certainly in a state of decline, and are rapidly being plugged. While the overall production of the field remains high, it remains to be seen what will happen as the boom cycle wells drilled from 2010 to 2012 start to go offline in considerable numbers. Given that more and more wells are being drilled with very short production lives, will it continue to make sense for the industry to drill expensive wells in a formation where a return on investment is increasingly questionable? This course is difficult to predict, but economic models that take plentiful natural gas supplies for granted should consider taking a second look.
PA Shale Viewer Data Sources
Unconventional Violations
Source: PADEP
Date Range: 1-1-2000 through 10-2-2017
Notes: For the original data, follow link above to “Oil and Gas Compliance Report”. Latitude and longitude data obtained by matching with permits data (see below). There are 7,655 rows of violations data, including 6,576 distinct Violation IDs issued to 2,253 distinct unconventional wells. Due to the large number of records, this layer isn’t visible until users zoom in to 1:500,000, or about the size of a small county.
Unconventional Wells and Permits
Source: PADEP Open Data Portal
Date Range: 1-1-2000 through 10-2-2017
Notes: This data layer contains unconventional well data in Pennsylvania. However, not all of these wells have been drilled yet. This layer is categorized by well status, which includes Abandoned, Active, Operator Reported Not Drilled, Plugged OG Well, Proposed but Never Materialized, and Regulatory Inactive Status. To determine whether the well has been permitted, drilled, or plugged, look for the presence of an entry in the Permit Date, Spud Date, and Plug Date field, respectively. Altogether, there are 19,617 wells in this inventory, of which 10,586 currently have an active status. Due to the large number of records, this layer isn’t visible until users zoom in to 1:500,000, or about the size of a small county.
SkyTruth Pits (2013)
Source: SkyTruth
Date Range: 2013
Notes: Prior to December 2014, this map contained a layer of pits that were contained in Oil and Gas Locations file available on PASDA. However, that layer was far from complete – for example, it included only one pit in Washington County at a time which news reports mentioned that seven pits in the county were scheduled to be closed. Therefore, we have opted to include this crowdsourced layer developed by SkyTruth, where volunteers analyzed state aerial imagery data from 2013. SkyTruth’s methodology for developing the dataset is detailed in the link above. 529 pits have been identified through this effort.
Compressors and Processors (2016)
Source: EDF, CATF, Earthworks, FracTracker Alliance, EPA, PADEP, EIA
Date: 2016
Notes: This layer is based off of publicly available data, but is not published by any agency as a dataset. It is the result of a collaborative effort, and the data first appeared in map format on the Oil and Gas Threat Map (oilandgasthreatmap.com). Original sources include PADEP, US EPA, and US EIA. Compiling, processing, and geocoding by Environmental Defense Fund, Clean Air Task Force, Earthworks, and FracTracker Alliance. Contact Matt Kelso for more information: kelso [at] fractracker.org.
Environmental Justice Areas
Source: PADEP, via PASDA
Date: 2015
Notes: Environmental Justice (EJ) areas are Census Tracts where over 20 percent of the population is in poverty, or over 30 percent of the population is non-white. The program is designed to monitor whether there is a fair distribution of environmental benefits and burdens. In Pennsylvania, EJ areas tend to be clustered in urbanized areas, particularly near Philadelphia and Pittsburgh.
Counties
Source: US Census Bureau, FracTracker Alliance
Date Range: 2011
Notes: This file was created by dissolving the Municipalities layer (below) to the county level. This method allows for greater detail than selecting the Pennsylvania counties from a national file.
Municipalities
Source: US Census Bureau
Date Published: 2011
Notes: Viewer must be zoomed into scales of 1:1,500,000 (several counties) or larger to access.
Watersheds – Large
Source: USDA/USGS
Date Published: 2008
Notes: Clipped to outline of Pennsylvania.
Watersheds – Small
Source: USDA/USGS
Date Published: 2008
Notes: Clipped to outline of Pennsylvania. Viewer must be zoomed into scales of 1:1,500,000 (several counties) or larger to access.
By Matt Kelso, Manager of Data and Technology, FracTracker Alliance
https://www.fractracker.org/a5ej20sjfwe/wp-content/uploads/2017/10/Marcellus-PA-Feature.jpg400900Matt Kelso, BAhttps://www.fractracker.org/a5ej20sjfwe/wp-content/uploads/2025/09/2025-Wordmark-Logo.pngMatt Kelso, BA2017-10-11 09:56:342021-04-15 15:02:31What is the Life Expectancy of the Marcellus Shale?
Should public, federal lands be opened up even further for extracting minerals, oil, and gas for private ventures? FracTracker’s Karen Edelstein discusses the past, present, and potential future of many of America’s cherished natural resources and wonders.
The United States is blessed with some of the most diverse natural landscapes in the world. Through foresight of great leaders over the decades, starting in 1906 — Theodore Roosevelt, Franklin Roosevelt, Benjamin Harrison, and Jimmy Carter – to name just a few — well over a half billion acres of wilderness have been set aside as national parks, refuges, monuments, and roadless areas. Some of the most famous of these protected areas include the Grand Canyon, Acadia, and Grand Tetons National Parks. In all, the federal government owns 28% of the 2.27 billion acres of land that the United States comprises. These federal lands are administered by the Bureau of Land Management (BLM): 248.3 million acres, the US Forest Service: 192.9 million acres, US Fish and Wildlife Service: 89.1 million acres, and National Park Service: 78.9 million acres. In addition, the US Department of Defense administers 11.4 million acres.
Why are federal lands at risk?
While most people assume that federal wild lands are forever protected from development and commercial exploitation, quite the opposite is true. For most of the past century, federal lands have hunted, fished, logged and grazed by private individuals and enterprises. In addition, and in the cross-hairs of discussion here, is the practice of leasing lands to industrial interests for the purpose of extracting minerals, oil, and gas from these public lands.
Provisions for land conservation and restrictions on oil and gas extraction, in particular, became more stringent since the inception of the Environmental Protection Agency (EPA) in 1970. However, environmentalists have watched in horror as the current administration in Washington has gutted the EPA, and installed climate change-deniers and corporate executives in high levels of office throughout a range of federal agencies. Notable is the appointment of Ryan Zinke as US Secretary of the Interior. Zinke, a former businessman, has a long record of opposing environmental viewpoints around extraction of oil, coal, and gas and cutting regulations. The League of Conservation Voters gives his voting record a lifetime score of 4 percent on environmental issues. As recently as this week, Joel Clement–one of Zinke’s senior advisors–resigned his post, citing, Zinke’s poor leadership, wasting of tax-payer dollars, and denial of climate change science.
Early in his tenure as Secretary of the Interior, Zinke initiated a review of 27 national monuments, a move that environmentalists feared could lead to the unraveling of protections on millions of acres of federal land, and also relaxed regulations on oil and gas exploration in those areas. Public comment on the plans to review these national monuments was intense; when the public comment period closed on July 10, 2017, the Interior Department had received over 2.4 million comments, the vast majority of which supported keeping the existing boundaries and restrictions as they are.
Federal lands under threat by Trump Administration
The above map shows which sites are under consideration for oil, gas, or coal extraction, or face boundary reduction of up to 88%. Click here to view this map full-screen with a legend, zoom in and click on areas of interest, etc.
Who should be allowed to use these resources?
Ranchers, loggers, and recreational hunters and anglers felt that the 1906 Antiquities Act had been over-interpreted, and therefore advocated for Zinke’s proposal. (The Act was the first U.S. law to provide protection for any general kind of cultural or natural resource.)
However, environmental advocates such as the National Parks Conservation Association (NPCA), the Natural Resources Defense Council (NRDC), and others were adamantly opposed to opening up federal lands resources for extraction, citing the need for environmental protection, public access, and, importantly, concerns that the lands would be more easily transferred to state, local, or private interests. Environmentalists also argue that the revenue generated by tourism at these pristine sites would far exceed that generated by extractive resource activities. Attorneys and staff from NPCA and NRDC argued legislation in effect since the 1970s requires role for Congress in changing the boundaries of existing monuments. The President or his cabinet do not have that sole authority.
The Wilderness Society estimates that already, 90% of the land in the US West, owned by the Bureau of Land Management, is open for oil and gas leasing, while only 10% is set aside for other uses (Figure 2). According to information from Sourcewatch, in 2013, these lands included 12 National Monuments, Parks, Recreation Areas, and Preserves that had active drilling, and another 31 that might see possible drilling in the future.
Figure 2. Percent of land already available for oil and gas leasing in the West. Source: The Wilderness Society
What Zinke has Proposed
True to expectation, in August of 2017, Zinke issued a recommendation to shrink the boundaries of several national monuments to allow coal mining and other “traditional uses” — which appear to include large-scale timbering, as well as potentially oil and gas drilling. Sites include Bears Ears and Grand Staircase-Escalante in Utah (encompassing more than 3.2 million acres in lands considered sacred to Dine/Navajo people), Cascade-Siskiyou in Oregon, and Gold Butte in Nevada. According to Zinke’s report, Grand Staircase-Escalante contains “an estimated several billion tons of coal and large oil deposits”. Zinke lifted Obama-era restrictions on coal leasing on federal lands this past March, 2017. However, just last week, a federal judge ruled that the current Administration’s efforts to suspend methane emission restrictions from pipelines crossing public lands were illegal. These are merely a few of the Obama-era environmental protections that Zinke is attempting to gut.
Bears Ears National Monument, designated by President Barack Obama, contains tens of thousands of cultural artifacts, and is facing not only a threat of boundary shrinkage, but also a relaxing use restrictions within the Monument area. The current President has referred to Obama’s designation of the monument as “an egregious abuse of power.” Grand Staircase-Escalante was designated by President Bill Clinton, and the Cascade-Siskiyou National Monument was designated by Clinton and expanded by President Obama.
The recommendation details were not made public in August, however, and only came to light in September through a leaked memo, published in The Washington Post. In the memo, Secretary Zinke noted that the existing boundaries were “arbitrary or likely politically motivated or boundaries could not be supported by science or reasons of resource management.” The memo goes on to say that “[i]t appears that certain monuments were designated to prevent economic activity such as grazing, mining and timber production rather than to protect specific objects.” In addition, Zinke is advocating for the modification for commercial fishing uses of two marine national monuments: the Pacific Remote Islands, and Rose Atoll.
… plans to leave six designations in place: Colorado’s Canyons of the Ancients; Idaho’s Craters of the Moon; Washington’s Hanford Reach; Arizona’s Grand Canyon-Parashant; Montana’s Upper Missouri River Breaks; and California’s Sand to Snow.
Perplexingly, the report is silent on 11 of the 27 monuments named in the initial proposal. One of which is the Papahanaumokuakea Marine National Monument — over 725,000 square miles of ocean — in the northwestern Hawaiian Islands.
The report also requests tribal co-management of “cultural resources” at Bears Ears, Rio Grande del Norte, and Organ Mountain-Desert Peaks. While one could imagine that greater involvement of indigenous people in the federal government’s management of the sacred landscapes to be a potentially positive improvement, the report is silent on the details. More information on tribal co-management and other options can be gleaned from a series of position papers written by the Property and Environment Research Center.
Of other note: Zinke is also suggesting the establishment of three new national monuments, including the 130,000-acre Badger-Two Medicine area in Montana, a sacred site of the Blackfeet Nation. Badger-Two Medicine was the site of a more than 30-year battle to retire 32,000 acres of oil and gas leases. The tribe prevailed, and the leases were canceled in November, 2016.
With potential lawsuits pending about boundary changes, galvanized push-back from environmental and tribal interests on resource management definitions for the targeted monuments, and general unpredictability on policy details and staffing in Washington, the trajectory of how this story will play out remains uncertain. FracTracker will continue to monitor for updates, and provide additional links in this story as they unfold.
Check out National Geographic’s bird’s eye view of these protected areas for a stunning montage, descriptions, and more maps of the monuments under consideration.
National Monuments under consideration for change by Secretary Zinke:
Accessed from ArcGIS Online by FracTracker Alliance, 28 August 2017. Data apparently from federal sources, such as BLM, NPS, etc. Dataset developed by Kira Minehart, GIS intern with Natural Resources Defense Council.0=not currently targeted for policy or boundary change1= targeted for expanded resource use, such as logging, fishing, etc. 2=targeted for shrinkage of borders, and expanded resource use.
National Park Service lands with current or potential oil and gas drilling:
Downloaded by FracTracker Alliance on 9 November 2016, from National Park Service. Drilling information from here. List of sites threatened by oil and gas drilling from here (23 January 2013).
Badger-Two Medicine potential Monument: Shapefile downloaded from USGS by FracTracker Alliance on 28 August 2017. This map layer consists of federally owned or administered lands of the United States, Puerto Rico, and the U.S. Virgin Islands. For the most part, only areas of 320 acres or more are included; some smaller areas deemed to be important or significant are also included. There may be private inholdings within the boundaries of Federal lands in this map layer. Some established Federal lands which are larger than 320 acres are not included in this map layer, because their boundaries were not available from the owning or administering agency. Complete metadata available here.
By Karen Edelstein, Eastern Program Coordinator, FracTracker Alliance
https://www.fractracker.org/a5ej20sjfwe/wp-content/uploads/2017/10/IndianCreek-BLM-Feature.jpg400900Karen Edelsteinhttps://www.fractracker.org/a5ej20sjfwe/wp-content/uploads/2025/09/2025-Wordmark-Logo.pngKaren Edelstein2017-10-10 12:13:092021-04-15 15:02:32Nationally treasured federal lands face threats by oil, gas, and other extractive uses
The River Healers have droned multiple fracking sites in the Greater Chaco Area (New Mexico) impacted by explosions, fires, spills, and methane. See what they are finding. Hear their story.
By Tom Burkett – River Healer Spokesperson, New Mexico Watchdog
The Greater Chaco region is known to the Diné (Navajo) as Dinétah, the land of their ancestors. It contains countless sacred sites that date to the Anasazi and is home of the Bisti Badlands and Chaco Culture National Historical Park, a World Heritage Site. Currently WPX Energy has rights to lease about 100,000 acres of federal, state, and Navajo allottee lands in the oil rich San Juan Basin, which includes Greater Chaco.1 WPX Energy along with other fracking companies plan to continue establishing crude oil fracking wells on these sacred lands, although the Greater Chaco community has spoken out against fracking and continue to call for more safety and oversight from New Mexico state regulatory bodies such as the EMNRD Oil Conservation Division.
The River Healers pulled EMNRD records that show over 8,300 spills in New Mexico had been reported by the the fracking industry to EMNRD between 2011-2016 (map below). This is thousands more than reported by the Environmental Protection Agency. The records also showed how quickly reports of spills, fires, and explosions were processed by the EMNRD as ‘non-emergency’ and accepted industry reports that no groundwater had been contaminated.
Zoomed in view of the River Healers’ NM fracking spills map. Learn more
Daniel Tso, Member of the Navajo Nation and Elder of the Counselor Chapter, led us to fracking sites in Greater Chaco that had reported spills and fires. Daniel Tso is one of many Navajo Nation members working on the frontlines to protect Greater Chaco, their ancestral land, and their pastoral ways of life from the expanding fracking industry. Traveling in white trucks and cars we blended in with the oil and gas trucks that dot indigenous community roads and group around fracking pads on squares federally owned land. Years of watchdogging the fracking destruction on their sacred land was communicated through Tso’s eyes looking over the landscape for new fracking disruption and a calm voice,
… the hurt on the sacred landscapes; the beauty of the land is destroyed, this affects our people’s mental, spiritual, and emotional health.
At each site our eyes were scanning the fracking sites and terrain for drone flight patterns while the native elders were slowly scanning the ground for pottery shards and signs of their ancestors. Arroyos sweep around the fracking pads and display how quickly the area can flash flood from rain that gathers on the striated volcanic ash hills of the badlands.
Fracking Regulation in NM
The EMNRD Oil Conservation Division has only 12 inspectors that are in charge of overseeing over 50,000 wells scattered throughout New Mexico.2 Skepticism around EMNRD’s ability to regulate not only comes from a short staff being stretched across 121,598 square miles of New Mexico’s terrain, but thousands of active fracking sites continue to report spills, fires, and explosions every year.3 Even more problematic is that Ken McQueen, Cabinet Secretary of EMNRD formerly served as Vice President of WPX Energy.4 Ken McQueen managed WPX Energy’s assets in the Four Corners area of New Mexico, Colorado, and in addition, part of Wyoming. New Mexico Governor, Susana Martinez’s appointment of McQueen severely compromises the state’s ability to impartially oversee WPX Energy and regulate the fracking industry. Governor Martinez has been called to clean up the EMNRD, and rid the regulatory body of cabinet members more interested in protecting the assets of WPX than the health and rights of New Mexicans. Tso remarks,
The sacrifices of indigenous communities continue for a society that thinks gasoline comes from a gas station. That thinks oil is a commodity that is unending resource. This is unfortunate, and ultimately compromises our physical health. Yet this doesn’t matter to the industry. They want every last drop of crude oil even if it is cost prohibitive.
The River Healers maintain that Governor Martinez is complicit in the exploitation of human water rights as long as the EMNRD remains a compromised and unreliable regulatory body.
New Mexico governmental assimilation with the oil and gas industry is presented to the Greater Chaco indigenous communities in the form of 90,000-lb gross weight oilfield trucks. Western Refining started rolling out trucks with larger-than-life prints of state and county law enforcements officers and military personnel at the same time water protectors at Standing Rock were being arrested and assaulted by the Morton County Sheriff’s Department in North Dakota.5 The indigenous-led movement to stop the Dakota Access Pipeline from desecrating sacred land and threatening rights to clean water has drawn greater resistance to oil and gas projects around the country.
Indigenous solidarity is felt in Greater Chaco, but Western Refining’s blatant propaganda campaign demonstrates how oil and gas corporations continue to threaten and silence the communities they extract oil from by displaying the paid power of state and federal law enforcement. The River Healers view this as a direct form of intimidation that aims to further a corporate ideology and remind native communities of the violence they experienced at the hand of the United States Federal Government in the past. The Western Refining campaign is a direct form of corporate-sponsored terrorism and should be grounds to ban their ability to use images of law enforcement officers to further their interests. Furthermore, the state should discontinue paying for officers to patrol facking roads and pads and instead use state funds to make state regulatory bodies work for the communities most impacted by the oil and gas industries.
What we are finding
Drone surveillance of fracking sites in Greater Chaco show how quickly the fracking industry has exploited a state government tied to the interests of a booming and unchecked resource extraction industry. In Greater Chaco this element of time is more deeply understood through the lens of the indigenous community.
Ultimately, the health of the fauna and flora are devastated. The adaptation of the delicate ecosystem is forever destroyed. Their recovery and healing will take years and years.
The Anasazi Kivas in Chaco Canyon took over 300 years to construct, while drill rigs such as Cyclone 32 take less than 10 days to drill 6,500 ft wells in the canyon plateau. We hiked 12 miles of the sacred Chaco Wash, pulled water samples, and saw the red palm of the Supernova Petrograph clinging to the understory of the canyon wall, clearly taking notice of what is happening above.
We deeply thank members of the Navajo Nation for inviting us into their lives, and our hearts stand with them in solidarity. Protect Greater Chaco! Dooda Fracking!
River Healers Site Videos
Site 1
Nageezi, NM
County: San Juan
Kimbeto Wash/Chaco River
GPS: 36°14’22.38”, -107°43’51.38”
This particular site caught fire on June 11th, 2016 and was allowed to burn until July 14th. The fracking fire and contaminates spread to areas north and south of the fracking pad, burning Juniper trees within 200 feet of residential buildings. This fire is not the only documented case in the Greater Chaco Area where communities were disrupted and evacuated in the middle of the night. While community members remain concerned about their health, WPX reported that the incident was not an emergency and that no damage was caused to groundwater.
Site 2
Nageezi, NM
County: San Juan
Kimbeto Wash/Chaco River
GPS: 36°13’43.23″, -107°44’28.72″
Drone surveys of this particular site show Cyclone 32, a 1500 Horsepower 755 ton drill rig manufactured in Wyoming. The drill rig is transported through Greater Chaco communities on small dusty single lane dirt roads used by the community members and school buses. The drilling is heard and seen moving from pad to pad. The rig is establishing multiple drill heads on pockets of land tucked along the Kimbeto Wash, a tributary to the Chaco River and sacred source of water security for members of the Greater Chaco Area in Nageezi, New Mexico.
Site 3
Nageezi, NM
County: San Juan
Kimbeto Wash/Chaco River
GPS: 36°13’27.51″, -107°45’3.24″
No video available
Site 4
Counselor, NM
County: Rio Arriba
Canada Larga River
GPS: 36°13’18.19″, -107°28’56.24″
Drone surveys show Lybrook Elementary School only 1600ft from a WPX Energy fracking site. The crude oil tanks of the site can be seen from the classroom windows of the school. The elementary school was moved to this location in 2006 because it was right across the highway from a large and expanding natural gas plant and had to relocate elementary students to a safe location.
Although the WPX Energy site is established on federal land, this area of Counselor, New Mexico is referred to as ‘The Checkerboard’ because of the quadrants of federal land that break up tribal land. The 5 well heads are highlighted to show that these pockets of federal land are being fracked with a high concentration of fracking wells. By drilling multiple wells in one pad location fracking companies are able to quickly drain the plays of crude oil under the the Greater Chaco Area and avoid signing contracts with the native property owners that live and attend school in the area they are fracking.
Drone surveys show crude oil being fracked within 840 ft of an indigenous community in Sandoval County, NM (Greater Chaco). The fracking site is located in the path of the community water supply, which had to be routed around the wellhead and crude tanks. The underground water line remains only 110 ft from active fracking activity.
Particular communities in Greater Chaco are dependent upon pastoral industry and the health of their livestock. Horses owned by the indigenous community are seen grazing on open and unprotected fracking pads. Many of these fracking pads have recorded spills of either fracking fluid, wastewater, or crude oil and pose health risks to the livestock grazing on potentially contaminated grasses and wastewater.
A Western Refining (WPX) crude truck can be seen driving down the community road. These dirt roads were designed to support local community traffic and school buses but are now heavily used by the fracking industry. 90,000-lb gross weight oilfield trucks haul the volatile crude oil through pastoral lands, endangering livestock and community members. Fracking companies continue to level dirt roads to accommodate the weight of their crude trucks. The practice cuts roads deep into the landscape. Roads in Greater Chaco now resemble trenches and make travel dangerous, block scenic views of ancestral land, and hinder the ability to monitor livestock and fracking development.
Site 6
Nageezi, NM
County: San Juan
Kimbeto Wash/Chaco River
GPS: 36°15’20.46”, -107°41’43.14”
Drone surveys show 3 well heads, crude tanks, and compressors north of Hwy 550 in Nageezi, NM. The location is of importance because it shows how flaring is used to burn off methane caused by fracking and the transportation processes of crude oil. The River Healers droned this site when workers were not present and the flare tower was turned off for safety concerns, but the flame can usually be seen all the way from Hwy 550 tucked into the distinct hills of the Bisti Badlands. Such methane hotspots are of concern because methane causes severe health risks for individuals living near crude oil facilities. NASA has identified two large methane gas clouds in new Mexico. The methane gas is concentrated above fracking occurring in the San Juan Basin and Permian Basin and disproportionately affects the air quality of Greater Chaco, Four Corners Region, Farmington, and South East region of New Mexico.
Two unlined wastewater pits can be seen on the edge of the fracking pad near the well heads and compressors. Erosion caused by water drainage can be seen leading from the well heads and compressor areas directly to the wastewater pits. Drainages can also be seen coming directly out of the waste water pits and going into the Upper Kimbeto Wash, a tributary of the Chaco River. It is illegal for fracking companies to keep fracking wastewater in unlined pits in the state of New Mexico. The River Healers reported this possible water violation to the EMNRD Oil Conservation Division (a state regulatory body for the fracking industry). EMNRD replied that WPX Energy maintains that the wastewater is caused by stormwater runoff and contains no fracking contaminates. This is the first time we have heard of the fracking industry creating stormwater runoff pits and find the practice to be unusual. Further skepticism that these runoff pits are not contaminated comes from research about the site. In June of 2016, WPX Energy reported a spill of 600 gallons of crude oil at this site because of a fire. WPX maintains that no groundwater was impacted and marked the incident as not an emergency.
The River Healers organize anonymous watchdog operations and tactical campaigns to protect water. The artist collective is engaged in direct action through analyzing, exposing, and bringing down systematic abuses of water rights. The River Healers work to accelerate theories of water democracy, decentralize aesthetics of environmentalism, and expose corporate sponsored water terrorism. ‘Water is a commons – No one has the right to destroy’
https://www.fractracker.org/a5ej20sjfwe/wp-content/uploads/2017/09/River-healers-video-feature.jpg400900Guest Authorhttps://www.fractracker.org/a5ej20sjfwe/wp-content/uploads/2025/09/2025-Wordmark-Logo.pngGuest Author2017-09-21 09:30:482021-04-15 15:02:33Protect Greater Chaco: Drone surveillance of regional fracking sites in NM
By Kirk Jalbert, Manager of Community-Based Research and Engagement and Matt Kelso, Manager of Data and Technology
FracTracker recently updated its Pennsylvania Shale Viewer to reflect the latest data on unconventional oil and gas permits and active wells in the state. Within this data, we noticed an increase in permitting over the past year for Allegheny County, PA. We have worked on a number of recent initiatives aimed at expanding conversations about unconventional oil and gas drilling by mapping mineral rights leasing and zoning ordinances in Allegheny County. In this article, we bring these various analyses together.
The analysis below can assist residents and public officials in preparing for what appears to be a pending wave of new development.
Untapped Reserves
Over the past decade, unconventional oil and gas development has predominantly occurred in areas where shale formations are densest and most productive. For instance, the map below illustrates wells and permits in Southwestern Pennsylvania that track along the Marcellus Shale. An outlier on the map is Allegheny County when compared to its neighbors such as Washington and Greene Counties just to the south—two of the most drilled in the Commonwealth.
Unconventional wells and permits in Southwest Pennsylvania
A few factors may explain these spatial anomalies. First, oil and gas companies are generally reluctant to operate in heavily populated areas. This is partly due to the complications of acquiring leases and easements in tightly packed communities.
Infrastructure is second consideration. In the absence of compressor stations and midstream pipelines, companies can’t get their product to market.
A third factor is the stronger political opposition often found in urban centers. For example, Pittsburgh’s 2010 fracking ban pushed back against drillers and had a chilling effect in bordering municipalities. Many of Allegheny County’s municipalities have, thus, had the luxury of putting oil and gas-related land use decisions on the back burner. Nevertheless, operators have maintained interest in extracting untapped shale reserves that lie beneath their borders.
Recent Permitting & Drilling Trends
Within Allegheny County, PA, there are now 24 well pads containing a combined 248 permitted wells, of which 109 currently have an active status. On average, these numbers show a 20% increase in well permits annually (40-50 per year) since 2014. This figure compares to less than 10 per year prior to 2012. Furthermore, while only partway through 2017, we’ve already reached this 20% increase in new permits (41 since 8/24), with the overwhelming number of these being issues for Findlay and Forward Townships. A table and graph of permitting activity since 2008 is seen below.
Table and graph of permitted wells in Allegheny County
Interestingly, the number of active wells over the past few years does not track with increasing number of permits. In fact, active wells peaked in 2014-2015 and have steadily declined since, as is seen in the table and graph below. We credit these opposing trends to operators placing their wells into inactive status during a period of lower gas prices. Meanwhile, operators are increasing their applications for new wells in preparation for a predicted rebound as well as new pipelines and processing facilities coming online for delivering to new markets.
Table and graph of active wells in Allegheny County
Predicting Development: Mineral Rights Leasing
The locations of permits and active wells are not always good indicators of long-term future development. A better picture can be painted with data on properties leased for eventual drilling. In 2016, FracTracker built the Allegheny County Lease Mapping Project, which revealed the extent of oil and gas leasing agreements across the region. From that work came some interesting findings.
There are 467,200 acres in Allegheny County. We found 63,014 acres (18% of the county) are under some kind of oil and gas agreement – this includes mineral rights leases, as well as other agreement such as pipeline rights of ways. It is important to note that as many as 15% of the records we obtained in executing the project could not be mapped due to missing metadata (many block/lot numbers were no longer provided with online records after 2010), so these are conservative estimates.
The list below shows the top five municipalities found to have the most leases. Of note is how West Deer, North Fayette, and Elizabeth townships all have a significant number of leases, but do not yet register in permitting activity.
Most Leased Municipalities in Allegheny County, PA
West Deer Township (5,325 leases)
North Fayette Township (5,070 leases)
Elizabeth Township (4,070 leases)
Fawn Township (3,872 leases)
Forward Township (3,801)
We also discovered that more than 70% of leased properties were zoned residential or agricultural, despite the fact that unconventional oil and gas development is a highly disruptive and industrialized activity. The list below shows a breakdown of zoning designations.
Leased Properties Zoning
Residential (37%)
Agricultural (34%)
Commercial (23%)
Industrial (3%)
Other (3%)
Status of Protective Zoning
In 2013, the Pennsylvania Supreme Court upended state laws governing local oil and gas zoning rights with its landmark Robinson Township v. Commonwealth of Pennsylvania decision. The court struck down parts of Act 13 that imposed statewide zoning standards for oil and gas development. Zoning ordinances with stronger ordinances are now being adopted by some townships. However, many others have zoning codes that reflect pre-Robinson language, which allows mineral extraction everywhere, regardless of whether it is a compatible land use.
Drawing the connections between drilling trends, leasing activity, and protective zoning is, therefore, significant. Over the past six months, FracTracker has worked with Food & Water Watch to put our lease mapping data and state drilling data in context with assessments of Allegheny County’s municipal oil and gas zoning ordinances. The map below illustrates these overlaps.
Map of Allegheny County Drilling, Leasing, and Zoning
Allegheny County contains 130 municipalities. Food & Water Watch was able to obtain and review zoning codes for 104 of these 130. At least 56 municipalities have no zoning ordinances specific to oil and gas development. Of greatest concern, when placed in context with leasing and permitting data, FracTracker found that leases already existed in 43 of these 56 municipalities without oil and gas ordinances, although 8 of these 43 were found to have other less restrictive language regulating specific oil and gas activities, such as seismic testing. Fawn Township, one of the most permitted and most leased municipalities in the county, was found to have no oil and gas zoning ordinance.
Conclusions
It’s important to recognize that there is a significant difference between conventional oil and gas development and today’s heavily industrialized unconventional extraction industry. In many of Allegheny County’s municipalities there seems to be a presumption that there is no need to prepare zoning codes for drilling, despite data that suggest increased oil and gas development may be just around the corner.
With the deeper understanding of Allegheny County’s permitting trends, leasing activities, and the state of protective zoning presented in this article, municipalities would be wise to assess where they stand. Reviewing and updating their respective zoning codes to determine if they sufficiently address concerns related to unconventional drilling could be the most effective way to protect the interests of their residents.
https://www.fractracker.org/a5ej20sjfwe/wp-content/uploads/2017/08/AC_Zoning_header.jpg400900FracTracker Alliancehttps://www.fractracker.org/a5ej20sjfwe/wp-content/uploads/2025/09/2025-Wordmark-Logo.pngFracTracker Alliance2017-08-28 15:34:482021-04-15 15:02:35Allegheny County, PA – Drilling, Leasing, and Zoning Trends
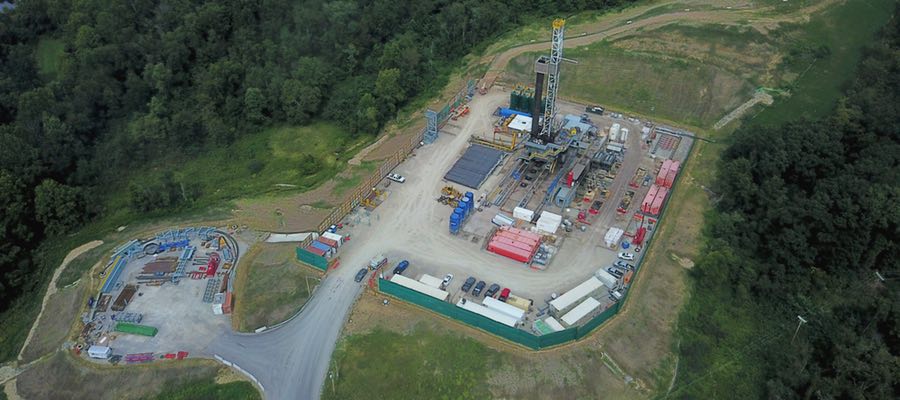
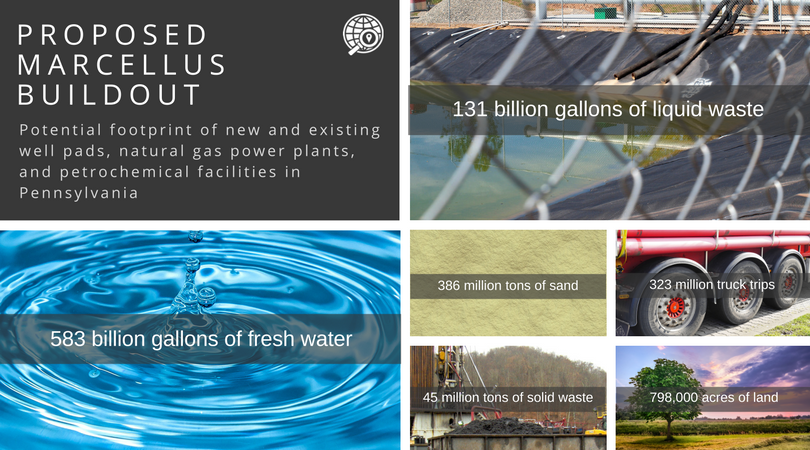
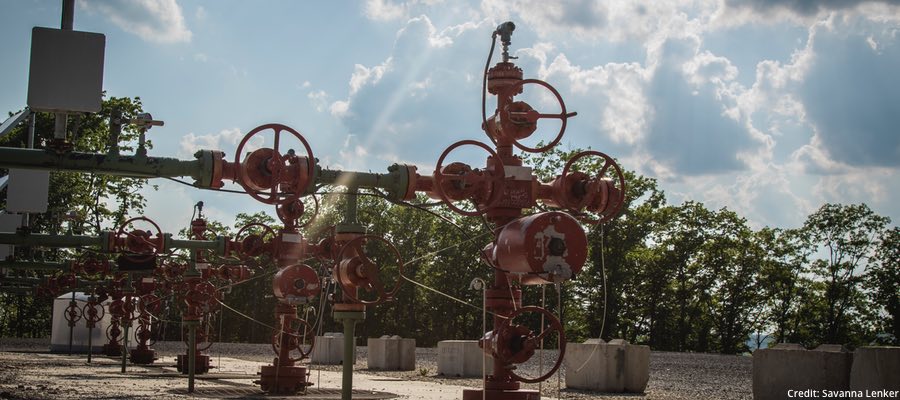
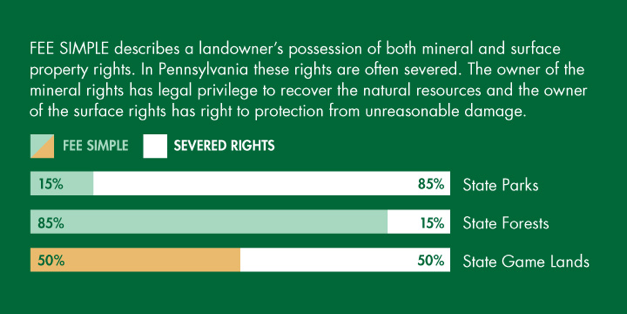
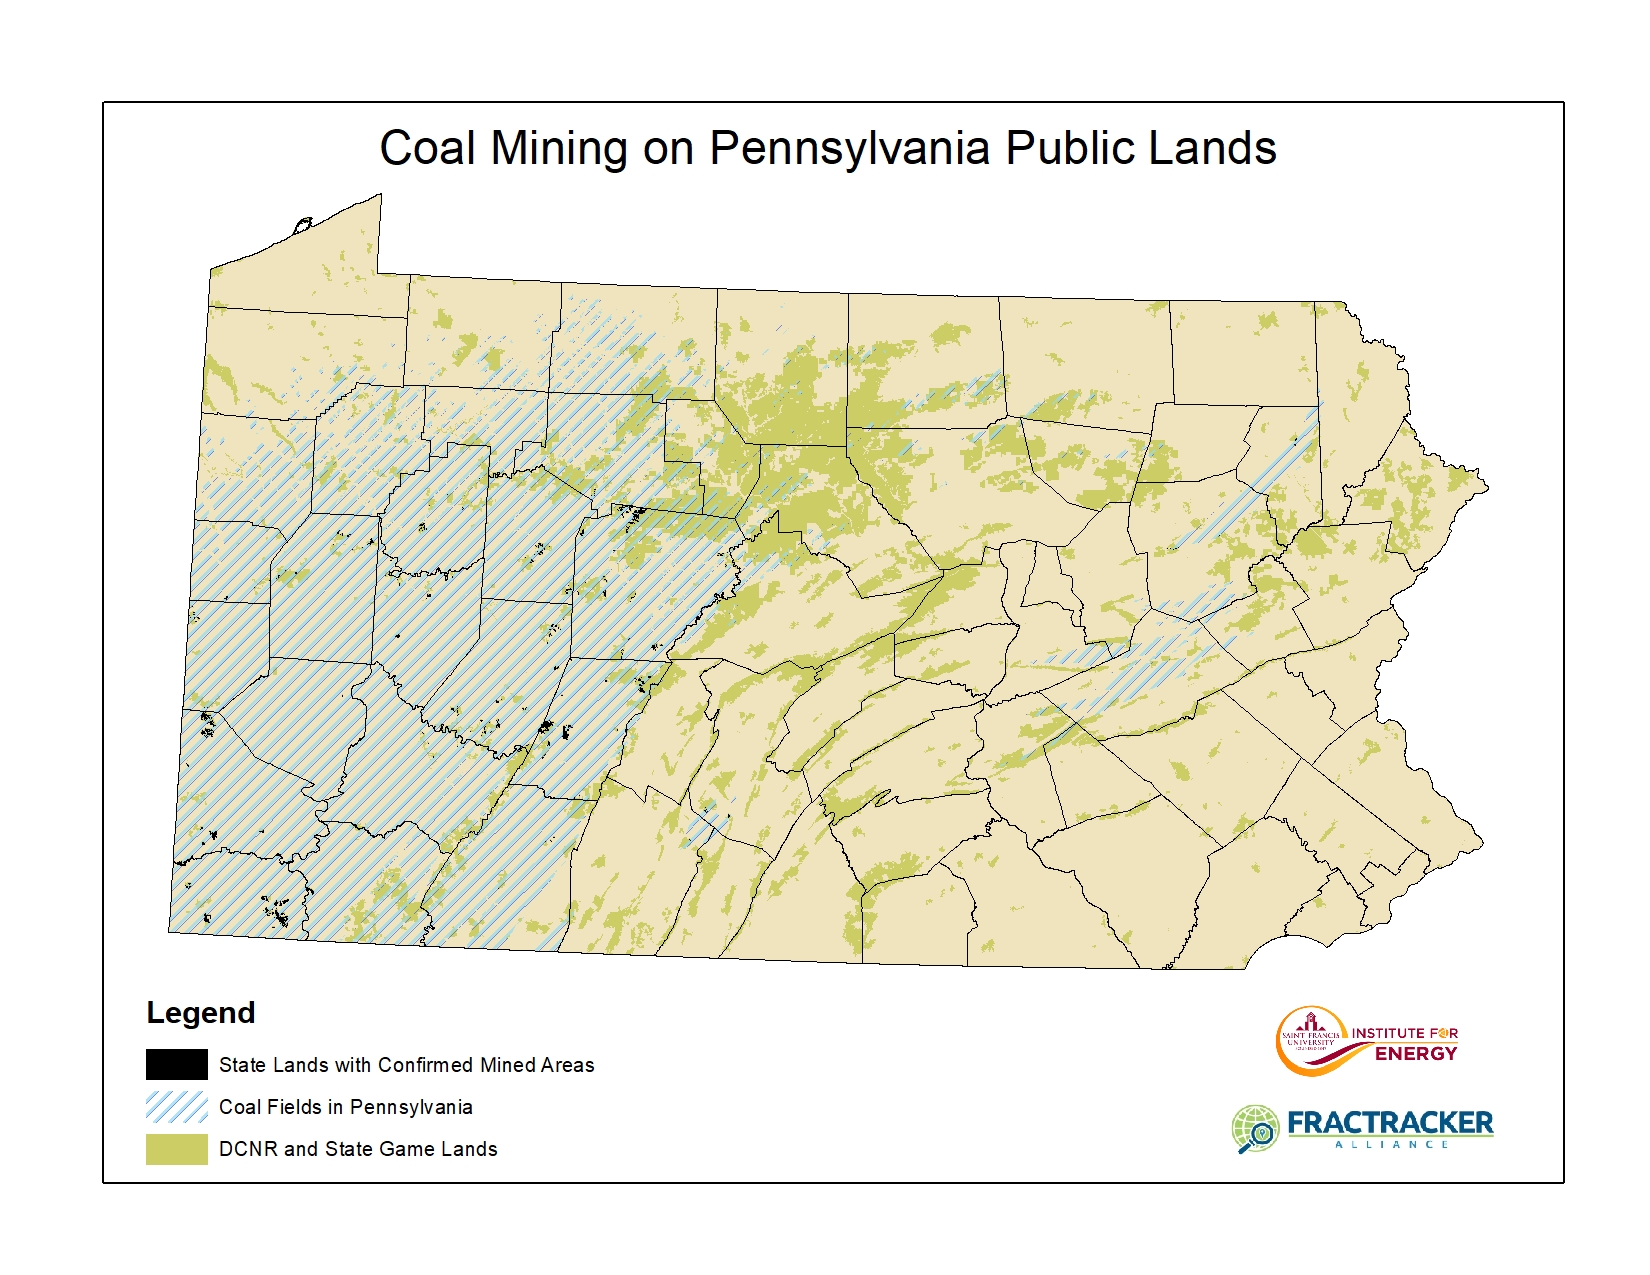
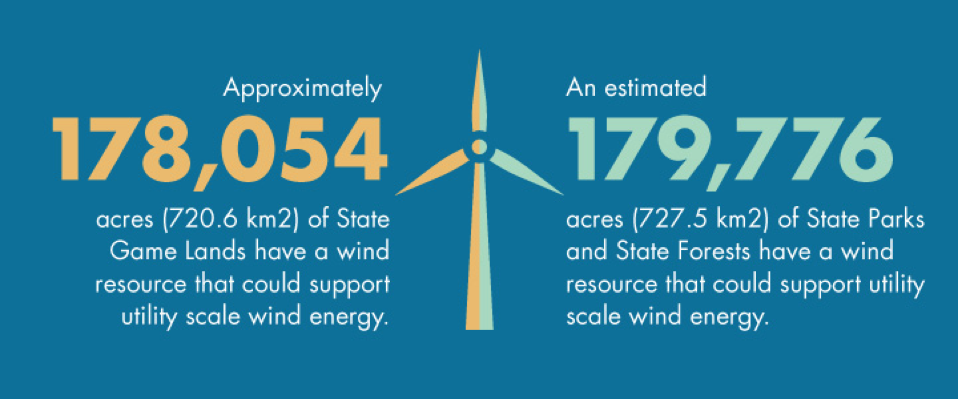


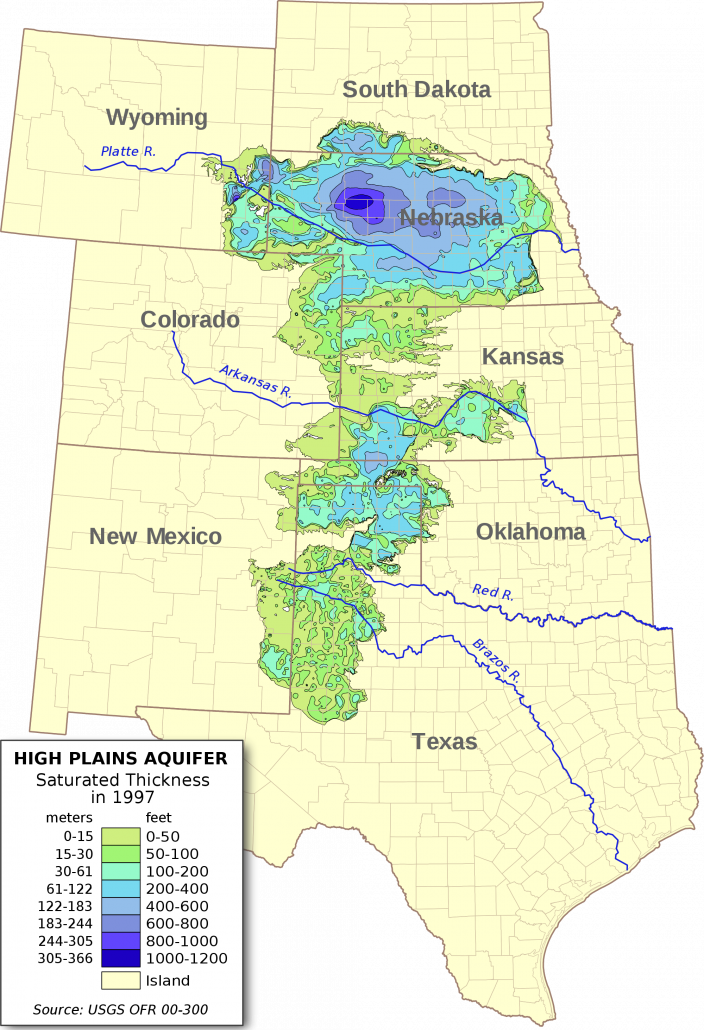
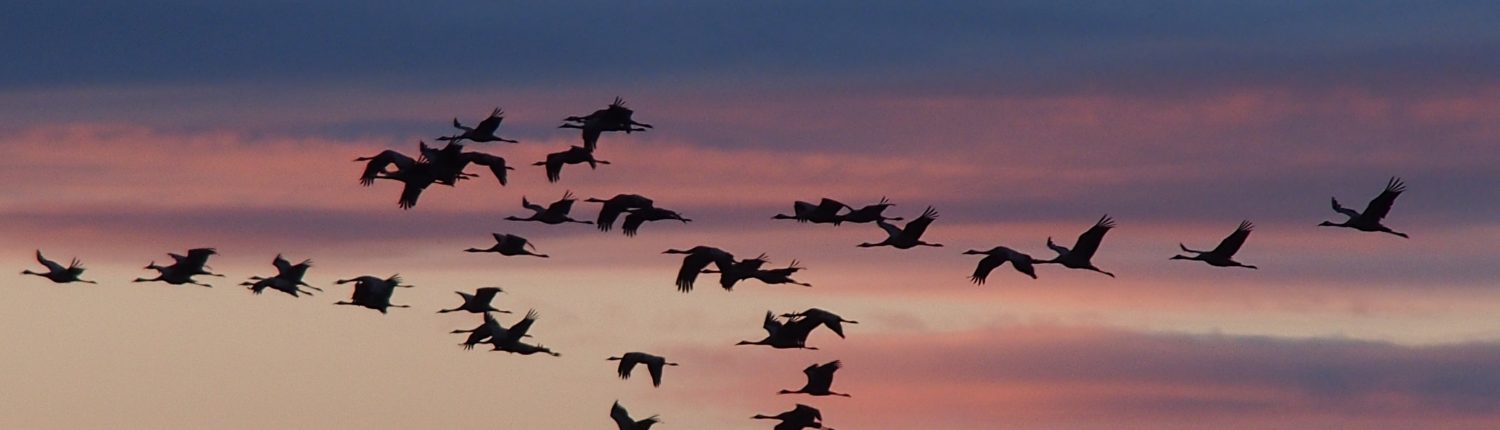
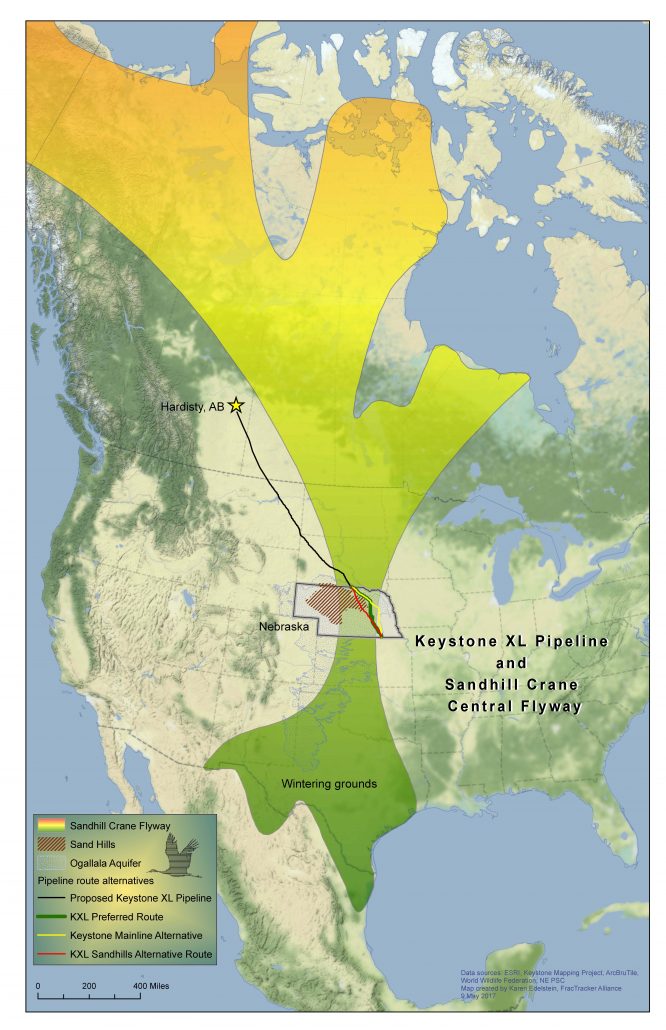
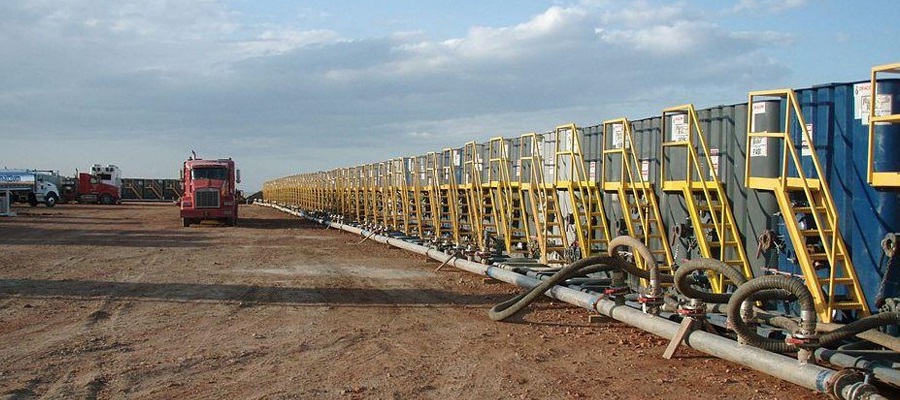
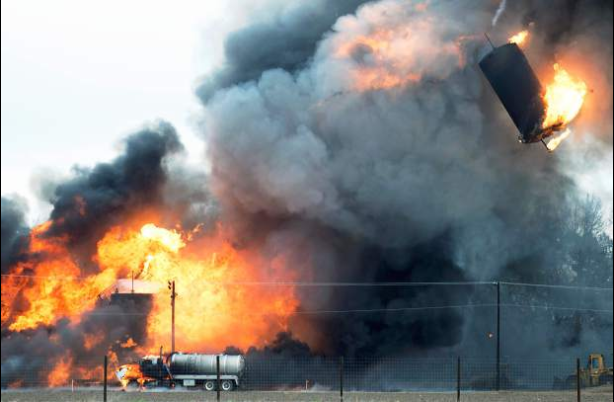
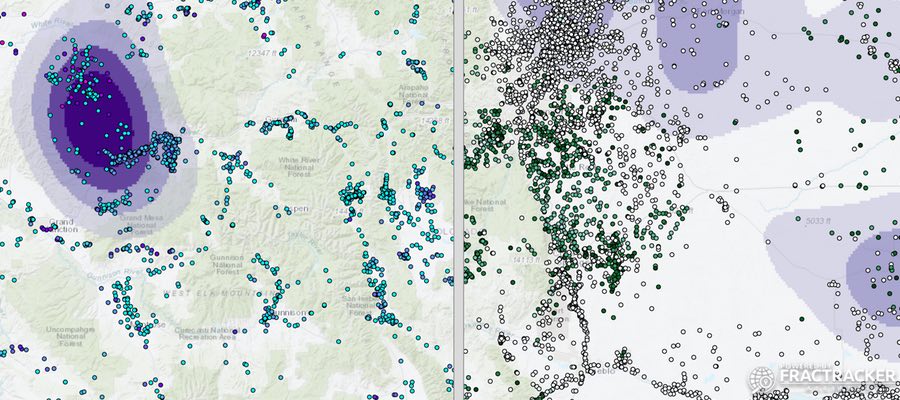
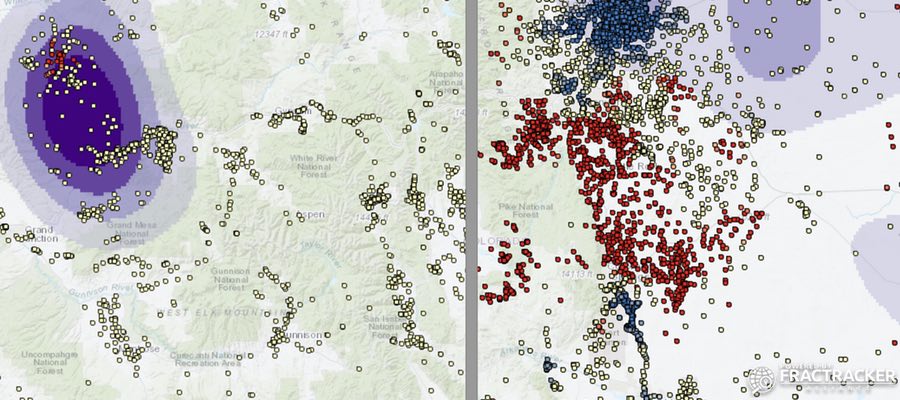


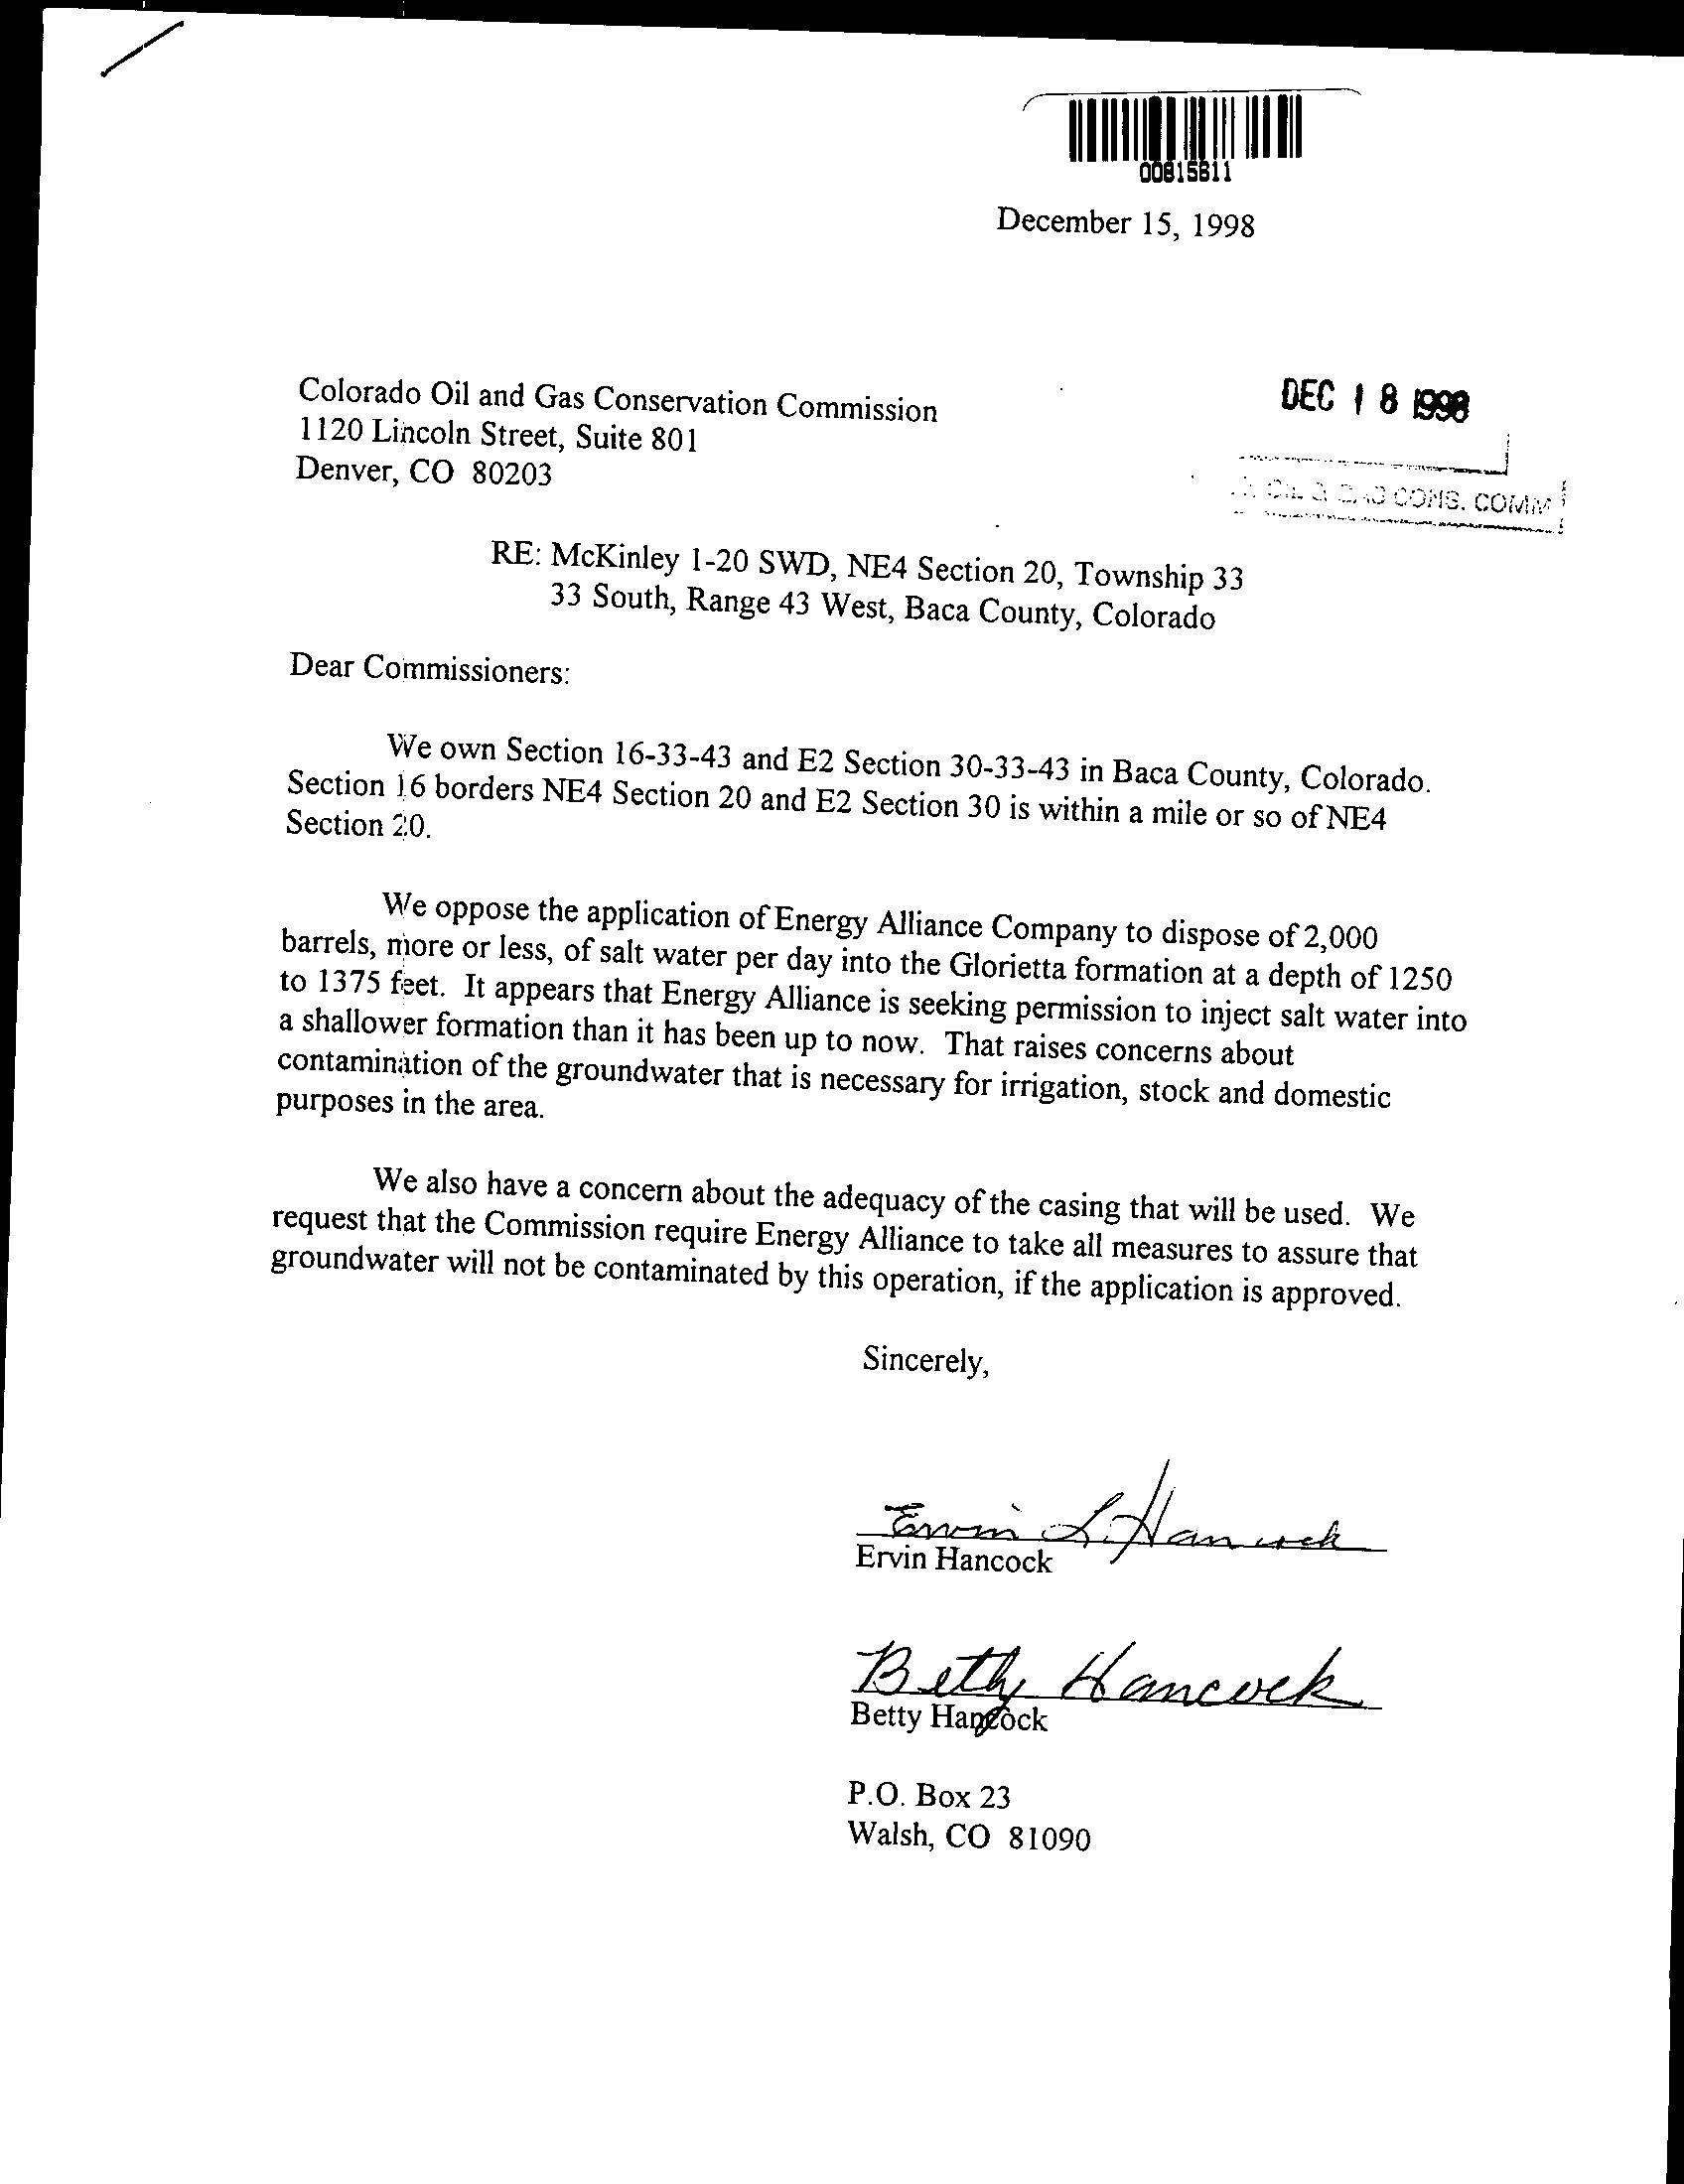
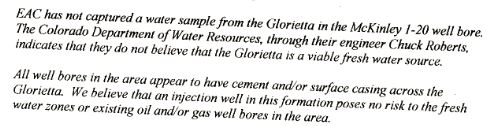
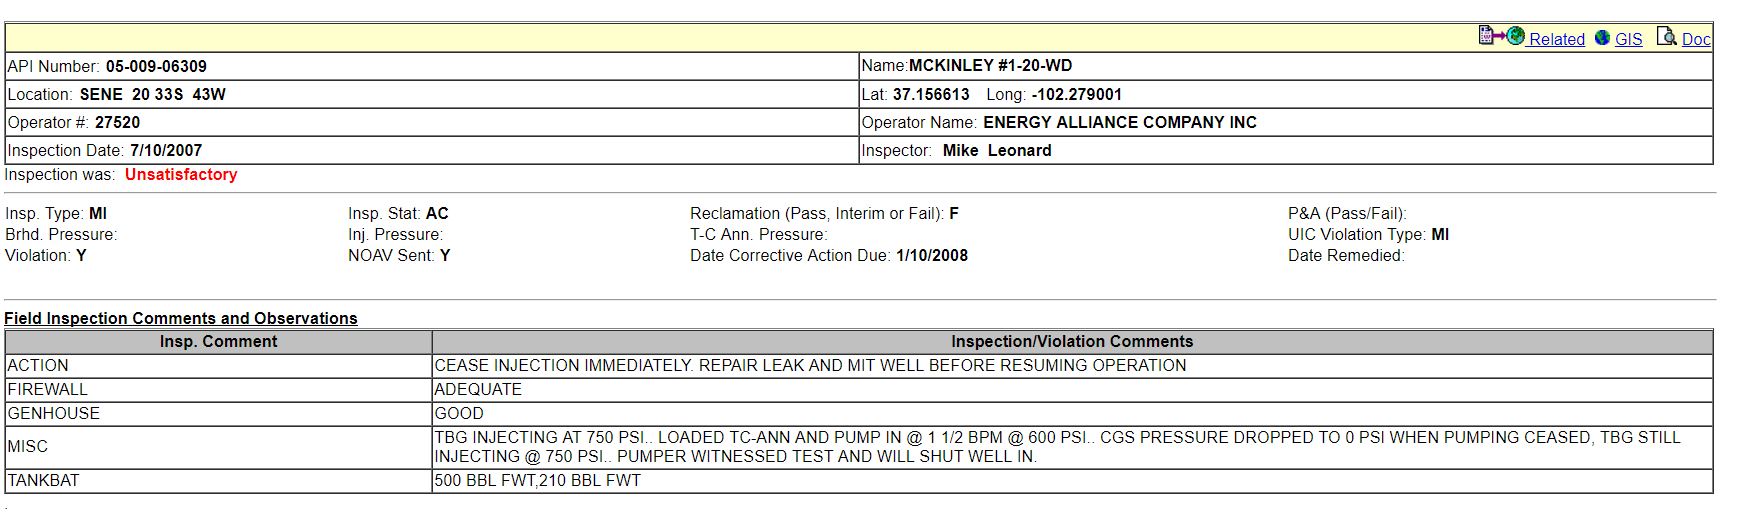
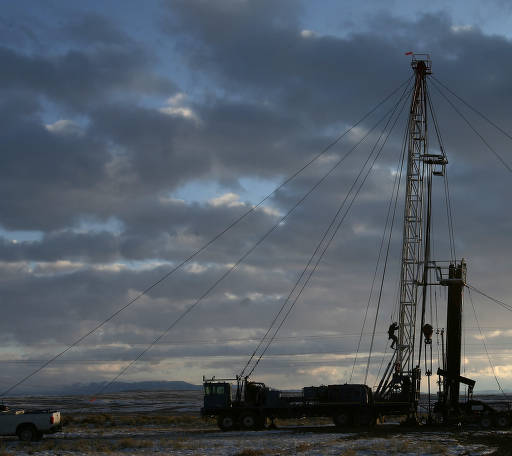
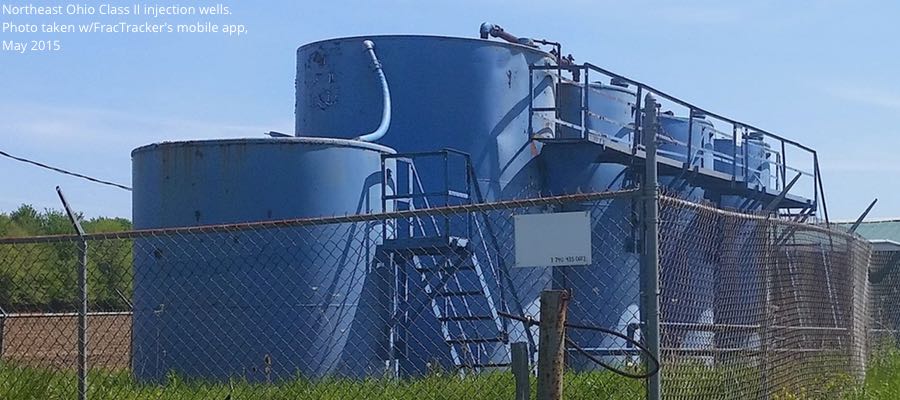
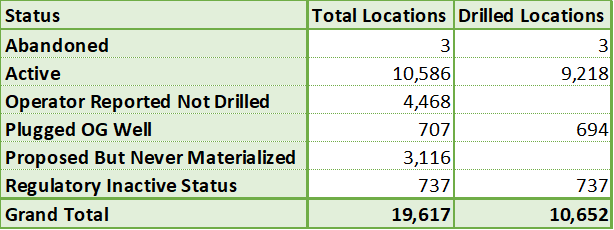
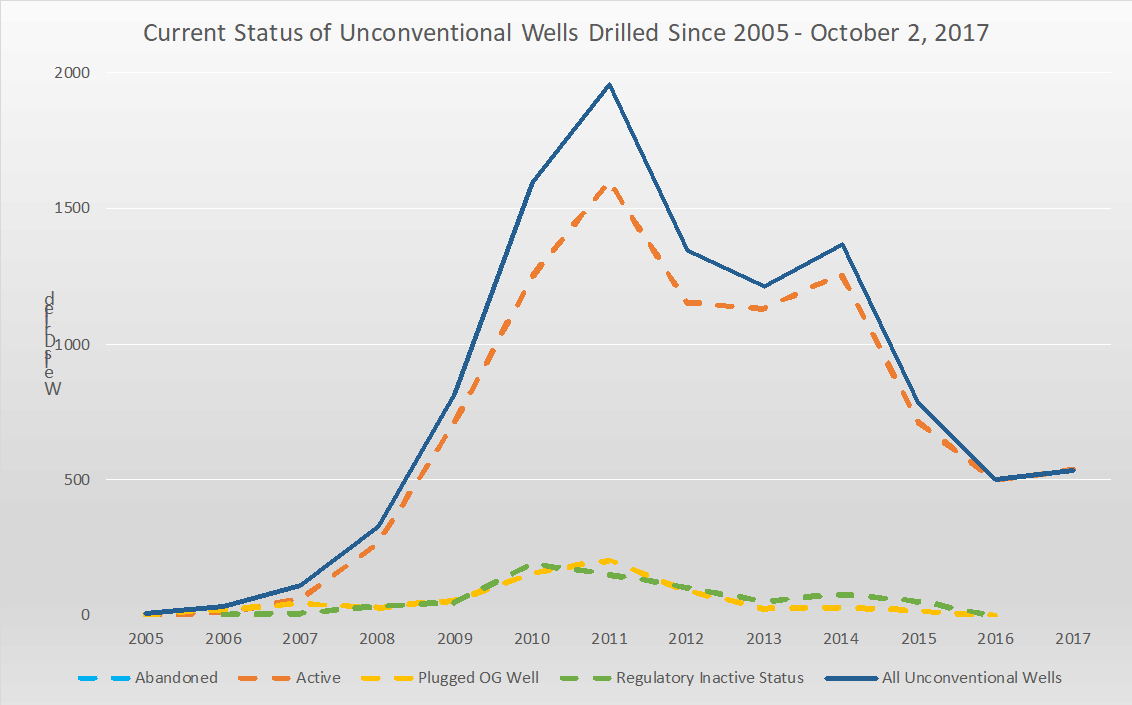

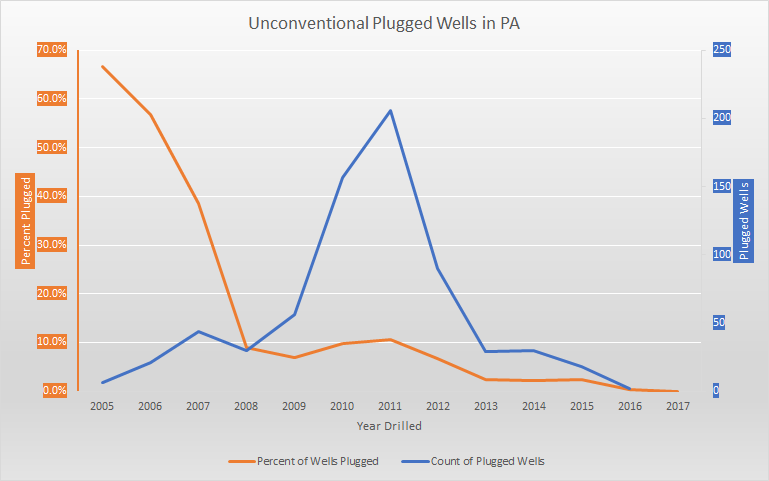
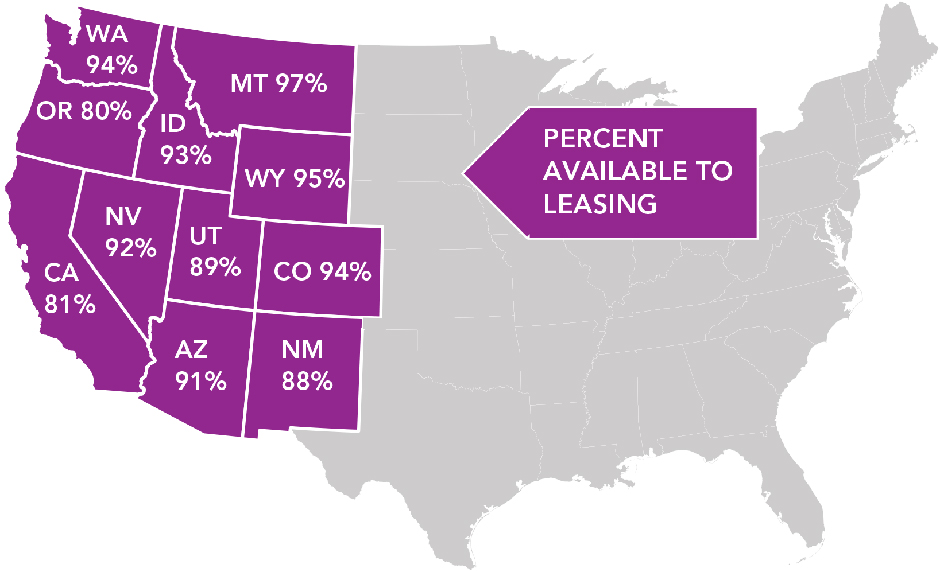
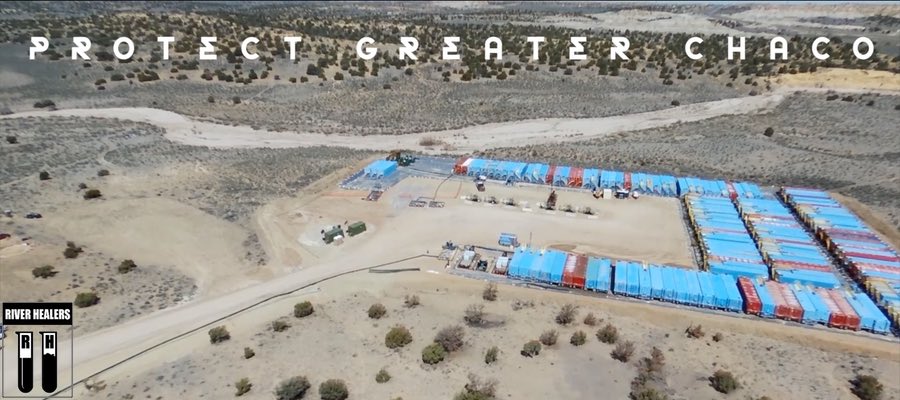
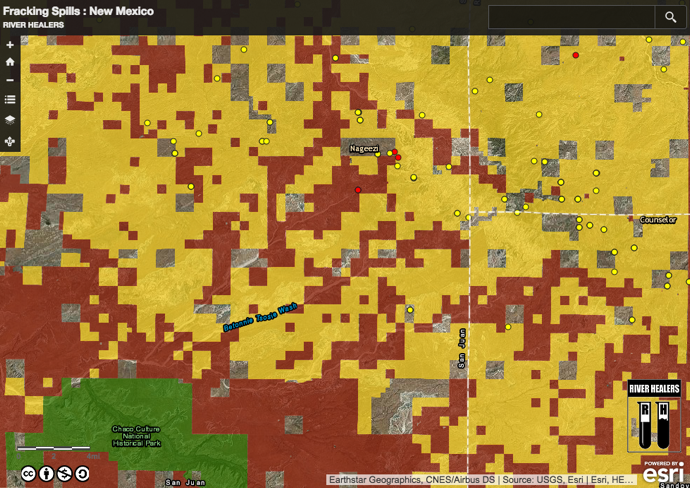
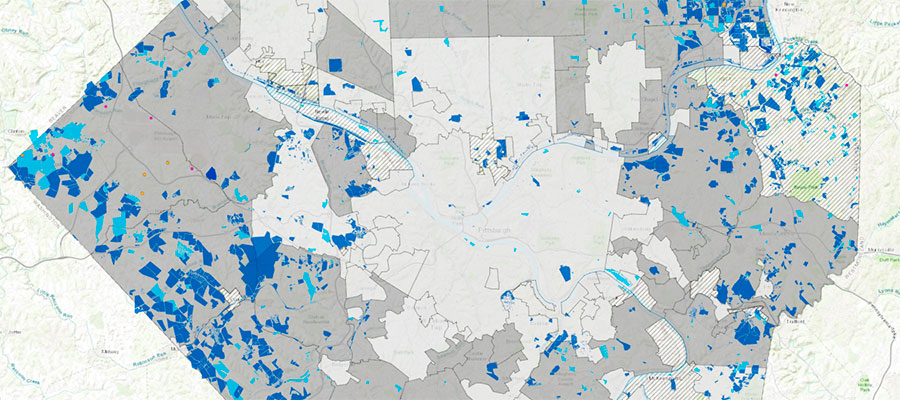
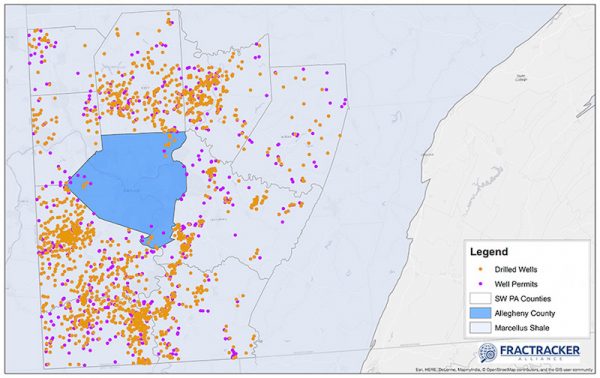
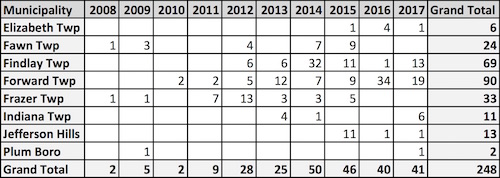
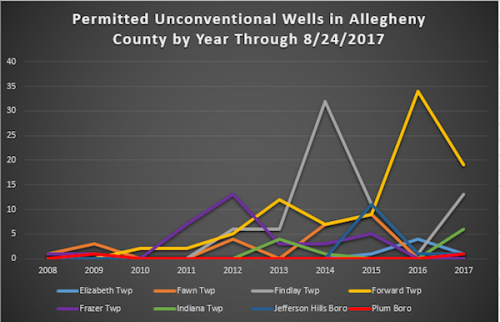
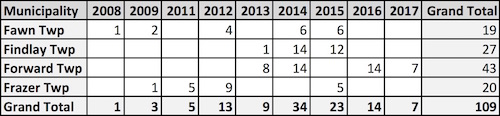
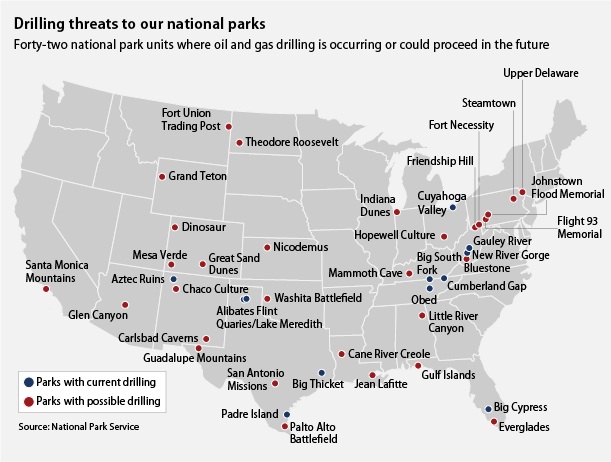