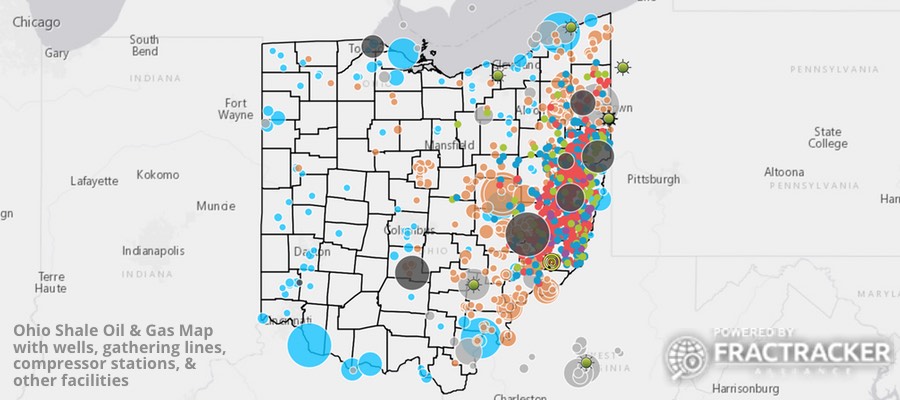
Over the last few months we’ve been busy working on some updates to our Ohio Oil & Gas Map. Check out what we’ve added recently and explore the map below!
New: Power Plants & ATEX Pipeline
We now have the locations of eight of the credible natural gas power plants proposed in Ohio, along with the jobs they cite during construction and operations. We also now have a complete inventory of 118 existing power plants, including 25 natural gas facilities. Together, these plants would produce 7,660 megawatts, around 957 per facility.
Six of these plants are either in the heart of Ohio’s Utica Shale or within several miles of the 1,200+ mile Appalachia-to-Texas (ATEX) pipeline. ATEX was installed to transport 190,000 barrels per day (BPD) of natural gas liquids (NGLs) from the Marcellus and Utica region to the Texas and Louisiana Gulf Goast refinery corridor. The 360 mile segment of this pipeline that runs from Pennsylvania to south central Jackson County, Indiana is also now shown on the Ohio Oil & Gas Map.
Late Permitting Increases
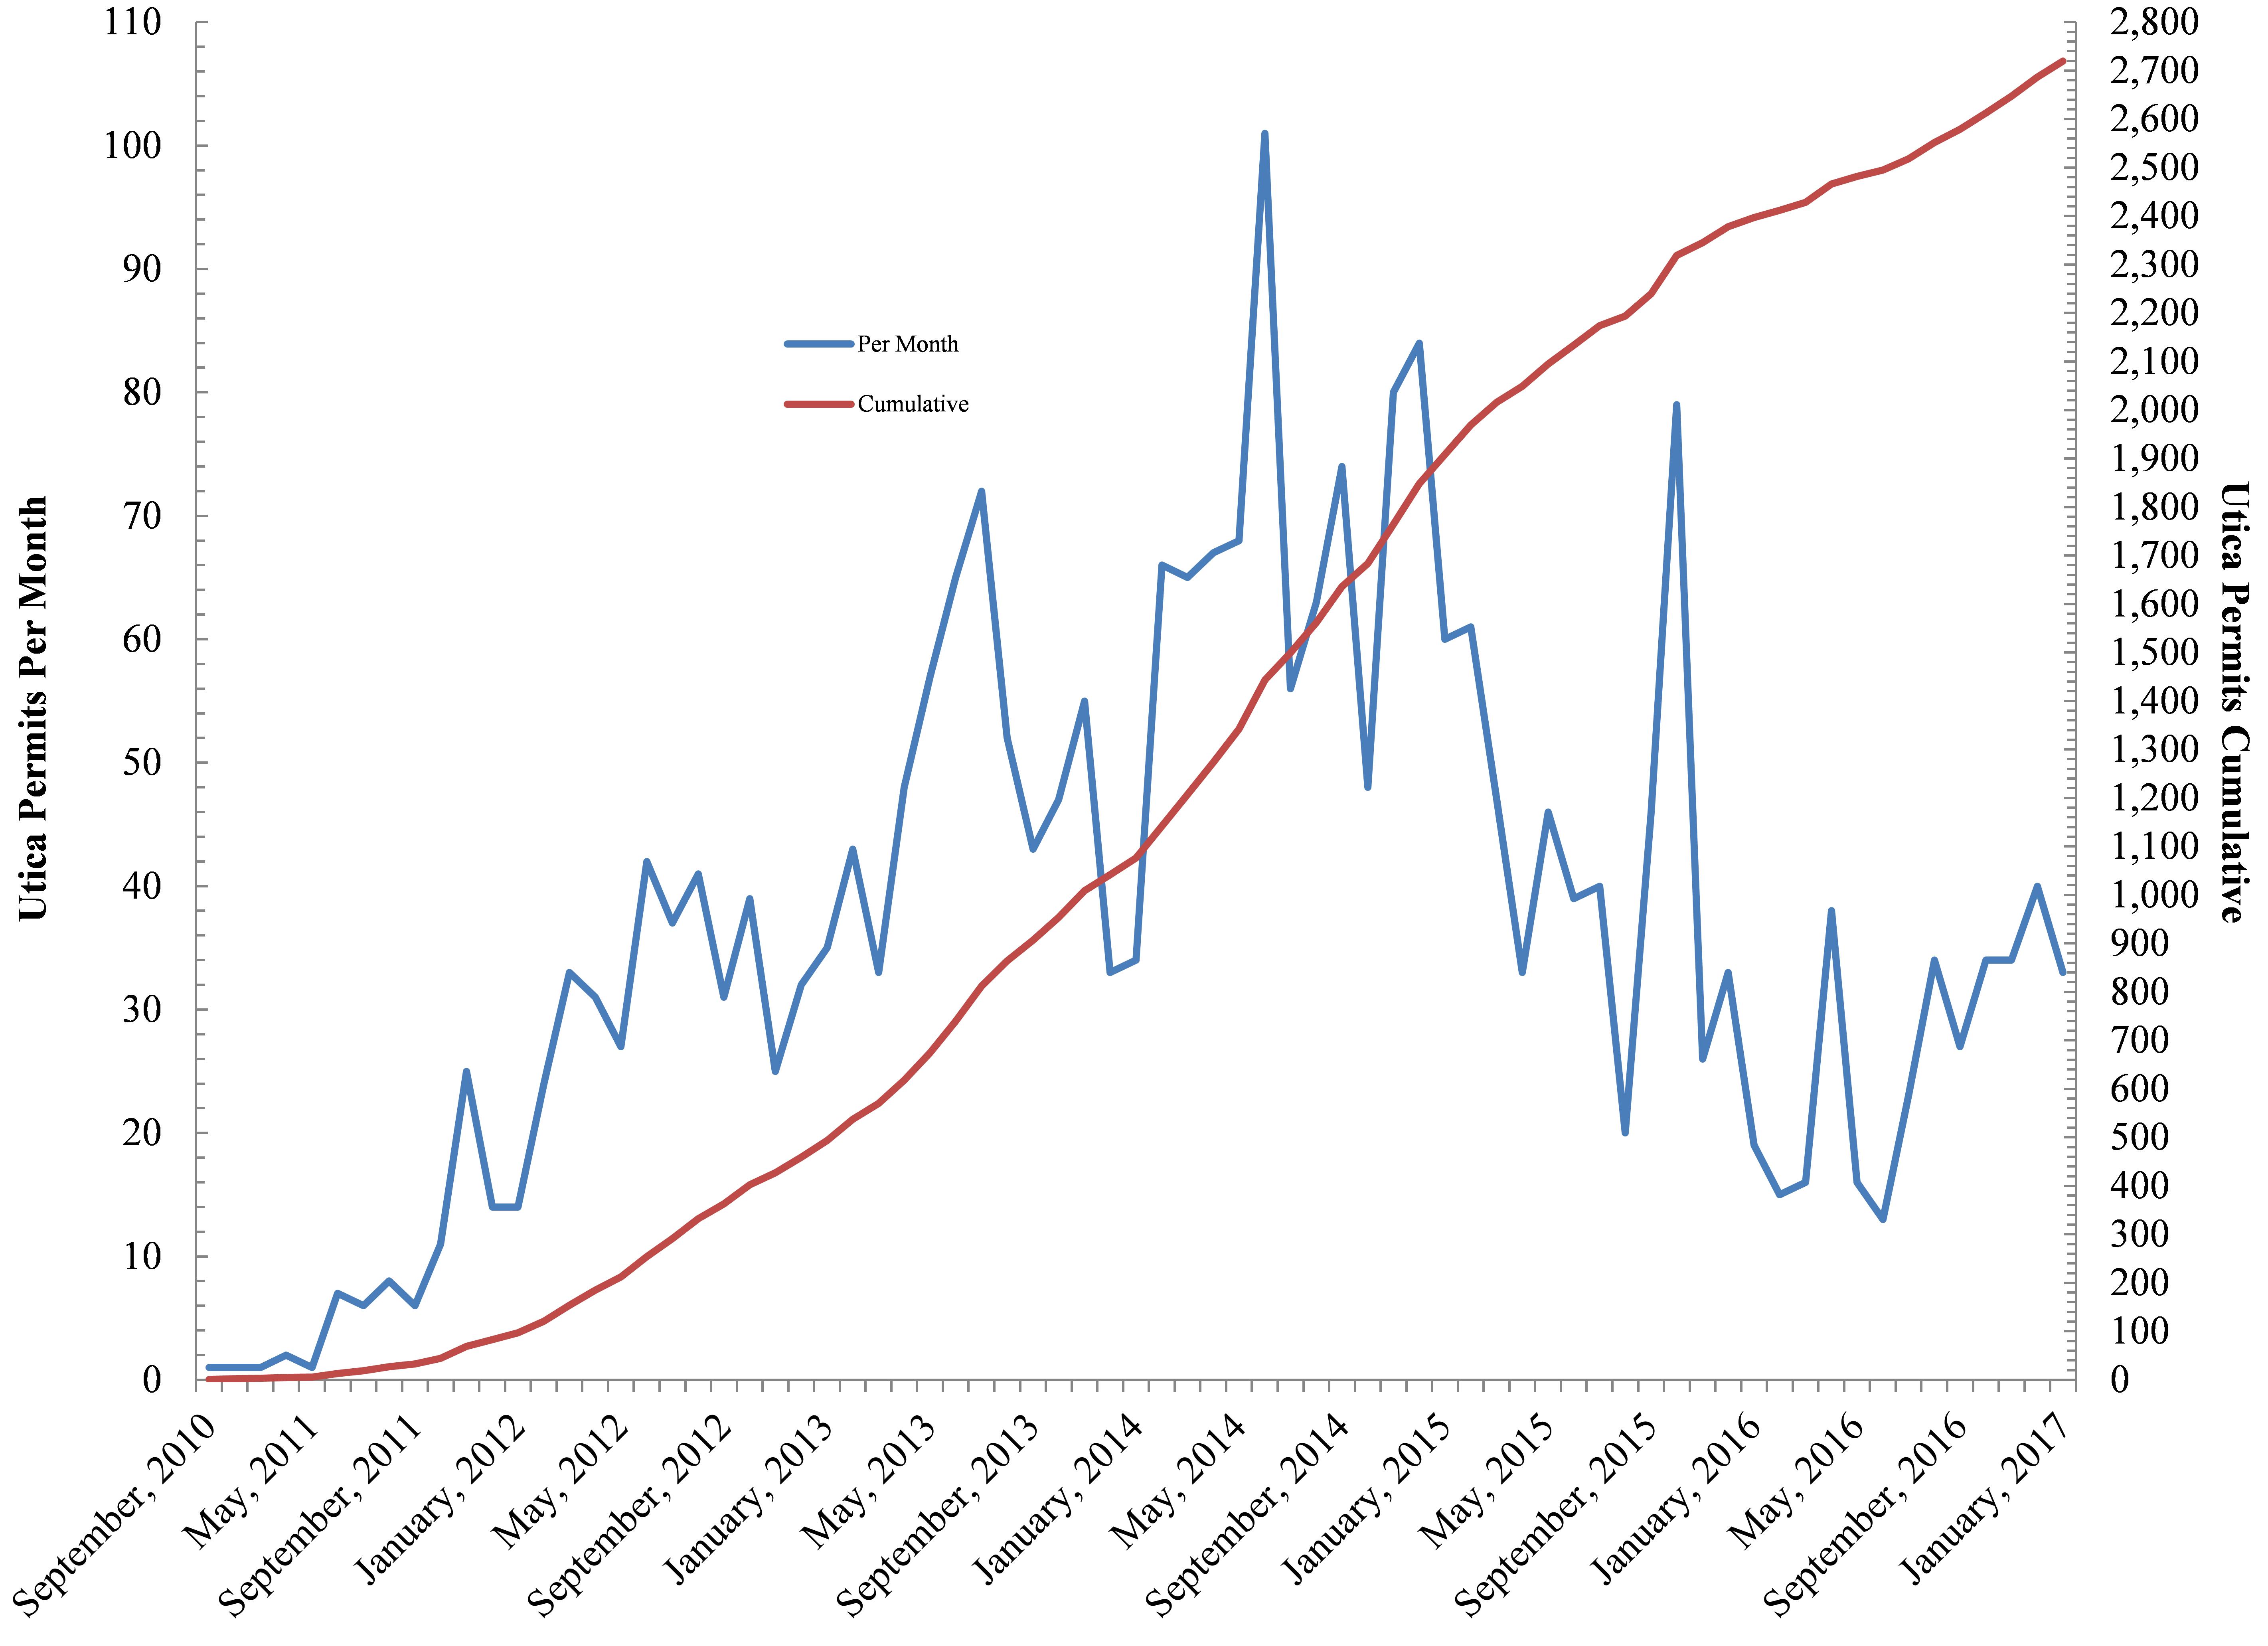
Figure 1. Cumulative and monthly hydraulic fracturing well permits in Ohio’s Utica Shale
While many shale plays across the United States are experiencing a period of contraction (with low gas prices often cited as the primary reason), drilling activity in Ohio’s Utica Shale has been experiencing a slow and steady expansion. The region has seen more than 2,700 permitted wells as of the end of January 2017. Incidentally, roughly 59% of these wells are producing either oil or gas as of Q3-2016. For more information on that subject, explore our production map.
The permitting trajectory hit a low of 13-16 permits per month between February and January of 2016. Since the presidential election in November, however, permitting rates have more than doubled (Figure 1).
Ohio Oil & Gas Map
Ohio sits on the western edge of both the Utica and Marcellus Shale formations, but conditions are such that the Marcellus Shale is all but being ignored in Ohio. Explore our updated map of OH drilling activity and related facilities below:
The map above is made up of various datasets, from the location of permits to compressor stations. These “map layers” make up the legend. Below we describe each layer on the map, as well as the data source and date range.
Horizontal Marcellus Permits, Laterals There have been 40+ permits issued for horizontal wells in Ohio’s Marcellus Shale.
Horizontal Utica Permits An aggregate of ODNR’s monthly cumulative Utica and Marcellus permits as well as a more detailed weekly Risk Based Data Management System (RBDMS) Microsoft Access inventory. At the present time Ohio is home to 2,160+ permitted Utica Wells with the wells broken out by status. Additionally this layer contains depth, water usage, sand usage, HCl, and Gelling Agent percentage for 249 wells based on data provided to FracFocus. Finally, we have incorporated production in various units from individual industry press releases and the ODNR annual report.
High Volume Hydraulic Fracturing Gathering Lines All gathering lines servicing Ohio’s inventory of High Volume Hydraulic Fracturing (HVHF) wells.
Source: Herbert Hoover Foundation grant Date Range: December 2009 – 2015
High Volume Hydraulic Fracturing Well Pads The well-pads of all Ohio’s drilled or producing High Volume Hydraulic Fracturing (HVHF) wells.
Source: Herbert Hoover Foundation grant Date Range: December 2009 – 2015
High Volume Hydraulic Fracturing Well Pad’s Limits Of Disturbance (LOD) Limits Of Disturbance (LOD) for all Ohio’s drilled or producing High Volume Hydraulic Fracturing (HVHF) well-pads.
Source: Herbert Hoover Foundation grant Date Range: December 2009 – 2015
Compressor Stations and Cracking Facilities Boundaries of several confirmed High Volume Hydraulic Fracturing (HVHF) servicing cracking and compressor station facilities.
Source: Herbert Hoover Foundation grant Date Range: December 2009 – 2015
Ohio Active Class II Injection Wells This data speaks to the state’s “Active” Class II Injection wells able to accept hydraulic fracturing waste. There are 240+ Active Wells with 51 having yet to receive waste from hydraulic fracturing. For more on Ohio’s Class II Inventory in depth refer to our recent Ohio Fracking Waste Transport & Disposal Network article.
Earthquakes of >2.0 Magnitude This data speaks to the state’s 258 earthquakes with current updates from the Ohio Seismic Network and historical quakes – all >2.0 magnitude. These data come from the department’s inventory. Additionally, we present Ohio earthquakes with <2.0 magnitude courtesy of Environment Canada’s Search the Earthquake Database platform.
https://www.fractracker.org/a5ej20sjfwe/wp-content/uploads/2017/02/Ohio-Shaleviewer-Feature-Feb2017.jpg400900Ted Auch, PhDhttps://www.fractracker.org/a5ej20sjfwe/wp-content/uploads/2025/09/2025-Wordmark-Logo.pngTed Auch, PhD2017-02-13 16:30:102021-04-15 15:03:44Power Plants & Other Facilities Now on Ohio Oil & Gas Map
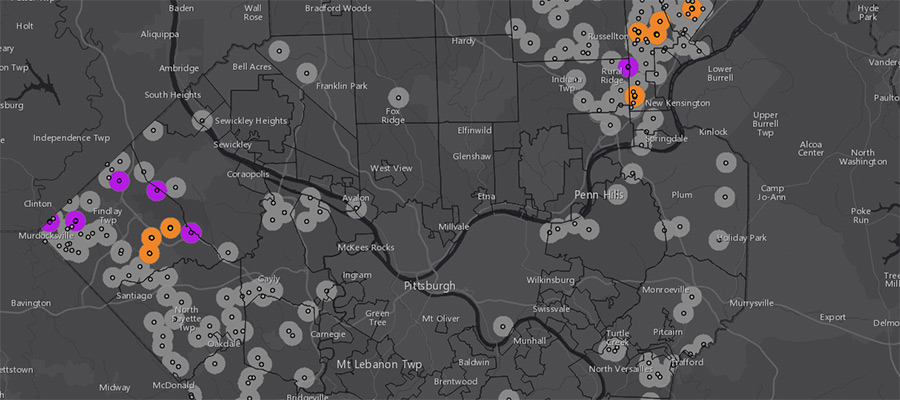
With tens of thousands of wells scattered across the countryside, Southwestern Pennsylvania is no stranger to oil and gas development. New, industrial scale extraction methods are already well entrenched, with over 3,600 of these unconventional wells drilled so far in that part of the state, mostly from the well known Marcellus Shale formation.
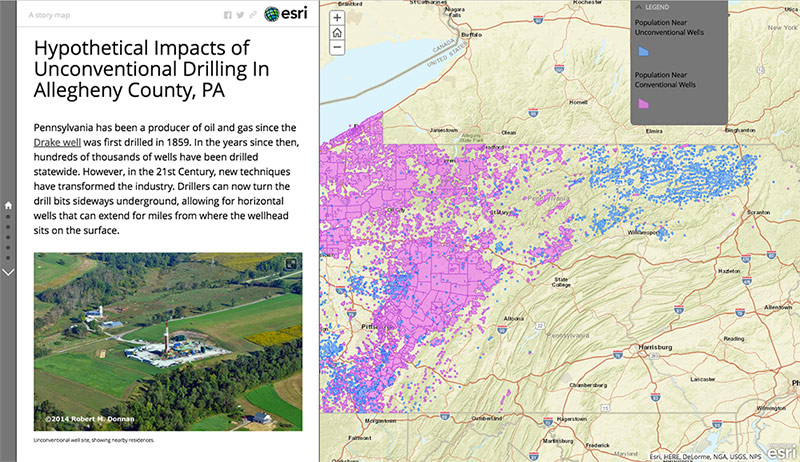
Southwestern Pennsylvania is also home to the Pittsburgh Metropolitan Area, a seven county region with over 2.3 million people. Just over half of this population is in Allegheny County, where unconventional drilling has become more common in recent years, along with all of its associated impacts. In the following interactive story map, the FracTracker Alliance takes a look at current impacts in more urban and suburban environments, plus projects what future impacts could look like, based on leasing activity.
https://www.fractracker.org/a5ej20sjfwe/wp-content/uploads/2016/12/AC_hypothetical_drilling_header.jpg400900Matt Kelso, BAhttps://www.fractracker.org/a5ej20sjfwe/wp-content/uploads/2025/09/2025-Wordmark-Logo.pngMatt Kelso, BA2016-12-30 10:03:102021-04-15 15:04:18Hypothetical Impacts of Unconventional Drilling In Allegheny County
As an American, you are part owner of 640 million acres of our nation’s shared public lands managed by the federal government. And chances are, you’ve enjoyed a few of these lands on family picnics, weekend hikes or summer camping trips. But did you know that some of your lands may also be leading to toxic air pollution and poor health for you or your neighbors, especially in 5 western states that have high oil and gas drilling activity?
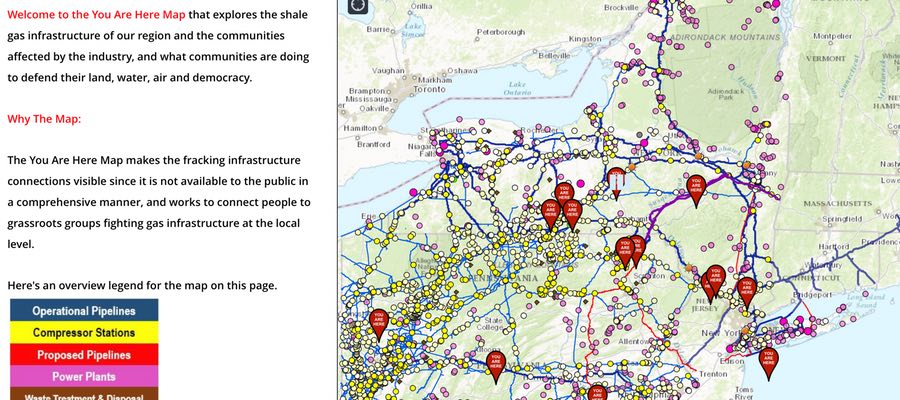
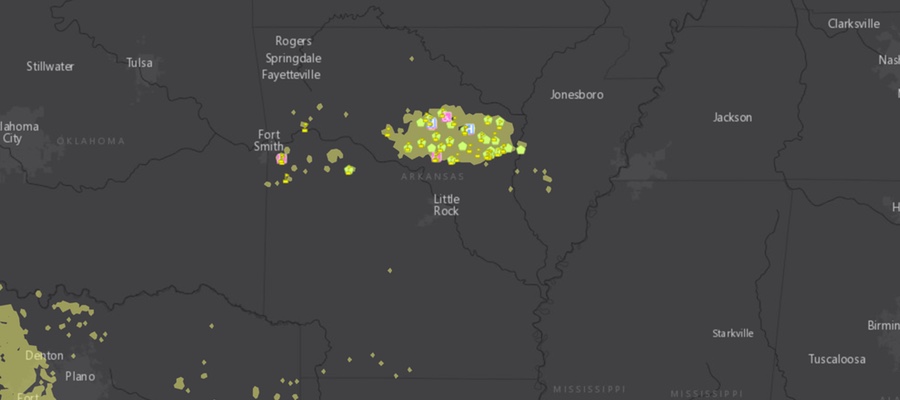
A set of new interactive maps created by FracTracker, The Wilderness Society, and partner groups show the threatened populations who live within a half mile of federal oil and gas wells – people who may be breathing in toxic pollution on a regular basis.
Altogether, air pollution from oil and gas development on public lands threatens at least 73,900 people in the 5 western states we examined. The states, all of which are heavy oil and gas leasing areas, include Colorado, New Mexico, North Dakota, Utah and Wyoming.
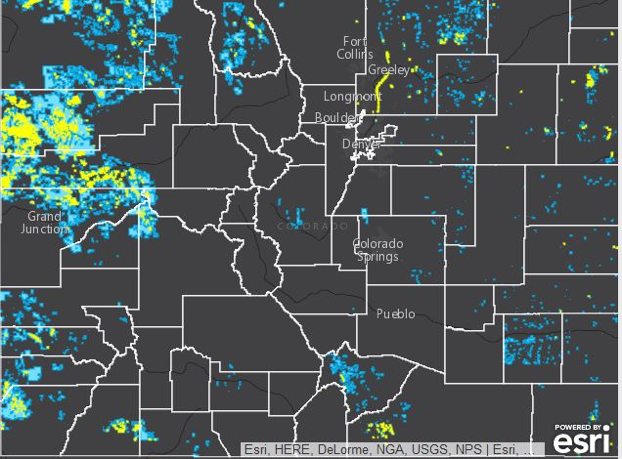
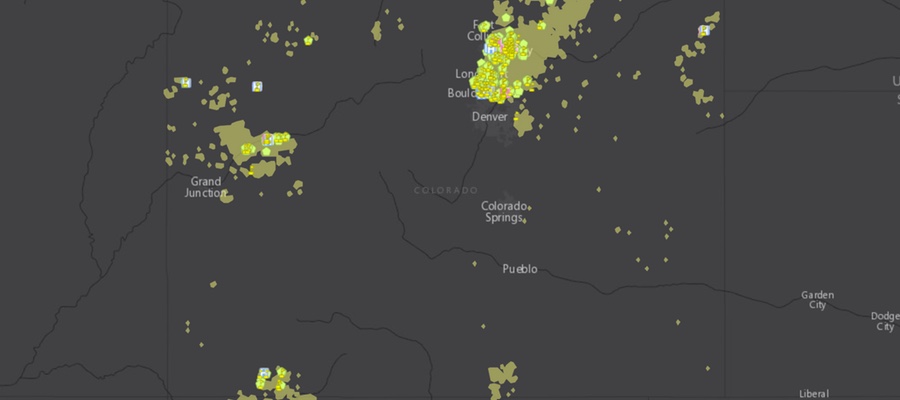
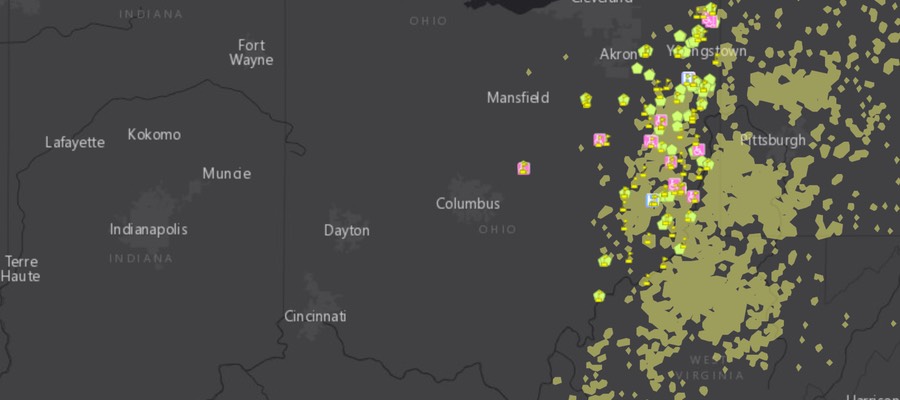
Figure 1. Close up of threat map in Colorado
In each state, the data show populations living near heavy concentrations of wells. For example just northeast of Denver, Colorado, in the heavily populated Weld County, at least 11,000 people are threatened by oil and gas development on public lands (Figure 1).
Western cities, like Farmington, New Mexico; Gillette, Wyoming; and Grand Junction, Colorado are at highest risk of exposure from air pollution. In New Mexico, especially, concentrated oil and gas activity disproportionately affects the disadvantaged and minorities. Many wells can be found near population centers, neighborhoods and even schools.
Colorado: Wells concentrated on Western Slope, Front Range
Note: The threatened population in states are a conservative estimate. It is likely that the numbers affected by air pollution are higher.
In 2014, Colorado became the first state in the nation to try to curb methane pollution from oil and gas operations through comprehensive regulations that included inspections of oil and gas operations and an upgrade in oil and gas infrastructure technology. Colorado’s new regulations are already showing both environmental and financial benefits.
But nearly 16,000 people – the majority living in the northwestern and northeastern part of the state – are still threatened by pollution from oil and gas on public lands.
Many of the people whose health is endangered from pollution are concentrated in the fossil-fuel rich area of the Western Slope, near Grand Junction. In that area, three counties make up 65% of the total area in Colorado threatened by oil and gas development.
In Weld County, just northeast of Denver, more than 11,000 residents are threatened by air pollution from oil and gas production on federal lands. But what’s even more alarming is that five schools are within a half mile radius of wells, putting children at risk on a daily basis of breathing in toxins that are known to increase asthma attacks. Recent studies have shown children miss 500,000 days of school nationally each year due to smog related to oil and gas production.
State regulations in Colorado have helped improve air quality, reduce methane emissions and promote worker care and safety in the past two years, but federal regulations expected by the end of 2016 will have a broader impact by regulating pollution from all states.
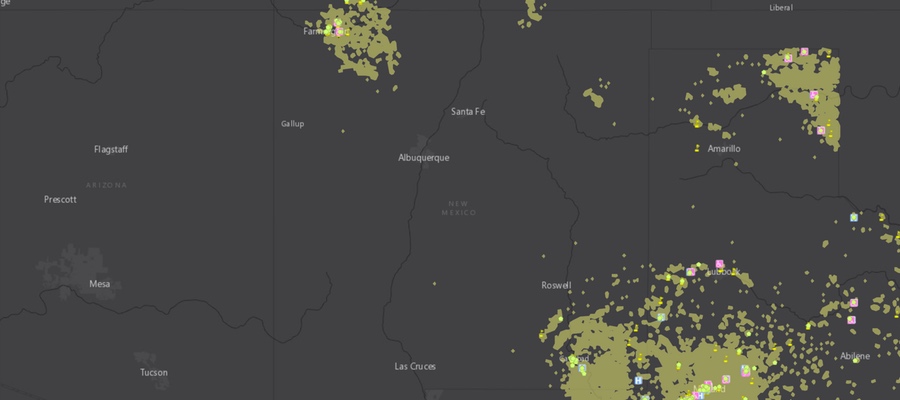
New Mexico: Pollution seen from space threatens 50,000 people
With more than 30,000 wells covering 4.6 million acres, New Mexico is one of the top states for oil and gas wells on public lands. Emissions from oil and gas infrastructure in the Four Corners region are so great, they have formed a methane hot spot that has been extensively studied by NASA and is clearly visible from space.
Nearly 50,000 people in northwestern New Mexico – 40% of the population in San Juan County – live within a half mile of a well.
Dangerous emissions from those wells in San Juan County disproportionately affect minorities and disadvantaged populations, with about 20% Hispanic, almost 40% Native American, and over 20% living in poverty.
Another hot spot of oil and activity is in southeastern New Mexico stretching from the lands surrounding Roswell to the southern border with Texas. Wells in this region also cover the lands outside of Carlsbad Caverns National Park, potentially affecting the air quality and visibility for park visitors. Although less densely populated, another 4,000 people in two counties – with around 50% of the population Hispanic – are threatened by toxic air pollution.
Wyoming: Oil and gas emissions add to coal mining pollution
Pollution from oil and gas development in Wyoming, which has about as many wells as New Mexico, is focused in the Powder River Basin. This region in the northeast of the state provides 40% of the coal produced in the United States.
Oil and gas pollution threatens approximately 4,000 people in this region where scarred landscapes and polluted waterways are also prevalent from coal mining.
With the Obama administration’s current pause on federal coal leasing and a review of the federal coal program underway, stopping pollution from oil and gas on public lands in Wyoming would be a major step in achieving climate goals and preserving the health of local communities.
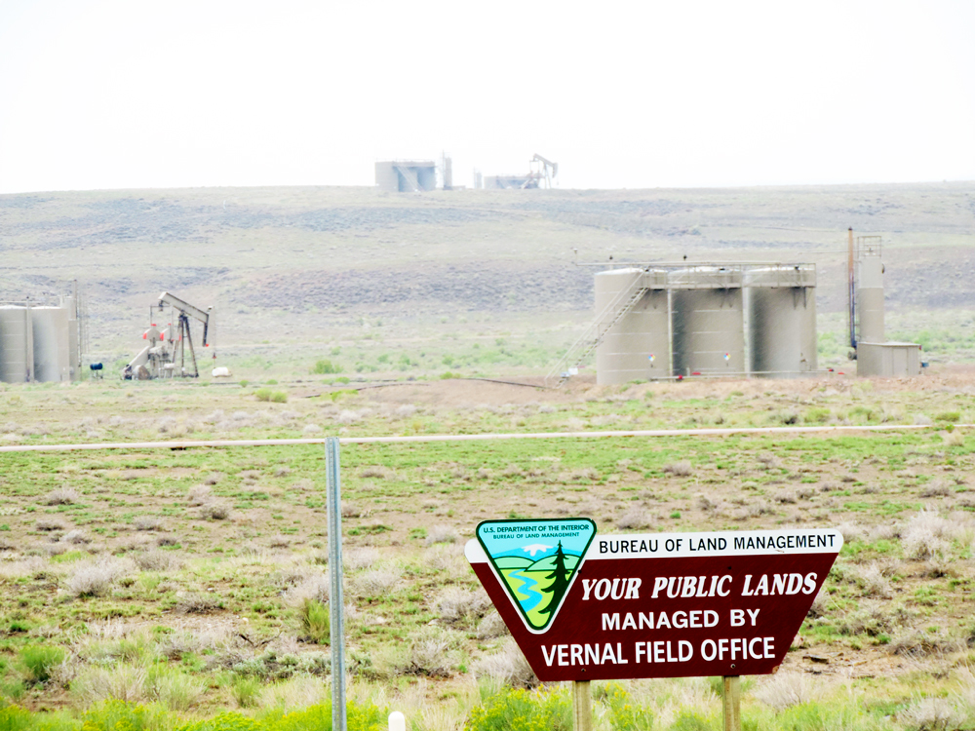
Utah: Air quality far below federal standards
Utah has almost 9,000 active wells on public lands. Oil and gas activity in Utah has created air quality below federal standards in one-third of Utah’s counties, heightening the risk of asthma and respiratory illnesses. Especially in the Uintah Basin in northeastern Utah – where the majority of oil and development occurs – a 2014 NOAA-led study found oil and gas activity can lead to high levels of ozone in the wintertime that exceed federal standards.
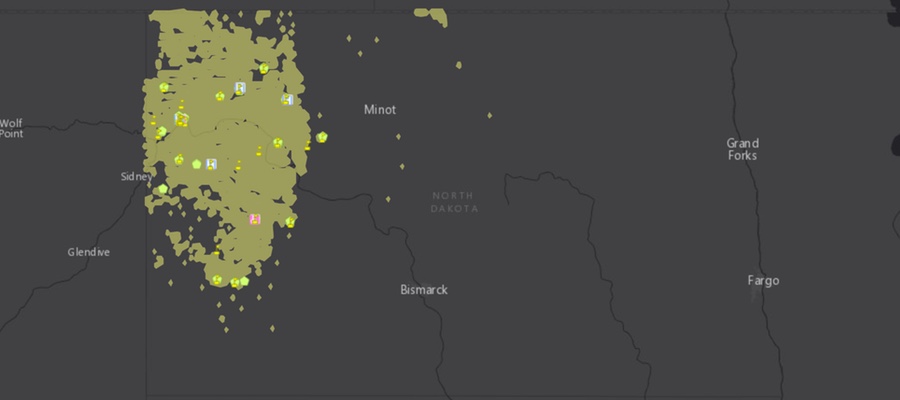
North Dakota: Dark skies threatened by oil and gas activity
The geology of western North Dakota includes the Bakken Formation, one of the largest deposits of oil and gas in the United States. As a result, high oil and gas production occurs on both private and public lands in the western part of the state.
Nearly 650 wells on public lands are clustered together here, directly impacting popular recreational lands like Theodore Roosevelt National Park.
The 70,000-plus-acre park – named after our president who first visited in 1883 and fell in love with the incredible western landscape – is completely surrounded by high oil and gas activity. Although drilling is not allowed in the park, nearby private and public lands are filled with active wells, producing pollution, traffic and noise that can be experienced from the park. Due to its remote location, the park is known for its incredible night sky, but oil and gas development increases air and light pollution, threatening visibility of the Milky Way and other astronomical wonders.
Now that we can see how many thousands of people are threatened by harmful emissions from our public lands, it is more important than ever that we finalize strong federal regulations that will help curb the main pollutant of natural gas – methane – from being leaked, vented, and flared from oil and gas infrastructure on public lands.
Federal oil and gas wells in western states produce unseen pollution that threatens populations at least a half mile away. Photo: WildEarth Guardians, flickr.
We need to clean up our air now
With U.S. public lands accounting for 1/5 of the greenhouse gas footprint in the United States, we need better regulations to reduce polluting methane emissions from the 96,000 active oil and gas wells on public lands.
Right now, the Bureau of Land Management is finalizing federal regulations that are expected by the end of 2016. These regulations are expected to curb emissions from existing sources – wells already in production – that are a significant source of methane pollution on public lands. This is crucial, since by 2018, it is estimated that nearly 90% of methane emissions will come from sources that existed in 2011.
Final regulations from the Bureau of Land Management will also add to other regulations from the EPA and guidance from the Obama administration to modernize energy development on public lands for the benefit of the American people, landscapes and the climate. In the face of a changing climate, we need to continue to monitor fossil fuel development on public lands and continue to push the government towards better protections for land, air, wildlife and local communities.
By The Wilderness Society – The Wilderness Society is the leading conservation organization working to protect wilderness and inspire Americans to care for our wild places. Founded in 1935, and now with more than 700,000 members and supporters, The Wilderness Society has led the effort to permanently protect 109 million acres of wilderness and to ensure sound management of our shared national lands.
https://www.fractracker.org/a5ej20sjfwe/wp-content/uploads/2016/10/ProdPublicLand-Feature.jpg400900Guest Authorhttps://www.fractracker.org/a5ej20sjfwe/wp-content/uploads/2025/09/2025-Wordmark-Logo.pngGuest Author2016-10-31 09:00:302021-04-15 15:04:23Interactive maps show nearness of oil and gas wells to communities in 5 states
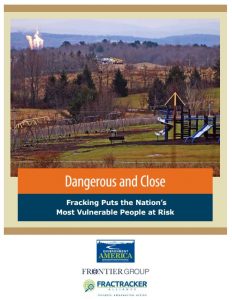
Cover of Dangerous and Close report. Click to view report
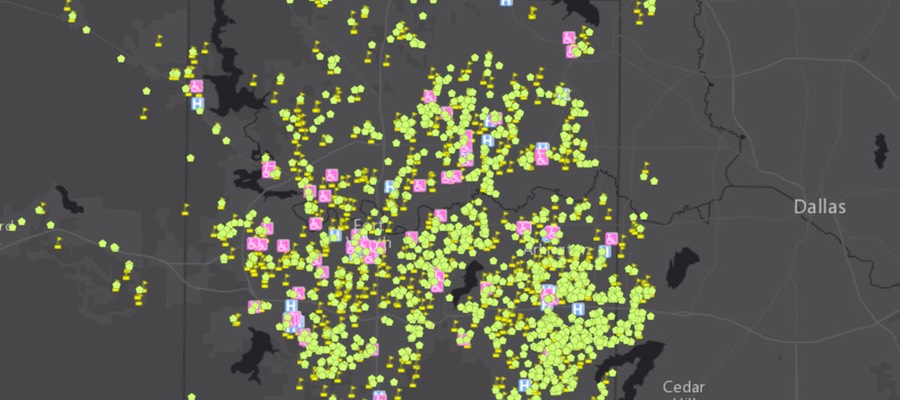
FracTracker Alliance has been working with the Frontier Group and Environment America on a nationwide assessment of “fracked” oil and gas wells. The report is titled Dangerous and Close, Fracking Puts the Nation’s Most Vulnerable People at Risk. The assessment analyzed the locations of fracked wells and identified where the fracking has occurred near locations where sensitive populations are commonly located. These sensitive sites include schools and daycare facilities because they house children, hospitals because the sick are not able to fight off pollution as effectively, and nursing homes where the elderly need and deserve clean environments so that they can be healthy, as well. The analysis used data on fracked wells from regulatory agencies and FracFocus in nine states. Maps of these nine states, as well as a full national map are shown below.
No one deserves to suffer the environmental degradation that can accompany oil and gas development – particularly “fracking” – in their neighborhoods. Fracked oil and gas wells are shown to have contaminated drinking water, degrade air quality, and sicken both aquatic and terrestrial ecosystems. Additionally, everybody responds differently to environmental pollutants, and some people are much more sensitive than others. In fact, certain sects of the population are known to be more sensitive in general, and exposure to pollution is much more dangerous for them. These communities and populations need to be protected from the burdens of industries, such as fracking for oil and gas, that have a negative effect on their environment. Commonly identified sensitive groups or “receptors” include children, the immuno-compromised and ill, and the elderly. These groups are the focus of this new research.
National Map
National interactive map of sensitive receptors near fracked wells
Sierra Shamer, Visiting Scholar, FracTracker Alliance
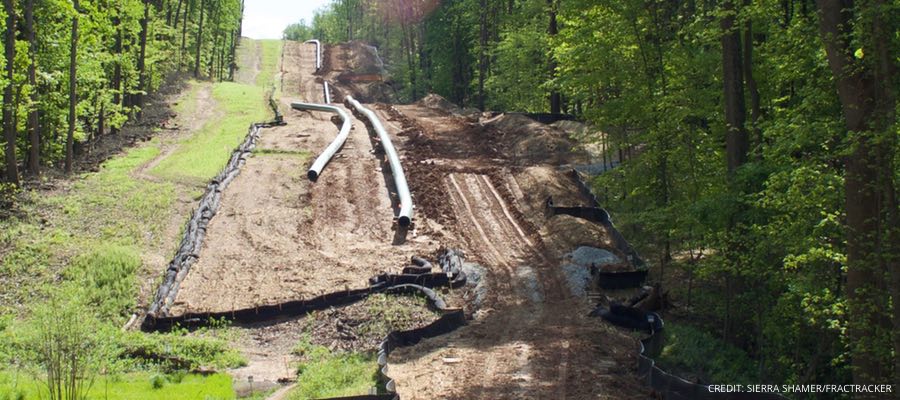
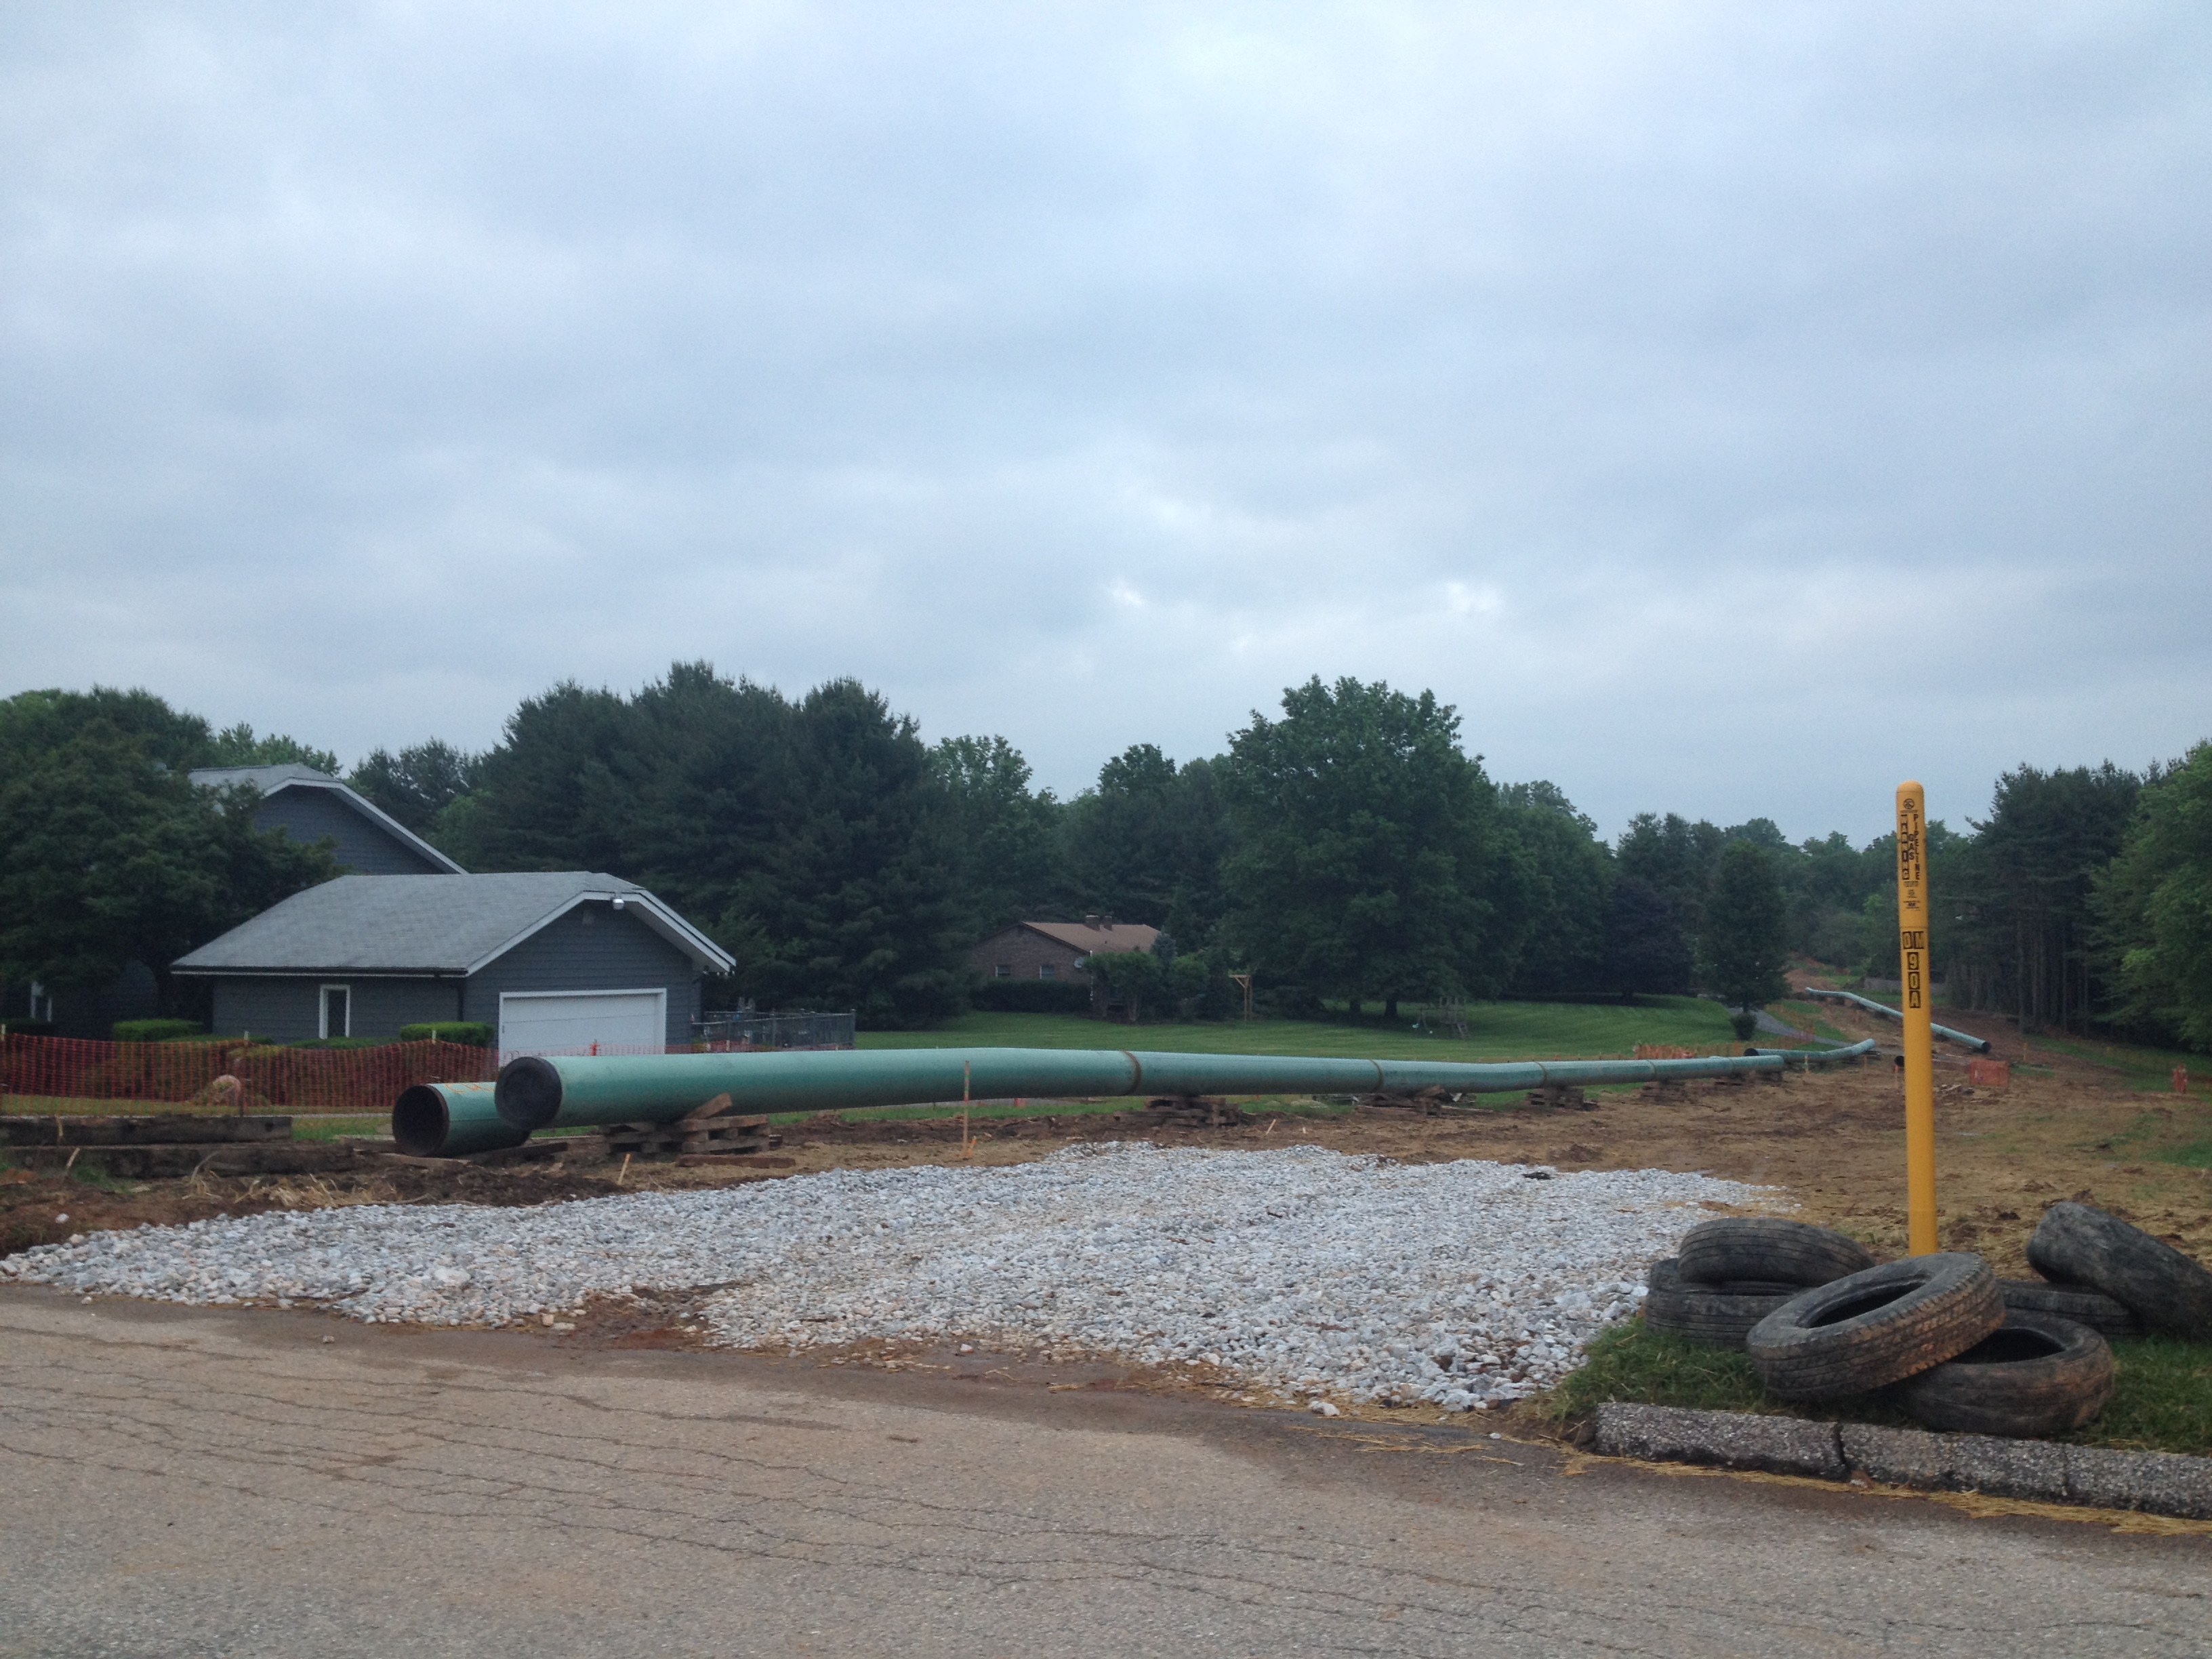
While neighboring states New York and Maryland work to regulate the natural gas industry, Pennsylvania makes way for a pipeline build-out and continued unconventional oil and gas drilling. The industry, legislature, and state agencies claim that continued natural gas development is necessary, can be carried out safely, and will provide money, jobs, and energy to Pennsylvania. However, the price is increasingly evident, and the realization of these claims is yet to come.
PA residents are quickly learning that pipelines come with a cost; their permitting, construction, and supporting facilities infringe on private property rights, cause water and air pollution, and threaten public safety. On Friday April 29th in Westmoreland County, for example, Spectra Energy’s Texas Eastern 30″ gas pipeline exploded, severely burning one man, destroying his home, and damaging homes nearby. The local fire chief recounted his awe at the explosion. For him, it was “… like you were looking down into hell.” These costs prompt communities to consider whether the advertised benefits of pipelines will actually outweigh the costs. Active grassroots resistance has emerged throughout the state, and as it grows, it is consistently met with industry aggression and state repression.
This article provides an overview of the pipeline build-out in Pennsylvania, the political and economic environment promoting it, growing community activism, and, how the industry and state respond. An interactive map of existing and proposed pipelines in PA is featured at the end of the article.
The Shale in Pennsylvania
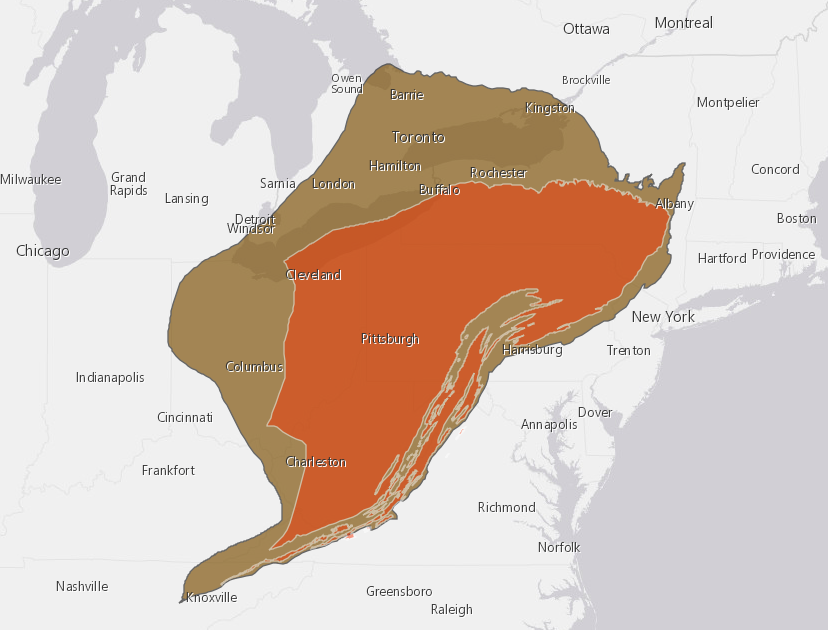
Extent of the Utica (brown) and Marcellus (orange) shale formations. Click to expand.
The existing interstate pipeline network moves domestic and imported oil and gas to consumers and markets within North America. These pipelines extend from regions of conventional drilling to domestic and foreign energy markets. The recent development and expansion of unconventional drilling provides access to energy reservoirs that could not be extracted before. Within the past five years, the US overtook Russia to become the largest producer of natural gas in the world.
The Marcellus and Utica shale formations exist below the Appalachian Mountains in the northeast U.S. and into Canada. The Marcellus lies beneath Pennsylvania, Virginia, Maryland, West Virginia, Ohio, and New York. The Marcellus is now the largest region of natural gas production in the United States. Geologists estimate that 4-8,000 ft. underground, over 600 trillion cubic ft. of natural gas is accessible. The Utica formation lies underneath the Marcellus, extending north into Ontario and New York, and south into Virginia, Kentucky, and Tennessee. Geologists estimate over 38 trillion cubic ft. of natural gas is accessible – in some locations over 10,000 feet underground.
Extraction in Pennsylvania
Almost 10,000 unconventional wells in Pennsylvania produce millions of cubic feet of gas each day. This rapid extraction flooded the market, causing natural gas prices to drop dramatically. Marcellus production also outpaced the capacity of the current pipeline network. The location and flow direction of existing pipelines is not ideal for transporting Marcellus gas to markets with higher demand. Additionally, well productivity drops 70% within the first year, so new wells must be drilled to keep the gas flowing. However, the low price of gas reduced revenues, and the cost of drilling new wells remains high. Combined, these factors have paused drilling activity throughout the state. In order to overcome this, gas companies are proposing construction of new pipelines and expansions of existing ones, resulting in the current pipeline build-out.
The Economics of Pipelines
The dominant narrative, promoted by industry and state, weaves a story of economic prosperity gained by drilling the Marcellus, eclipsing concerns of pipeline necessity and safety. Each pipeline project claims an economic impact in dollar amounts and jobs. Williams claims that their proposed Atlantic Sunrise pipeline will “increase economic activity by $1.6 billion in project regions” and create job opportunities. Sunoco Logistics claims that the Mariner East pipeline will “add $4.2 billion to Pennsylvania’s economy, supporting more than 30,000 jobs during the construction period and … 300-400 permanent jobs.” Often, the specifics of money and jobs are not explained, and when construction begins, communities are invaded by out of state workers and left with little economic benefit.
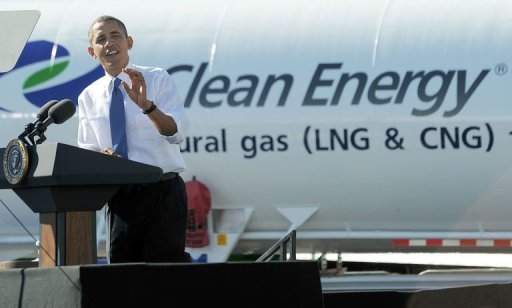
Response to this buildout arises at all levels. Support pours down from federal and state government while resistance pushes up from the grassroots. The EPA and Obama administration work to shut down coal and promote natural gas, claiming it’s a “bridge fuel” to renewable energy. Pennsylvania’s legislature and Dept. of Environmental Protection (DEP) have battled over drilling regulations, and the push for pipelines presents a different set of challenges. While some consider the build-out necessary to maintain the natural gas industry in PA, others, such as Phil Rinaldi, envision ways in which pipelines can bring money to the state.
Philadelphia Energy Hub
Aware that interstate pipelines carry Pennsylvania shale to out-of-state markets, Phil Rinaldi, the CEO of Philadelphia Energy Solutions (PES) views the shale boom as an opportunity to maintain resource and revenue in state. In 2013 he established the Greater Philadelphia Energy Action Team (GPEAT), a group of over 80 industry, manufacturing, labor, and government stakeholders. Their objective is to capitalize on shale by promoting pipeline construction and bringing energy-intensive manufacturing to the Greater Philadelphia area. In March of this year, the GPEAT released a report titled, “A Pipeline for Growth: Fueling Economic Revitalization with Marcellus and Utica Shale Gas.” This reports details strategies to hasten the transformation of Philly into the “energy hub” of the East by inviting chemical manufacturing industries, and supporting pipeline projects to Philadelphia.
At Ground Level
2016: Columbia 26″ pipeline construction near a home in Northern Maryland (Photo: Sierra Shamer)
At a ground level, impacted communities, public health professionals, and environmental organizations face a ravenous industry. Unaccountable for property takings, fair compensation, and pollution, it as an industry that disregards public health and ecosystems within the shalefields. As a result, grassroots and advocacy groups organize and mobilize throughout Pennsylvania to amplify the voices of impacted residents and communities and to hold the industry and government accountable to the people.
Although pipelines bring large revenues for companies, industry, and the state, the story on the ground is different. New pipelines are either constructed on existing land easements, or new ones must be purchased from landowners along the proposed right-of-way. Pipeline operators have one goal: to find the most direct and least complicated route from supply to demand. While this lower their bottom line, new pipeline routes often disregard nearness to homes, schools, and other populated areas, and cause significant damage to farmland and ecosystems.
Frontline Communities
Pipeline companies often have the power of eminent domain, the ability to take possession of land in court if the property owner refuses a contract. Negotiating fair agreements requires landowners to hire their own appraiser and lawyer, which is not an option for everyone. Unlike drilling wells, landowners do not receive royalties for the pressurized gas flowing underneath their property, facing instead declines in property values and an inability to sell their home. As a result, landowners are left undercompensated, their land forcibly taken away in an unjust process.
Landowners along the right-of-way are the most immediately impacted, but neighbors and communities are affected as well. Each pipeline has a “potential impact radius” or “hazard zone,” the area within which an explosion causes immediate destruction. Residents within this distance experience a decrease in their property values, but currently have no legal recourse for compensation. Pipelines also require numerous compressor stations, facilities that operate 24-7 to maintain the pressure of the gas within the pipeline. Compressor stations are industrial, air polluting facilities that release greenhouse gases, neurotoxins, cancer causing agents, and other pollutants that negatively impact human health and the environment. Residents living near compressor stations experience various respiratory, sinus, and nervous system health issues. These are caused by both everyday operation and periodical gas blowdowns – facility operations when large amounts of methane and other chemicals are released directly into the air for station maintenance or emergencies.
Pipeline Regulation
FERC holds Public Meetings for the Atlantic Sunrise Pipeline (Photo: Justin Engle/The Daily Item)
In Pennsylvania, no single agency is responsible for permitting, monitoring, or regulating pipelines. The Federal Energy Regulatory Commission (FERC) permits interstate pipelines, those that cross state boundaries or carry product that does. Pipelines within the state are under the jurisdiction of the Public Utility Commission (PUC), the DEP, and/or the Dept. of Conservation and Natural Resources (DCNR).
Typically, the PUC is responsible for pipelines that provide directly to consumers. However, in 2011 Act 127 gave the PUC authority to permit and inspect gathering lines, those that move gas from well pads to larger transmission pipelines. All gathering lines have national safety standards except Class 1, those with no more than ten buildings within 220 yards. The PUC maintains a registry of the location, size, and length of gathering lines, but is only includes length for Class 1. Over 12,000 miles of Class 1 pipelines currently exist in PA, a number expected to quadruple by 2030.
Pipeline Infrastructure Task Force
The complex regulation and unprecedented increase in proposals prompted Governor Wolf to create the Pipeline Infrastructure Task Force (PITF) in 2015. Headed by former Secretary of the DEP, John Quigley, the Task Force included regulatory agencies, industry representatives, and government officials. Their mission: to “engage stakeholders in a collaborative process to achieve a world-class pipeline infrastructure system” and to develop “policies, guidelines, and tools to assist in pipeline development.” The DEP offered live stream of meetings, provided public information, and opportunity for public input in an attempt to be transparent.
Task Force meetings eventually resulted in a final report, outlining challenges and providing suggestions for pipeline construction. First, the Task Force recommended an increase meaningful public participation and the development of long term maintenance plans to ensure safety. Second, they suggested reducing environmental impact by improving pipeline siting and construction and maximizing efficient permitting. Finally, they recommended enhancing the workforce and economic development from pipeline projects.
The Task Force openly acknowledged problems of the pipeline build-out, stating that “permits are not reviewed for the cumulative and long term impacts at a landscape level…they do not necessarily avoid sensitive lands, habitats, and natural features, nor are the impacts to natural and cultural resources, landowners, and communities…always minimized or mitigated.” Despite this, the administration and the Task Force maintain that pipelines can be built responsibly.
Community Opposition and Criticism
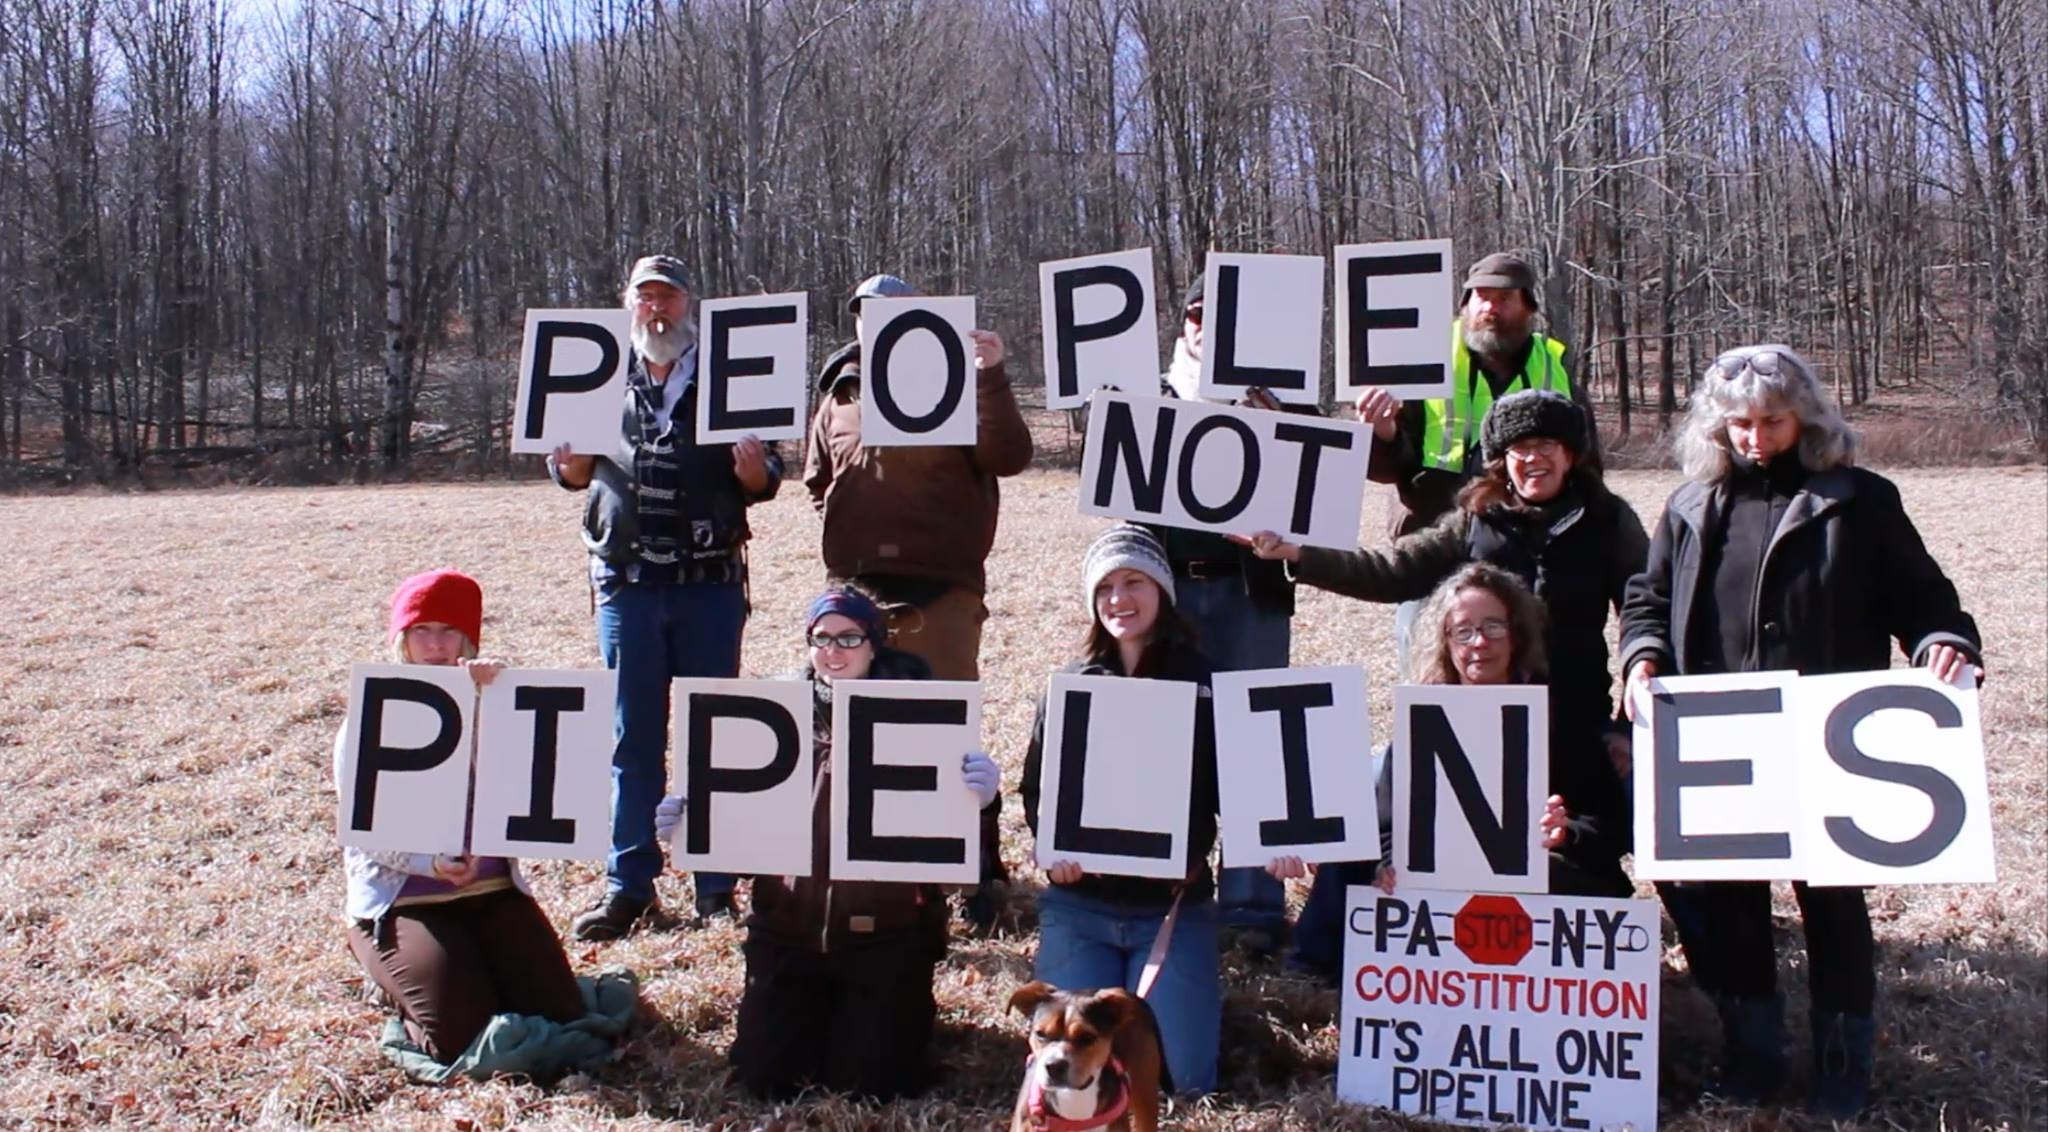
2016: Landowners and supporters protest the Constitution Pipeline in Northeast PA. (Photo: DC Media Group)
Challenges to the pipeline build-out exist in many forms. Landowners challenge the bullying, harassment, and eminent domain condemnations of pipeline companies. Communities criticize the acceptance of industry funding and pipelines by local representatives. Additionally, grassroots groups and environmental non-profits challenge the minimal regulation, permitting process, and lack of public participation allowed by the DEP, and the FERC “rubber stamp” permitting process.
Awareness and opposition grow with each proposal, condemnation, rupture, and explosion. This rapid construction is compromising pipeline quality and public safety, according to a report conducted by the Pipeline Safety Trust. They found that pipelines built after 2010 had higher rates of failure than those in decades past. Whistleblowers who worked for Spectra Energy have attested to the neglect of proper inspection in the haste to construct pipelines. Spectra’s Texas Eastern pipeline, completed in 1981, was built in a decade when pipelines failed at one-sixth the rate they do today. However, their preliminary investigation indicates that the explosion in Salem Township was likely the result of corrosion due to a “possible flaw in the coating material applied to the weld joints.”
The FERC is a regular target of criticism. Funded through fees received by the companies and industries it oversees, FERC rarely denies permits for pipelines. The Delaware Riverkeeper Network has filed a lawsuit against the FERC challenging the constitutionality of its decision-making.
The DEP’s dedication to protecting Pennsylvania’s environment from the natural gas industry at large is continuously questioned due to its infrastructure permitting, negligent response to water contamination complaints, and unwillingness to hold companies accountable. The DEP’s poor record on drilling regulation continues with regard to the pipeline build-out.
Pipeline Infrastructure Task Force
The Task Force is criticized for its overwhelming industry influence and lack of public inclusion. Of the 48 Infrastructure Task Force members, 56% are tied to the oil and gas industry. Specifically, 92% of the non-governmental members have industry ties. In fact, potential opposition to the build-out was intentionally absent. PA resident and documentary filmmaker Scott Cannon of the Gas Drilling Awareness Coalition (GDAC) was invited to the PITF, only to receive a letter rescinding his invitation a few days later. Additionally, concerned residents were allowed 2 minutes to make a statement, a limit strictly enforced by Secretary Quigley. While affected landowners recounted their fight for their livelihoods, the roundtable of apathetic Task Force members stared blankly. These problems resulted in escalating activist presence increasing from comments and protests outside the DEP building, to meeting disruptions and arrests.
Residents and activists weren’t the only ones unhappy with the PIFT. Cindy Ivey, representative for Williams, and Sarah Battisti, with SouthWest Energy, spoke of their frustrations. The fact that interstate pipeline projects are regulated by federal agencies, and state level organizations have a minor role caused tension in the group. According to Ivey, these issues are “hard things to try to explain gracefully.” Additionally, Battisti added that the 184 recommendations in the report wouldn’t “impact any of us in the near future.”
Despite recommendations of the Task Force, the DEP continues to issue permits that neglect cumulative impacts and complete environmental review. Unlike New York, which denied the 401 Water Quality certificate and prevented the construction of Constitution pipeline, the PA DEP granted the 401 certificate to the Atlantic Sunrise pipeline. As a result, it is under appeal by environmental groups, who argue that it violates the Clean Water Act and the Pennsylvania Code.
PA’s Political Climate
Regulations
Unfortunately, meaningful updates to oil and gas regulations in Pennsylvania are consistently challenged. Although Act 13 passed in 2012, critical components were appealed repeatedly, specifically the issue of local zoning authority of oil and gas infrastructure. Lawmakers who oppose any restriction on the industry dominate the current legislature. Recently, the House panel voted a second time to block increased DEP oil and gas regulations, in the making since 2011.
Frustrations in the process peaked when John Quigley resigned as secretary of the DEP after sending a profane email chastising environmental groups for their lack of support. Weeks later, Governor Wolf signed a bill that eliminates current regulations, aiming to start new and in agreement with the legislature. As a result, many environmentalists feel that the Governor has consistently compromised on the environment, putting the lives of PA residents at risk.
Political Campaigns
The relationship between the state and the drilling industry is evident and problematic in Pennsylvania. The Marcellus Money project has tracked campaign contributions and lobbying expenses from the natural gas industry, revealing over $8 million in political contributions and $46 million for lobbying efforts. In 2013 the Public Accountability Initiative released a report revealing the “revolving door” between state government and the oil and gas industry. The report identifies individuals who have moved from the public sector to industry jobs or vice versa, and how often this occurs over the course of their careers.
NPR StateImpact Pennsylvania created an interactive webpage called, “Blurred Lines” that provides a visual exploration of the “revolving door.” As you scroll through the years, individuals slide back and forth between the private and public sector. Additionally, lawmakers have, for a third time, earmarked fiscal code legislation to fund an industry-supported non-profit Shale Alliance for Energy Research PA, (SAFER PA).
State Agencies
Financial gains from drilling support other aspect of the public sector as well. The DCNR’s annual budget became increasingly reliant upon revenues from gas leases within public lands. In 2013, oil and gas lease royalties and other payments provided one-third of the DCNR’s budget. Act 13 implemented a mandatory impact fee whereby the PUC collects money from companies based on the number of oil and gas wells in the state. This money is directed to local municipalities based on the number of wells within their boundaries. However, while 60% of the fee total goes directly to impacted counties, the remaining 40% can go anywhere in PA. While impact fees totaled over $233 billion dollars in 2014, 2016 is expected to be the lowest amount yet due to the decline in drilling activity. This statistic is one of many that highlights the risk of relying on a fluctuating resource.
Governmental and Industry Responses
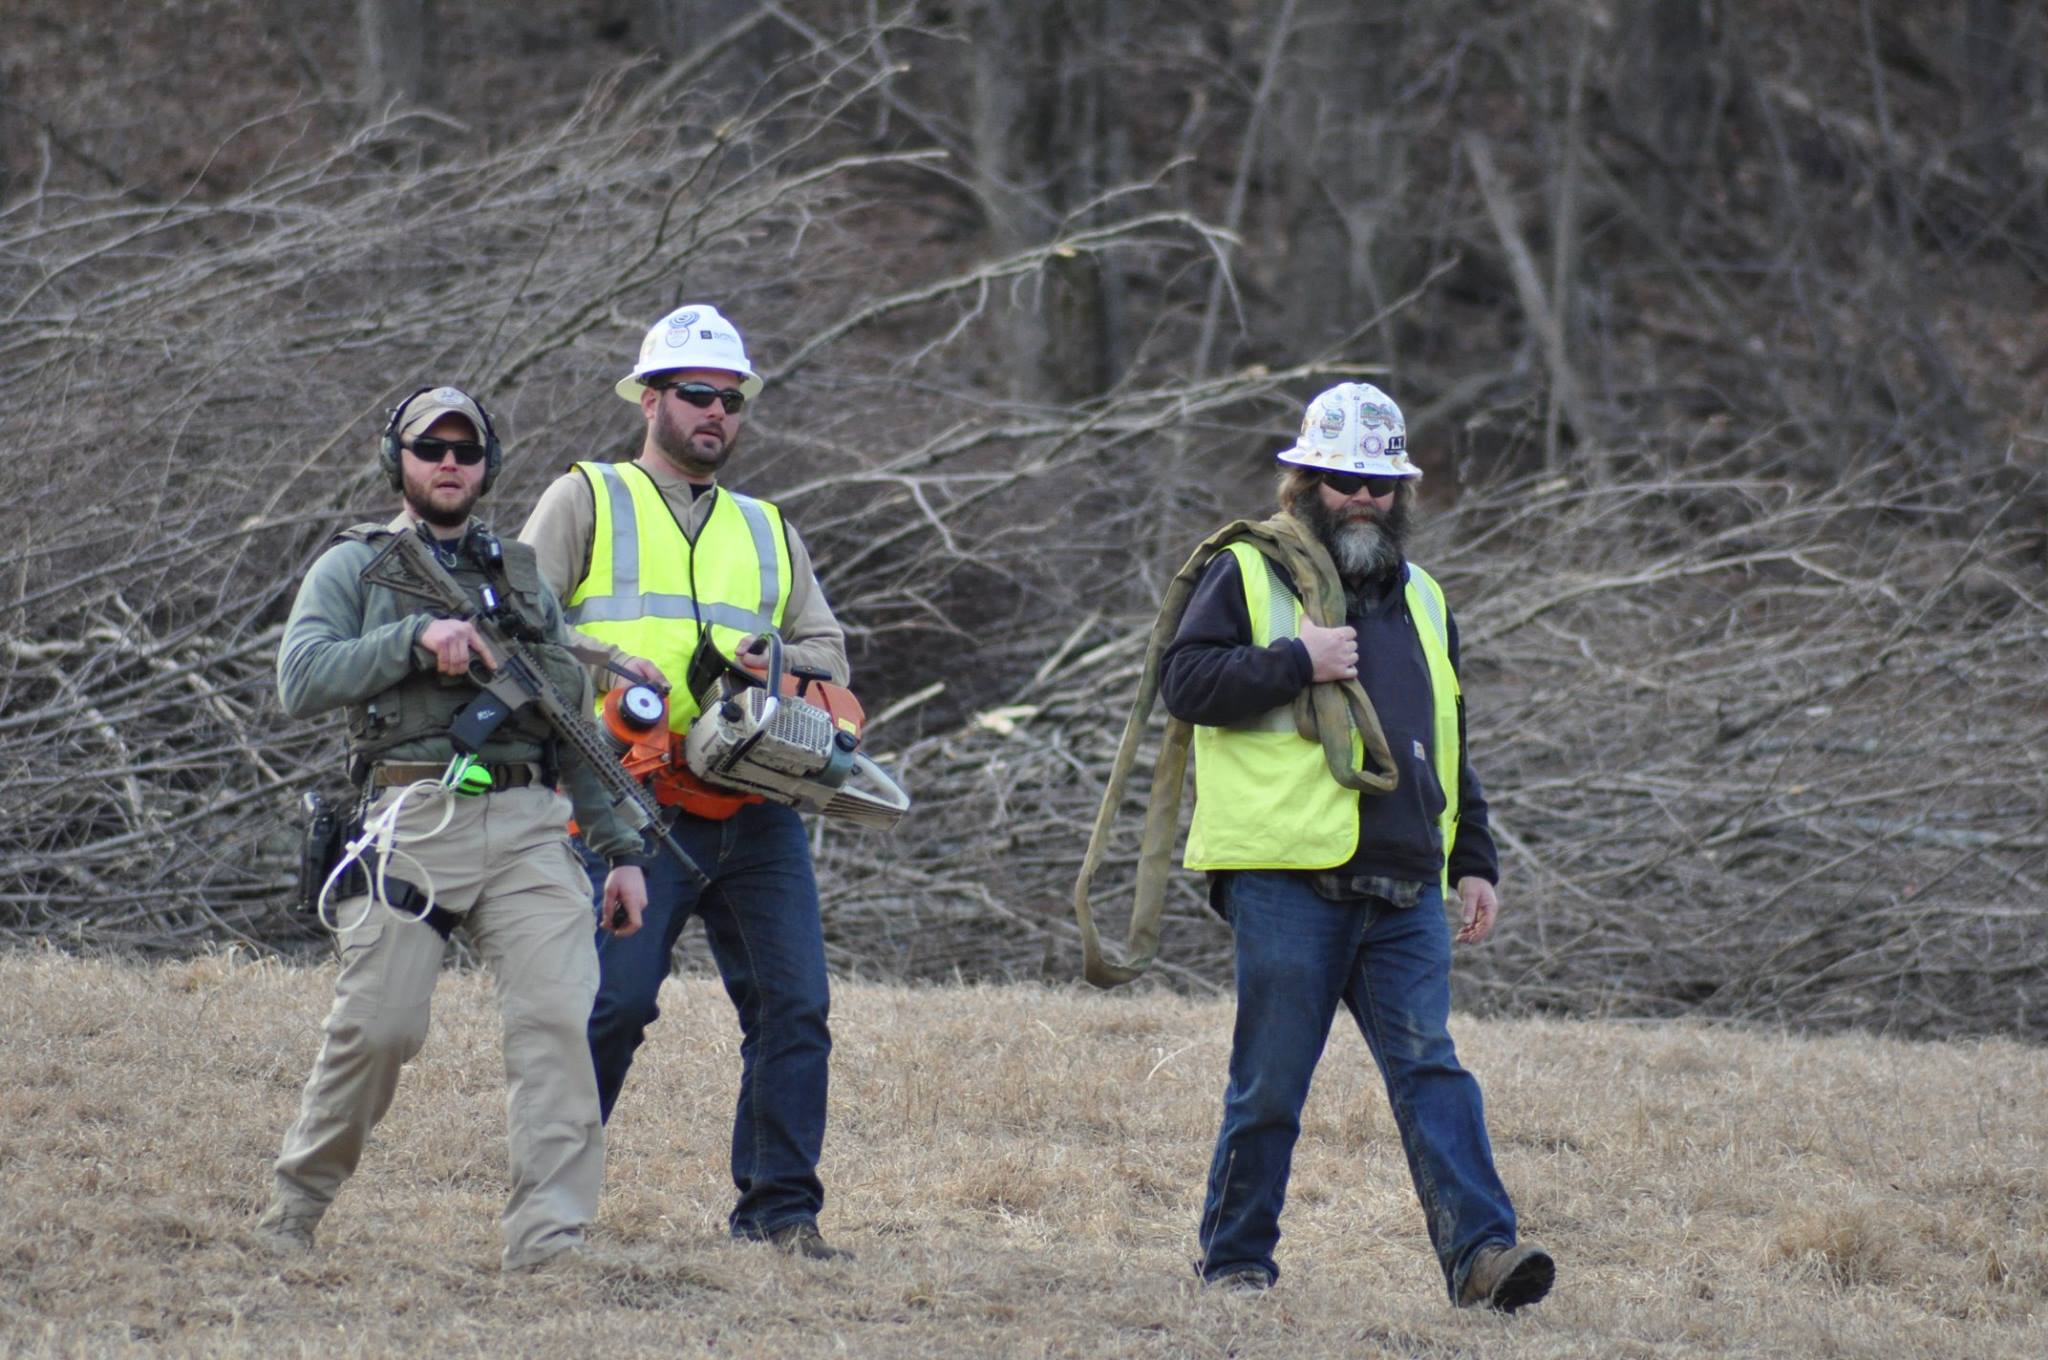
2016: Armed U.S. Marshall escort the tree cutting crew for the Constitution pipeline on Megan Holleran’s property (Photo: Alex Lotorto)
Response to community opposition of pipeline projects is often militaristic in nature and exaggerated by the industry and the state. The oil and gas industry views community opposition to infrastructure as an “insurgency.” In 2011, it was revealed that the Army/Marine Corps Counterinsurgency manual is used as a tactical reference. The Gas Drilling Awareness Coalition was classified as a terrorist threat by the PA Office of Homeland security, who hired the Institute of Terrorism Research and Response to track activists provide weekly information on a bulletin sent to law enforcement and gas companies. In 2012, state law enforcement, the FBI, the PA Office of Homeland Security, and the oil and gas industry established the Marcellus Shale Operators’ Crime Committee (MSOCC). This committee actively targeted activists and environmentalists in their homes.
Landowners who refuse to sign easements face an uphill battle against companies, law enforcement, and the state as they advocate for their rights. Megan Holleran of Susquehanna County lost her family’s maple syrup trees to Williams’ proposed Constitution pipeline. After protesting and challenging in court, the judge upheld eminent domain and prohibited the family from being within 150 feet from the right-of-way. Further, armed U.S. Marshalls escorted and guarded the tree cutting crew against peaceful protest. Additionally, in Huntingdon County, Elise and Ellen Gerhart faced tree clearing of their woods for Sunoco’s Mariner East pipeline. Once again, armed police escorted tree cutting crews and made several arrests of protesters, who faced bails of up to $200,000.
Pipeline Build-Out Map
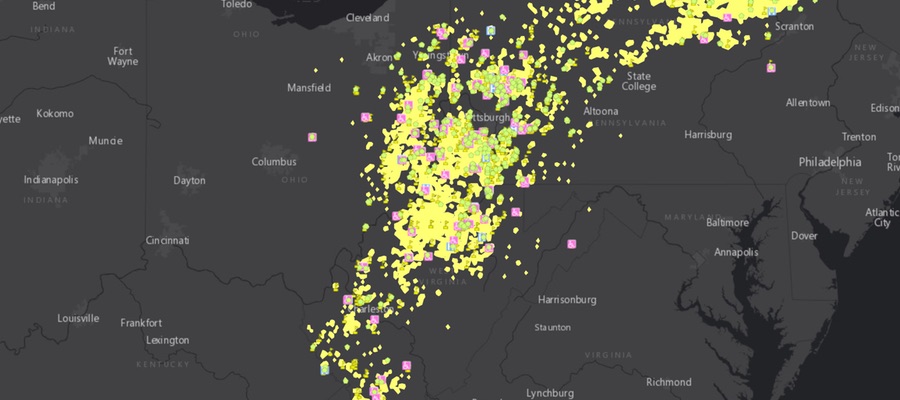
The map below shows the existing major pipeline infrastructure in Pennsylvania and proposed pipelines, with the option of also viewing the unconventional wells in the Marcellus and Utica shale. For more information on pipeline regulation and public information, please view our Intro to Pipelines resource page. It includes details about current and proposed pipeline projects in Pennsylvania and throughout the country. Additionally, the intro links to a map of all proposed pipeline projects in North America.
While it is clear that companies go to every length to construct pipelines, it is equally clear that state agencies, courts, and law enforcement support pipeline development. The direction of drilling, pipelines, and politics in the state of Pennsylvania serves the bottom line of the natural gas industry. This is evidenced by the proposed pipeline built-out, state support, and state suppression of public backlash. However, continued challenges to public health and environment will only serve to increase the resilience and strength of community opposition.
https://www.fractracker.org/a5ej20sjfwe/wp-content/uploads/2016/06/Pipeline-Build-Out-Feature.jpg400900FracTracker Alliancehttps://www.fractracker.org/a5ej20sjfwe/wp-content/uploads/2025/09/2025-Wordmark-Logo.pngFracTracker Alliance2016-06-28 09:29:382020-03-12 17:19:41Infrastructural Challenges: The Direction of Drilling, Pipelines, and Politics in Pennsylvania
Each state has its own definition of what it means for an oil or gas well to be “fracked.” In Pennsylvania, these wells are known as “unconventional,” a definition mostly based on the depth of the target formation:
An unconventional gas well is a well that is drilled into an unconventional formation, which is defined as a geologic shale formation below the base of the Elk Sandstone or its geologic equivalent where natural gas generally cannot be produced except by horizontal or vertical well bores stimulated by hydraulic fracturing.
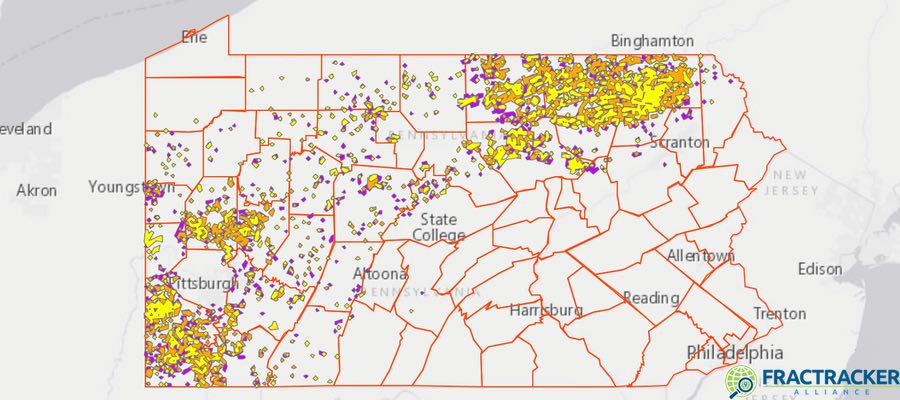
The count of these unconventional wells in PA stands at 9,760 as of June 14, 2016. Their distribution is widespread across the state, but is particularly focused in the northeast and southwest corners of Pennsylvania.
The industry is not drilling at the same torrid pace as it was between 2010 and 2012, however. The busiest month for drill rigs in the Keystone State was August 2011, with 210 unconventional wells drilled. Last month, there were just 32 such wells.
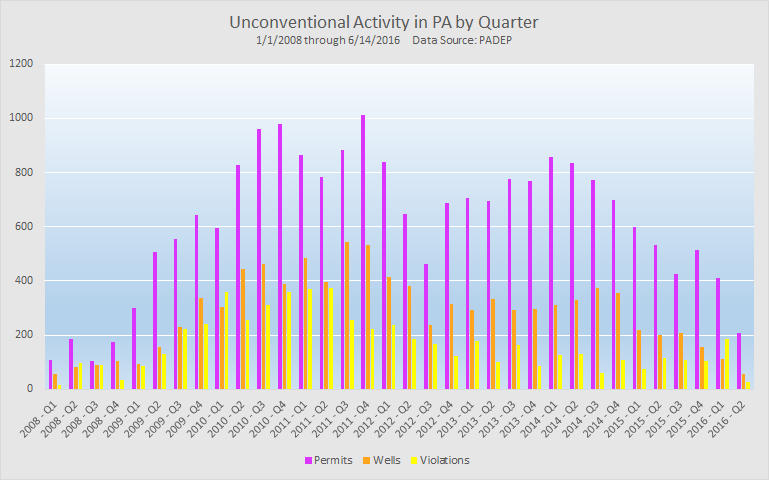
Figure 1. Unconventional oil and gas permits, wells, and violations in Pennsylvania by quarter. Data source: Pennsylvania DEP
Permits
As Figure 1 captures, the number of permits issued per quarter is always greater than the number of wells drilled during the same time period. Even when drilling activity seems to be entering a bust phase, oil and gas operators continue to plan for future development. Altogether, there are 17,492 permitted locations, meaning there are about 7,700 permitted locations where drilling has not yet commenced.
Violations
The number of violations issued by DEP is generally follows the same trends as permits and wells. It is usually the smallest of the three numbers. In the first quarter of 2016, however, is one of a few instances on the chart above where the number of violations issued outpaced wells drilled. There could be any number of reasons for this anomaly; it could have been due to to unusual compliance issued in the field or aggressive regulatory blitzes. It could also be due to some other factor that can’t be determined by the available published data source.
Interestingly, this phenomenon has not occurred since the first quarter of 2010, when the industry was in full swing.
About VpW
One of the best ways to understand the impact of the industry is to look at violations per well (VpW). Unfortunately, there are a number of important caveats to that discussion. First of all, not all items that appear on the compliance report receive their own Violation ID number. It is clear from the DEP workload report that violations are tallied internally by the number of Violation ID numbers. This is as opposed to the number of items on the compliance report. As of June 14, 2016, there were 6,706 rows of data and 5,755 distinct Violation ID numbers that were issued to 2,080 different oil and gas wells. This discrepancy means that about 21% of unconventional wells are issued violations in Pennsylvania. Those that are cited receive an average of 2.8 to 3.2 violations per well, depending on how you count them.
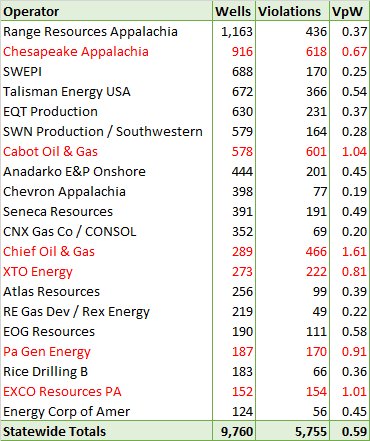
Table 1. Violations per well (VpW) of the 20 companies with the most unconventional wells in PA.
Determining the violations per well by operator comes with additional caveats. The drilled wells data comes from the spud report, which lists the current operator of each of the wells. The compliance report, however, lists the operator that was in charge of the well at the time of the infraction. This poses a problem for analysis, however. The ownership of the wells is quite fluid when taken in aggregate, as companies fold, are bought out, or change their names to something else.
VpW Results
We calculated VpW figures for the 20 operators with the largest inventory of drilled wells wells in Pennsylvania, found in Table 1. In some instances, we were able to reunite operators with violations that were issued under a different name but are in fact the same company. Specifically, we combined Rex Energy’s violations with RE Gas Dev, CONSOL violations with CNX, and Southwestern with SWN Productions, as the company is now known.
SWN’s violation-per-well score appears to be quite low. Their statistic, however, does not take into account wells that it purchased from Chesapeake in 2014, for example. In this transaction, 435 wells changed hands, with an unknown number of those in Pennsylvania. Any violations on these wells that Chesapeake had would stay with that company even as their well count was reduced. Such a change would thereby artificially inflate Chesapeake’s VpW score. On the other hand, SWN is now in possession of a number of wells which might have been problematic during the early stages of operation. Those violations, alternatively, are not associated with SWN, making their inventory of wells appear to be less problematic.
Data Caveats and Takeaways
Alas, we do not live in a world of perfect data. As such, these results must be taken with a grain of salt. Still, we can see that there are some trends that persist among operators that have been active in Pennsylvania for many years. Chief, Cabon, and EXCO, for example, all average more than one violation per well drilled. Chevron, CNX, and RE Gas Development, on the other hand, have much better rates of compliance, on the order of one violation per every five wells drilled.
https://www.fractracker.org/a5ej20sjfwe/wp-content/uploads/2016/06/PAUpdate-Feature.jpg400900Matt Kelso, BAhttps://www.fractracker.org/a5ej20sjfwe/wp-content/uploads/2025/09/2025-Wordmark-Logo.pngMatt Kelso, BA2016-06-22 10:05:472020-03-12 17:20:08Approaching 10K Unconventional Wells in PA
By Kirk Jalbert, Manager of Community Based Research & Engagement Kyle Ferrar, Western Program Coordinator
Weld County, Colorado, is one of the top producing shale oil and gas regions in the United States, boasting more than 12,000 active horizontal or directional wells, which account for 50% of all horizontal or directional wells in the state. To put this into perspective, the entire state of Pennsylvania has ten times the land area with “only” 9,663 horizontal or directional wells. At the center of Weld County is the city of Greeley, population 92,889. Greeley has experienced dramatic changes in the past decade as extraction companies compete to acquire oil and gas mineral rights. Extensive housing developments on the outskirts of the city are being built to accommodate future well pads on neighboring lots. Meanwhile, a number of massive well pads are proposed within or on the border of city limits.
FracTracker visited Colorado back in November 2015 and met with regional advocacy organizations including Coloradans Against Fracking, Protect our Loveland, Weld Air and Water, and Our Longmont to determine how we could assist with data analysis, mapping, and digital storytelling. FracTracker returned in June 2016 to explore conditions unique to Weld County’s oil and gas fields. During our visit we interviewed residents of Greeley and found that one of their greatest concerns was the dangers of siting oil and gas wells near schools. While there is much more we will be publishing in coming weeks about our visit, this article focuses on one troubling project that would bring gas drilling to within 1,300ft of a public school. The proposal goes before the Weld County Commissioners on Wednesday, June 29th for final approval. As such, we will be brief in pointing out what is at stake in siting industrial oil and gas facilities near schools in Colorado and why residents of Greeley have cause for concern.
Drilling Bella Romero
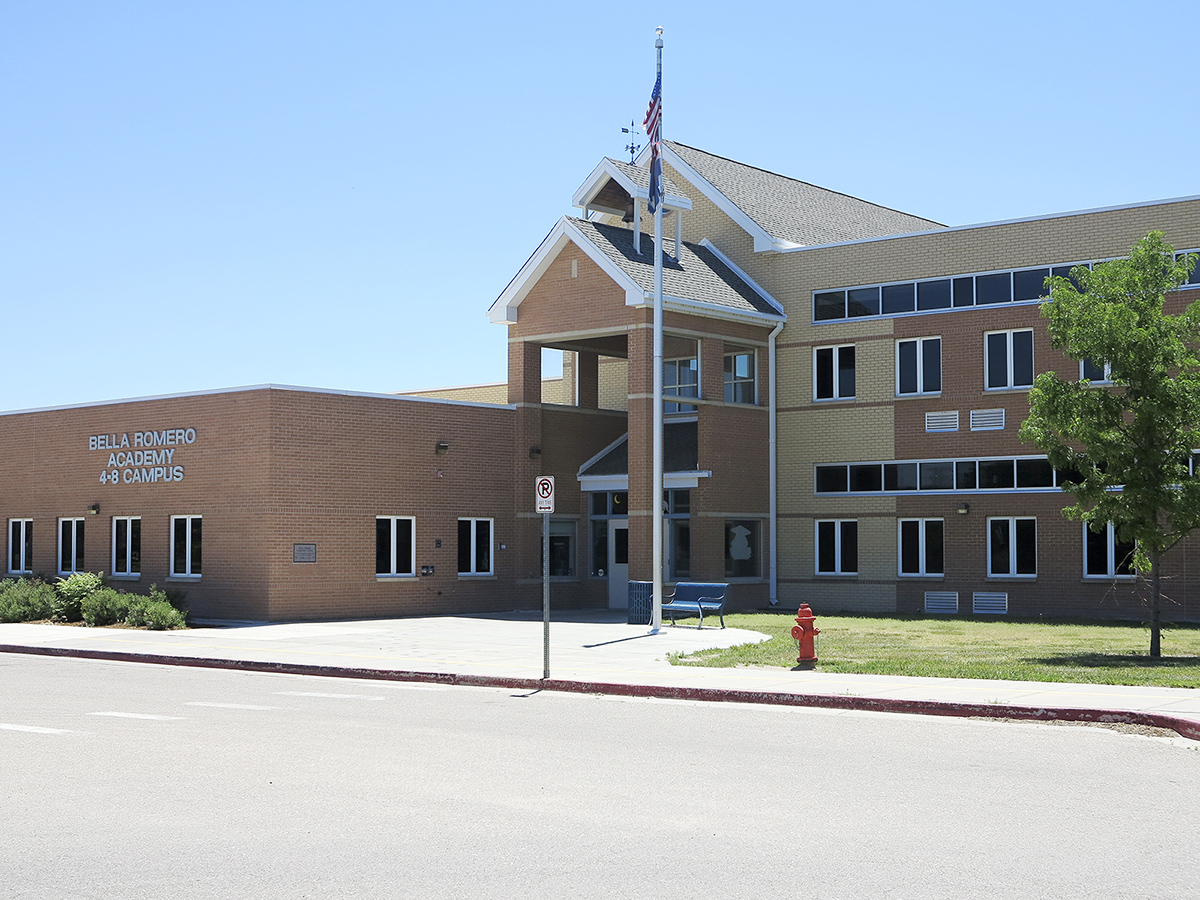
On June 7th, the Weld County Planning Commission unanimously approved a proposal from Denver-based Extraction Oil & Gas to develop “Vetting 15H”—a 24-head directional well pad in close proximity to Bella Romero Academy, a middle school just outside Greeley city limits. In addition to the 24-head well pad would be a battery of wastewater tanks, separators, and vapor recovery units on an adjacent lot. The permit submitted to the Colorado Oil & Gas Conservation Commission (COGCC) also states that six more wells may be drilled on the site in the future.
As was detailed in a recent FracTracker article, Colorado regulations require a minimum setback distance of 500ft from buildings and an additional 350ft from outdoor recreational areas. In more populated areas, or where a well pad would be within 1,000ft of high occupancy buildings, schools, and hospitals, drilling companies must apply for special variances to minimize community impacts. Setbacks are measured from the well head to the nearest wall of the building. For well pads with multiple heads, each well must comply with the respective setback requirements.
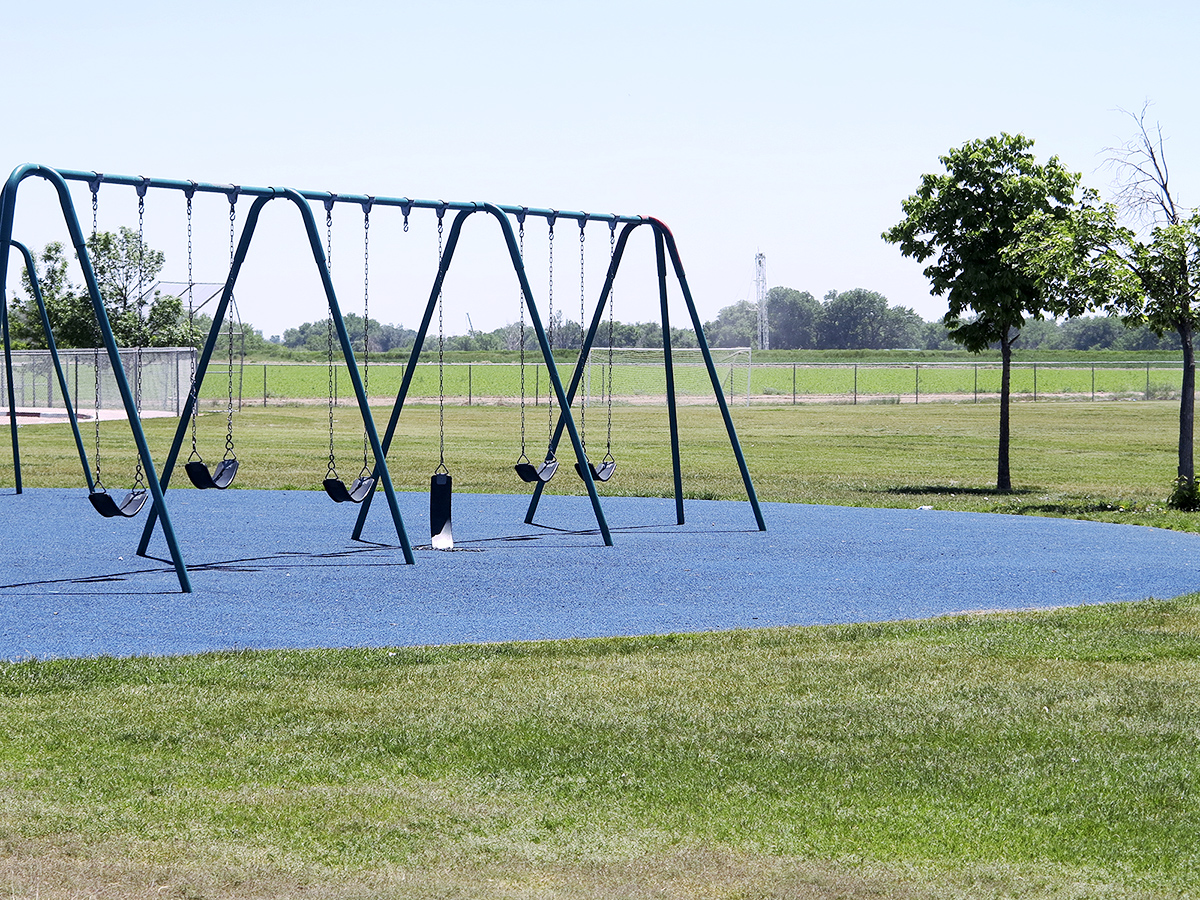
Bella Romero’s playground with Vetting 15H’s proposed site just beyond the fence.
Vetting 15H would prove to be one of the larger well pads in the county. And while its well heads remain just beyond the 1,000ft setback requirement from Bella Romero buildings, a significant portion of the school’s ballfields are within 1,000ft of the proposed site. When setbacks for the well pad and the processing facility are taken together—something not explicitly demonstrated in the permit—almost the entirety of school grounds are within 1,000ft and the school itself lies only 1,300ft from the pad. The below figures show the images supplied by Extraction Oil & Gas in their permit as well as a more detailed graphic generated by FracTracker.
Youth: A High Risk Population
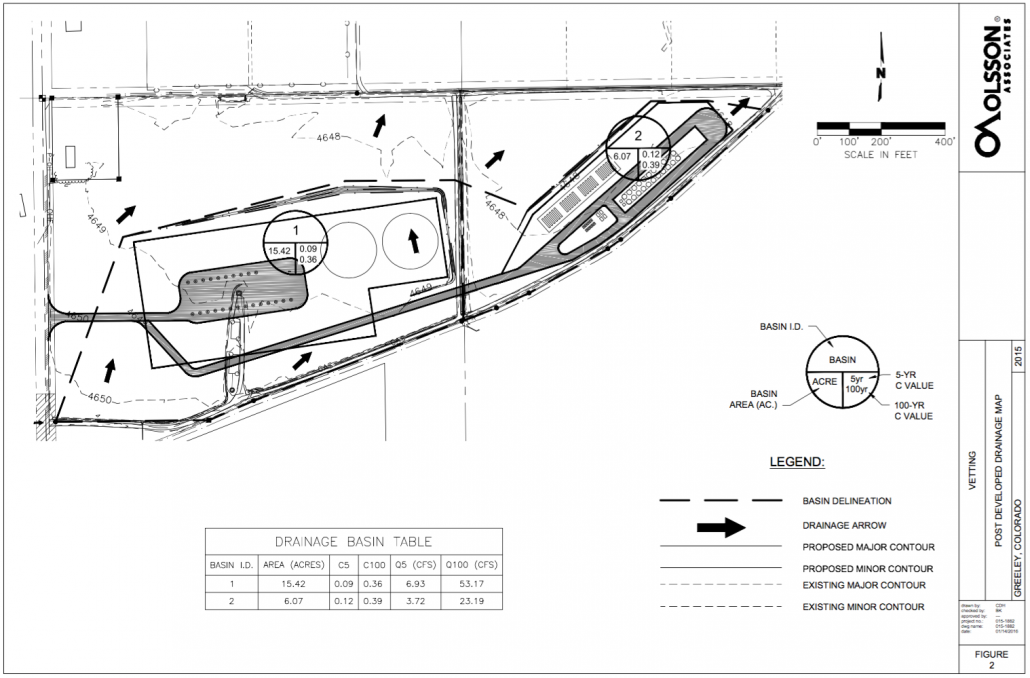
The difference between 1,000ft and 1,300ft may be negligible when considering the risks of locating industrial scale oil and gas facilities near populated areas. The COGCC has issued 1,262 regulatory violations to drilling companies since 2010 (Extraction Oil & Gas ranks 51st of 305 operators in the state for number of violations). Some of these violations are for minor infractions such as failing to file proper paperwork. Others are for major incidents; these issues most often occur during the construction phases of drilling, where a number have resulted in explosions and emergency evacuations. Toxic releases of air and water pollution are not uncommon at these sites. In fact, the permit shows drainage and potential spills from the site would flow directly towards Bella Romero school grounds as is shown in the figure below.
Vetting 15H post-development drainage map.
A host of recent research suggests that people in close proximity to oil and gas wells experience disproportionate health impacts. Emissions from diesel engine exhaust contribute to excessive levels of particular matter, and fumes from separators generate high levels of volatile organic compounds. These pollutants decrease lung capacity and increase the likelihood of asthma attacks, cardiovascular disease, and cancer (read more on that issue here). Exposure to oil and gas facilities is also linked to skin rashes and nose bleeds.
As we’ve mentioned in our analysis of oil and gas drilling near schools in California, children are more vulnerable to these pollutants. The same amount of contaminants entering a child’s body, as opposed to an adult body, can be far more toxic due to differences in body size and respiratory rates. A child’s developing endocrine system and neural pathways are also more susceptible to chemical interactions. These risks are increased by children’s lifestyles, as they tend to spend more hours playing outdoors than adults and, when at school, the rest of their day is spent at a central location.
At the June 7th public hearing Extraction Oil & Gas noted that they intend to use pipelines instead of trucks to transport water and gas to and from Vetting 15H to reduce possible exposures. But, as residents of Greeley noted of other projects where similar promises were made and later rescinded, this is dependent on additional approvals for pipelines. Extraction Oil & Gas also said they would use electric drilling techniques rather than diesel engines, but this would not eliminate the need for an estimated 22,000 trucking runs over 520 days of construction.
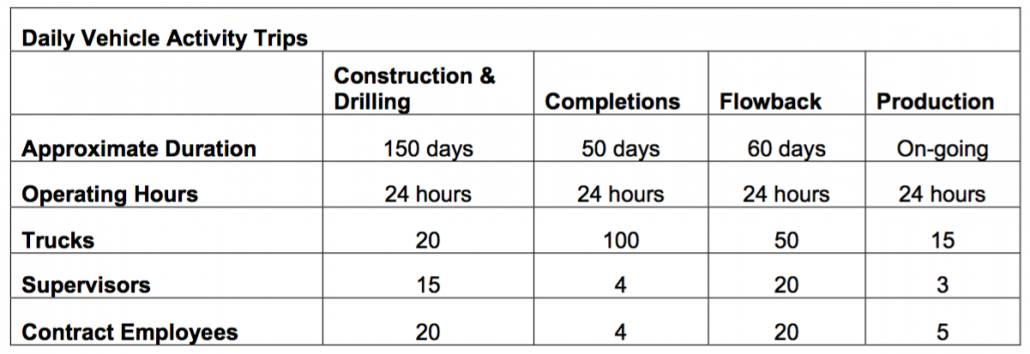
Below is a table from the Vetting 15H permit that shows daily anticipated truck traffic associated with each phase of drilling. The estimated duration and operational hours of each activity are based on only 12 wells since construction is planned in two phases of 12 wells at a time. These numbers do not account for the trucking of water for completions activities, however. The figures could be much higher if pipelines are not approved, as well as if long-term trucking activities needed to maintain the site are included in the estimates.
Vetting 15H daily vehicle estimates from permit
At the Top of the Most Vulnerable List
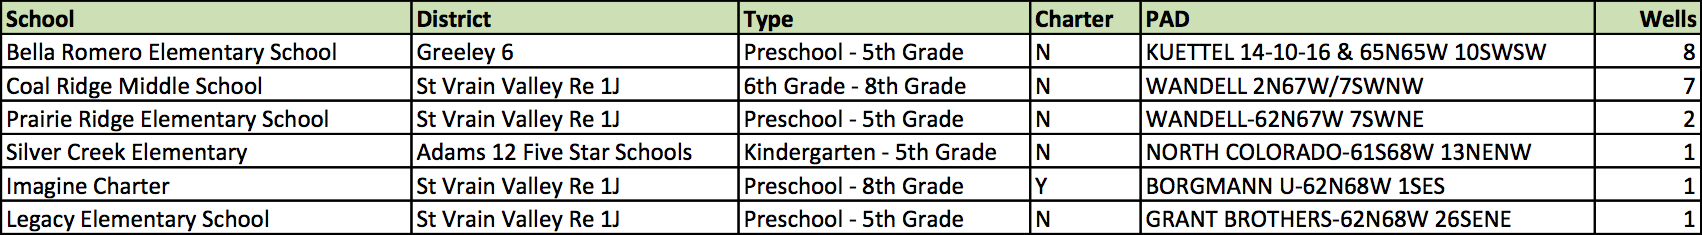
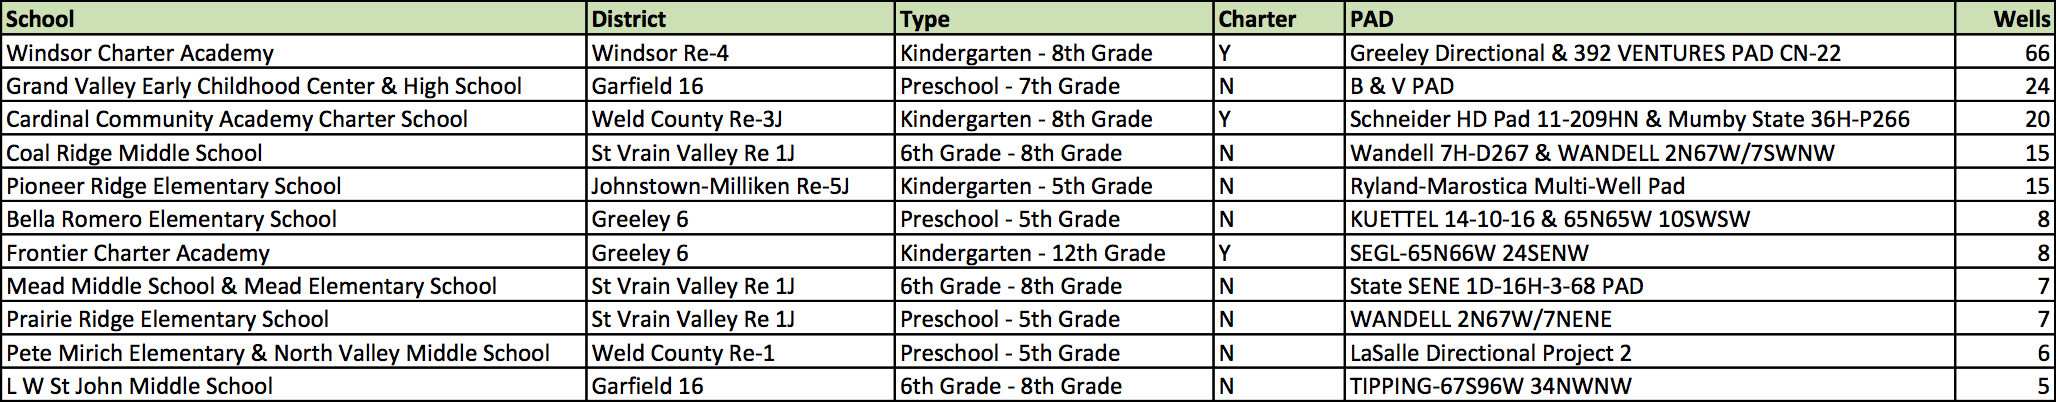
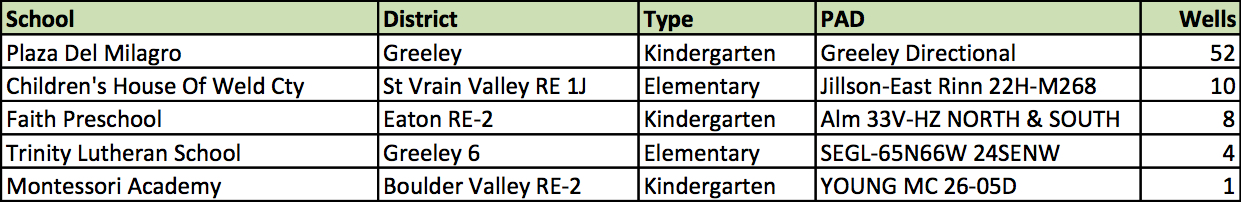
Bella Romero Academy has the unfortunate distinction of being one of the few schools in Colorado in close proximity to a horizontal or directional well amongst 1,750 public and 90 private schools in the state. Based on our analysis, there are six public schools within 1,000ft of a horizontal or directional well. At 2,500ft we found 39 public schools and five private schools. Bella Romero is presently at the top of the list of all schools when ranked by number of well heads located within a 1,000ft buffer. An 8-head well pad is only 800ft across the street from its front door. If the Vetting 15H 24-head well pad was to be constructed, Bella Romero would be far and above the most vulnerable school within 1,000ft of a well. It would also rank 3rd in the state for well heads located within 2,500ft of a school. The tables below summarize our findings of this proximity analysis.
Colorado public schools within 1,000ft of a horizontal or directional well
Colorado public schools within 2,500ft of a horizontal or directional well with 5 or more well heads. There are 39 schools in total
Colorado private schools within 2,500ft of a horizontal or directional well
The following interactive map shows which schools in Colorado are within a range of 2,500ft from a directional and horizontal well. Additional buffer rings show 1,000ft and 500ft buffers for comparison. 1,000ft was selected as this is the minimum distance required by Colorado regulations from densely populated areas and schools without requiring special variances. Environmental advocacy groups are presently working to change this number to 2,500ft. The map is zoomed in to show the area around Bella Romero. Zoom out see additional schools and click on features to see more details. [NOTE: The Colorado school dataset lists Bella Romero Academy as an elementary/middle school. Bella Romero was recently split, with the elementary school moving a few blocks west.]
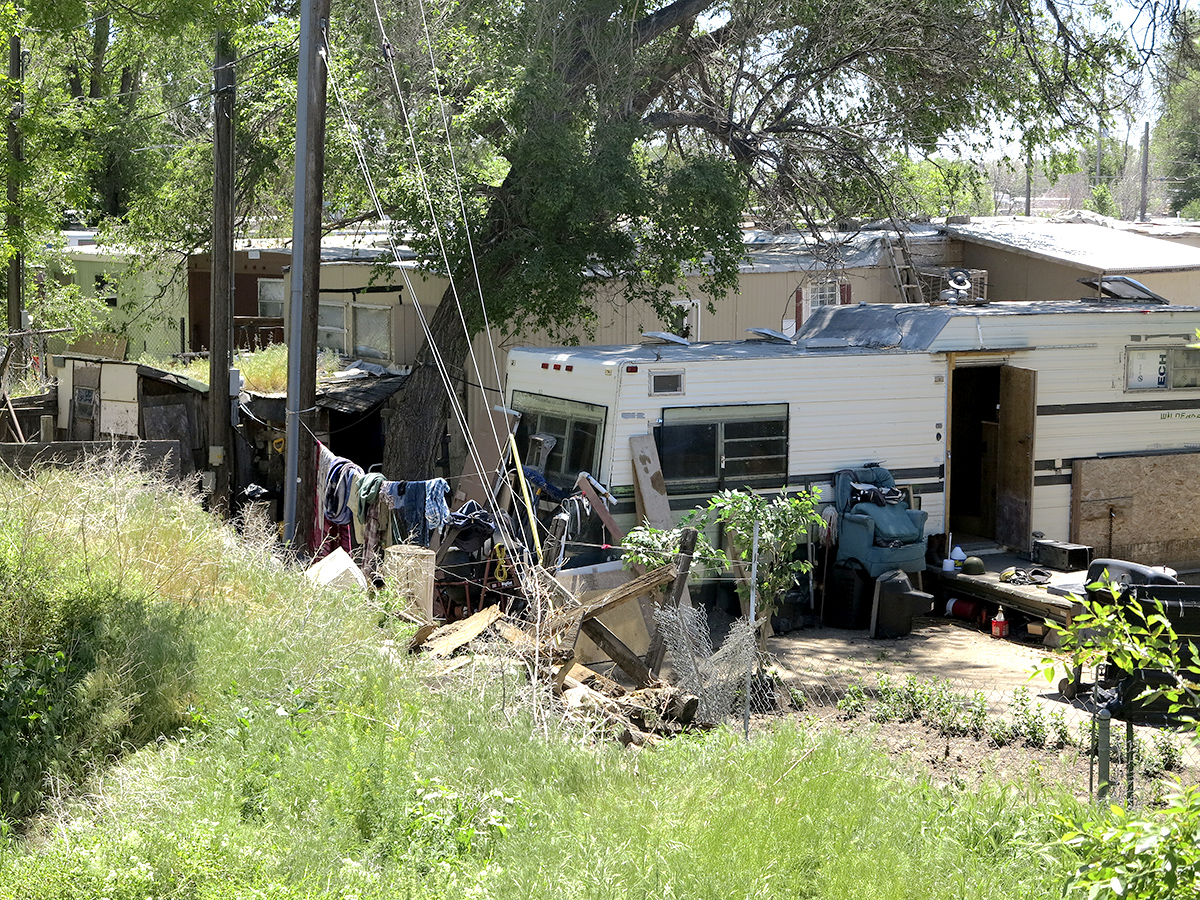
Drilling near Bella Romero is also arguably an environmental justice issue, as its student population has some of the highest minority rates in the county and are amongst the poorest. According to coloradoschoolgrades.com, Bella Romero is 89% Hispanic or Latino and 3% African American whereas, according to the U.S. Census Bureau, Greeley as a whole is 59% White and 36% Hispanic or Latino. 92% of Bella Romero’s students are also from low income families. Furthermore, according to the EPA’s Environmental Justice Screening Tool, which is used by the agency to assess high risk populations and environments, the community surrounding Bella Romero is within the 90-95% percentile range nationally for linguistically isolated communities.
Many of Bella Romero’s students come from low-income communities surrounding Greeley.
Implications
These statistics are significant for a number of reasons. Firstly, oil and gas permitting in Colorado only requires operators to notify residents immediately surrounding proposed well pads. This rule does not include residents who may live further from the site but send their students to schools like Bella Romero. Parents who might comment on the project would need to hear about it from local papers or neighbors, but language barriers can prevent this from occurring. Another factor we witnessed in our June visit to Latino communities in Weld County is that many students have undocumented family members who are hesitant to speak out in public, leaving them with no voice to question risks to their children.
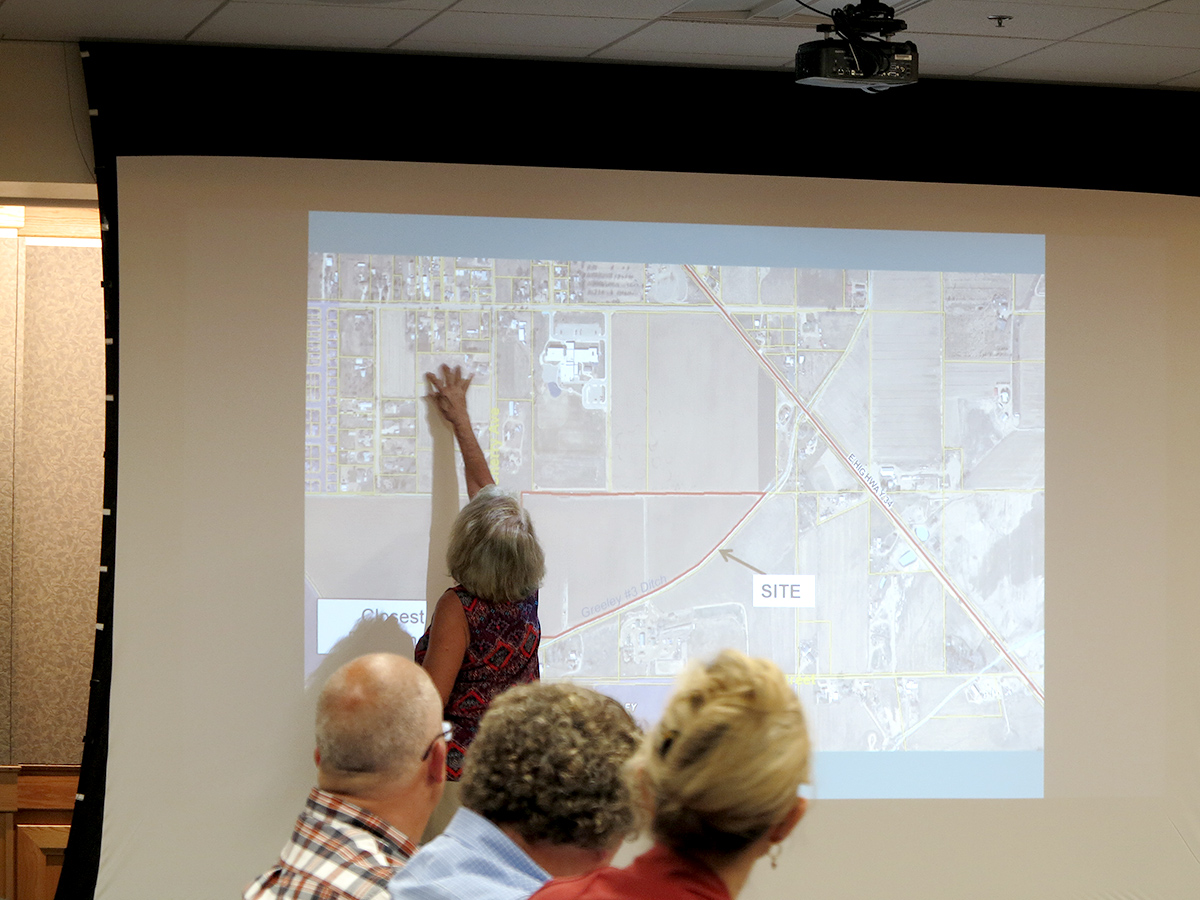
Residents of Greeley speak out at the June 7th Planning Commission meeting
Nevertheless, at the June 7th Planning Commission hearing, Weld County administrators insisted that their decisions would not take race and poverty into consideration, which is a blatant disregard for EPA guidelines in siting industrial development in poor minority communities. Weld County’s Planning Commission claimed that their ruling on the site would be the same regardless of the school’s demographics. By comparison, another proposed Extraction Oil & Gas site that would have brought a 22-head well pad to within 1,000ft of homes in a more well off part of town was denied on a 0-6 vote by the City of Greeley’s Planning Commission earlier this year after nearby residents voiced concerns about the potential impacts. Extraction Oil & Gas appealed the ruling and Greeley City Council passed the proposal in a 5-2 vote pending additional urban mitigation area permit approval. While the Greeley Planning Commission and the Weld County Planning Commission are distinct entities, the contrast of these two decisions should emphasize concerns about fair treatment.
Conclusion
There are very real health concerns associated with siting oil and gas wells near schools. When evaluating this project, county administrators should assess not only the immediate impacts of constructing the well pad but also the long-term effects of allowing an industrial facility to operate so close to a sensitive youth population. There are obvious environmental justice issues at stake, as well. Public institutions have a responsibility to protect marginalized communities such as those who send their children to Bella Romero. Finally, approving the Vetting 15H project would place Bella Romero far at the top of the list for schools in Colorado within 1,000ft of oil and gas wells. School board administrators should be concerned about this activity, as it will undoubtedly put their students’ health and academic performance at risk. We hope that, when the County Commissions review the proposal, these concerns will be taken into account.
https://www.fractracker.org/a5ej20sjfwe/wp-content/uploads/2016/06/BellaRomeroSchool-Feature.jpg400900FracTracker Alliancehttps://www.fractracker.org/a5ej20sjfwe/wp-content/uploads/2025/09/2025-Wordmark-Logo.pngFracTracker Alliance2016-06-21 13:09:522020-03-11 17:05:19Drilling Bella Romero: Children at Risk in Greeley, Colorado
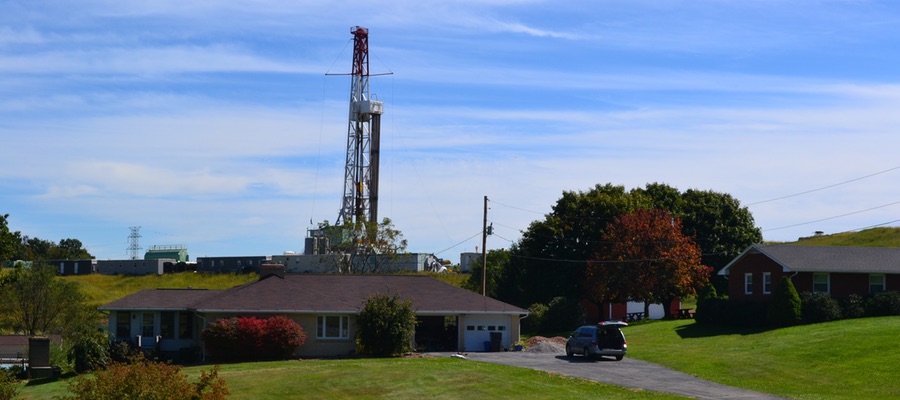
By Danny Kallich, Southwest Pennsylvania Environmental Health Project
This article examines whether emergency responders are prepared in rural areas for oil and gas drilling emergencies, how people may be put at risk if the proper procedures aren’t in place, and other critical safety questions that citizens in Southwest Pennsylvania should be asking.
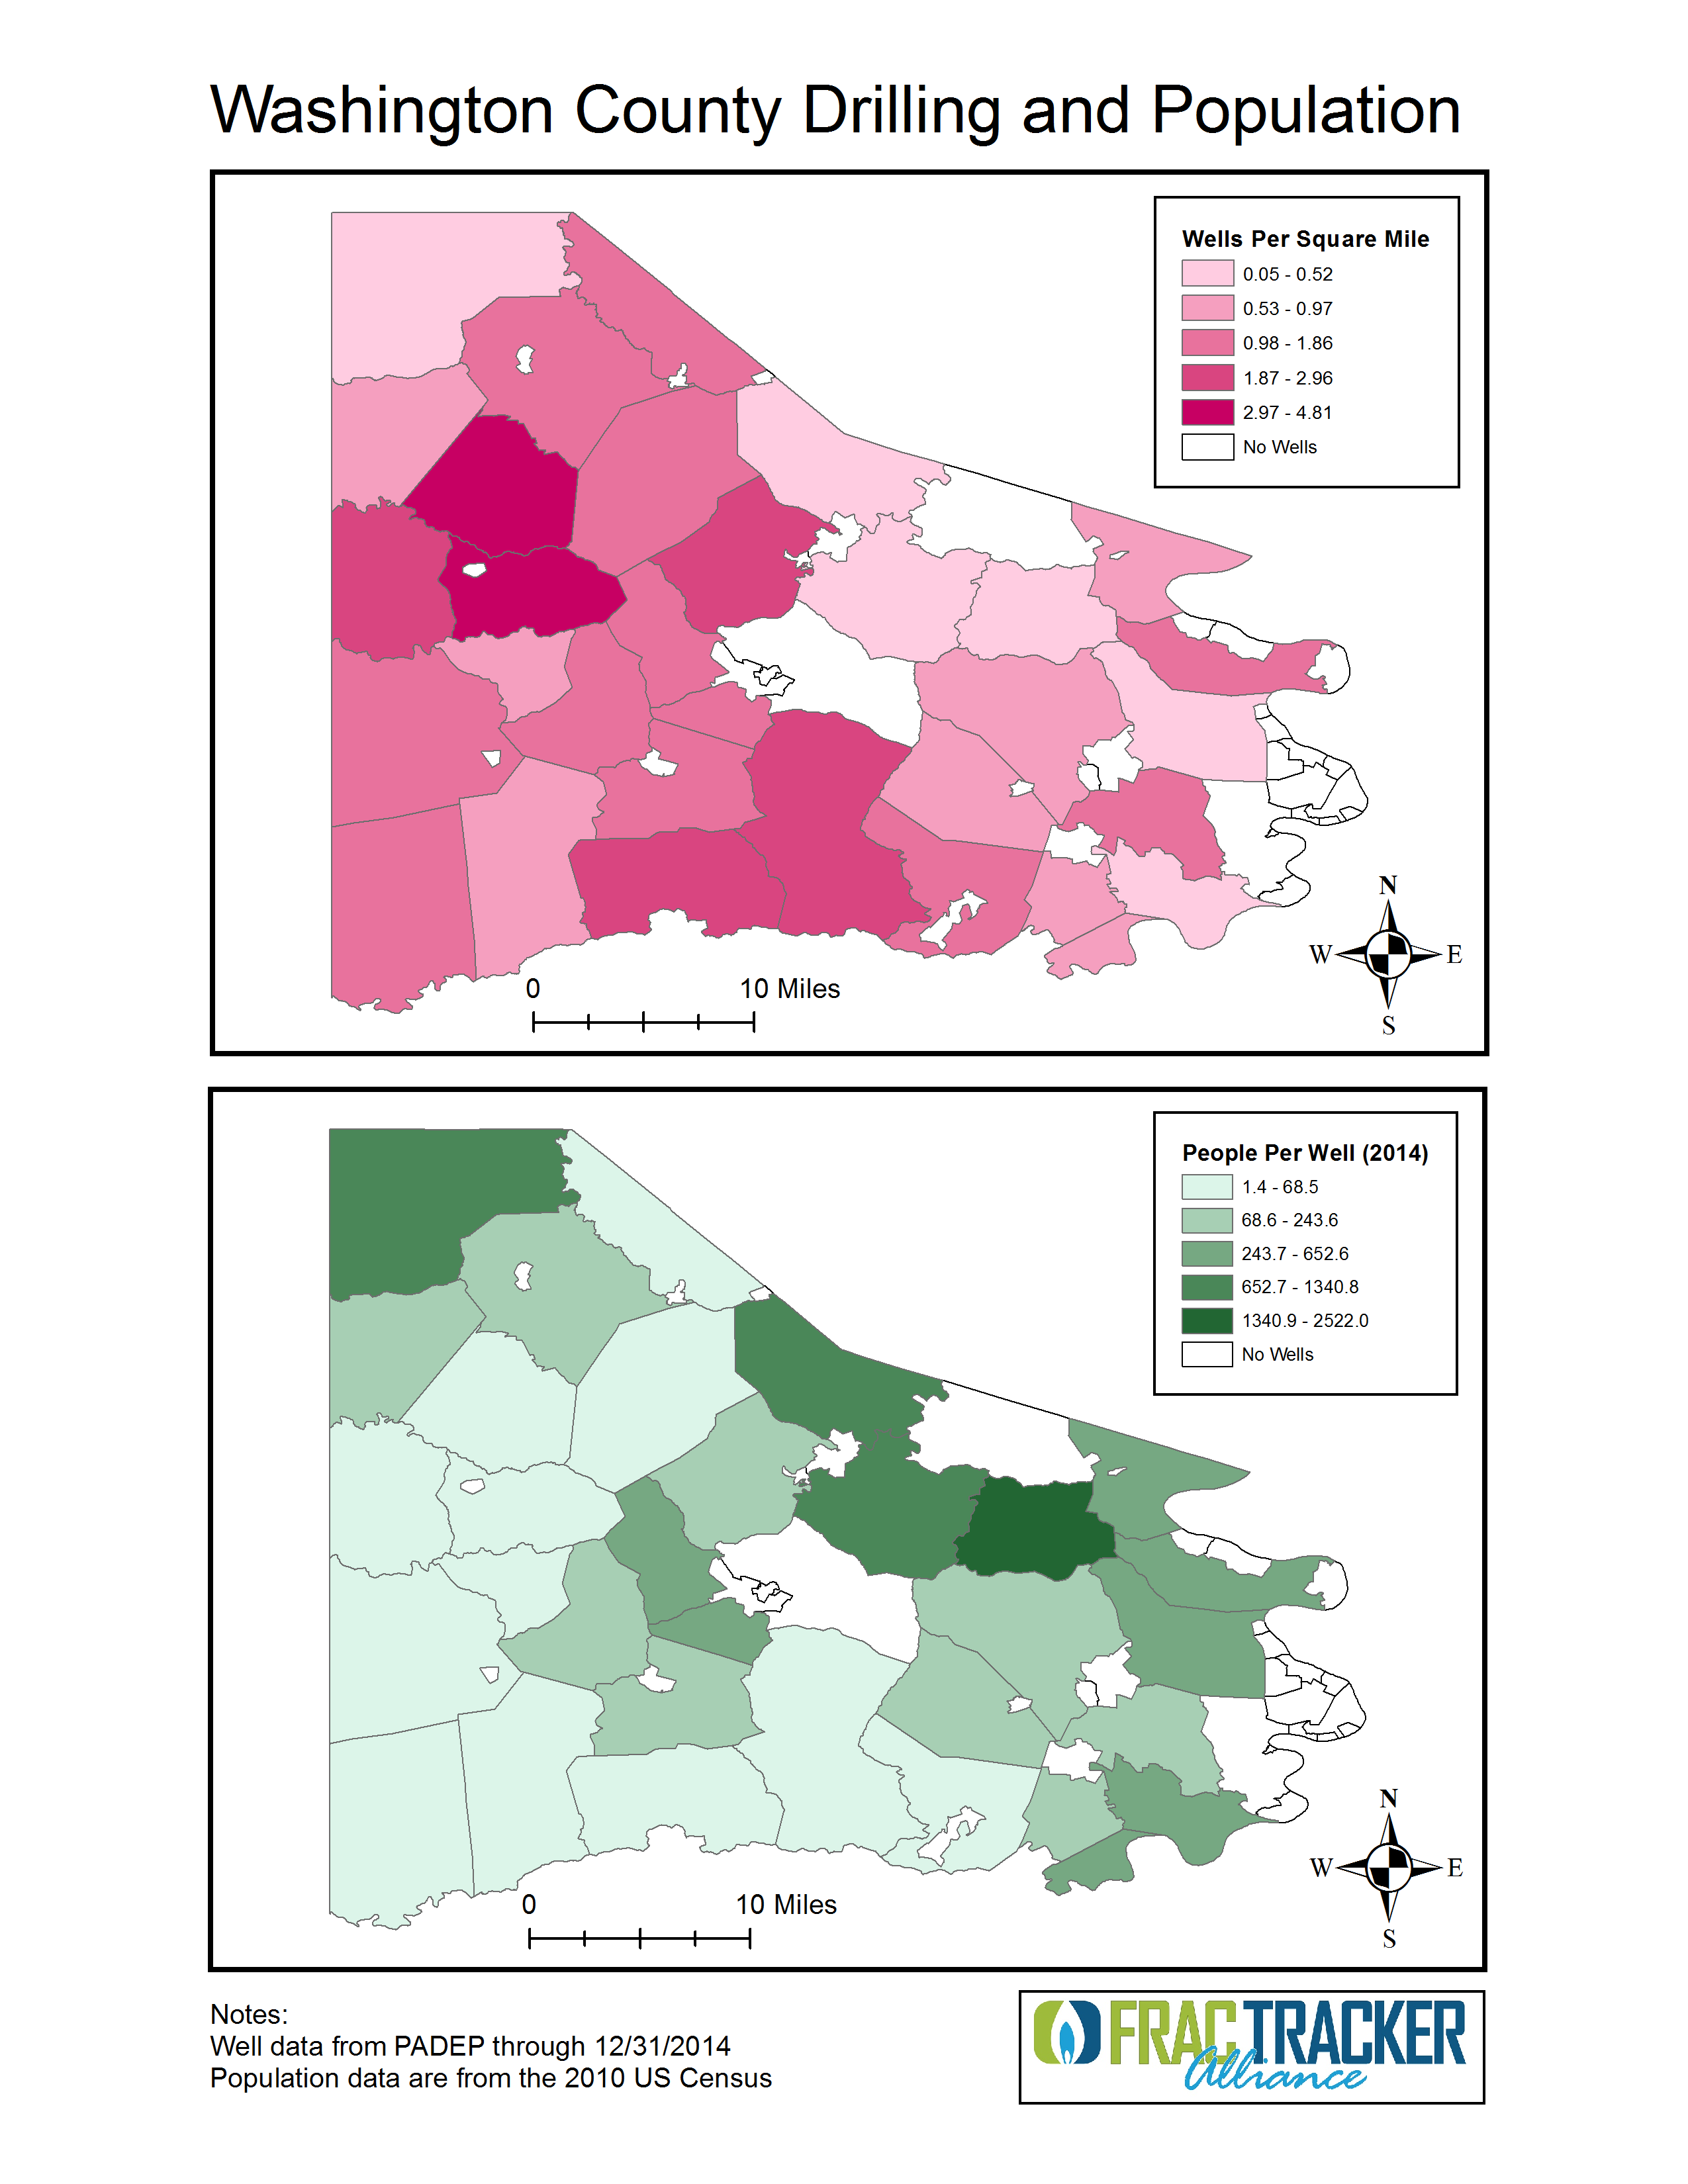
Maps of wells per sq. mile and people per well in Washington County, PA
The rapid spread of unconventional natural gas development (UNGD) across Pennsylvania has highlighted the need for state, county, and municipal agencies to regulate industry activity and protect the public on several fronts. In particular, comprehensive emergency preparedness and response specific to natural gas development is an obvious necessity for residents living within close proximity of wells, compressor stations, and other stages of UNGD.
While experts in the field of emergency planning are rightfully responsible for creating and executing emergency plans, the Federal Emergency Planning and Community Right to Know Act of 1986 (EPCRA) defines citizens’ rights to engage in the process, both through open records requests and public meetings with local emergency planners. EPCRA establishes roles and requirements for emergency planners while clarifying the rights of citizens to engage in dialogue with those responsible for safety about potentially harmful industrial activity in their community.
Unique Emergency Preparedness Challenges
UNGD presents a unique set of challenges for residents and emergency planners. The high likelihood that UNGD will be located in a rural area not typically supporting industrial use argues for the need for special treatment by emergency planners. Furthermore, responding to a UNGD emergency requires specialized training that is not mandated for local first responders, often volunteer fire fighters. While local first responders cannot be expected to specialize in UNGD related emergencies, it takes many hours for the contracted well-fire specialists, Texas-based Wild Well Control, to arrive and mitigate an emergency situation. The interim period between the arrival of local and county first responders and the arrival of Wild Well Control is, nonetheless, a critical time during which a system for consistent updates to nearby residents should be a priority. An emergency situation, as demonstrated by the February 11, 2014 Chevron Appalachia well fire, discussed below, can affect a community in a variety of ways, even if evacuation is not necessary.
Chevron Appalachia Incident, Greene County, PA
Testing The System:
Using Right-To-Know requests to gauge transparency & citizen awareness
The opportunities for citizen comment and engagement with emergency planners are limited and not well publicized. The dearth of clear and consistent means of communication between residents and those responsible for emergency planning provides a noteworthy opportunity to test the provisions of EPCRA as they relate to UNGD.
In this regard, testing the emergency response system related to oil and gas drilling emergencies is intended to analyze existent emergency plans, municipal preparedness, communication between county, municipal, and industry emergency planners, and perhaps most importantly, how much of this information is available to citizens.
The transparency of the system was tested by filing Right-To-Know requests. These public information requests were filed with nine municipalities in various counties across the state of Pennsylvania. All filed requests specifically asked for “all available county, municipal, and company generated emergency plans” in relation to specific well sites. One request asked for emergency plans generated by an elementary school in relation to a well site within approximately a half-mile.
Of these nine requests, three were fulfilled with returned emergency plans. Of the remaining six requests, five were not fulfilled because no emergency plan existed on record in the municipality. Initially, the request for the elementary school emergency plan was unable to be met by the municipal open records officer because no plan existed. Two months after that request, an unsolicited response from the same individual was received stating that the now-existent plan could not be shared because of security issues. A final question posed to the open records officer asked what concerned parents might be able to do to prepare themselves for emergency situations. This question, too, was deemed unanswerable due to security reasons. Another unmet municipal request was redirected to a county emergency planner who stated that the company generated plan was not theirs to distribute. Of the three emergency plans received, only one made any specific mention of residents living within close proximity; this response merely stated the number of nearby houses. Excluding GPS coordinates, no plan addressed any other infrastructure specific to the surrounding area, indicating a broad generality to their application.
The fact that six out of nine queried communities in PA were unable or unwilling to provide emergency response plans is highly concerning. These findings, when considered in the broader national context, indicate a significant chance that UNGD specific emergency planning and necessary communication with the public is deficient, particularly on the municipal level.
What Communities Need
Lack of specificity, inter-agency communication, and transparency indicate that the potential of EPCRA to benefit citizens has been largely untapped during the Marcellus Shale boom relative to emergency planning. Residents living within close proximity to UNGD should not only be apprised of emergency risk and strategy before an emergency arises, they should have a clearly accessible venue through which to voice concerns, needs, and recommendations. Furthermore, residents have valid reason to demand greater public oversight of current emergency planning efforts when the overwhelming majority of publicly available emergency plans fail to provide any information useful to a layperson.
Currently, there are communities in which the questionable practice of locating UNGD within a half-mile of elementary schools and other sensitive areas continues. In such areas, every effort must be made to develop, institute, and practice emergency plans prioritizing the concerns, safety, and coordination of local residents. Recommendations for improved transparency include:
Make publicly available site-specific plans,
Hold regular public meetings, and
Prioritize communication between emergency responders and residents during emergency events
We encourage residents who are concerned about what their community is doing for UNGD-specific emergency planning to contact their local emergency responders and attend Local Emergency Planning Committee meetings in their county to advocate for such measures.
About EHP
The Southwest Pennsylvania Environmental Health Project (EHP) is a nonprofit environmental health organization created to assist and support Washington County residents who believe their health has been, or could be, impacted by natural gas drilling activities. Their Mission is to respond to individuals’ and communities’ need for access to accurate, timely and trusted public health information and health services associated with natural gas extraction.
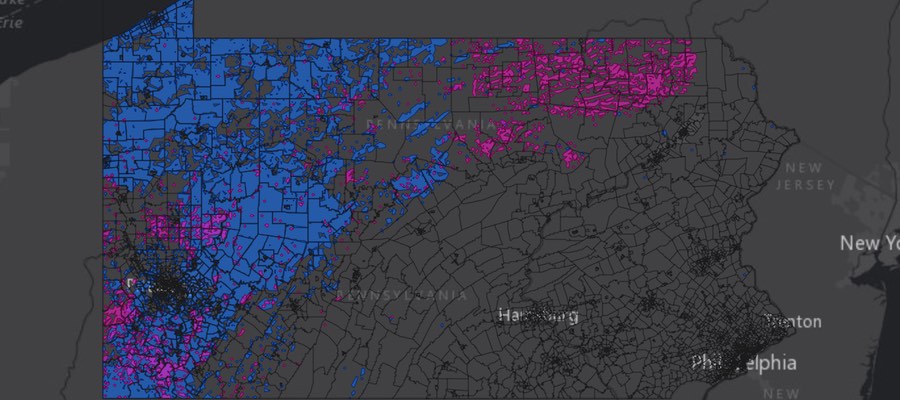
In October 2014, the FracTracker Alliance performed an analysis showing an estimated 1.2 million people lived within a half mile of oil and gas wells in Pennsylvania. We have now updated the analysis, but this time, the unit of measure is one kilometer (0.62 miles).
PA Population Within 1km of Active Oil and Gas Wells
This map shows the estimated population within one kilometer of active oil and gas wells in PA – a total of nearly 2 million Pennsylvanians. To access the full set of tools and details about how the map was made, click here for the full screen version of the map.
Methods
To get as complete a picture as possible of the oil and gas industry in PA, we queried the spud date report to show all wells that were listed as being spudded between January 1, 1800 and November 12, 2015. We used the former date because it appears to be a default for unknown spud dates, and the latter being the date that the data were downloaded for the analysis. Altogether, this yielded 203,887 oil and gas wells throughout the state, but 74,900 (37%) of these lacked location coordinates. All of those missing latitude and longitude data were classified as conventional wells, and many of them were fairly old. We then filtered out wells that were reported as not being drilled, as well as those that were permanently plugged, either by the operator, or by the PA Department of Environmental Protection (PADEP). The resulting set, which we refer to as “active” oil and gas wells, included 106,970 wells, of which 9,042 (8%) are defined as unconventional wells by the state.
To obtain an estimated population, we used the Census Tract level of detail, using official 2010 population figures. We calculated the area within 1 kilometer of active wells in three categories – conventional, unconventional, and all oil and gas wells. The population was then estimated by comparing the area inside the 1 km zone to the entire Census Tract, multiplying that ratio to the population of that tract, and repeating the process for each of the three datasets.
This area calculation was performed in Albers Equal Area projection optimized for the Great Lakes Basin area. Every method of flattening an area of a globe on the map will lead to some type of distortion, but this projection prioritizes area over other factors, and is therefore appropriate for this type of analysis.
Results
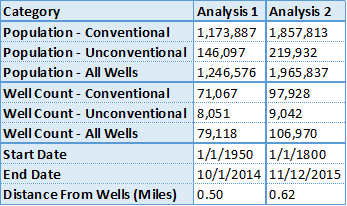
An additional year of drilling activity, a more comprehensive date range, and the slight increase of the radius distance has had a significant effect on the estimated population near wells. The 2014 analysis yielded an estimated 1,264,576 within a half-mile of wells, while the current analysis has the figure at 1,965,837, an increase of 55%. Below is a table showing differences between the two analyses:
This chart shows summaries of the current analysis of population within 1 km of wells in PA and an October 2014 version, showing population within a half-mile of wells.
One thing you will notice in this figure is that simply adding up the number of people who live in areas near unconventional and conventional drilling will not get you to the 1,965,837 figure we’ve presented. This is because some people live within the specified distance of both types of wells.
Additionally, it is impossible to say how many people live near the oil and gas wells that lack location data, as we obviously can’t map these wells. The majority of these wells may be in the areas that are already represented in the buffer zones, or they may extend that distance significantly.
https://www.fractracker.org/a5ej20sjfwe/wp-content/uploads/2015/11/PA-KM-Feature.jpg400900Matt Kelso, BAhttps://www.fractracker.org/a5ej20sjfwe/wp-content/uploads/2025/09/2025-Wordmark-Logo.pngMatt Kelso, BA2015-11-23 11:26:282020-03-12 17:37:22Nearly 2 Million Pennsylvanians Live Within a Kilometer of Oil & Gas Wells


