Pennsylvania’s Drake Well is known for sparking the first oil boom in the United States in 1859. In more recent history, the industry has resurrected hydrocarbon extraction in the Commonwealth through unconventional oil and gas drilling – or fracking. Between 2002 and October 28, 2015, at least 16,826 of these high-impact wells have been approved statewide, and 9,508 drilled.
While standard maps can be useful to show the reach of the industry in aggregate, they aren’t the best way to show how drilling activity has changed over time. Luckily, we have other tools in the toolbox to show the trend. See drilling by year in this time sequence map below.
PA Unconventional Drilling Time Sequence Map
This representation starts slowly, just as the industry did in the state. Activity begins to pick up around 2008. In later years, watch exploration expand throughout the Marcellus and Utica shale plays. Eventually the activity concentrates in the northeastern and southwestern portions in the state.
https://www.fractracker.org/a5ej20sjfwe/wp-content/uploads/2015/11/PAViewer-Feature.jpg400900Matt Kelso, BAhttps://www.fractracker.org/a5ej20sjfwe/wp-content/uploads/2025/09/2025-Wordmark-Logo.pngMatt Kelso, BA2015-11-05 17:03:292020-03-12 17:37:38Time Sequence Map of PA Drilling Available
By Ted Auch, Kyle Ferrar, and Samantha Rubright with Max Gruenig
Fourteen days is not nearly enough time to fully understand the complex differences between oil and gas drilling issues and policies in the United States and several European Union countries. The EU’s drilling policies, geography, and the industry’s level of activity are quite distinct from those of the States in some cases. Still, as part of the Our Energy Solutions project, four staff from FracTracker Alliance and Ecologic Institute attempted to understand and share as many lessons-learned in Europe as we could in the first two weeks of September. Our interest covered all aspects of oil and gas development, but focused on those relating to the use of stimulation techniques (hydraulic fracturing – fracking) in unconventional reservoirs. Even with significant differences between the US and EU, there is still much to be gleaned in sharing our regulatory approaches, community concerns, and environmental challenges.
“Chaos is merely order waiting to be deciphered” ― José Saramago, The Double
London, England Meetings
The House of Commons meeting was held in Parliament, just below London’s Big Ben. Photo by Sam Rubright
Our European tour started in London with Ecologic Institute’s Max Gruenig. The first stop was a meeting with University of Salford Professor of Regeneration and Sustainable Development Erik Bichard outside of The Palace of Westminster. Erik has worked extensively to understand and chronicle common threads that weave together community response(s) to hydraulic fracturing (fracking) proposals. Much of Erik’s research in the UK has focused on the efforts of the leading shale gas extraction company in the EU, Cuadrilla Resources, to employ hydraulic fracturing technologies, as well as local oppositions to this development. The major points of contention are in Lancashire County, Northwest England and Balcombe in West Sussex. Erik pointed to the fact that Cuadrilla admitted their claims that the 4% decline in UK energy cost was a result of Lancashire oil and gas exploitation were significantly overstated. Such manipulative statements appear to be cut directly from North American energy’s playbook.
House of Commons meeting, London. Photo by Sam Rubright
We then attended a spirited Fracking with Nature Meeting at The House of Commons hosted by 21st Century Network and convened by MP Cat Smith (photo right). Many, if not all, of the attendees were concerned about the negative impacts of fracking and oil and gas development in general, but perhaps the event’s purpose self-selected for those attendees. We found the conversations to be very advanced considering that the UK has not seen nearly the same level of oil and gas activity as the US. Most questions centered on the potential for fracking to negatively impact ground water, followed by the induction of earthquakes. Air quality was not discussed as often, despite the serious risks that oil and gas air pollutants pose to health, and the frequency and severity of ambient degradation reported in the US. With the UK’s move to cut subsidies for renewables and a push toward fracking, these concerns may soon become a reality.
We later met with one of the speakers at the House of Commons meeting, Damien Short LLB, MA, PhD, Director of the University of London’s Human Rights Consortium[1] and the Extreme Energy Initiative.[2] NGO’s, we learned, are on the forefront of the issue, debating the need to prioritize community health over corporate profits. They have had quite a lot of success on this front, despite Tory projections.[3] The past state of UK politics under the direction of PM David Cameron, was supportive of extractive industries and corporate interests, blocking any attempt to introduce regulations. Even with the defeat of David Cameron’s administration, new “fast-tracking” rules to accelerate permits for fracking passed in August.[4] The overwhelming victory of democratic socialist Jeremy Corbyn as the leader of the opposition Labour Party – means that the tenure of the current fracking moratoria in North Yorkshire, as well as in Scotland, Wales, and Northern Ireland[5] could be brief.
Our time in London was filled with several other meetings, including one with Greenpeace UK’s new fracking coordinator, Hannah Martin. During our meeting she indicated that while Greenpeace was sympathetic to the views and tactics of Mr. Corbyn, they were concerned that his election would further divide Labour. In her opinion this change could allow the oil and gas sympathetic – and united – Tories to expedite their vision for fracking in the UK.
Regardless of the similarities between community concerns and industry tactics, however, one difference between the UK and US was crystal clear; no matter their view on the use of fracking, Brits support a substantial Petroleum Revenue Tax (PRT) rate to the tune of 50-60%. The PRT will fall to 35% in January, 2016, however. This latter figure is a sizeable decrease but would still be 40% higher than the average in the US. California for example, the fourth largest producing state, does not and has never levied a severance tax.[6] Unfortunately, the UK is seeing similar conflict of interest issues and deliberate attempts to de-democratize the rule-making around fracking, as demonstrated in a recent move to prevent a proper parliamentary debate about drilling under protected areas in the UK.
Brussels, Belgium Workshop and Meeting
Geert, Max, Kyle, and Ted after our meeting with the European Commission in Brussels. Photo by Sam Rubright
The next phase of OES Europe took us to Brussels to host a community workshop and meet with members of the European Commission’s Directorate-General for Environment. Both events brought to light many concerns and questions about drilling’s safety.
The European Commission is currently drafting a best available techniques reference document (BREF) regarding hydrocarbon extraction for the European Union to consider in December 2015. The recommendations will build upon the “Minimum Principles,” published in January, 2014.[7] Representatives from the European Commission asked us about a variety of concerns that have arisen from drilling in the US, and how Europe might have similar or different experiences. The Commission was most interested in environmental health risks and research focused on exposure to air pollutants, as well as other degraded environmental media (drinking water, soil, etc.). We also shared figures about water consumption, land use, and waste management. It was immediately apparent that the lack of high quality publicly accessible data in the US is making it very difficult for the Commission to make well-informed decisions or policy recommendations. This meeting was arranged by Geert De Cock, of Food and Water Europe, and – interestingly – was one of the first times that the European Commission met with non-industry representatives. (Several major oil and gas players have offices near the European Commission’s in Brussels.)
Rotenburg (Wümme), Germany Workshop
Max presenting during the Rotenburg Germany workshop, Sept 2015. Photo by Kyle Ferrar
Our next stop in Germany was Rotenburg. Lower Saxony also has a long lineage of drilling, with the first well drilled in 1953 and the majority of natural gas development dating back to the mid 1980’s. Currently, this is an area were unconventional oil and gas drilling (fracking) is being heavily proposed and lobbied.
This workshop was by far the most well attended event. A variety of groups and stakeholders, including the town’s mayor, were in attendance and extremely well informed about environmental and public health risks that drilling could pose. They’ve been dealing with a series of environmental health concerns for some time, including high mercury levels in drilling waste and cancer clusters of questionable origin. A systematic statistical analysis has even suggested that cases of Non-Hodgkin lymphoma are higher in an area heavy with oil and gas wells and development.
See maps below for more information about drilling in Germany and Europe at large.
Unconventional gas production, conventional gas drilling, fracking and test boring in Europe
Map by Gegen Gasbohren (Against Gas Drilling)
A dynamic map similar to the one above was created by us to show simply where unconventional drilling is occurring in the UK and Netherlands: View FracTracker’s map fullscreen
Rotenburg Field Tour
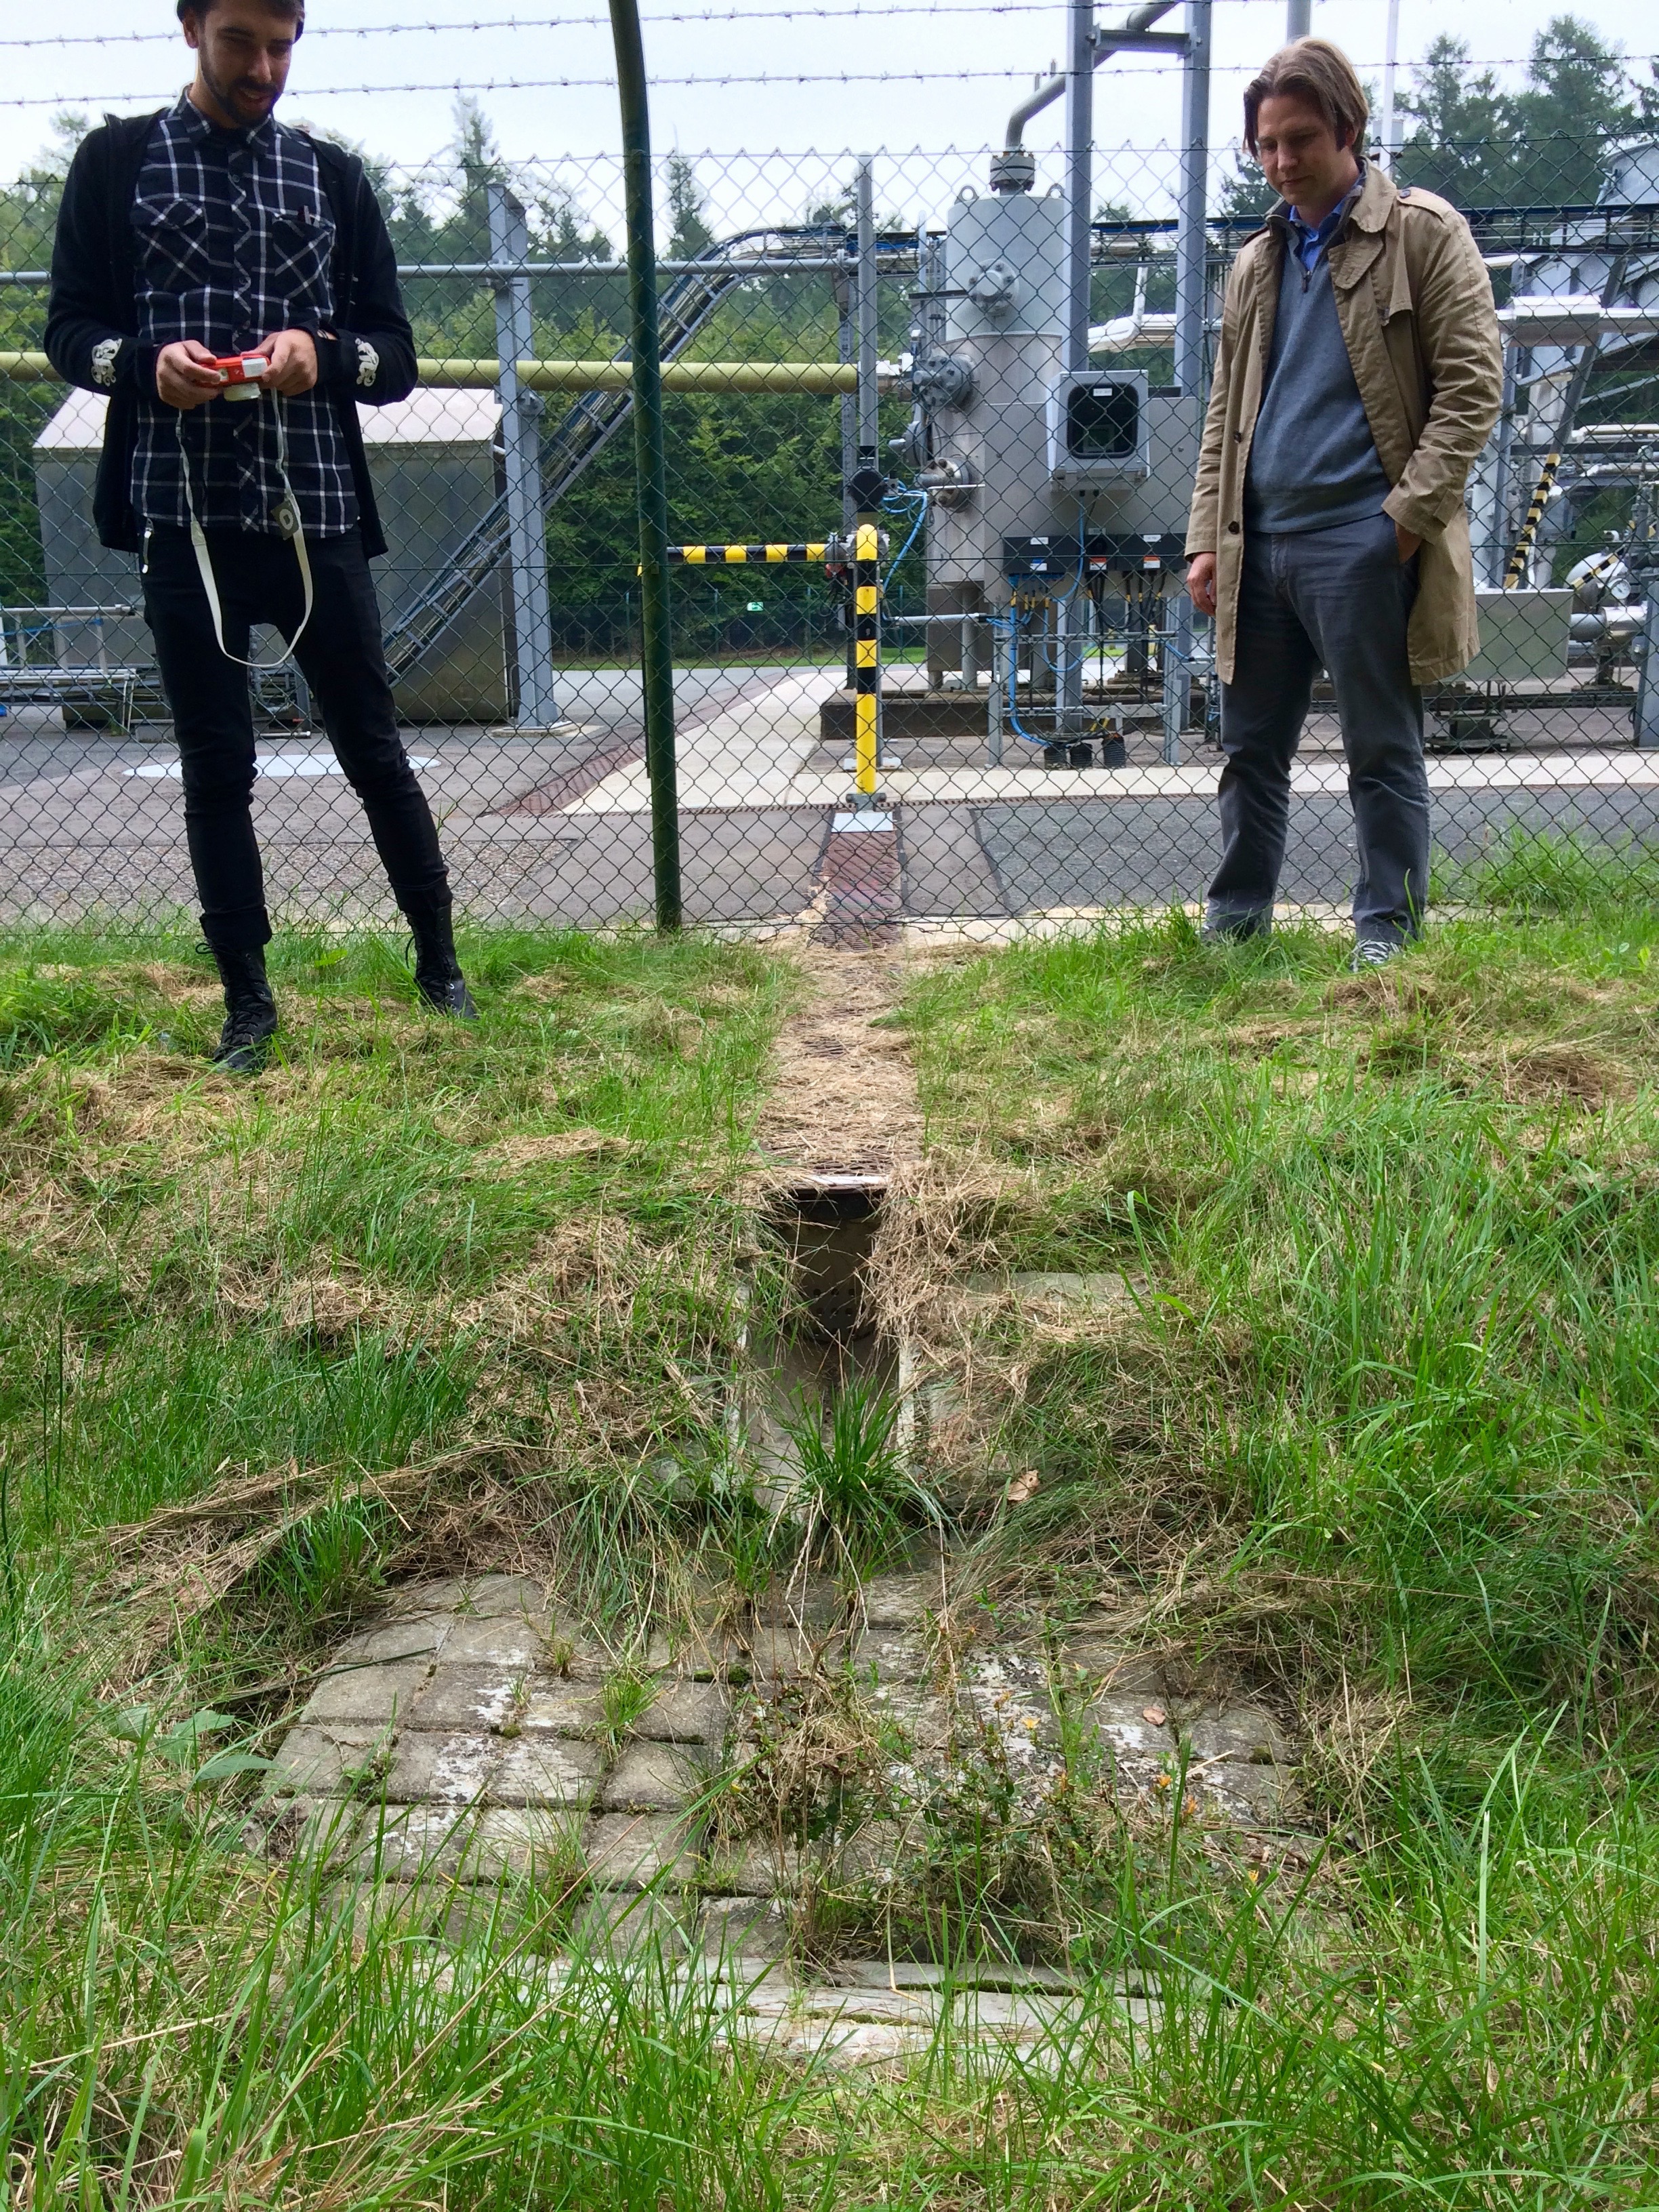
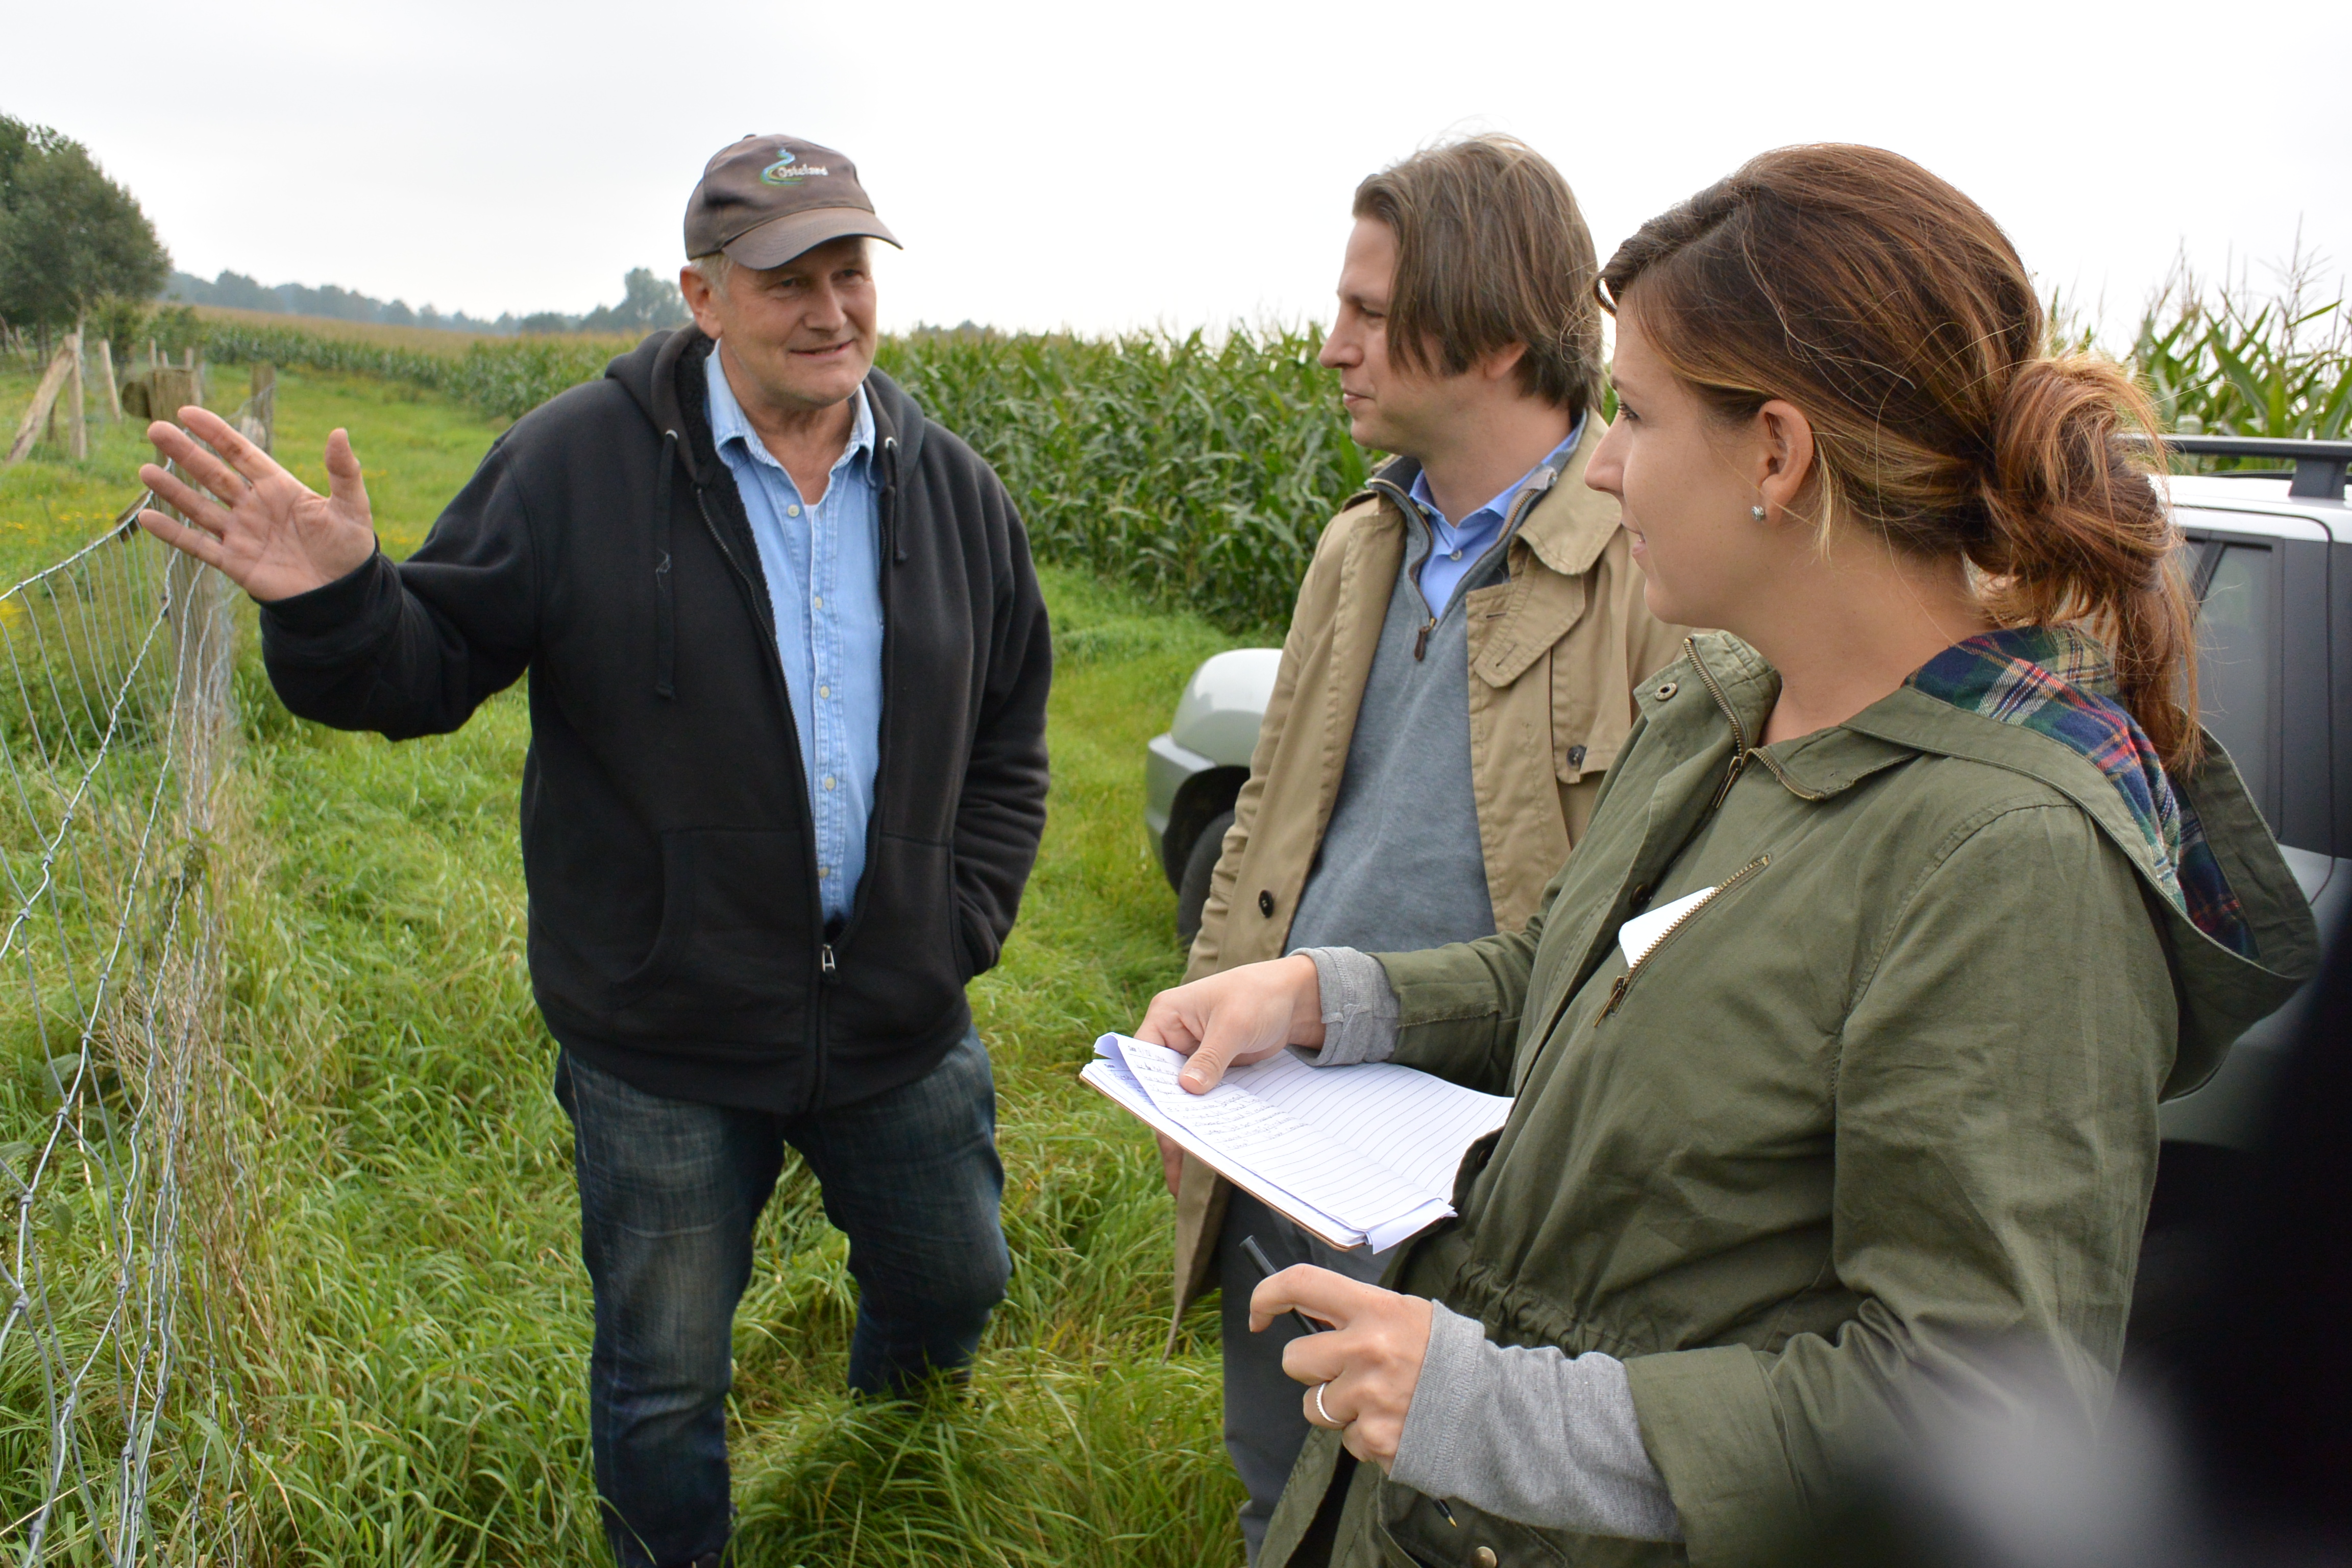
The following morning we set out with a local advocate, Andreas Rathjens, to tour over eight different oil and gas drilling sites and facilities in and around Rotenburg. This area is vey rural and a major agriculture hub, hosting 162k people, 200k cows, and 600k pigs according to our guide.
In recent years Germany has received very positive scores for its environmental policies and shift toward renewables. However, this tour highlighted some of the country’s lingering and poorly-regulated drilling history, which experienced a sharp increase in development here in the 1980’s. The pictures below will give you an idea of the issues that German residents are is still seeing from the country’s older oil and gas drilling operations. Click to enlarge the photos:
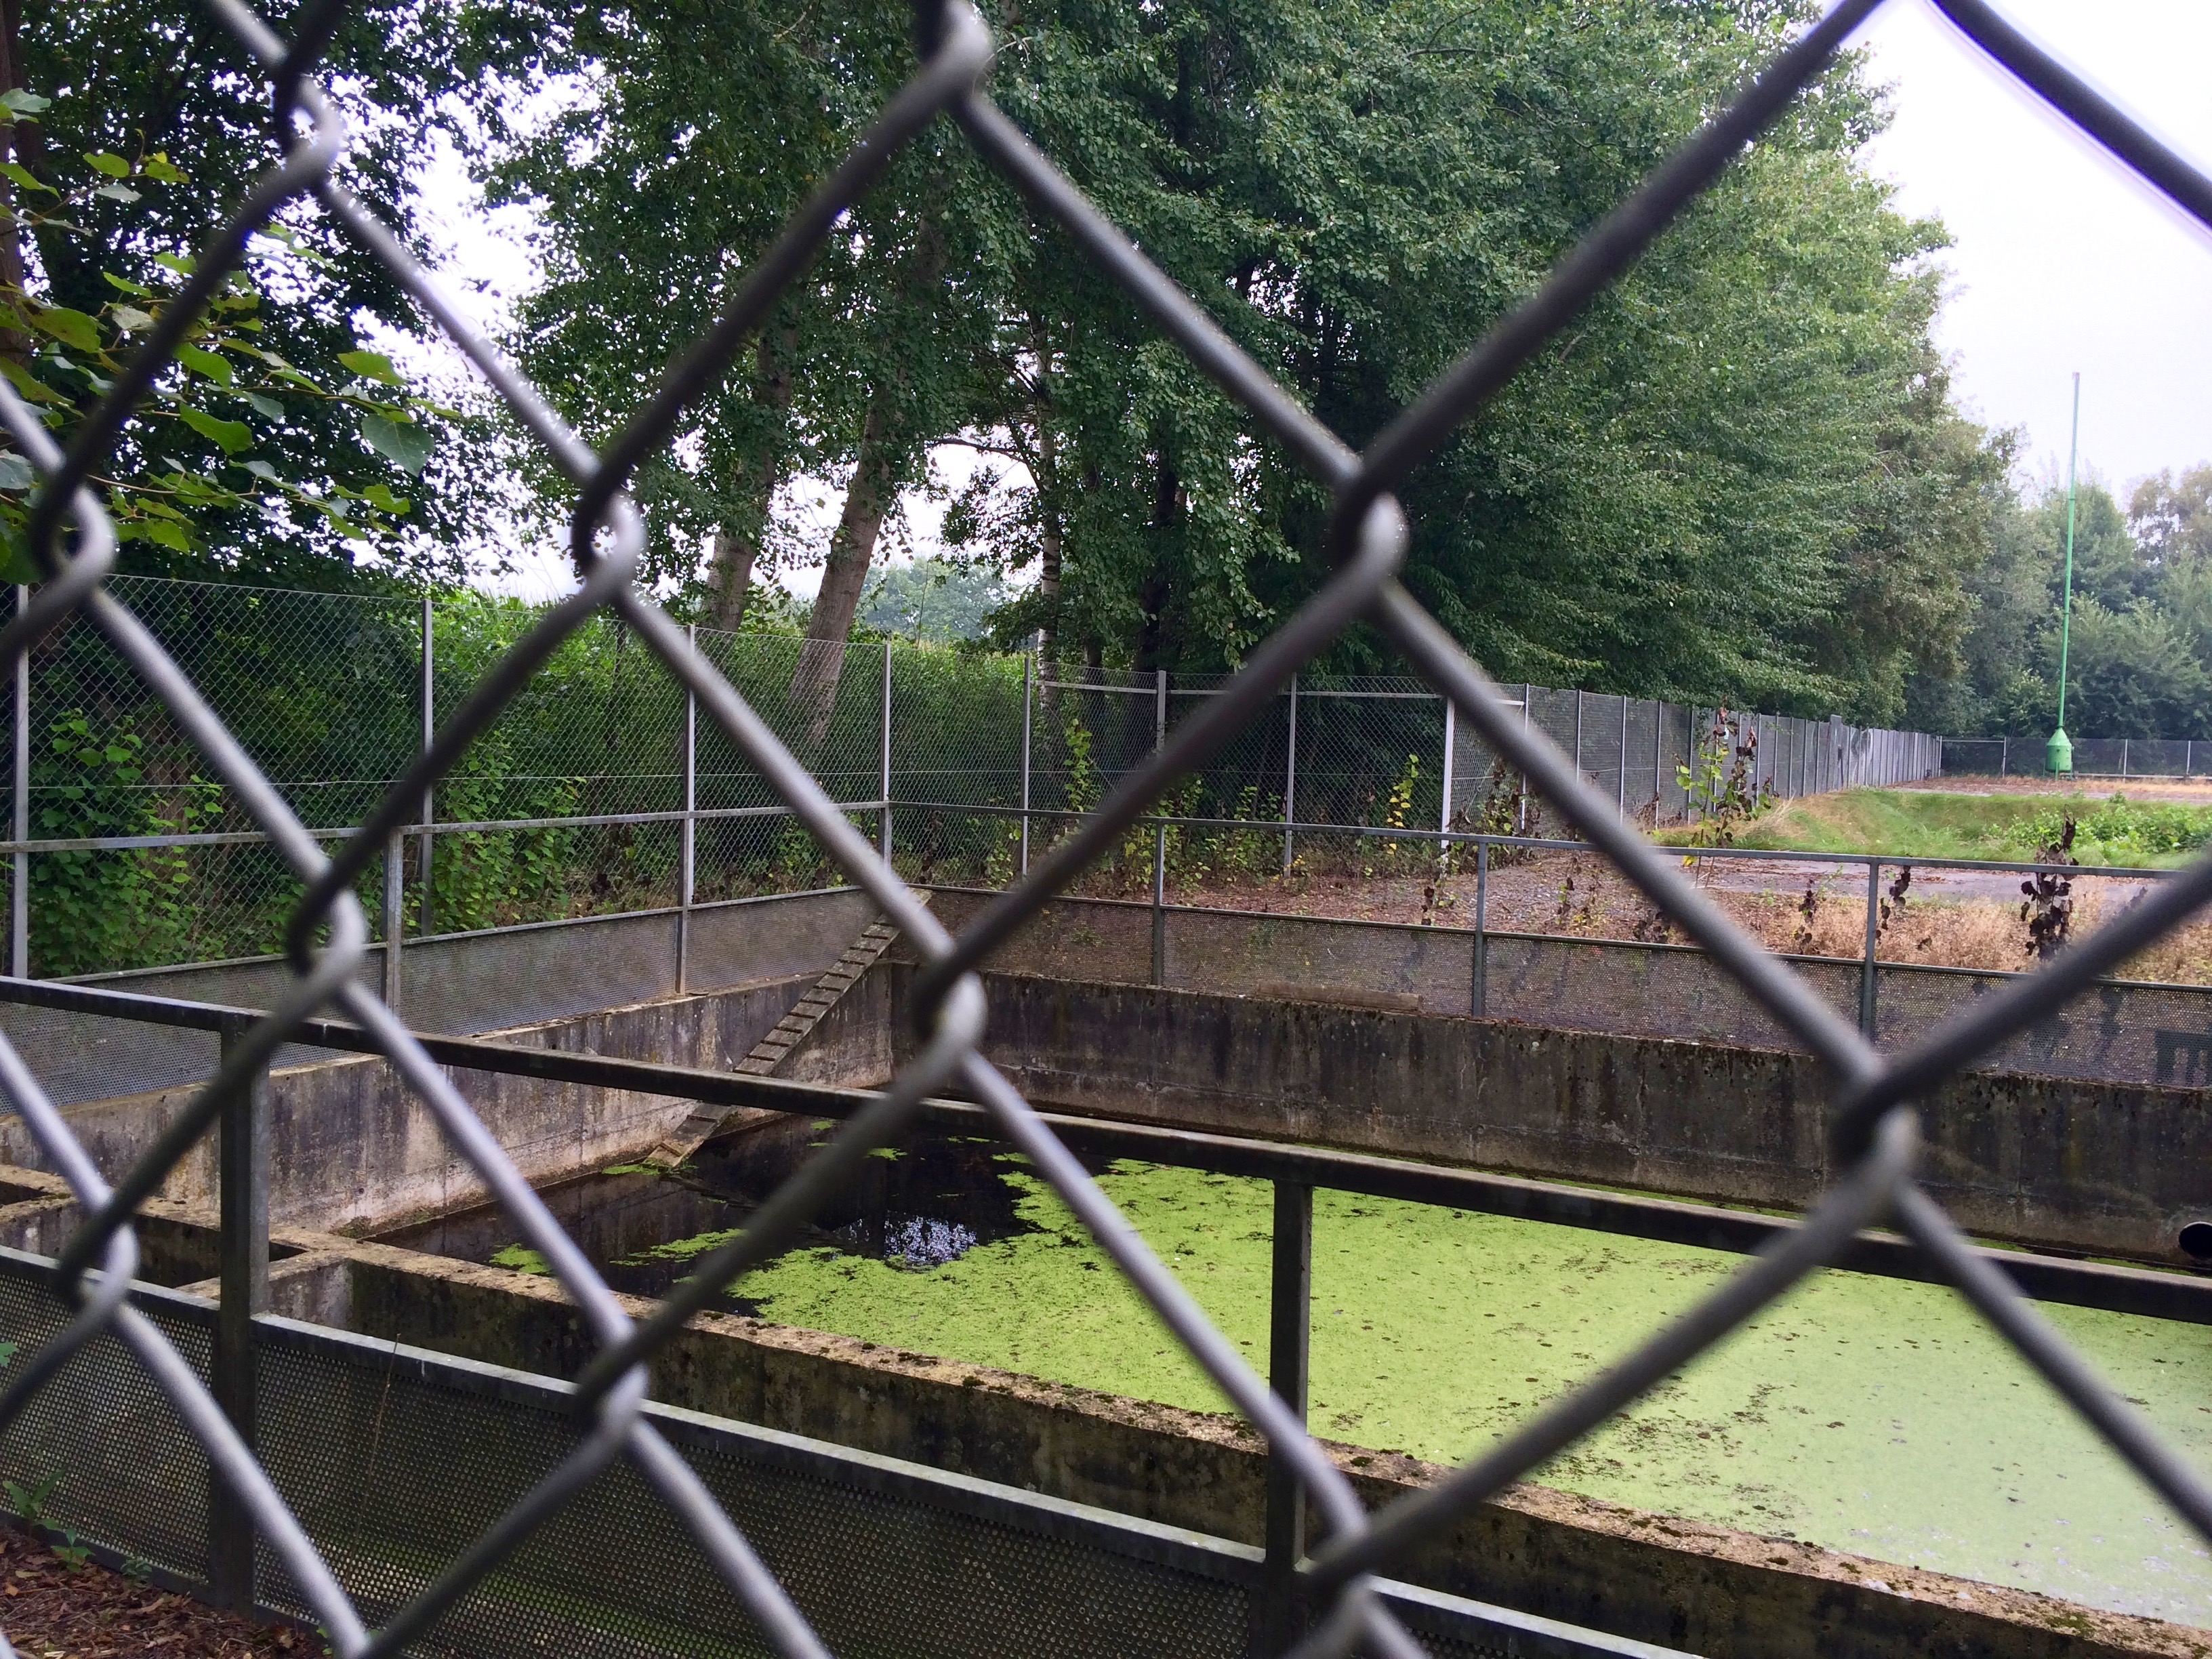
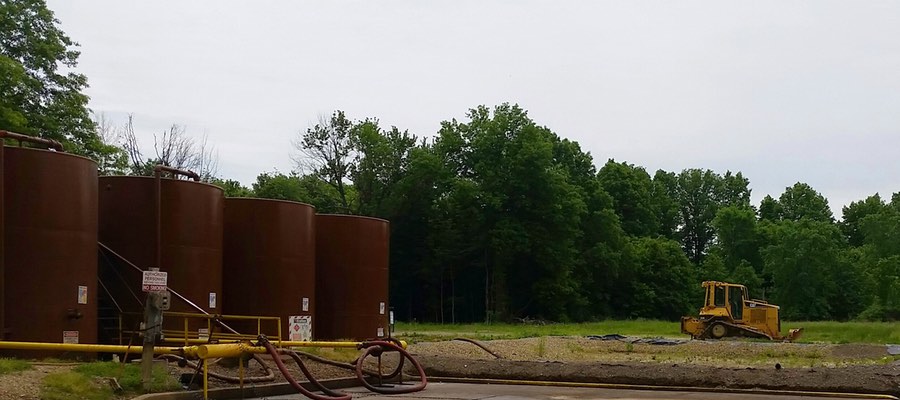
This pit is used to capture rainwater and runoff from the well pad. Since runoff from the pad will carry with it any contaminants spilled on the site, runoff must be quarantined for removal and proper disposal. Unfortunately, these tanks are rarely pumped and drained, and the runoff instead spills into local streams in small watersheds. Such is the case with this tank, with the spillway visible in the lower left corner of the photo.
This site was recently renovated to improve the drainage off of the wellpad. The drainage leads to an excavated waste pit used as an overflow catchment.[8] In these types of waste pits pollutants evaporate into the air and percolate into groundwater sources. The waste from drilling in this region is known for its high levels of mercury.
Andreas showing us the site where he says 80,000 metric tonnes of solid drilling waste was mixed with residential waste and then disposed of in a field on a hilltop. Residents have tested the site and found troubling levels of arsenic and radioactive elements, but to Andreas’ knowledge no governmental or company testing has been done to-date.
Andreas and community members all conveyed their support of domestic energy production but said they were disappointed in how the oil and gas industry has conducted itself historically in the region. They are very frustrated with how difficult it is to get their concerns heard, a sentiment echoed in many boomtowns across the US. One local politician even discussed the intentionally misleading statements made by the German state governments around environmental health issues. These residents are dedicated and driven despite the barriers, however. They are investigating and studying the problems directly at times, as well as searching for other technologies that can help improve their methods – such as the use of drones to measure air quality.
Badbergen, Lower Saxony, Germany Workshop
Fracking-freies Artland hosted our next workshop in Badbergen Germany. In addition to our presentation about drilling experiences in the US, these community gatekeepers led a presentation summarizing the work and struggles that have been occurring in their region due to both historic and modern drilling. The level of community engagement and activism here was quite impressive, mirroring that of NY State’s anti-drilling groups. These members help to inform the rest of the community about environmental and drilling issues, as Exxon is now considering fracking here again.[9]
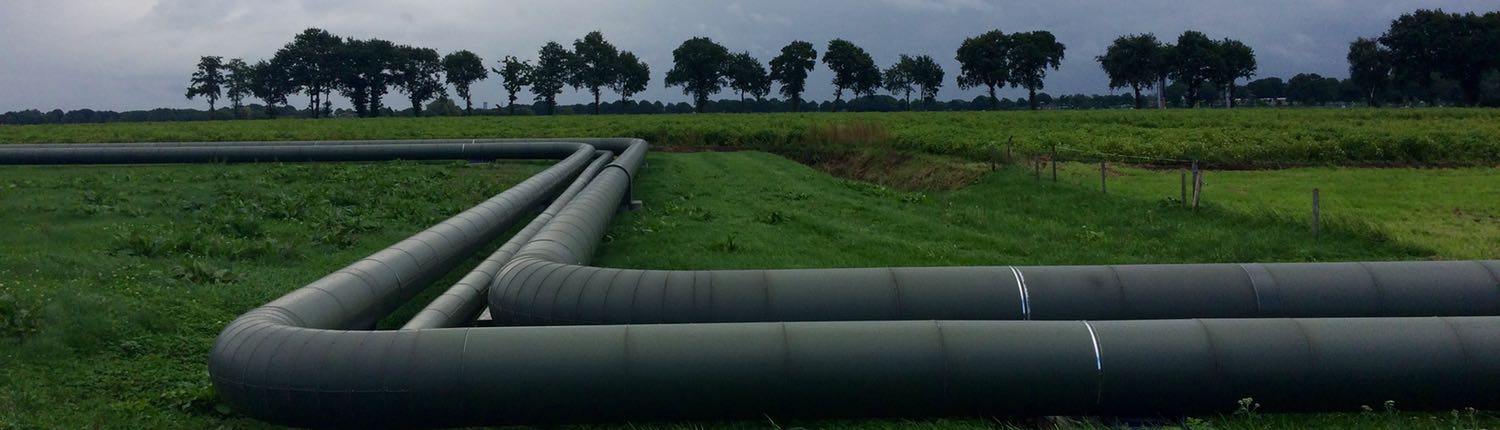
Schoonebeek Tour, Netherlands
Our final border crossing brought us to the Schoonebeek region in the Netherlands. While the Groningen gas field is by far the largest of the fields in this Western European country, Schoonebeek is the only active field being drilled unconventionally in the Netherlands.
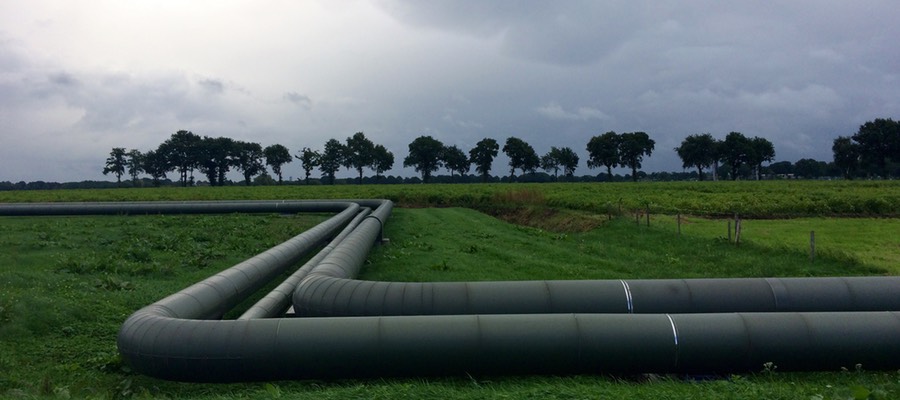
Interestingly, the entire field was recently shut down by NAM Shell/Exxon JV to fix this wastewater pipeline. It was discovered that the pipeline was leaking wastewater in nine places due to corrosion caused by the high sulfur content of the wastewater.
Upon starting our tour we were informed of the fact that the Dutch have an even higher extraction tax than the UK! The Netherlands retains a 50% State Profit Share for revenue and taxes the remaining production at a rate of 20% on the first $225,000 in revenue and “25% on the excess.” In comparison, the highest production tax rate on oil and gas drilling in the US is in Alaska at 35%. Most states have significantly lower severance taxes.[10]
Political support for higher taxes on the extractives industry may be explained by the fact that the state owns all subsurface mineral rights in these European countries. Regardless of other influences on perception, such high taxes disproves the notion here in the US that energy companies “won’t do business in a state [or country] with a newly-enacted punitive severance tax.” What do the states do with this extra revenue? The Netherlands and many Northern European countries have invested these monies for the rainy day when the oil and gas supply is depleted or extraction is no longer justifiable. The best examples are Norway’s $850 billion Government Pension Fund and Netherland’s $440 billion pension fund or $169,000 and $26,000 per capita, respectively.
Additional support for severance taxes is likely due to these countries’ history with oil and gas exploration. They are familiar with the boom-bust cycles that come with the initial expectations and long-term reality on the ground. When the music stops, Europeans are determined not to be the ones left standing.
About the Our Energy Solutions Project
This trip to Europe and our previous expeditions to Florida, North Carolina, Argentina, and Uruguay are part of a larger, collaborative project with Ecologic Institute US called Our Energy Solutions. OES is creating an informed global community of engaged citizens, organizations, businesses, governments, and stakeholders to develop ideas and solutions to keep our society moving forward while preserving our planet for the future. Learn more at: ourenergysolutions.org.
On a more personal note, our sincerest thanks goes out to the many groups and individuals that we met on our Europe tour, including those we did not directly mention in this article. We are forever indebted to all of the people with whom we met on these OES trips for sharing their time and knowledge with us.
Endnotes and References
Dr. Short is currently advising local anti-fracking groups in the UK and county councils on the human rights implications of unconventional (extreme) energy extraction processes such as fracking.
Much of the ammunition used by the anti- or undecided fracking community in the UK – and the EU writ large – is coming from proofs of concept in states like Pennsylvania, Ohio, New York, and North Dakota.
A practice that is supposedly now being investigated for soil contamination issues.
Exxon originally wrote in the local/regional paper that there was to be no unconventional shale drilling (fracking), but now the company is reconsidering.
Please note that the cited article was last updated in 2012. Some tax rates have changed since the time that the article was published, but the table still adequately represents an estimation of production taxes by state.
https://www.fractracker.org/a5ej20sjfwe/wp-content/uploads/2015/10/OES-Europe-Feature.jpg400900FracTracker Alliancehttps://www.fractracker.org/a5ej20sjfwe/wp-content/uploads/2025/09/2025-Wordmark-Logo.pngFracTracker Alliance2015-10-28 15:30:592020-03-12 13:45:14A Fresh Look at Oil and Gas Drilling from Europe
FracTracker Alliance worked with Public Herald this spring to update and map oil and gas complaints filed by citizens to the Pennsylvania Department of Environmental Protection (PA DEP) as of March 2015. The result is the largest release of oil and gas records on water contamination due to fracking in PA. Additionally, Public Herald’s investigation revealed evidence of Pennsylvania state officials keeping water contamination related to fracking “off the books.”
The mission of Public Herald, an investigative news non-profit formed in 2011, is two-fold: truth + creativity. Their work uses investigative journalism and art to empower readers and hold accountable those who put the public at risk. For this project, Public Herald aims to improve the public’s access to oil and gas information in PA by way of file reviews and data digitization. Public Herald maintains an open source website called #fileroom, where people can access a variety of digital information originally housed on paper within the PA DEP. This information is collected and synthesized with the help of donors, journalists and researchers in a collective effort with the community. To date, these generous volunteers have already donated more than 2,000 hours of their time collecting records.
The site includes complaints, permits, waste, legal cases, and gas migration investigations (GMI) conducted by the PA DEP. Additionally, there is a guide on how to conduct file reviews and how to access information through the “Right-to-Know” law at the PA DEP. They have broken down complaints and permits by county; wastes and GMI categories by cases, all of which include test results from inspections; and correspondence and weekly reports.
Some partners and contributors to the file team include Joshua Pribanic as the co-founder and Editor-in Chief, Melissa Troutman as co-founder and Executive Director, John Nicholson, who collects and researches for several databases, Nadia Steinzor as a contributor through Earthworks, and many more. Members of FracTracker working on this project include Matt Kelso, Samantha Rubright, and Kirk Jalbert.
#fileroom’s update expands the number of complaint data records collected to 18 counties – and counting!
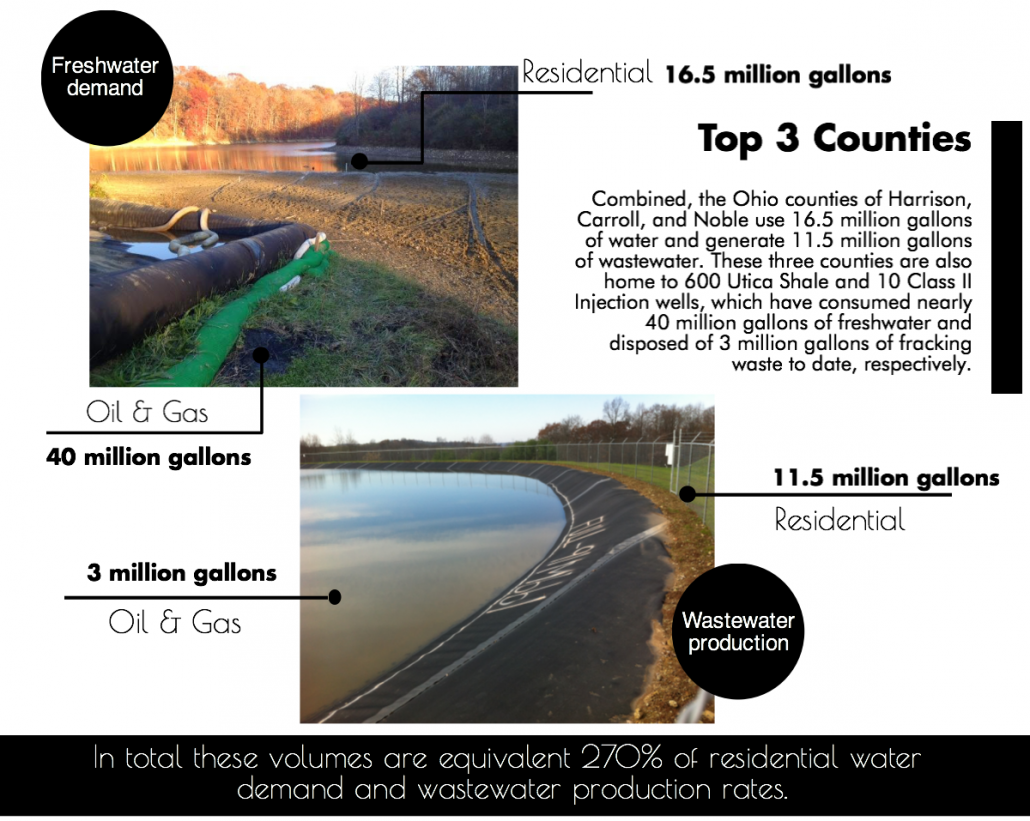
Ohio waterways face headwinds in the form of hydraulic fracturing water demand and waste disposal
By Ted Auch, PhD – Great Lakes Program Coordinator, and Elliott Kurtz, GIS Intern and University of Michigan Graduate Student
In just 44 of its 88 counties, Ohio houses 1,134 wells – including those producing oil and natural gas and Class II injection wells into which the industry’s waste is disposed. Last month we wrote about Ohio’s disturbing fracking waste disposal trend and the disproportionate influence of neighboring states. (Prior to that Ariel Conn at Virginia Tech outlined the relationship between Class II Injection Wells and induced seismicity on FracTracker.) This time around, we are digging deeper into how water demand is related to Class II disposal trends.
Ohio’s Utica oil and gas wells are using 7 million gallons of freshwater – or 2.4-2.8 million more than the average well cited by the US EPA.1 Below we explore the inter-county differences of the water used in these oil and gas wells, and how demand compares to residential water demand and wastewater production.
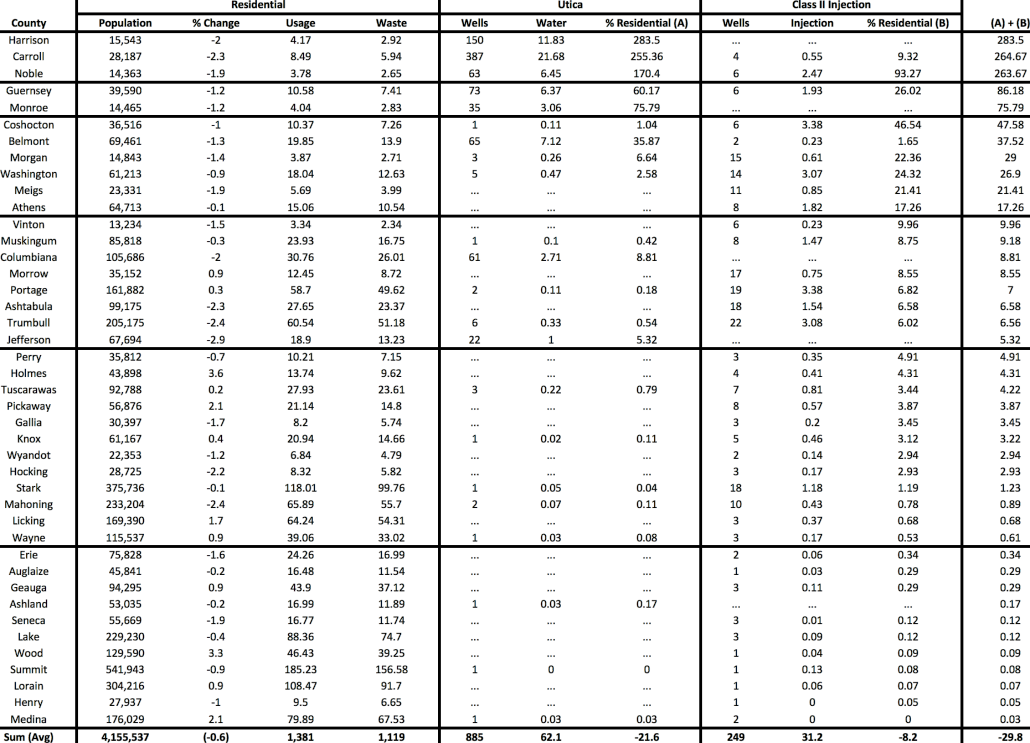
Please refer to Table 1 at the end of this article regarding the following findings.
Utica Shale Freshwater Demand
Data indicate that there may be serious threats to Ohio’s water security on the horizon due to the oil and gas industry.
The counties of Guernsey and Monroe are next up with water demand and waste water generation at rates of 14.6 and 10.3 million gallons per year. However, the 11.4 million gallons of freshwater demand and fracking waste produced by these two counties 114 Utica and Class II wells still accounts for roughly 81% of residential water demand.
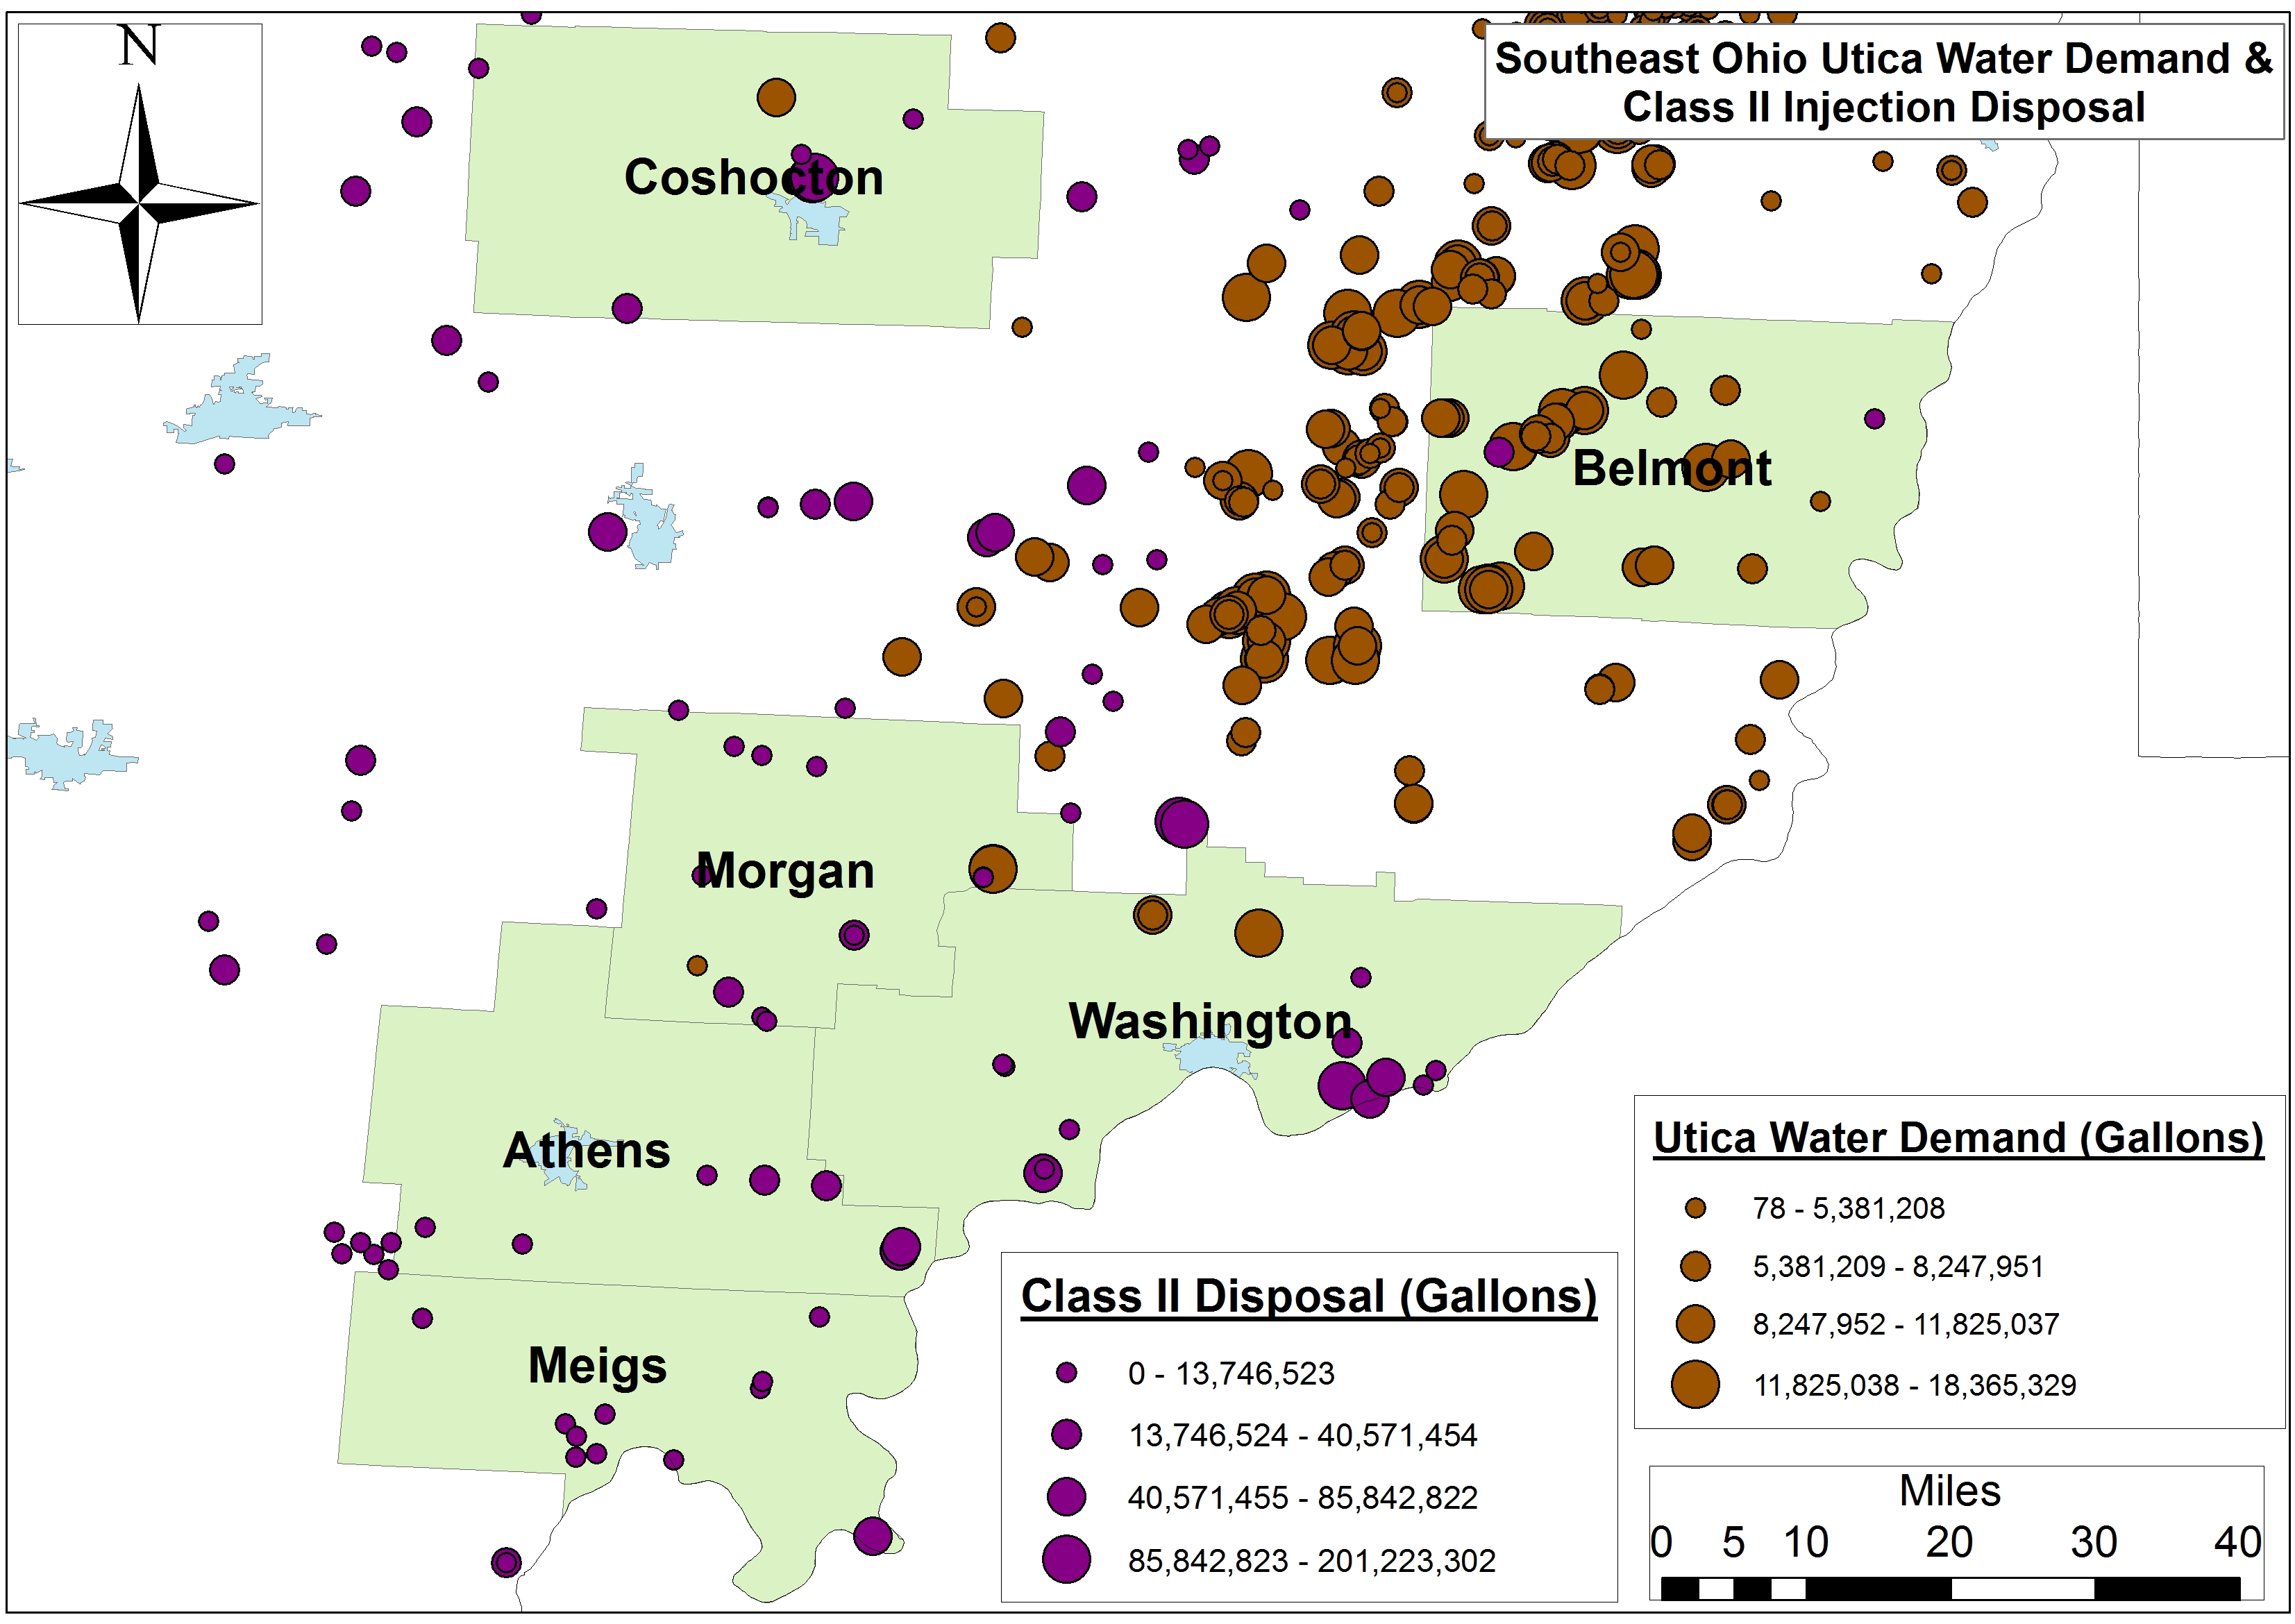
The wells within the six-county region including Meigs, Washington, Athens, and Belmont along the Ohio River use 73 million gallons of water and generate 51 million gallons of wastewater per year, while the hydraulic fracturing industry’s water-use footprint ranges between 48 and 17% of residential demand in Coshocton and Athens, respectively. Class II Injection well disposal accounts for a lion’s share of this footprint in all but Belmont County, with injection well activities equaling 77 to 100% of the industry’s water footprint (see Figure 1 for county locations and water stress).
Figure 1. Primary Southeast Ohio counties experiencing Utica Shale and Class II water stress
The next eight-county cohort is spread across the state from the border of Pennsylvania and the Ohio River to interior Appalachia and Central Ohio. Residential water demand there equals 428 million gallons, while the eight county’s 92 Utica and 90 Class II wells have accounted for 15 million gallons of water demand and disposal. Again the injection well component of the industry accounts for 5.8% of the their 7.7% footprint relative to residential demand. The range is nearly 10% in Vinton and 5.3% in Jefferson County.
The next cohort includes twelve counties that essentially surround Ohio’s Utica Shale region from Stark and Mahoning in the Northeast to Pickaway, Hocking, and Gallia along the southwestern perimeter of “the play.” These counties’ residents consume 405 million gallons of water and generate 329 million gallons of wastewater annually. Meanwhile the industry’s 69 Class II wells account for 53 million gallons – a 2.8% water footprint.
Finally, the 11 counties with the smallest Utica/Class II footprint are not suprisingly located along Lake Erie, as well as the Michigan and Indiana border, with water demand and wastewater production equalling nearly 117 billion gallons per year. Meanwhile the region’s 3 Utica and 18 Class II wells have utilized 59 million gallons. These figures equate to a water footprint of roughly 00.15%, more aligned with the 1% of total annual water use and consumption for the hydraulic fracturing industry cited by the US EPA this past June.
Future Concerns and Projections
Industry will see their share of the region’s hydrology increase in the coming months and years given that injection well volumes and Utica Shale demand is increasing by 1.04 million gallons and 405-410 million gallons per quarter per well, respectively. The number of people living in these 42 counties is declining by 0.6% per year, however, 1.4% in the 10 counties that have seen the highest percentage of their water resources allocated to Utica and Class II operations. Additionally, hydraulic fracturing permitting is increasing by 14% each year.2
Table 1. Residential, Utica Shale, and Class II Injection well water footprint across forty-two Ohio Counties (Note: All volumes are in millions of gallons)
2. Auch, W E, McClaugherty, C, Gallemore, C, Berghoff, D, Genshock, E, Kurtz, E, & Jurjus, R. (2015). Ramification of current and future production, resource utilization, and land-use change in the Ohio Utica Shale Basin. Paper presented at the National Environmental Monitoring Conference, Chicago, IL.
https://www.fractracker.org/a5ej20sjfwe/wp-content/uploads/2015/08/InjectionWells-Feature.jpg400900Ted Auch, PhDhttps://www.fractracker.org/a5ej20sjfwe/wp-content/uploads/2025/09/2025-Wordmark-Logo.pngTed Auch, PhD2015-08-11 10:42:442020-03-12 14:04:43Threats to Ohio’s Water Security
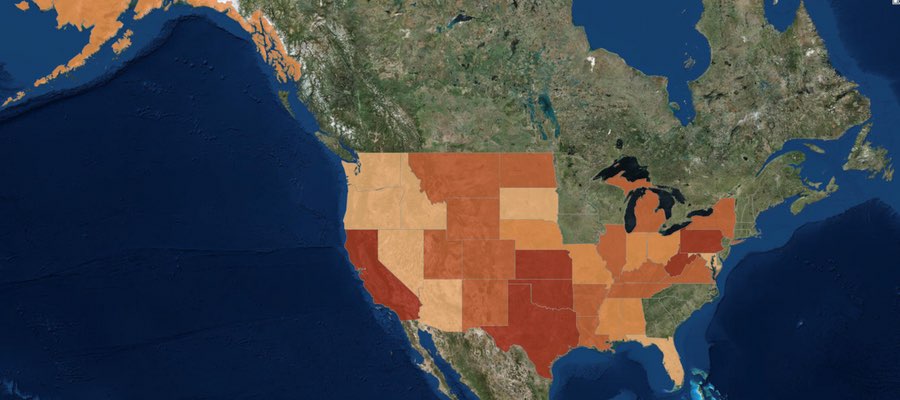
In February 2014, the FracTracker Alliance produced our first version of a national well data file and map, showing over 1.1 million active oil and gas wells in the United States. We have now updated that data, with the total of wells up to 1,666,715 active wells accounted for.
Density by state of active oil and gas wells in the United States. Click here to access the legend, details, and full map controls. Zoom in to see summaries by county, and zoom in further to see individual well data. Texas contains state and county totals only, and North Carolina is not included in this map.
While 1.7 million wells is a substantial increase over last year’s total of 1.1 million, it is mostly attributable to differences in how we counted wells this time around, and should not be interpreted as a huge increase in activity over the past 15 months or so. Last year, we attempted to capture those wells that seemed to be producing oil and gas, or about ready to produce. This year, we took a more inclusive definition. Primarily, the additional half-million wells can be accounted for by including wells listed as dry holes, and the inclusion of more types of injection wells. Basically anything with an API number that was not described as permanently plugged was included this time around.
Data for North Carolina are not included, because they did not respond to three email inquiries about their oil and gas data. However, in last year’s national map aggregation, we were told that there were only two active wells in the state. Similarly, we do not have individual well data for Texas, and we use a published list of well counts by county in its place. Last year, we assumed that because there was a charge for the dataset, we would be unable to republish well data. In discussions with the Railroad Commission, we have learned that the data can in fact be republished. However, technical difficulties with their datasets persist, and data that we have purchased lacked location values, despite metadata suggesting that it would be included. So in short, we still don’t have Texas well data, even though it is technically available.
Wells by Type and Status
Each state is responsible for what their oil and gas data looks like, so a simple analysis of something as ostensibly straightforward as what type of well has been drilled can be surprisingly complicated when looking across state lines. Additionally, some states combine the well type and well status into a single data field, making comparisons even more opaque.
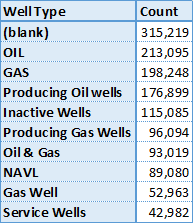
Top 10 of 371 published well types for wells in the United States.
Among all of the oil producing states, there are 371 different published well types. This data is “raw,” meaning that no effort has been made to combine similar entries, so “gas, oil” is counted separately from “GAS OIL,” and “Bad Data” has not been combined with “N/A,” either. Conforming data from different sources is an exercise that gets out of hand rather quickly, and utility over using the original published data is questionable, as well. We share this information, primarily to demonstrate the messy state of the data. Many states combine their well type and well status data into a single column, while others keep them separate. Unfortunately, the most frequent well type was blank, either because states did not publish well types, or they did not publish them for all of their wells.
There are no national standards for publishing oil and gas data – a serious barrier to data transparency and the most important takeaway from this exercise…
Wells by Location
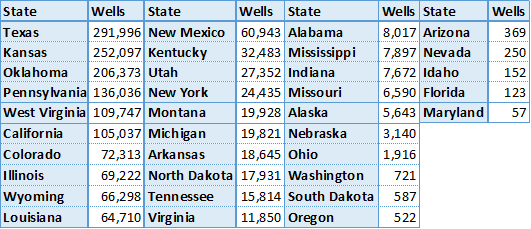
Active oil and gas wells in 2015 by state. Except for Texas, all data were aggregated published well coordinates.
There are oil and gas wells in 35 of the 50 states (70%) in the United States, and 1,673 out of 3,144 (53%) of all county and county equivalent areas. The number of wells per state ranges from 57 in Maryland to 291,996 in Texas. There are 135 counties with a single well, while the highest count is in Kern County, California, host to 77,497 active wells.
With the exception of Texas, where the data are based on published lists of well county by county, the state and county well counts were determined by the location of the well coordinates. Because of this, any errors in the original well’s location data could lead to mistakes in the state and county summary files. Any wells that are offshore are not included, either. Altogether, there are about 6,000 wells (0.4%) are missing from the state and county files.
Wells by Operator
There are a staggering number of oil and gas operators in the United States. In a recent project with the National Resources Defense Council, we looked at violations across the few states that publish such data, and only for the 68 operators that were identified previously as having the largest lease acreage nationwide. Even for this task, we had to follow a spreadsheet of which companies were subsidiaries of others, and sometimes the inclusion of an entity like “Williams” on the list came down to a judgement call as to whether we had the correct company or not.
No such effort was undertaken for this analysis. So in Pennsylvania, wells drilled by the operator Exco Resources PA, Inc. are not included with those drilled by Exco Resources PA, Llc., even though they are presumably the same entity. It just isn’t feasible to systematically go through thousands of operators to determine which operators are owned by whom, so we left the data as is. Results, therefore, should be taken with a brine truck’s worth of salt.
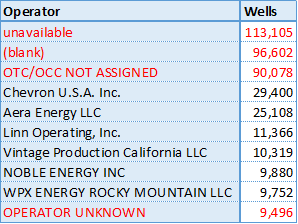
Top 10 wells by operator in the US, excluding Texas. Unknown operators are highlighted in red.
Texas does publish wells by operator, but as with so much of their data, it’s just not worth the effort that it takes to process it. First, they process it into thirteen different files, then publish it in PDF format, requiring special software to convert the data to spreadsheet format. Suffice to say, there are thousands of operators of active oil and gas wells in the Lone Star State.
Not counting Texas, there are 39,693 different operators listed in the United States. However, many of those listed are some version of “we don’t know whose well this is.” Sorting the operators by the number of wells that they are listed as having, we see four of the top ten operators are in fact unknown, including the top three positions.
Summary
The state of oil and gas data in the United States is clearly in shambles. As long as there are no national standards for data transparency, we can expect this trend to continue. The data that we looked for in this file is what we consider to be bare bones: well name, well type, well status, slant (directional, vertical, or horizontal), operator, and location. In none of these categories can we say that we have a satisfactory sense of what is going on nationally.
Click on the above button to download the three sets of data we used to make the dynamic map (once you are zoomed in to a state level). The full dataset was broken into three parts due to the large file sizes.
https://www.fractracker.org/a5ej20sjfwe/wp-content/uploads/2015/08/2015Update-Feature.jpg400900Matt Kelso, BAhttps://www.fractracker.org/a5ej20sjfwe/wp-content/uploads/2025/09/2025-Wordmark-Logo.pngMatt Kelso, BA2015-08-03 14:19:532020-07-21 10:30:051.7 Million Wells in the U.S. – A 2015 Update
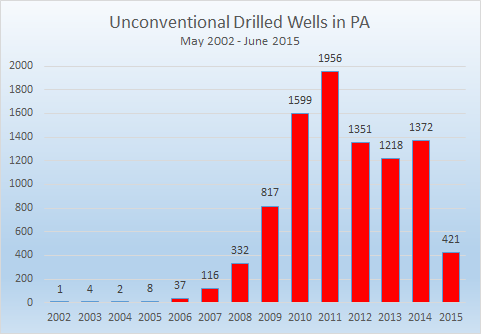
Figure 1: Newly drilled unconventional wells in Pennsylvania peaked in 2011.
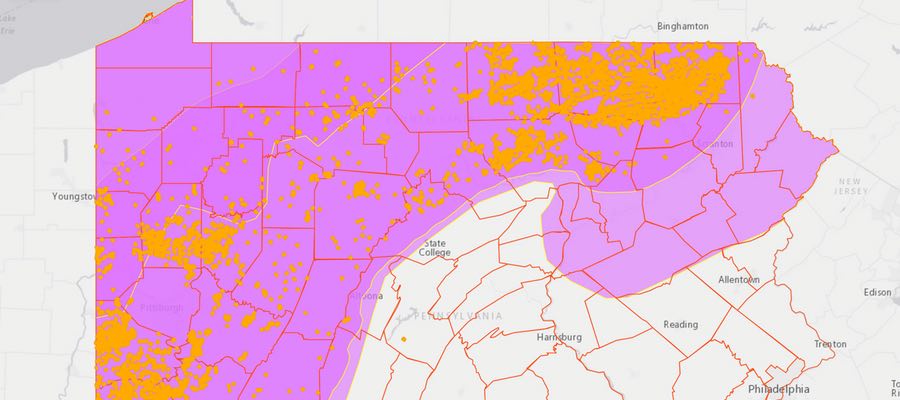
Unconventional oil and gas drilling is well established in Pennsylvania, with over 9,200 drilled wells, an additional 7,200 permitted locations that have not yet been drilled, and 5,300 violations all happening since the turn of the millennium. It took a while for the industry to gather steam, with just one unconventional well drilled in 2002, and only eight in 2005. But by 2010, that figure had ballooned to 1,599 wells, which was greater than the previous eight years combined. There were 1,956 wells drilled in 2011, representing the peak for unconventional drilling activity in Pennsylvania (Figure 1).
None of the three full years since then, however, have seen more than 70% of the 2011 total. Halfway through 2015, the industry is on pace to drill only 842 unconventional wells statewide, which would be the lowest total since 2009, and only 43% of the 2011 total.
Pennsylvania Shale Viewer. Click here to access the full screen view with a legend, layer details, and other tools.
Taken cumulatively, the footprint on the state is immense, as is shown in the map above, and impacts remain for some time. Of Pennsylvania’s 9,234 unconventional wells 8,187 (89%) are still active. Only 474 wells have been permanently plugged so far, with 570 given an inactive status, and one well listed as “proposed but never materialized,” despite being included on the spud report.
Permits & Violations
The number of permits and violations issued have been declining over the past five years as well.
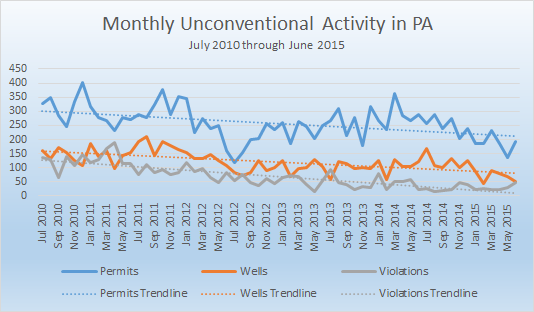
Figure 2: Five years of unconventional oil and gas activity in Pennsylvania, July 2010 through June 2015.
Figure 2 shows the monthly totals of permits, wells, and violations over the last 60 months. Linear trendlines were added to the chart to give a visual representation of changes over time if we ignore the noise of the peaks and troughs of activity, which is an inherent attribute of the industry. Each of the three trendlines has a negative slope1, showing downward trends in each category.
In fact, permits for new wells are declining more rapidly than the drilled wells, and violations issued are declining at a still faster rate. Over the course of five years, these declines are substantial. In July 2010, the smoothed totals that are “predicted” by the trendline show 304 permits issued, 159 wells drilled, and 128 violations issued per month. 60 months later, one would expect 213 permits, 81 wells drilled, and just 12 violations issued2.
Location of Drilling Activity
The oil and gas industry has been more selective about where unconventional wells are being drilled in recent years, as well. Altogether, there are unconventional wells in 39 different counties, with 32 counties seeing action in both 2010 and 2011. That number is down to 22 for both 2014 and the first half of 2015. There has been drilling in 443 different municipalities since 2002, with a maximum of 241 municipal regions in 2011, which shrank to 161 last year, and just 88 in the first half of 2015.
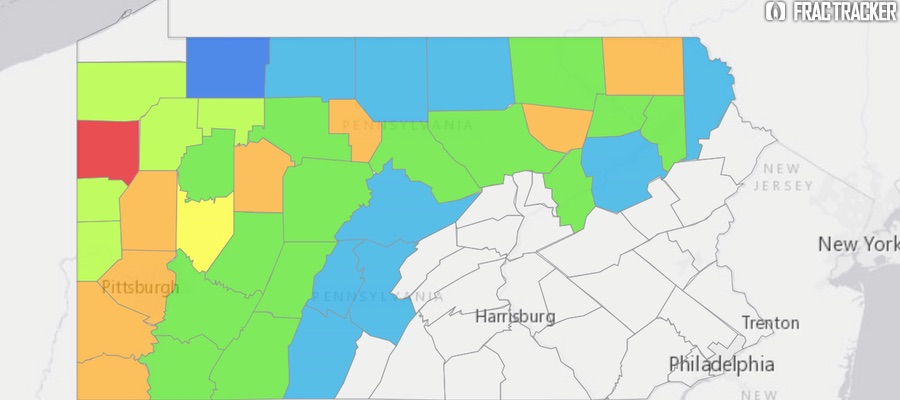
Summary of unconventional wells drilled in each Pennsylvania county by year, through June 30, 2015. Click here to access the full screen view with a legend, layer details, and other tools
Clicking on any of the counties above will show the number of unconventional wells drilled in that county by year since the first unconventional well was spudded in Pennsylvania back in 2002. The color scheme shows the year that the maximum number of unconventional wells were drilled in each county, with blues, greens, and yellows showing counties where the activity has already peaked, oranges showing a peak in 2014, and red showing a peak in 2015, despite only six months of activity. 30 of the 39 counties with unconventional wells in the state saw a peak in activity in 2013 or before.
Notes
The equations for the three trendlines are as follows:
Permits: y = -1.5128x + 303.81
Wells: y = -1.2939x + 158.95
Violations: y = -1.9334x + 127.53
The lowest actual value for each category are as follows:
Permits: 117, in July 2012
Wells: 43, in February 2015
Violations: 16, in August 2014.
https://www.fractracker.org/a5ej20sjfwe/wp-content/uploads/2015/07/PA-Down-Feature.jpg400900Matt Kelso, BAhttps://www.fractracker.org/a5ej20sjfwe/wp-content/uploads/2025/09/2025-Wordmark-Logo.pngMatt Kelso, BA2015-07-08 14:44:562020-07-21 10:30:04Unconventional Drilling Activity Down In Pennsylvania
In Pennsylvania, the vast majority of unconventional oil and gas activity is focused on the Marcellus Shale formation, a Devonian period deposit of black shale with a high hydrocarbon content, which requires horizontal drilling and large scale hydraulic fracturing to produce enough oil and gas to make the drilling economically viable. This formation was created about 390 million years ago, when organic-rich deposits accumulated in what is now the Appalachian Mountains, but was at that time a shallow sea. Down below the base of the Marcellus lies the Utica Shale, an Ordovician period formation, with almost the same geographic extent as the Marcellus, but the deposits were placed there about 65 million years earlier.
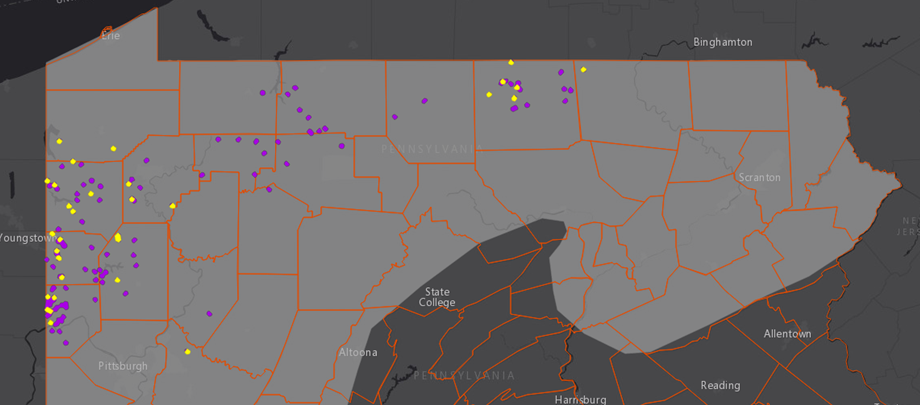
Utica permits and violations in Pennsylvania. Click here to access the legend and other map tools.
In neighboring Ohio, it is the Utica that gets most of the attention, with 937 permitted wells, as opposed to just 20 for the Marcellus. In Pennsylvania, the reverse is true: there are 16,110 permitted Marcellus wells, but only 279 permits for Utica wells. Part of the reason for this is because the subsurface characteristics of these formations vary widely, especially in terms of thickness and depth. With changes in depth come changes in temperature and pressure, which are key criteria in hydrocarbon formation. In other words, the same formation that produces considerable quantities of gas and valuable liquid hydrocarbons in eastern Ohio may be economically unviable just a county or two over in western Pennsylvania.
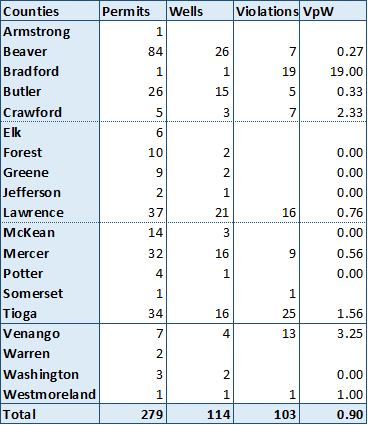
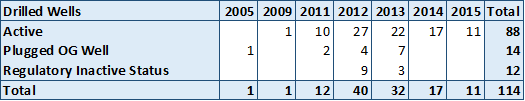
Utica shale permits, drilled wells, violations, and violations per well for Pennsylvania, through June 19, 2015.
Utica drilling permits have been issued in 19 different counties in Pennsylvania, with wells having been drilled in 15 of those. The violations per well (VpW) score for Utica wells in the Keystone State is 0.9, meaning that there are nine violations issued for every 10 wells that have been drilled. It is worth noting, however, that only 36 of the 114 drilled wells have received violations, meaning that some wells have been cited on multiple occasions.
Of particular note is Bradford county, the site of only one Utica well, but 19 items on the compliance report. The problematic Bayles 1 well was run by three different operators before being permanently plugged. This well also has two “Drill Deeper” permits, and as a result, it is likely that the first six violations assessed to this well were issued before it was associated with the Utica Shale, as they precede the most recent spud date for the well in June, 2005. Most of the violations for this well seem to be for pit violations and discharges to the ground and nearby stream.
Wells drilled into the Utica Formation in Pennsylvania, by year and current status.
In terms of drilling activity, it appears to have peaked in 2012, calling into question whether the industry considers the formation to be economically viable in Pennsylvania. Of the 28 wells drilled since the beginning of 2014, Tioga County has seen the most activity with 11 wells drilled, followed by five wells in Butler County, then three in Lawrence County. If we think of drilling activity as a sort of positive feedback from the industry – meaning that they like what they see and want to keep exploring – then only Tioga County seems to be holding the attention of the various operators who have been active in the Utica Shale. Given the Utica activity in Ohio, one might have thought that counties on the western edge of the state – especially Beaver, Lawrence, and Mercer – would have shown the most promise, but this appears not to be the case.
https://www.fractracker.org/a5ej20sjfwe/wp-content/uploads/2015/06/PA_Utica-crop.png405920Matt Kelso, BAhttps://www.fractracker.org/a5ej20sjfwe/wp-content/uploads/2025/09/2025-Wordmark-Logo.pngMatt Kelso, BA2015-06-23 14:52:012020-07-21 10:30:04Utica Drilling in Pennsylvania
The Pennsylvania Department of Environmental Protection (PADEP) publishes oil and gas well data in two different places: on their own website’s Spud Data Report, and in the Oil and Gas Locations file published on the PA Spatial Data Access repository, also known as PASDA. Because these two sources are both ultimately published by PADEP, it would stand to reason that the data sources would match up. Unfortunately, that is not the case. Learn more about the data discrepancies we uncovered:
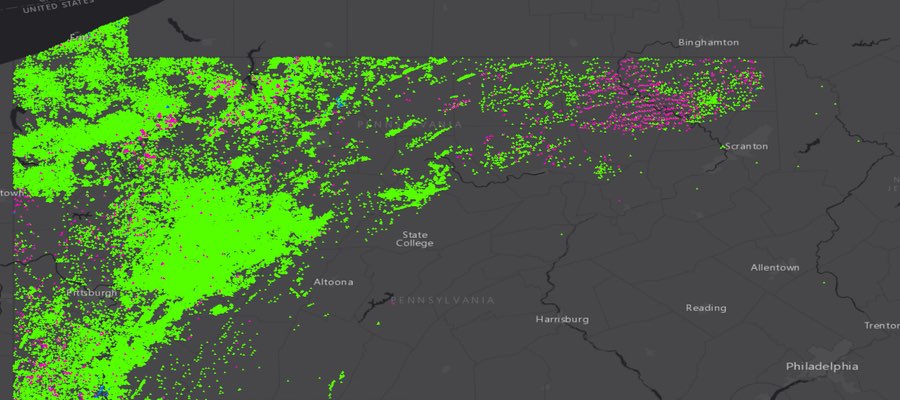
This map shows those wells in Pennsylvania that only show up on one of the two data sources. Pink dots show wells that appear on PASDA but not the PADEP site, while the reverse is true for blue wells. Click here for the full screen view with additional map tools.
Methodology
Both of these data sources have existed for years. When FracTracker does analyses of PA, we usually use data directly from the PADEP site, because it includes far more information about the wells, such as the spud date, county, municipality, well configuration, and whether or not the well is classified as unconventional. Even though it has less information about each well, the data on PASDA is useful for expediently mapping the inventory of wells in the Keystone State. In this current analysis, we looked at both sources, and found significant discrepancies between the two.
Individual oil and gas wells have been given unique API numbers since the 1950’s. The overwhelming majority of items on both lists that we examined have these numbers, and those that do not have other numeric identifiers in their place. The uniqueness of the data in these columns is what we used to determine the number of wells on both lists. These columns in both data sources were then tested against one another using Microsoft Excel in order to determine which wells were included on both lists.
The data on PASDA is described as “Oil and Gas Locations,” and nothing in available metadata made it clear as to whether wells that were permitted but not yet drilled might be included in this or not. Additionally, we are mostly interested in wells that are still operational, assuming that there might be accuracy issues for historical wells in an industry that has been operational in the state since before the Civil War. We did, however, include orphaned and abandoned wells, as they remain a source of impact throughout the state.
Summary
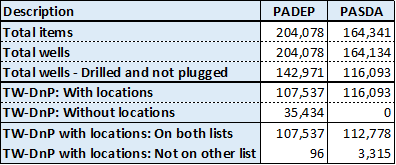
Number of wells in PA in various categories. For brevity, “Total wells – Drilled and not plugged” is shown as “TW-DnP.”
We found 3,315 records of drilled, unplugged wells with location information on the PASDA dataset that are not on the PADEP search tool, and 96 such wells on the PADEP site that aren’t found on PASDA. Additionally, there are 35,434 drilled and unplugged wells in the PADEP data that lack location data, although six of these wells are actually on the PASDA site, meaning that there is some location data for them somewhere at PADEP.
For those of you who might be looking for discrepancies in our discrepancy table, one might expect the number of both wells that appear on both lists (the second to last row on the chart) to be identical. The biggest reason that they are not is that some wells appear in the PASDA dataset multiple times. There are 6,997 fewer unique wells than there are entries on the full file, or a 95.74% match rate. In comparison, the PADEP spud report only has 19 duplicates for over 204,000 wells, a 99.99% match between the number of wells and the number of records. Indeed, when we filter for unique wells, the difference between the two lists shrinks to only 40 records, which might be explained by differences is well statuses that were used to shape our analysis.
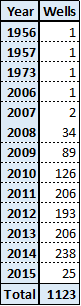
Number of wells drilled per year in Susquehanna Co., through 2/11/15.
Undoubtedly, it will take some effort to get the two datasets to reflect the full set of wells in PA, but that is certainly a task than can be accomplished. The wells lacking location data are likely to be much more of a challenge. If we include all status types, there are 75,508 wells on the spud report that lack latitude and longitude values altogether, leaving us with only the county and municipality to determine where these wells are located. Hopefully, this crucial data exists somewhere in the PADEP inventory, and these wells are not in fact lost.
Finally, there are a couple of things to note about dates. Since the PASDA dataset does not include spud dates, it is impossible to determine the age of the majority of the mismatched wells. Looking at the pink dots on the interactive map above, though, it is clear that a large number of these mismatched PASDA wells are in the northeastern corner of the state that has been booming since the recent development of the Marcellus, but saw little to no development before that time – at least according to the spud report.
Of the 96 wells that are on the spud report but not PASDA, 67 are given the date “1/1/1800,” which seems to be a default date; over 94,000 wells on the report have this listed as the spud date. Most of the other wells that don’t match are relatively old wells, with spud dates ranging between 1960 and 1984. One of these wells was drilled on May 6, 1999 though, and four more were drilled on August 19, 2014.
The mismatched data can be accessed here for those who are interested.
https://www.fractracker.org/a5ej20sjfwe/wp-content/uploads/2015/02/PA_mismatch_Feature.jpg400900Matt Kelso, BAhttps://www.fractracker.org/a5ej20sjfwe/wp-content/uploads/2025/09/2025-Wordmark-Logo.pngMatt Kelso, BA2015-02-11 15:21:442020-07-21 10:32:08Pennsylvania Data Discrepancies
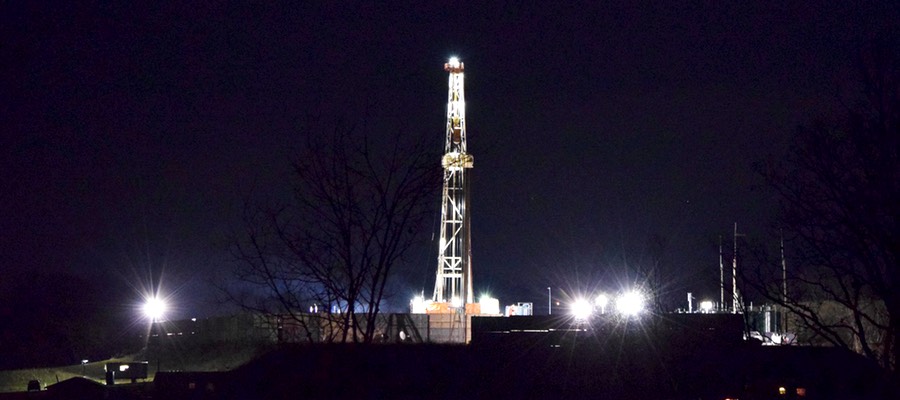
https://www.fractracker.org/a5ej20sjfwe/wp-content/uploads/2016/01/Listening-Feature-1.jpg400900FracTracker Alliancehttps://www.fractracker.org/a5ej20sjfwe/wp-content/uploads/2025/09/2025-Wordmark-Logo.pngFracTracker Alliance2014-12-29 17:19:262022-03-16 11:48:44Oil and Gas Drilling 101
The FracTracker Alliance periodically takes a deeper look into the unconventional oil and gas data in Pennsylvania, in order to provide updates for some frequently requested statistics on the industry. Here we provide updated PA data and trends as of December 4, 2014. Since unconventional drilling began in the Commonwealth permits have been issued to drill 15,573 unconventional wells, according to data from the Pennsylvania DEP. Many – 8,696 (56%) – of those permits have actually been drilled. In terms of violations, there have been 5,983 entries on the statewide Compliance Report for unconventional wells throughout the state, which are attributed to 1,790 distinct wells.
Pennsylvania Shale Viewer Map
Please click here for the full screen version, with additional map tools and controls.
Additional Stats
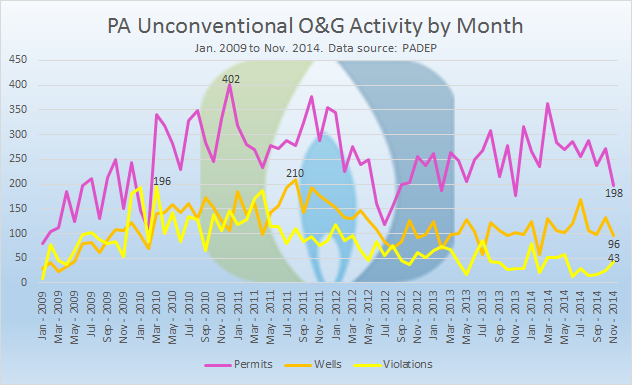
The number of permits, wells, and violations vary significantly from month to month, but each category is well off of its peak. The largest number of unconventional permits issued in a single month was 402, which was in December 2010, more than twice as many as were issued last month. In that year, there were six months with 300 or more permits issued, whereas there has only been one such month to date in 2014.
PA unconventional O&G activity per month from Jan. 2009 to Nov. 2014. Source: PADEP
The 210 wells spudded (drilled) in August 2011 represents the high water mark, and is more than two times the amount of wells drilled last month. In the 28 months between March 2010 and June 2012, the industry failed to spud 100 wells only once, reaching 98 in April 2011. In the first 11 months of 2014, that plateau was missed three times, with a low of 58 spuds in February.
There was a significant spike in violations appearing on the compliance report from December 2009 through August 2011. More than 100 violations were issued in 17 out of 21 months, including 196 in March 2010. The number of violations issued has slowed down considerably since then, with November 2014 being the 34th straight month with fewer than 100 violations. Only 14 violations were issued in June 2014.
Violations per Well (VpW)
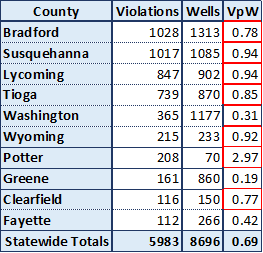
Unconventional violations per well by county in PA, showing the 10 counties with the largest number of violations. Counties with an above average Violations per Well (VpW) score are highlighted in red.
We often ask whether drilling is more problematic in some areas than others. Since the number of wells varies depending upon the location, we must approach this question by looking at the number of violations issued per well drilled (VpW). However, there is an important caveat to consider. Put simply, what is a violation? The Pennsylvania DEP publishes a Compliance Report for unconventional wells, which has 5,983 incidents listed from 2000 through December 4, 2014. However, it used to be common for the DEP to lump several incidents into the same Violation ID number, although this is not the case for more recent infractions. When the DEP counts violations issued, they look at the total number of unique Violation ID numbers that have been issued, not the total number of incidents on the report. Here, we include the more inclusive list of items on the compliance report.
Of the 10 counties with the largest number of violations issued, only 3 counties have a violations per well mark below the statewide average. Notably, each of those three counties are located in Southwestern Pennsylvania. It is unclear from these numbers what is going on in Potter County, but clearly there is a significant problem in that location – with almost three violations issued per well drilled, Potter County has a VpW score 4.3 times the statewide average.
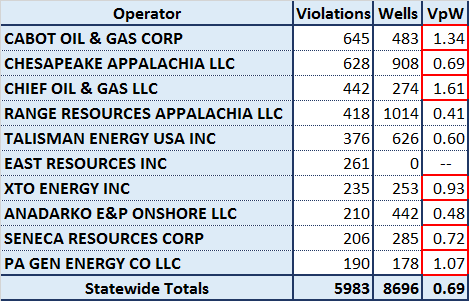
Operator Trends
Before we look at the operators with the most violations, there is an additional caveat to consider: It is relatively common for wells to change hands over their operational lifetimes. This characteristic could be due to one company buying another out, or simply transferring some of their assets. Still, wells changing from one operator to another is a normal aspect of the oil and gas industry. Such a fact matters for this analysis because while violations issued always stick with the responsible party in the DEP data, the name of the operator changes on the Spud Report to the current operator.
Unconventional violations per well by operator in PA, showing the 10 operators with the largest number of violations. Operators with an above average Violations per Well (VpW) score are highlighted in red.
Because of how these datasets are maintained, we see that East Resources has 261 violations for zero wells, which is of course an impossibly large ratio. That is because East sold off its stake in the Marcellus to Royal Dutch Shell, which does business as SWEPI in Pennsylvania. SWEPI, by the way, is 13th on the list of violations in its own right, with 154 violations for 675 wells, resulting in a 0.23 VpW. If the legacy violations for the old East wells were included, the result would be a 0.61 ViW score, which is almost three times as high, but still below the statewide average. FracTracker doesn’t do the analysis that way, both because it is unfair to the new operator to charge them with violations that they had nothing to do with, as well as being nearly impossible to keep track of the various transactions that result in wells changing hands over the years.
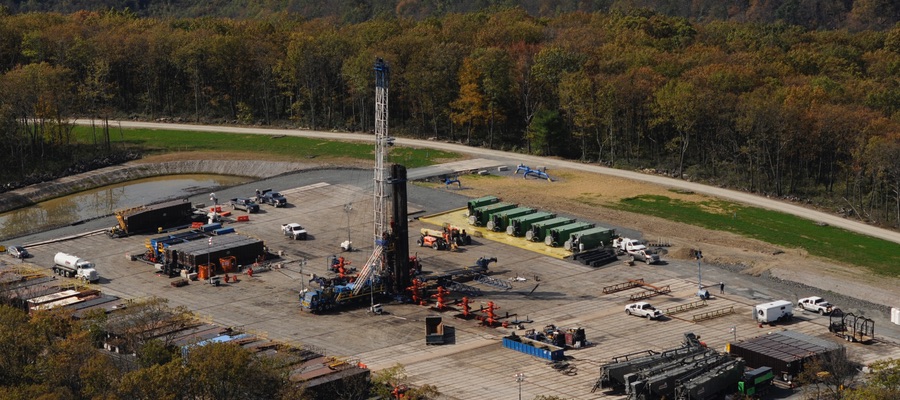
Cover image by Pete Stern, 2013.
https://www.fractracker.org/a5ej20sjfwe/wp-content/uploads/2014/12/PA-Stern-Feature.jpg400900Matt Kelso, BAhttps://www.fractracker.org/a5ej20sjfwe/wp-content/uploads/2025/09/2025-Wordmark-Logo.pngMatt Kelso, BA2014-12-08 10:51:402020-07-21 10:34:09Updated PA Data and Trends