Regulatory Gaps and Resistance: The Battle Over Fracking in Southern Illinois
Guest authors Sam Stearns and Tabitha Tripp dive into the complex history of resource extraction in Southern Illinois. Drawing on personal experience and the work of community organizers, they reveal the threats posed by fracking, the failures of regulatory agencies, and the urgent need for environmental justice.
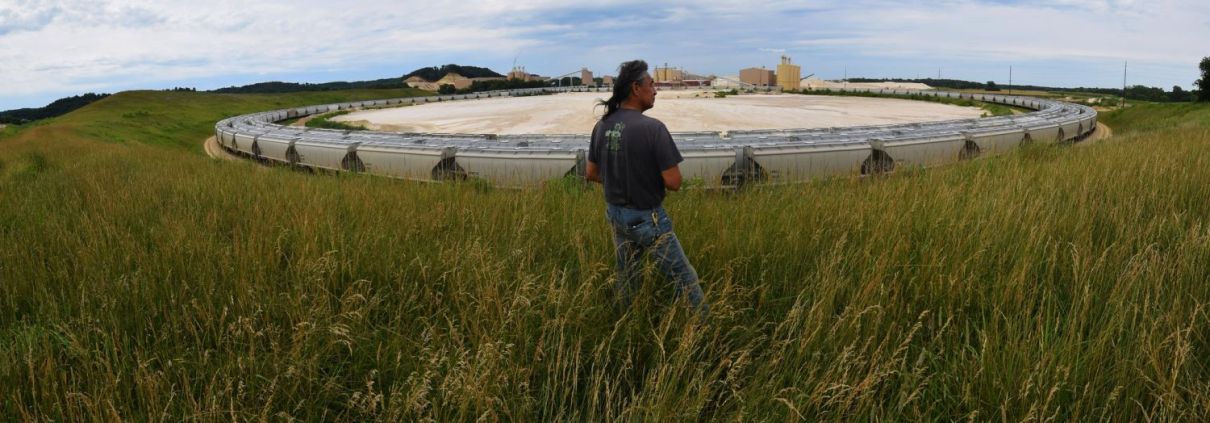
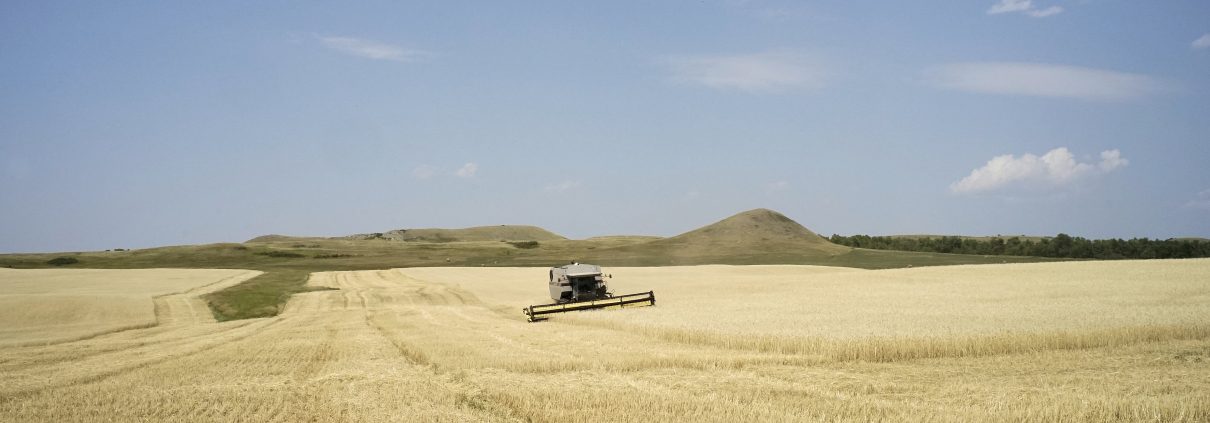
 Great Plains Action Society
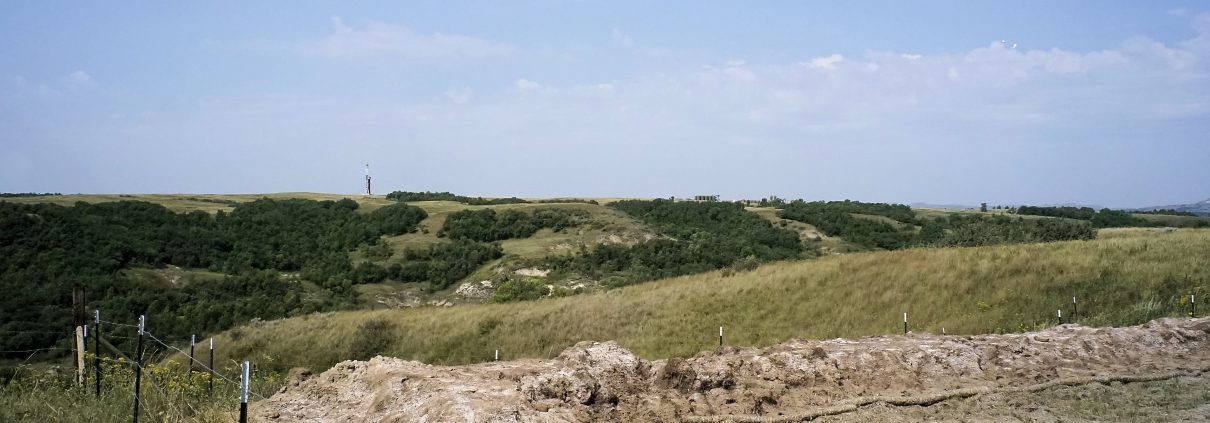
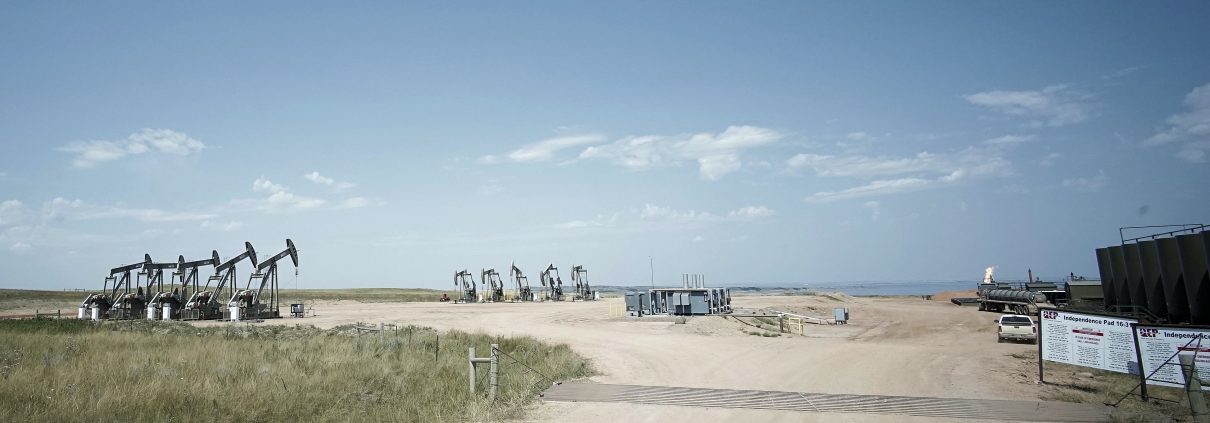
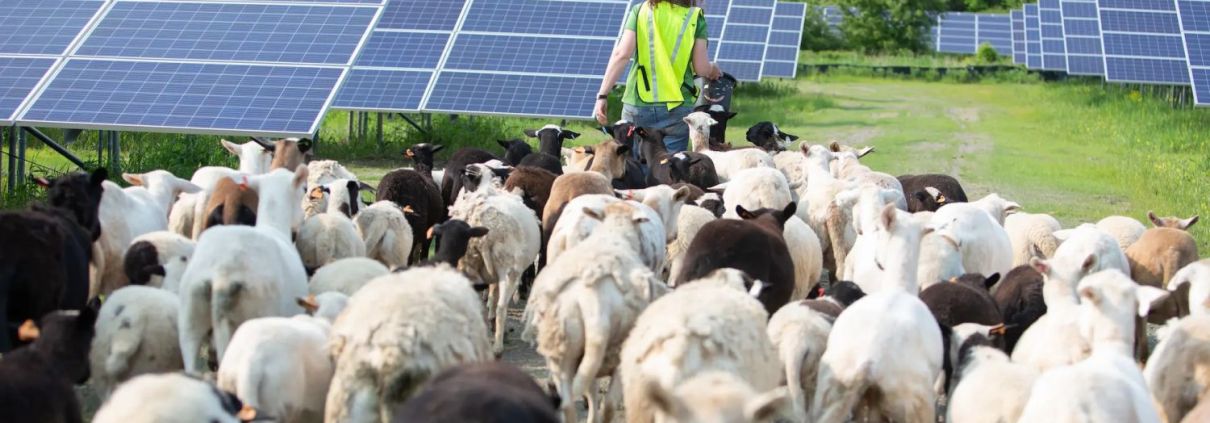 Photo Courtesy of American Solar Grazing Association