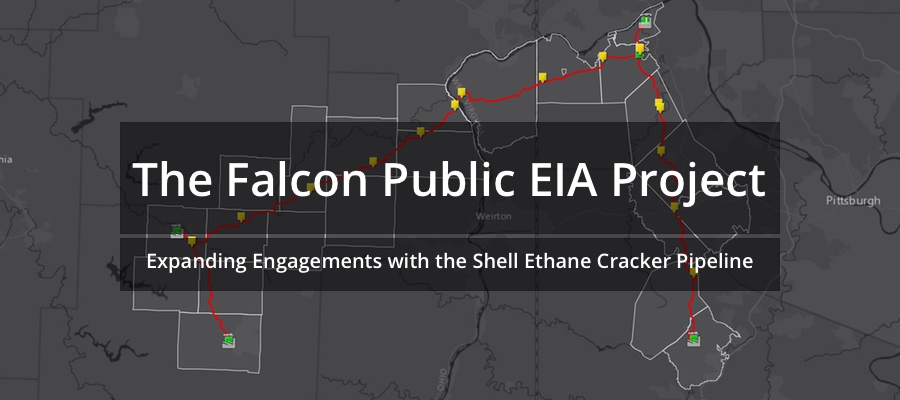
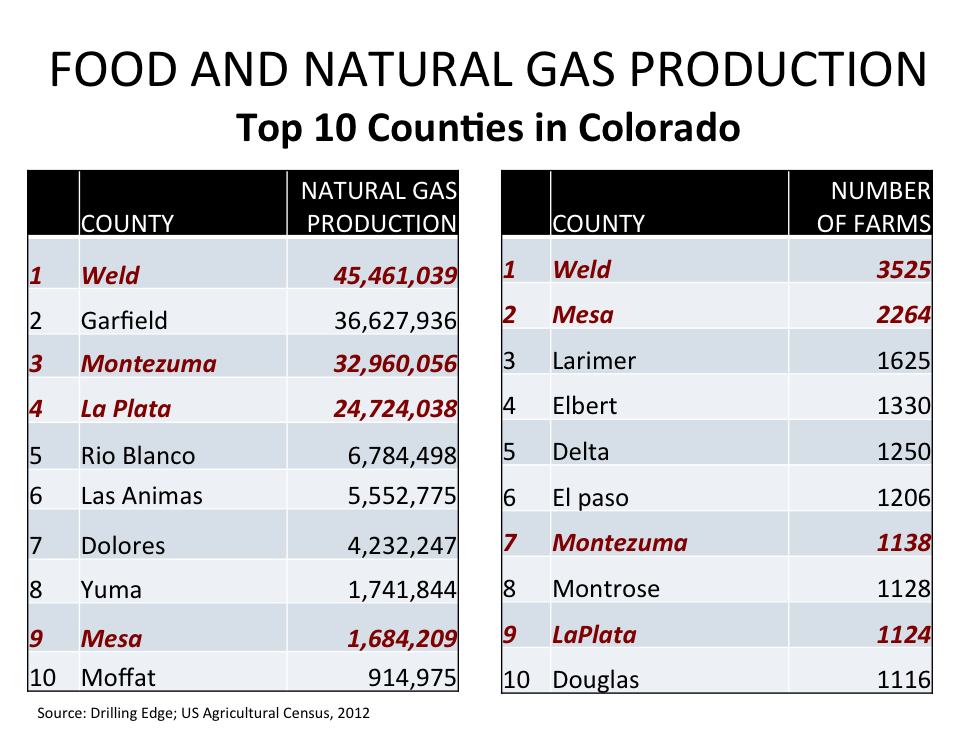
The Falcon: Routes, Facilities & Easements
Part of the Falcon Public EIA Project
In this segment of the Falcon Public EIA Project, we first focus on the route of the pipeline and prior routes that were considered. We take a closer look at the properties along the route that required easement agreements from landowners. Finally, we locate facilities that will be built as part of the project, such as metering stations and shut-off valves, as well as the pipeline’s construction areas and access roads.
Quick Falcon Facts
- 97.5 miles of proposed pipeline (an additional 200+ miles surveyed during the process)
- 2,000 parcels of land surveyed; 765 easements executed; 469 will be needed to execute the route
- Five meter pads and 18 shut-off valves
- 111 temporary access roads, 21 permanent access roads
- 1,273 acres required for construction space; 650 acres for the permanent right-of-way
Map of Falcon pipeline routes, properties, and facilities
The following map will serve as our guide in breaking down these first components. Expand the map full-screen to explore its contents in greater depth. Some layers only become visible at closer zoom levels. Click the “details” tab in full-screen mode to read how the different layers were created.
View Map Fullscreen | How FracTracker Maps Work
Finding a Right-of-Way
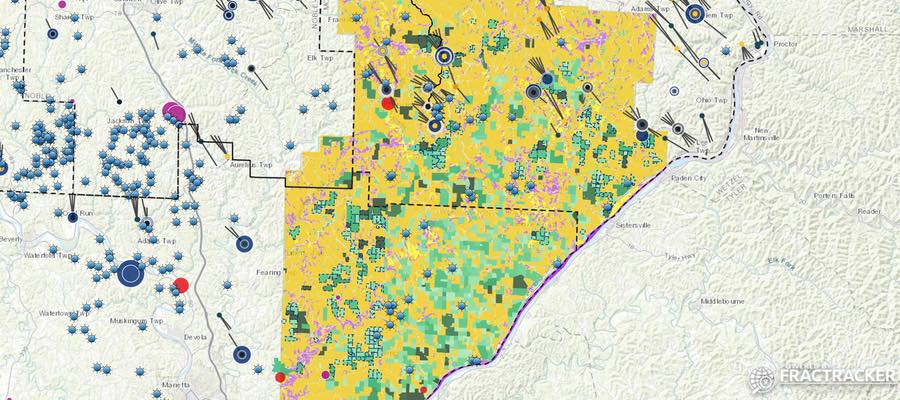
Pipeline operators must consider a variety of factors when searching for a viable right of way (ROW) for their project—the continuous stretch of land needed to construct, maintain, and operate the pipeline. This process begins with reviewing data and maps made available by federal, state, and local agencies in order to identify features that would complicate the project. These might include such things as protected wetlands, drinking water sources, abandoned mines, or heavily populated areas.
A second step is to conduct manual field surveys along their planned route. During this stage, engineers do precise measurements to determine how the pipeline will cross individual properties as well as locate site-specific concerns that need to be accounted for, such as the presence of endangered species or archeological sites. FracTracker previously produced a guide to pipeline surveying, which can be found here.
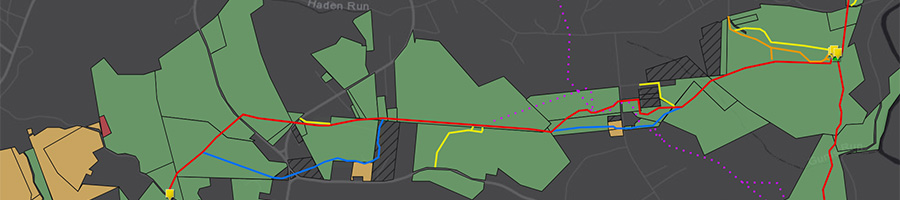
The process of finding a viable pipeline route can undergo dozens of revisions and take months or years to complete. The example image seen below, taken from our interactive map at the top of the page, shows a few of the many different 50ft. ROWs considered by Shell. These were documented every few months as the data changed.

The most recent route is highlighted in red, totaling 97.5 miles (Shell’s original press releases stated 94 miles). Segments that represent alternative routes considered in certain places are shown in blue (these earlier divergences total 19 miles). Other areas surveyed at some point in the process are shown in dotted purple (totaling 91.3 miles). Given that the route has changed very little in recent months, as well as the fact that Shell has submitted their permit applications for project, we believe that the route in red is likely the route proposed to regulatory agencies.
Note that, in the interactive map, there is an additional “Air Liquide” pipeline (this is the name of a gas products company) proposed by Shell that will run from the ethane cracker south for about .5 miles. Based on comments made by Shell at public hearings, we assume this will be a nitrogen pipeline feeding the plant from an unknown source.
Acquiring Easements
Perhaps the most significant factor that can determine a pipeline route is finding landowners amenable to having their land surveyed and, ultimately, willing to sign easements to allow the pipeline on their property. In some instances, pipeline companies can be granted eminent domain as a “public utility” to take land by force (ME2). However, Shell has stated publicly that eminent domain in not an option for Falcon, due to the fact that the pipeline services a private facility. FracTracker previously produced a guide for landowners who might be approached by pipeline operators seeking to survey their properties.
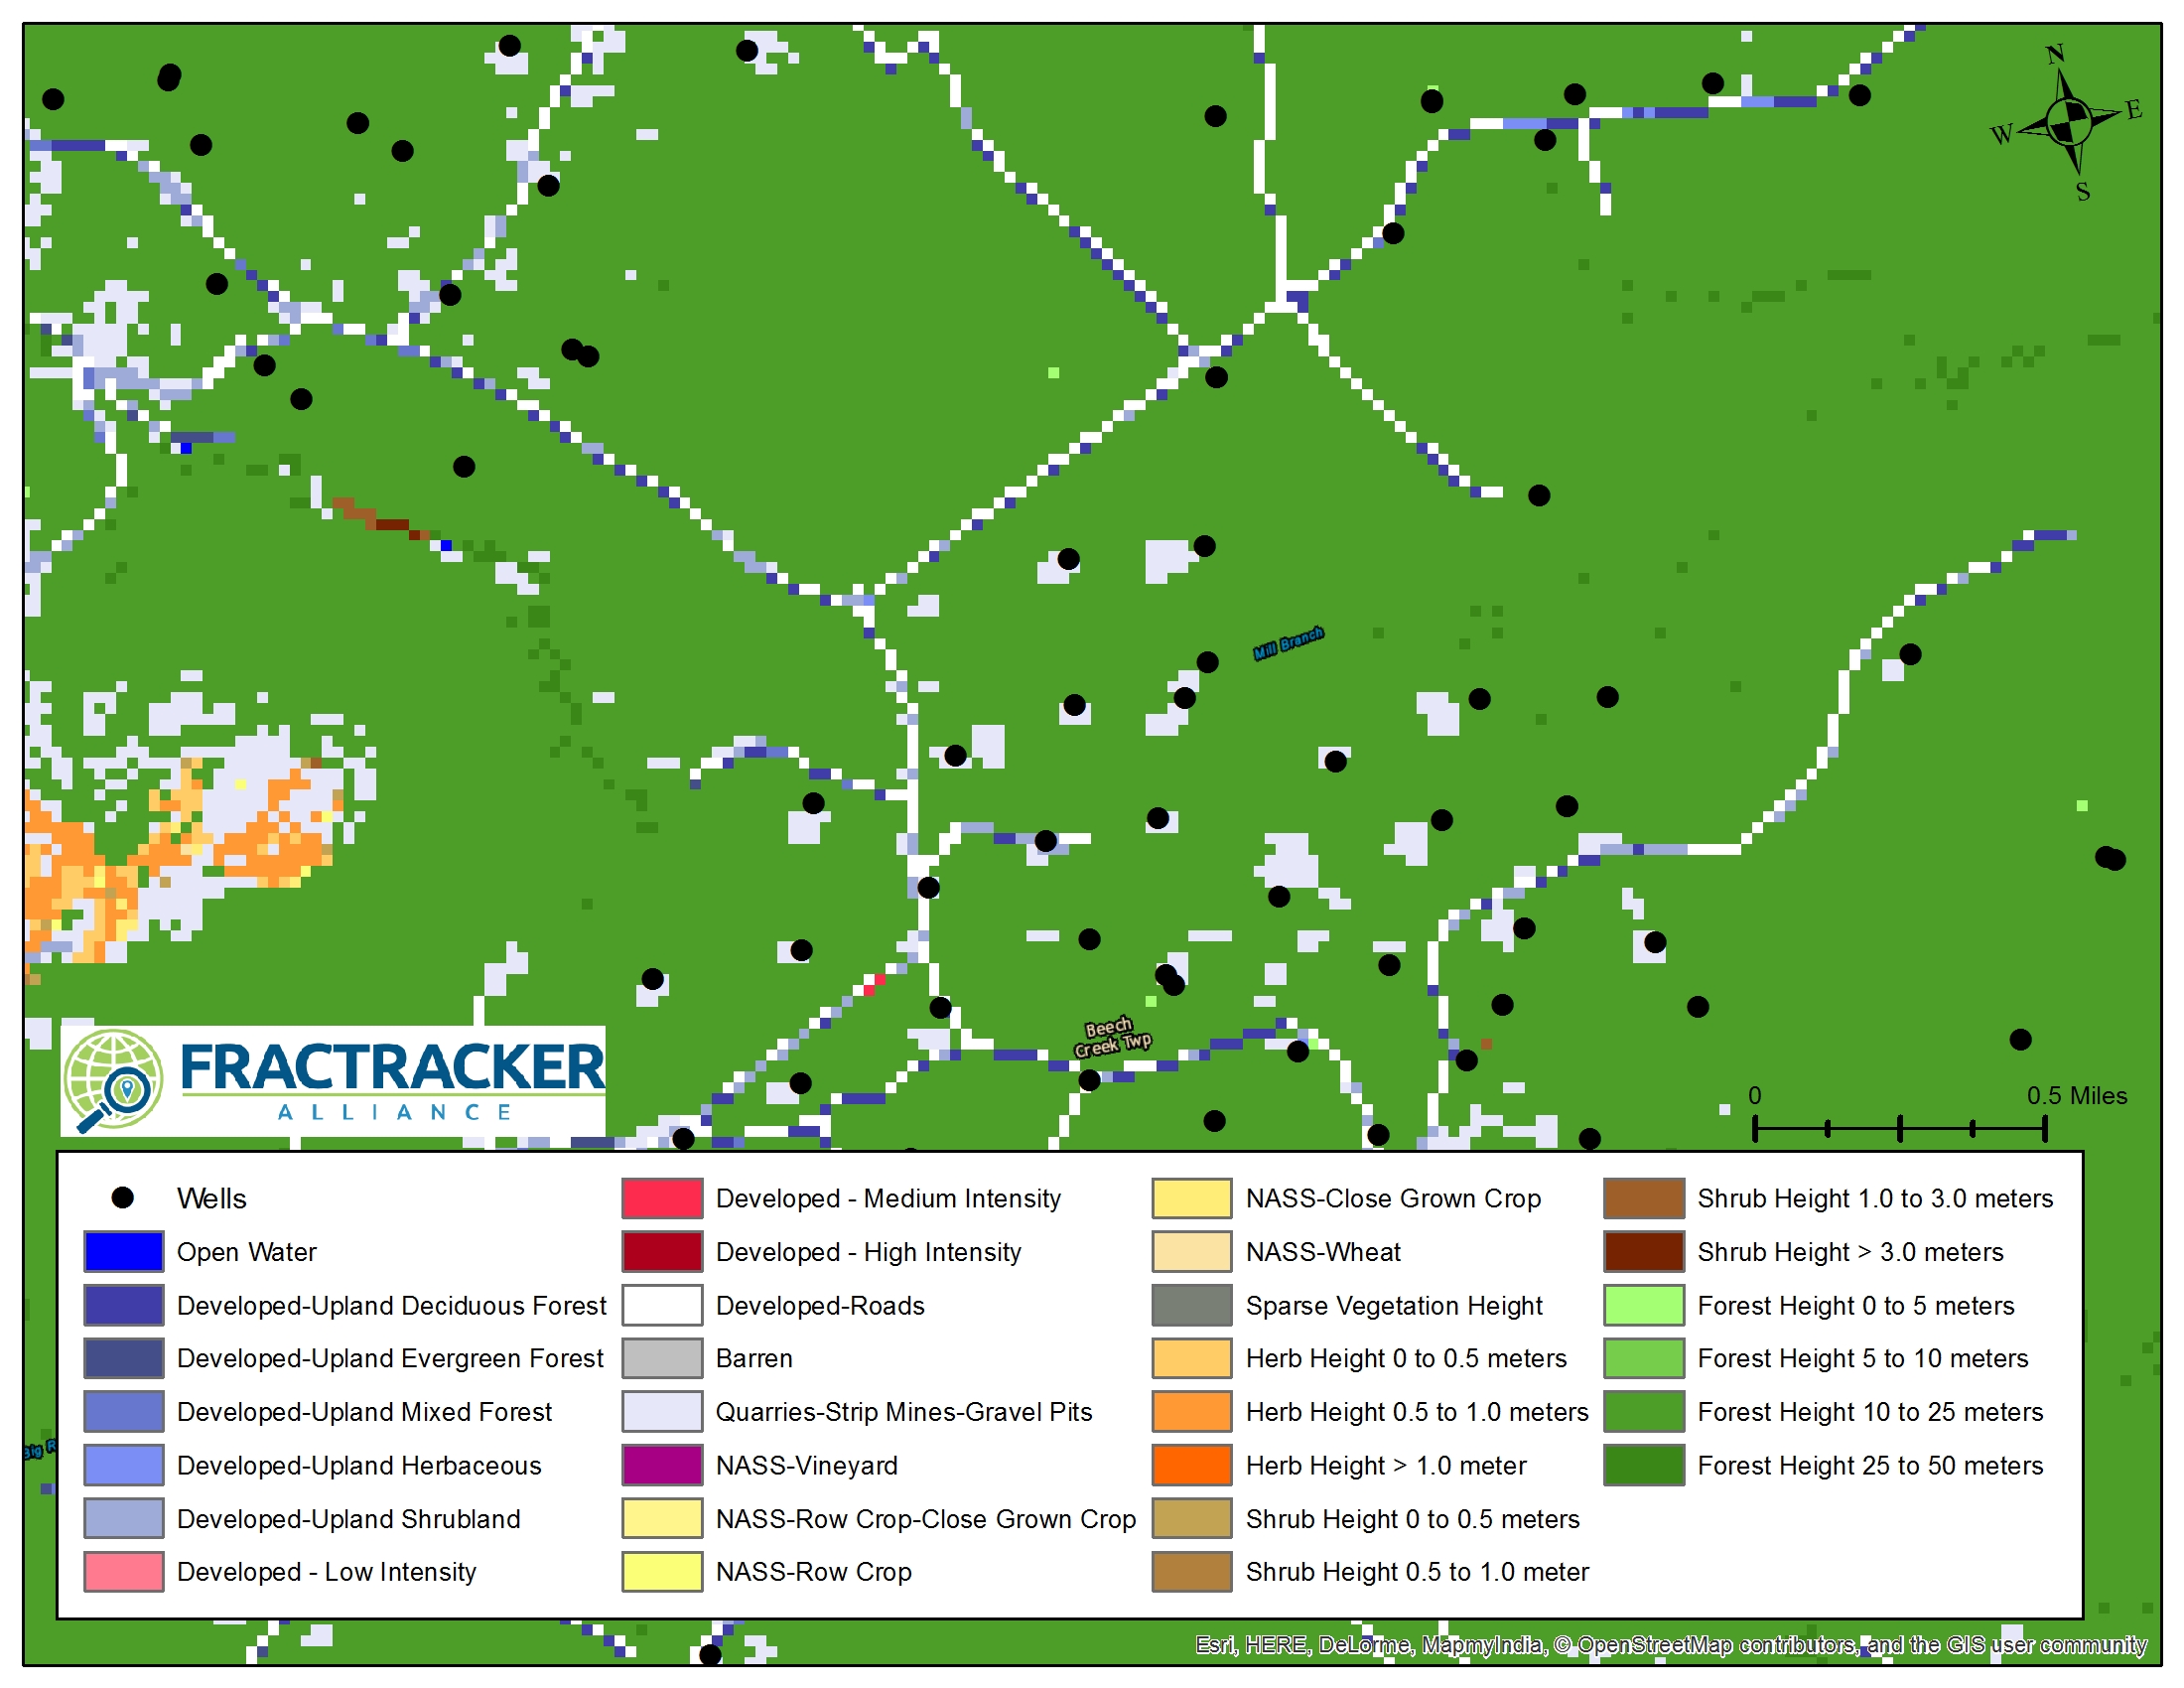
The Falcon pipeline will have a permanent ROW of 50ft that will cross 10 municipalities in Pennsylvania, 12 townships in Ohio, as well as northern Hancock County, West Virginia. More than 2,000 individual parcels of land were surveyed across this region. Of those 2,000, Shell approached landowners for 765 unique parcels at some point in the process to obtain easements, either for the pipeline ROW itself or for access roads.
![]() To date, Shell has executed 572 easements. Of these, 469 will be needed to execute the current proposed route. However, as of this time, 14 parcels along the proposed route are still listed as “landowner contacted,” meaning that the easement has not yet been executed. The image below is a page from Shell’s permit applications to the PA DEP listing properties pending in Pennsylvania.
To date, Shell has executed 572 easements. Of these, 469 will be needed to execute the current proposed route. However, as of this time, 14 parcels along the proposed route are still listed as “landowner contacted,” meaning that the easement has not yet been executed. The image below is a page from Shell’s permit applications to the PA DEP listing properties pending in Pennsylvania.

Media sources have reported on some of the details of Shell’s Pipeline easement agreements. In some instances, contracts stated a transactional price of $10 per linear foot as a “placeholder” to get the process started. In other cases, Shell has paid landowners as much as $75 per linear foot of pipeline. These agreements also state that Shell reserved the right to “lay, construct, test, maintain, inspect, operate, repair, renew, relocate, replace, substitute, change the size of, upgrade, alter, mark, protect and remove or abandon in place” any pipelines on the property. Below is an example of how our interactive map represents these parcels and their status. For instance, executed easements are in green and pending or stalled agreements in yellow.

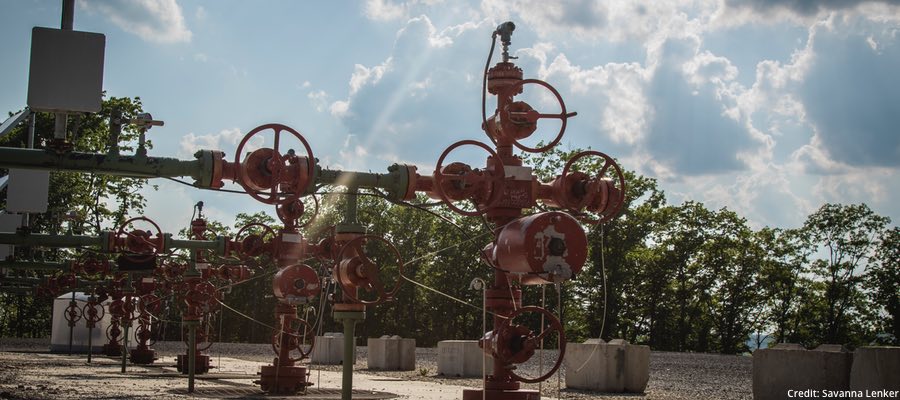
Valves & Metering Stations
Pipelines require a number of facilities to properly manage the flow and pressure of gas from one end of the line to another. For instance, metering stations are installed to measure how much gas is in the pipeline system at given points. Falcon has five “pads” where metering stations will be located. Three of these are co-located at the origin points of the pipeline (the MarkWest separator facilities) and a fourth at the ethane cracker end-point. However, the fifth meter stations will be located where the two legs of the pipeline meet in northeast Raccoon Township, Beaver County, PA. This site is called the “Junction” meter pad.
Shut-off valves will also placed along the route—18 in all for Falcon—in order to section off lengths of the pipeline that can be turned off as needed. These valves will be located at fairly regular intervals of 8-10 miles in most places, but are also found just before and after sensitive locations, such as the Oho River crossing and areas and where the lines juncture.
The Risks of Proximity
Metering stations and shut-off valves bring particular risks. For instance, when valves are closed at a section of pipeline for maintenance, or in the event of an emergency, excess gasses must vented to relieve pressure. This is one reason why communities have become concerned about the location of these facilities, such as with a Mariner East 2 pipeline valve in West Goshen Township, PA. Similarly, the Falcon pipelines’ valve in New Somerset, OH, is especially close to residential areas, seen below.

Workspaces & Access Roads
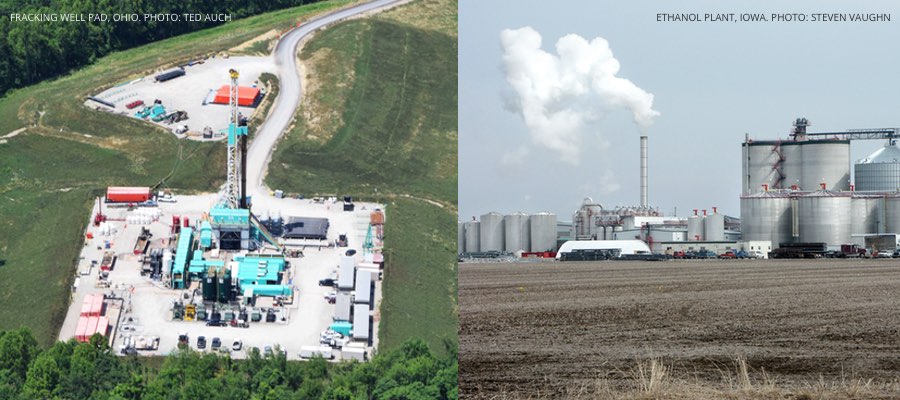
Finally, pipeline operators must identify in their permit applications the “workspace” needed for construction. Shell’s temporary ROW for workspace is approximately 100ft in most stretches along the Falcon’s route, similar to what is shown in the image below. Site-specific conditions, such as road, railroad crossings, and buildings make the workspace narrower in some instances, but much larger workspaces will be needed around sites like metering stations and shut-off valves.

The locations of access roads must also be identified in permit applications. Access roads come in two categories and typically require a 25ft ROW. Temporary access roads are used during the construction process and often utilize existing private driveways, farm roads, or are built after clearing land acquired in the easement process. Permanent roads allow long-term access to facilities, such as valves and pumping stations, as well as for bringing in equipment to maintain the pipeline’s ROW. Shell’s plan proposes 111 temporary access roads (28 miles) and 21 permanent access roads (2.3 miles).
Shell’s permit applications state that the total disturbed workspace needed for construction and access roads is approximately 1,273 acres. About half of this will remain cleared for the permanent right-of-way and permanent access roads.
A Closer Look
When a pipeline project is subject to regulatory review, alternative routes are typically offered up by the operator for consideration in weighing different costs and benefits. Major reroutes typically deviate from the proposed route for significant distances in order to avoid significant impediments such as large cities or protected lands. Minor alternatives are shorter in length and used to avoid specific areas of concern, such as a protected wetland. An alternative route might also be selected in order to utilize an existing ROW from other pipelines.
Ohio River Crossing
As noted, there are a number of places along the Falcon route where we see examples of major route changes. Many of these reroutes appear to be due to landowners along the preferred path not signing easements for one reason or another. One of the more significant change occurred at the location where the Falcon crosses the Ohio River in Hancock County, West Virginia, seen below. For many months, Shell’s maps showed a planned crossing south of the current proposed route, but later took a dramatic diversion to the north, apparently due to an easement not having been executed for a single property. What is notable about the new route is that it utilizes property owned by the popular Mountaineer Casino, Racetrack, and Resort.

Fort Cherry Golf Course Reroute
In another instance, we see a reroute near the Fort Cherry Golf Course in McDonald, Washington County, PA. An earlier route took the Falcon straight through the course, whereas the current proposed route goes further east, disrupting a smaller number of fairways. Notice in the image below that a temporary access road for the pipeline’s construction will also still utilize Fort Cherry Golf Course’s driveway.

Montour Trail Intersections
![]() Finally, we bring attention to what appears to be some of the few remaining properties with easements not yet settled in order to begin construction. As noted in the excerpt from Shell’s permit application at the top of this page, a number of parcels owned by the Montour Trail Council have a status of: “in negotiation and depended on submitted crossing permit applications,” presumably meaning they would agree to the easement if PA DEP approved Shell’s permits.
Finally, we bring attention to what appears to be some of the few remaining properties with easements not yet settled in order to begin construction. As noted in the excerpt from Shell’s permit application at the top of this page, a number of parcels owned by the Montour Trail Council have a status of: “in negotiation and depended on submitted crossing permit applications,” presumably meaning they would agree to the easement if PA DEP approved Shell’s permits.

The Montour Trail is a 46-mile long multi-use non-motorized recreational rail-trail located in Washington and Allegheny County, PA, used by more than 400,000 people annually. It also makes up part of the Great Allegheny Passage (GAP), a trail system that stretches over 335 miles from Pittsburgh to Washington, DC. The trail is managed by the nonprofit Montour Trail Council with support from state agencies such as the Pennsylvania Department of Conservation and Natural Resources (DCNR).
We were surprised to find that the Montour Trail will be crossed by the Falcon in 9 locations: 5 by the pipeline itself, 3 by temporary access roads, and 1 by a permanent access road, as illustrated in the image above. Two of the pipeline intersections will be executed using HDD boring. The trail and its intersection with the Falcon can be seen by activating these layers on FracTracker’s interactive map, as illustrated in the image above.
* * *
Related Articles
By Kirk Jalbert, FracTracker Alliance


")
")
")
")
")
")

")

")


")
")


