Fracking in Dairy Country
A dairy farmer in Wisconsin reflects upon a new industry in town: frac sand mining, how it is perceived, and where the industry is headed.
By Paul Jereczek
Jereczek Homestead Dairy, Dodge, Wisconsin
In 4th grade, every Wisconsin student learns about their state. Topics pertaining to Wisconsin’s economy, geography, and history along with ethnicity and traditions are introduced and explored. State facts and anecdotes are discussed and naturally memorized. The one that stood out to me the most was how Wisconsin became known as the “Badger State.”
The origin of the badger nickname is from mining. The 4th grade story I remember was that miners were too busy to build houses so they moved into abandoned mineshafts and/or dug their own burrows. These men became known as “badgers.” The 4th grade version of myself thought that was real impressive. I pictured strong, hard working men fiercely toiling away in the earth like mythical creatures, helping make Wisconsin what it is today.
It made for a great story.
Back to Reality
The reality and documentation of the times suggests something different. Most miners lived in cabins or other structures above ground. There most certainly were a few outliers on the fringe of mining society who burrowed their own holes or lived in abandoned underground mines, but the adult version of myself has a hard time imagining that the term used to describe such men – badgers – was used as a compliment.
Either way, the result is the same. Word spread and eventually Wisconsin became known as the Badger State. The state may be known worldwide for its cheese and agriculture, but there was mining in Wisconsin long before the first dairy cow. While the state was earning its nickname, mining was a prominent reason for the early success of the region.
Dairy Farming in WI
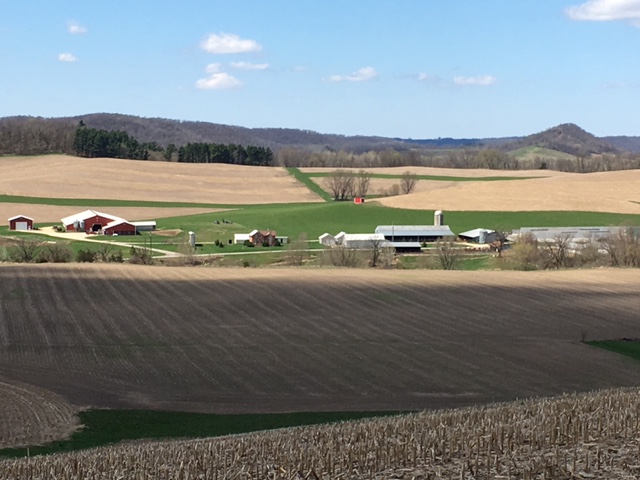
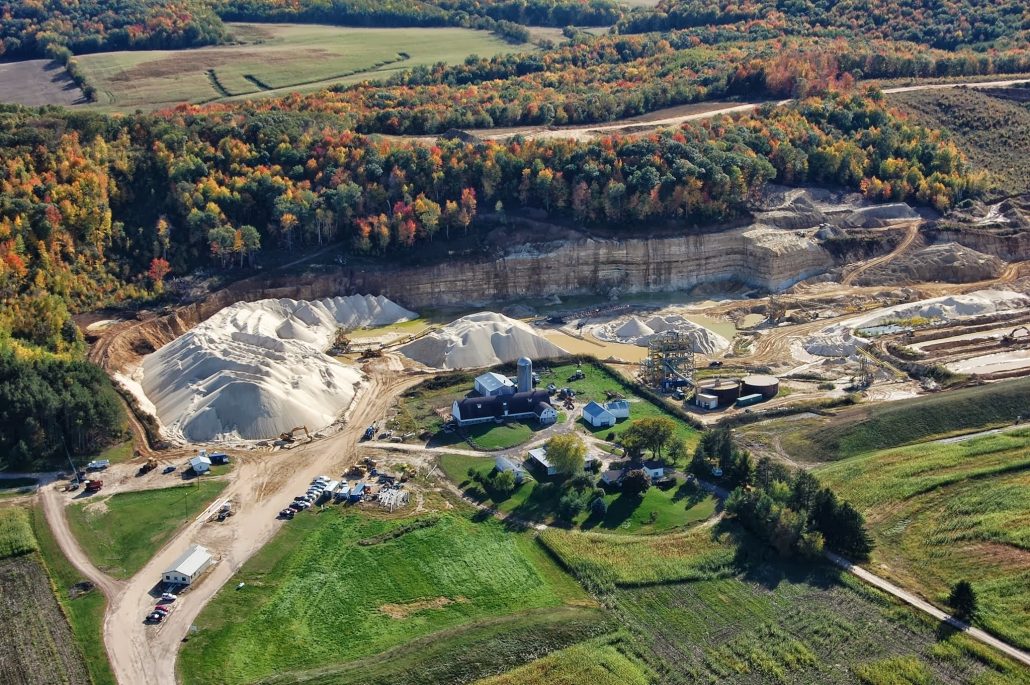
The 700 acre Jereczek Homestead Dairy in Dodge Township, Trempealeau County, Wisconsin first established in 1873 and now being operated by the 6th generation of Jereczeks.
Our farm is in Trempealeau County, Wisconsin – a driftless area – meaning the land was not covered by glaciers during the last ice age. The terrain is hilly and uneven, with tree-topped bluffs and hills overlooking valleys. The valleys, ranging from deep and narrow to wide and shallow, bump and flow into each other. Over the years, our farm has received its fair share of breaker rock, crushed rock, and gravel from the prevalent rock quarries. Sandstone deposits are huge and close to the surface. As a kid, there was a ledge in the cow pasture, where I hunted through chunks of sandstone for fossils.
As with everything else in the world, dairy farming continues to change. Most barns sit derelict and hold only memories of cows as they fade into the landscape. Small farms that clung to the valley walls have been sold to bigger operations, sit vacant, or have been built over. A lot of once prime farmland has been converted into houses with ridiculously large lawns. In 1990, Wisconsin had over 34,000 licensed dairy herds. Now there are just over 9,000.
We are the last dairy farm in our valley. Parallel to the trend, my childhood herd of 40 cows has turned to 200, which is about an average-sized herd. Margins are tighter than ever. Consistent help is hard to find. Milk prices are a terrible rollercoaster ride – it seems to take forever for them to go up, but when they fall, it’s fast and sickening. In the dairy business world, survival is a measure of success.
Frac Sand Mining Perceptions
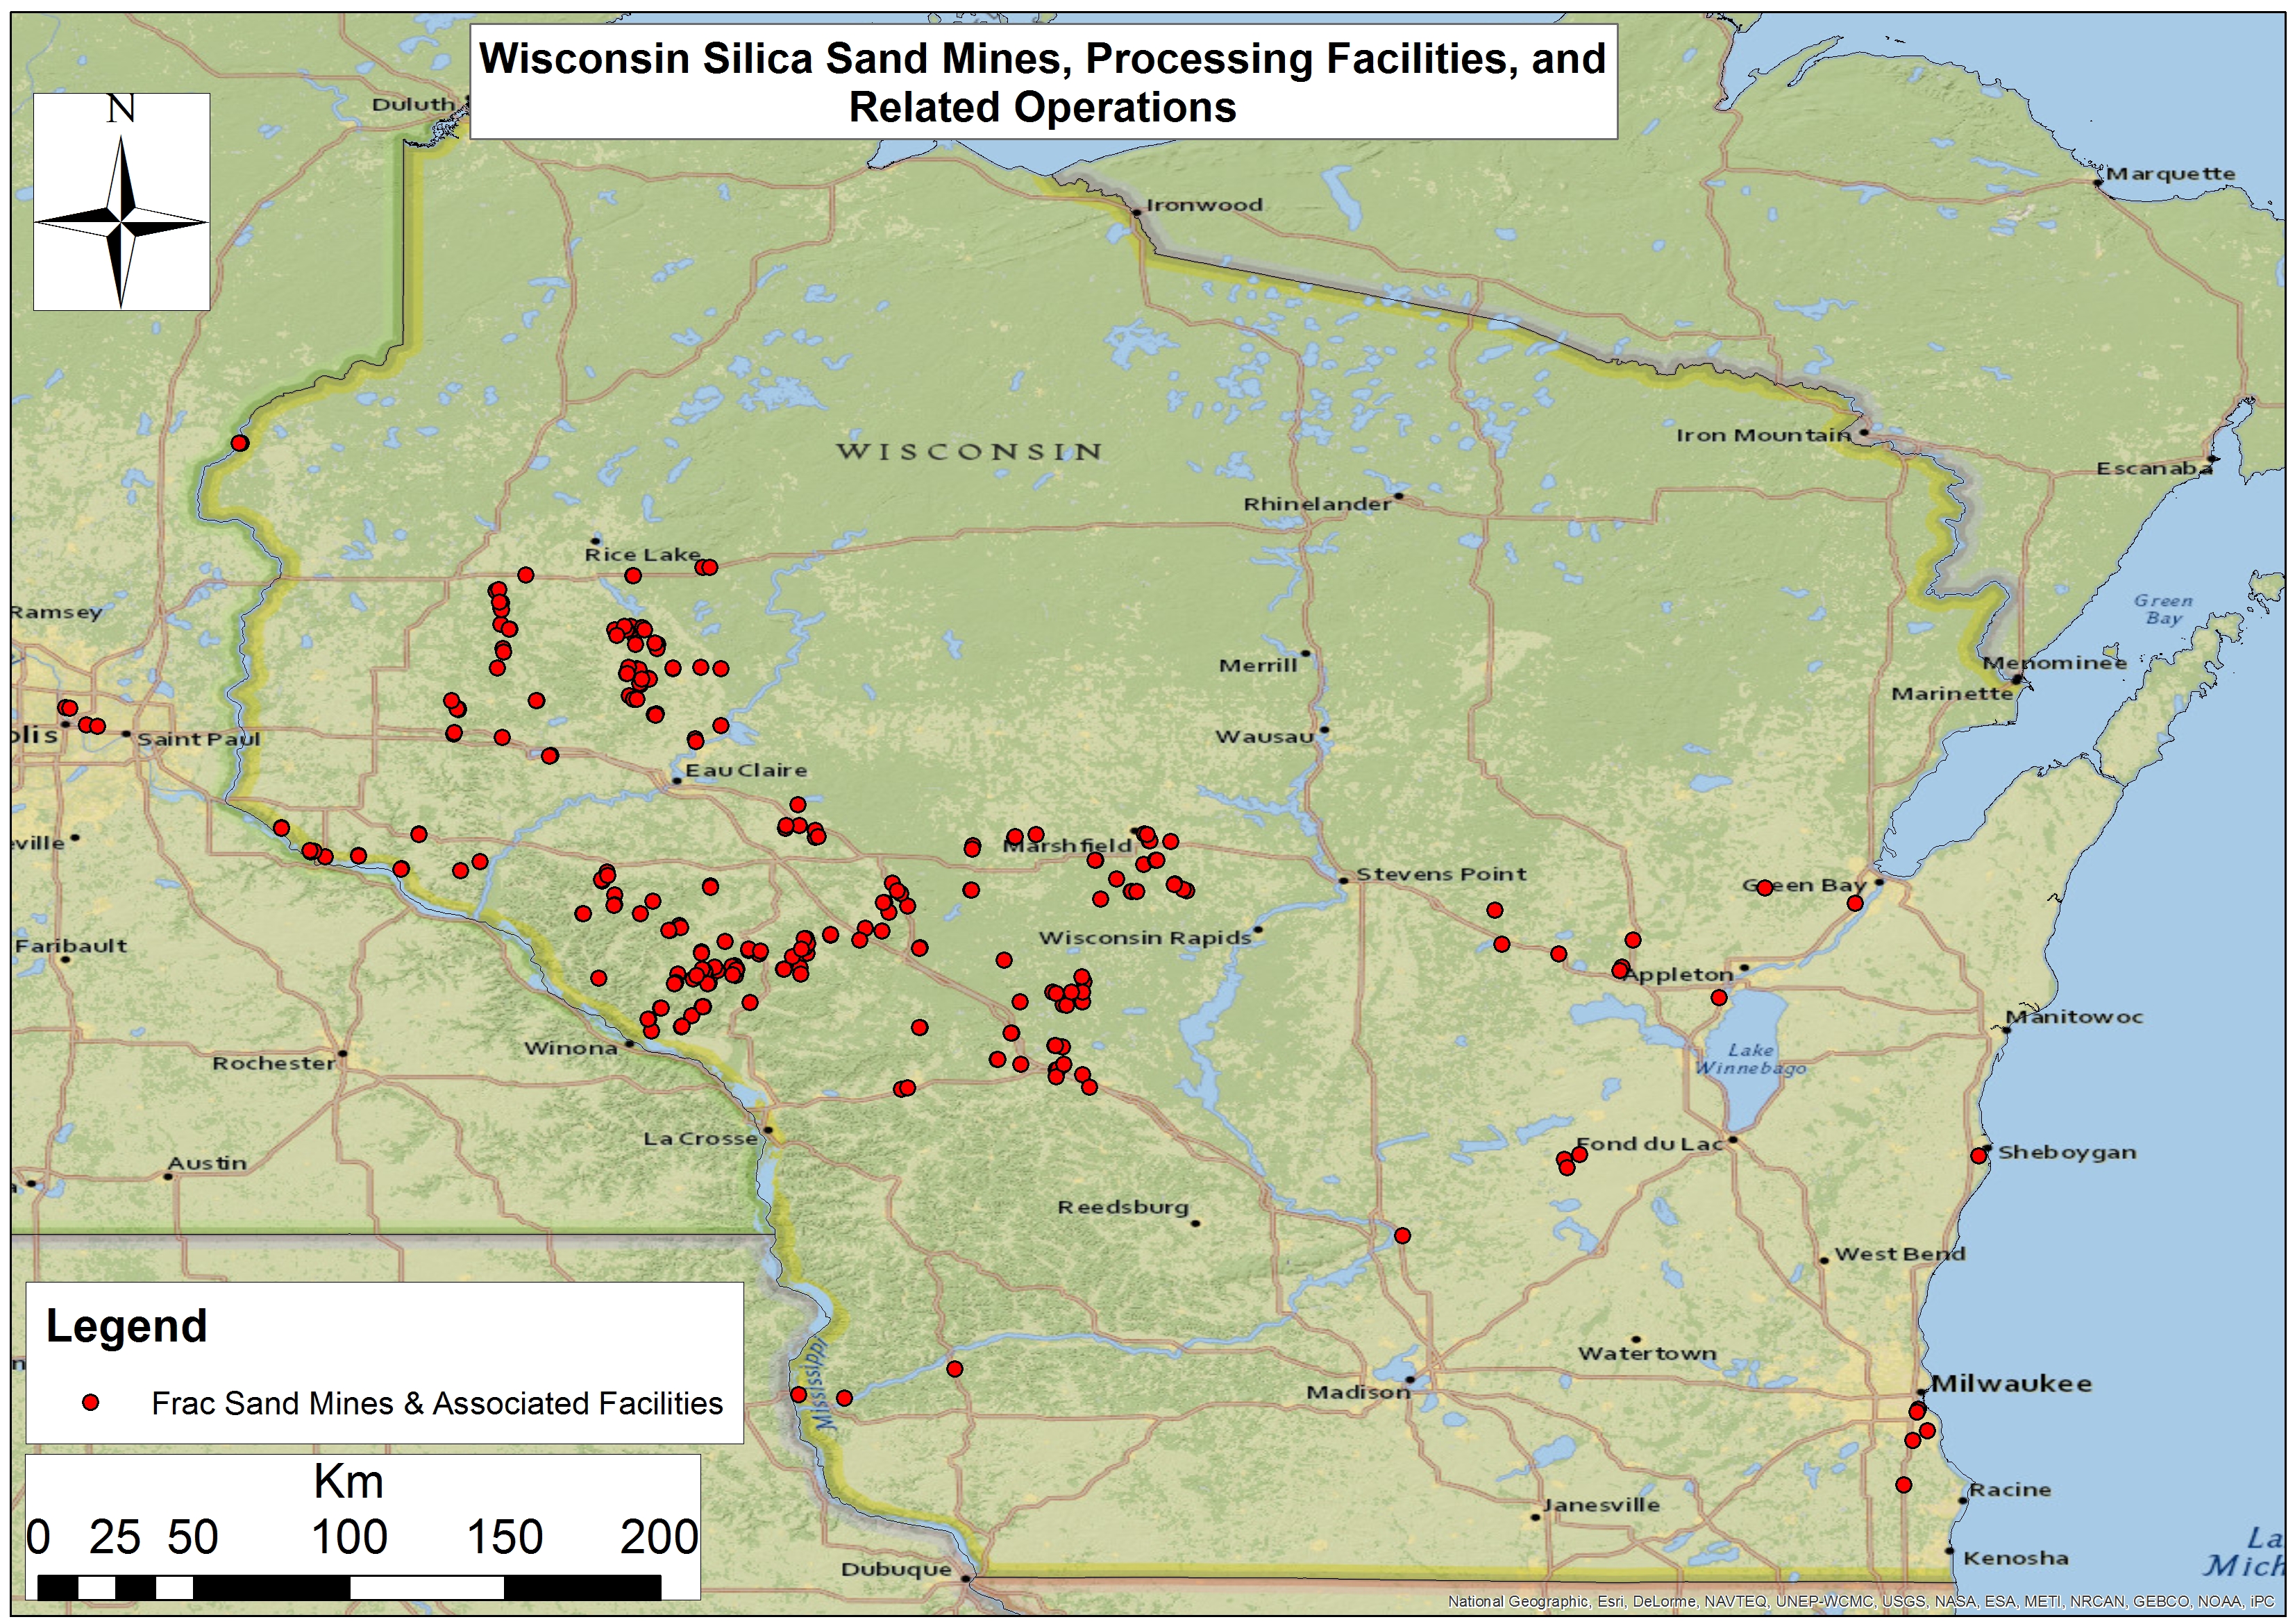
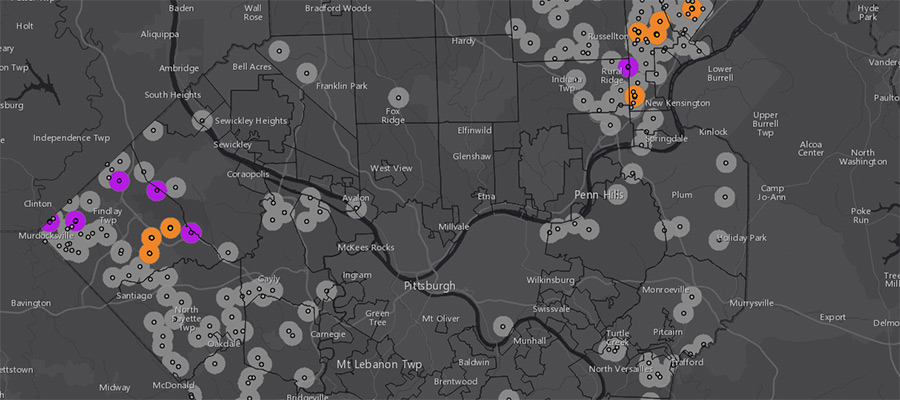
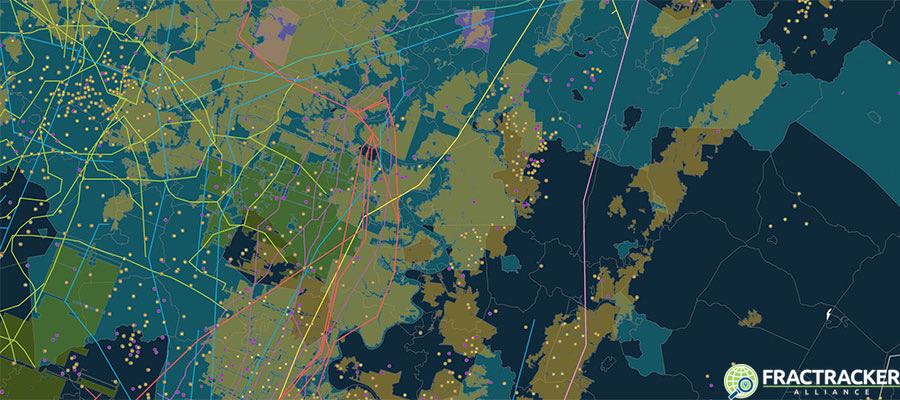
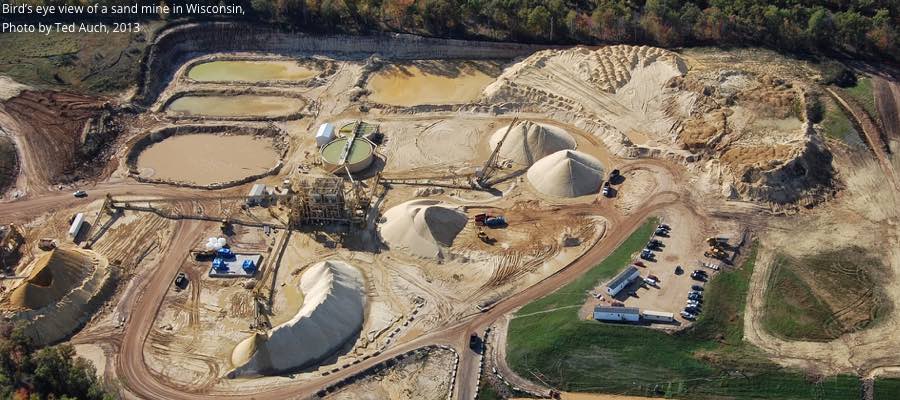
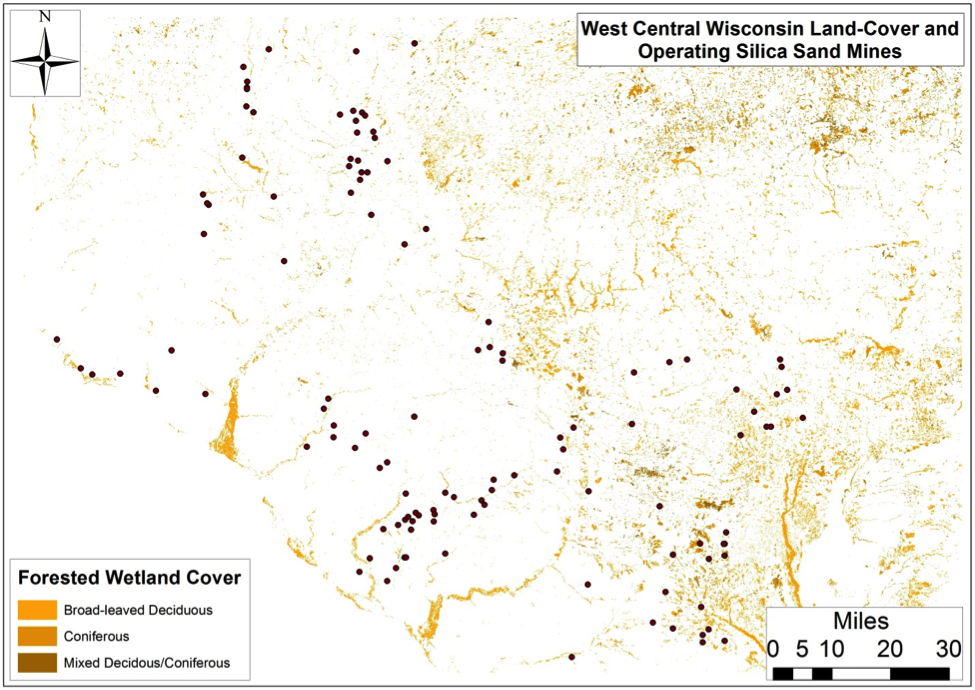
Wisconsin Frac Sand Mines, Processing Facilities, and Related Operations
The term frac sand is relatively new to me. I always assumed sand was sand and had given the word sand a negative connotation. Sand’s large particles don’t hold moisture or nutrients well, so sandy fields tend to perform poorly. But what if that sand has value for something else? What if there is a market for this sand much like a market for corn or soybeans?
Farmers tend to be resourceful. Every asset is scrutinized and employed to the fullest. Every acre is pushed. But what about what may lie beneath the soil? Sand mining has been going on in Wisconsin for well over a hundred years, but the recent surge in fracking has created an enormous demand for frac sand – and there are many people and companies set to take advantage of the boom.
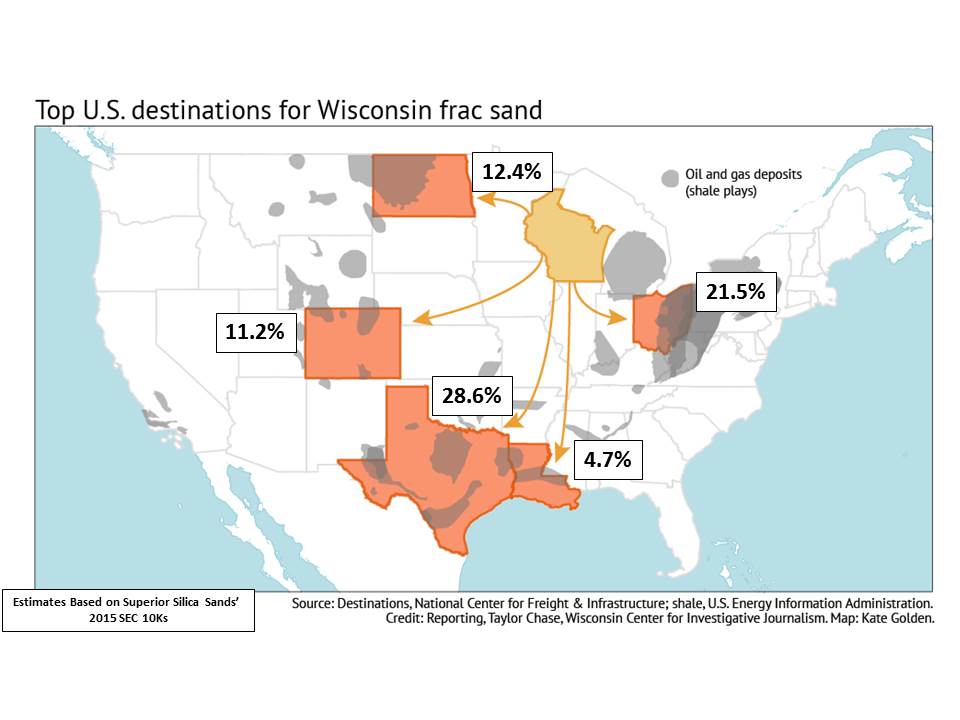
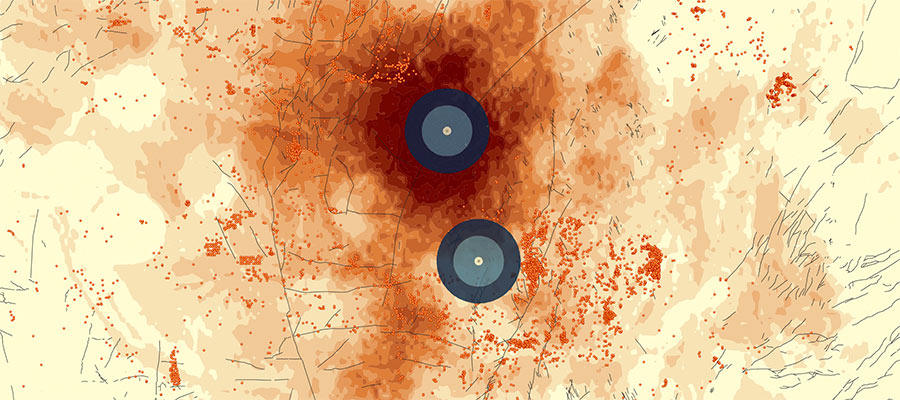
Top U.S. Destinations for Wisconsin’s Frac Sands Estimated from Superior Silica Sands’ 2015 SEC 10Ks
Trempealeau County has zoning and planning ordinances to protect its industries and way of life. These aggressive ordinances allow more citizen input than other county’s ordinances. Public hearings are required, and orderly processes are enforced. With the economics involved with frac sand mining, citizens got educated very quickly. Much like abortion or immigration, frac sand has become a polarizing subject. Strong emotions built up by personal ideologies have pushed this topic to a boiling point. The for and against groups trade barbs without much convincing being done on either side. Frac sand mining editorials are common in local papers with those against appearing to be the most vocal and emotional.
New Player, New Approach
One such editorial detailed the approach a sand company took to obtaining a property. A local farmer had a sand mine company representative approach him with an oversized check written out to him for a sizable amount of money for his land. It was as though the sand rep was taking a page out of the Publishers Clearing House’s playbook. The farmer turned down the check. The sand rep left and returned a short time later with a significantly larger offer. The farmer was equally surprised and insulted. He found out later a few neighbors turned down similar proposals.
So what’s the deal with such a brazen approach? Intentions from this company may well have been good. Many people believed the sand mines were a win-win opportunity. Companies were selling hype – there was no way for anything but success. Extreme optimism. Sand mines were going to increase the tax base, fund schools and roads. Concerns were minimized, and residents were told what they wanted to hear. Such talk produced plenty of skeptics.
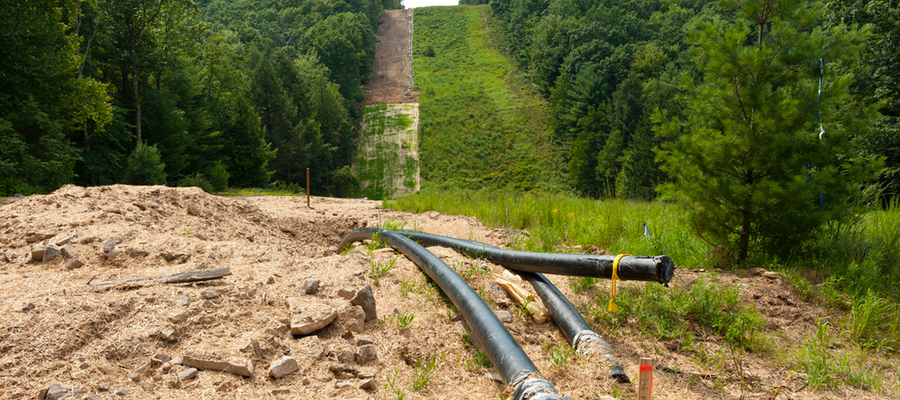
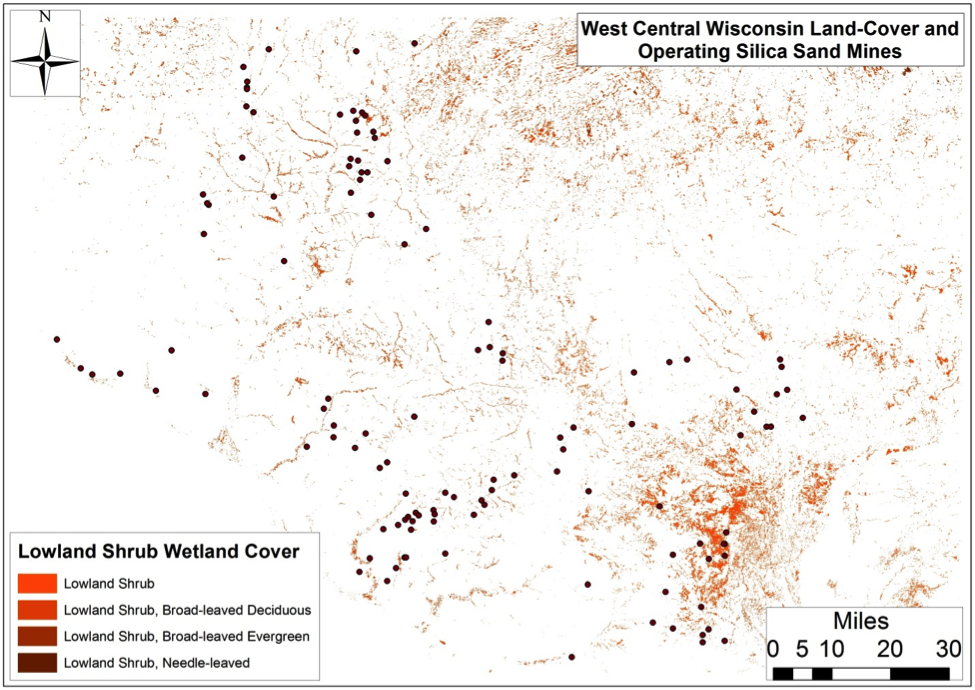
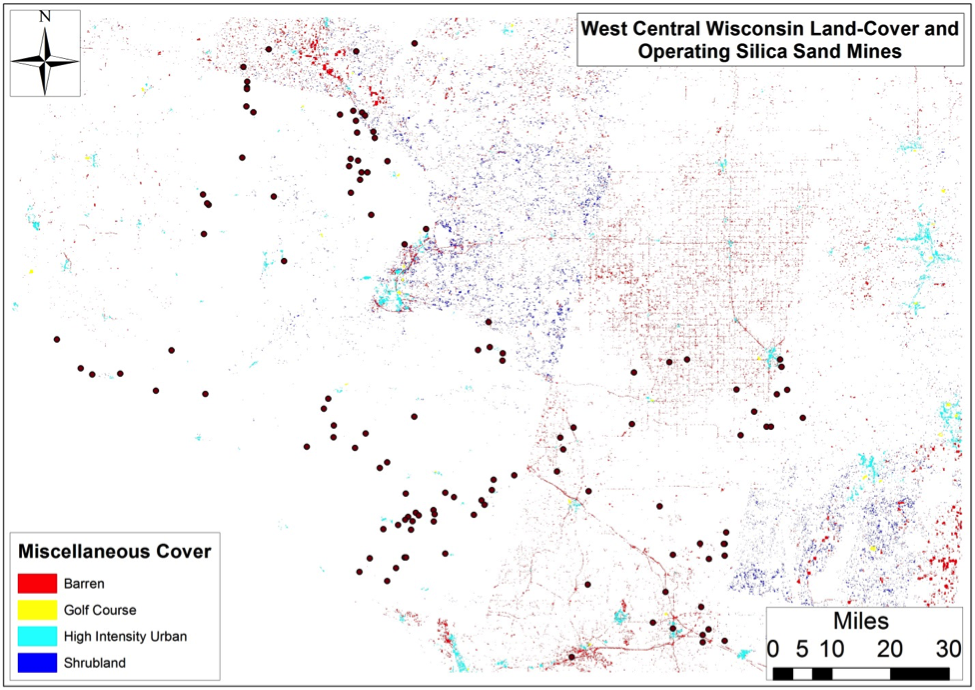
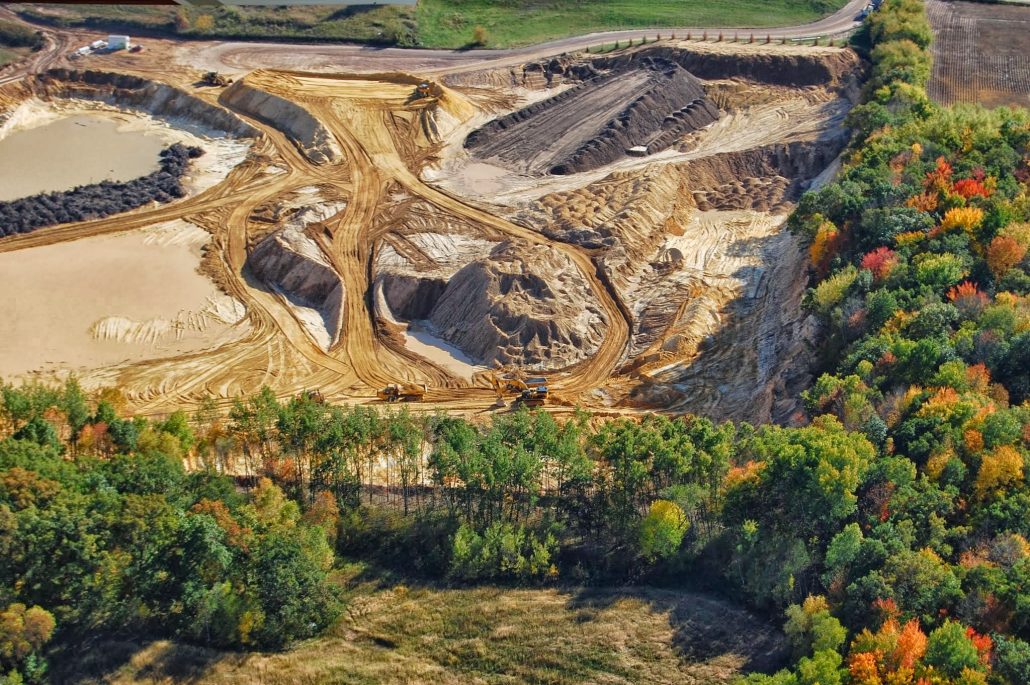
Environmental Costs of Frac Sand Mining
With both dairying and fracking, there is an environmental cost. Whether you milk 10, 100, or 1,000 cows – there are environmental pressures. With sand mining, the environmental effects are well documented. It is important, if not just practical, to measure these with the fiscal rewards. And where does this money go and who benefits the most? But, most importantly, who must deal with the consequences?
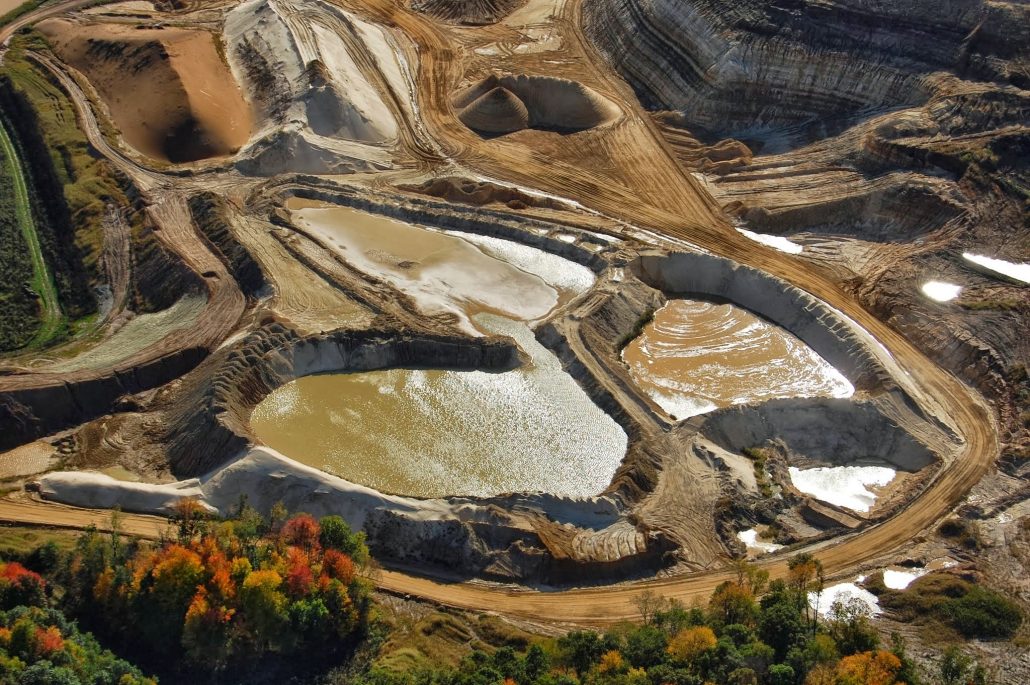
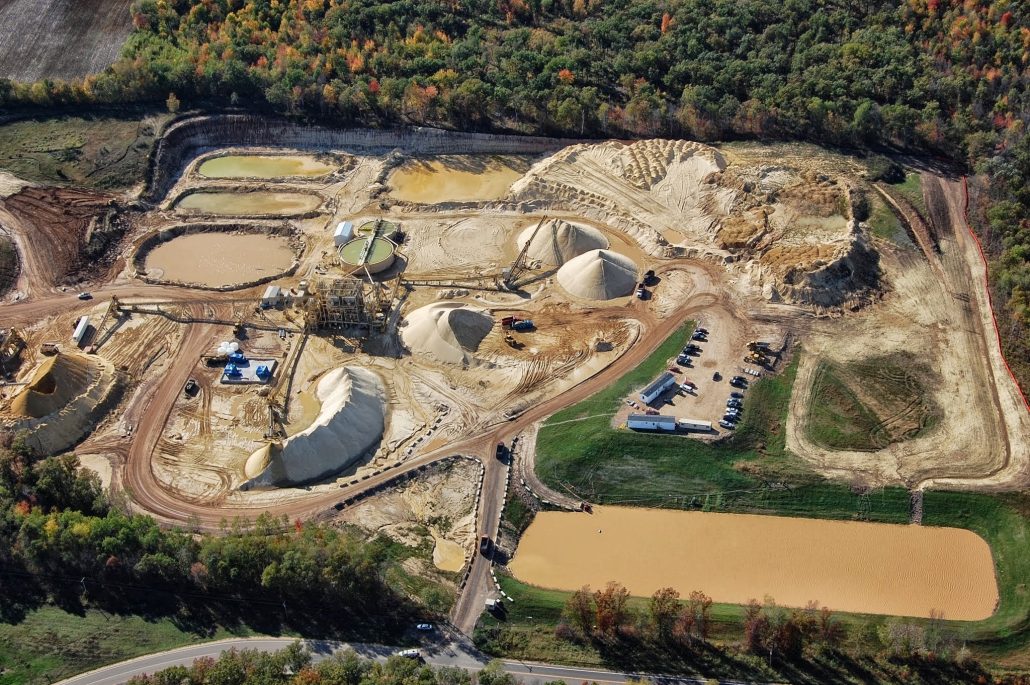
The risks of sand mines can be mitigated if proper regulations are taken seriously. With the extra scrutiny, a magnifying glass was placed over the sand mines, and what was found only proved the skeptics right. Trapping or pooling storm water seemed to be a learning process for sand mine companies; reported in 2012, every operating sand mine in Trempealeau County had storm water runoff violations. In 2014, over half of the sand mines in all of Wisconsin had violated environmental regulations imposed by the Department of Natural Resources. Add to this loss of surrounding property values, damage to roads, and a damper on quality of life – and you’ll create a substantial amount of public backlash.
Regulations Have Their Place
As was mentioned earlier, mining Is not new to the state. There are many multi-generational mining companies who have the experience, tradition, and financial network to abide by current standards and environmental regulations. Nobody likes to be told what to do. No industry is out there begging for more regulations. Often, the rules are in place to protect – not hinder – those that use environmentally safe and humane practices. Dairying has its own unique regulations – some are good, some not so much, and some downright stupid. Yet, overall it can be argued that these regulations protect the industry and the environment.
One heated topic in the dairy industry involves the sale of raw (unpasteurized) milk. It is illegal for any dairy in the state to sell raw milk. I have been drinking raw milk straight from the bulk tank since before I can remember. Our whole family did. Now, I still drink it and so do all my children from the age of a year and a half on up. None of us has ever had trouble with it. However, I am in complete agreement that the sale of raw milk should be illegal. All it takes is for one child to get terribly sick (which most certainly would happen) and for that kid lying on a hospital bed being blasted by every news network in the nation. These images create strong negative emotions that reverberate throughout society. The potential costs far outweigh the economic benefits from such a sale. Sure, some people are upset, but the greater good is maintained by taking away a risky practice.
The same principle works for mining. Rules and regulations get negative press and reaction, but who stands to lose the most from environmental catastrophes related to mining – the company in business 90-some years or the startup mining ventures trying to capture lightning in a bottle? Some companies have built years of trust and compatibility and support for their local communities. These are businesses that will remain after the sand rush has fizzled.
Booms and Busts, Ups and Downs
The frac sand industry is going through the same economic cycle as the dairy industry. The sand companies are getting better at what they do and increase their production capacity. Like milk, sand is a commodity. As the price of sand decreased, production increased to maintain profits. The dairy industry does the same thing, by expanding and improving efficiency to get more milk to catch those dollars slipping away. However, when the market is flush with milk or bombed with sand, they’re just doing more damage to themselves. This is a simplified take on the industry, as there are many global factors that come into play, but the overall pattern tends to remain. As the dairy industry can attest, this fluctuating cycle is not sustainable for all producers.
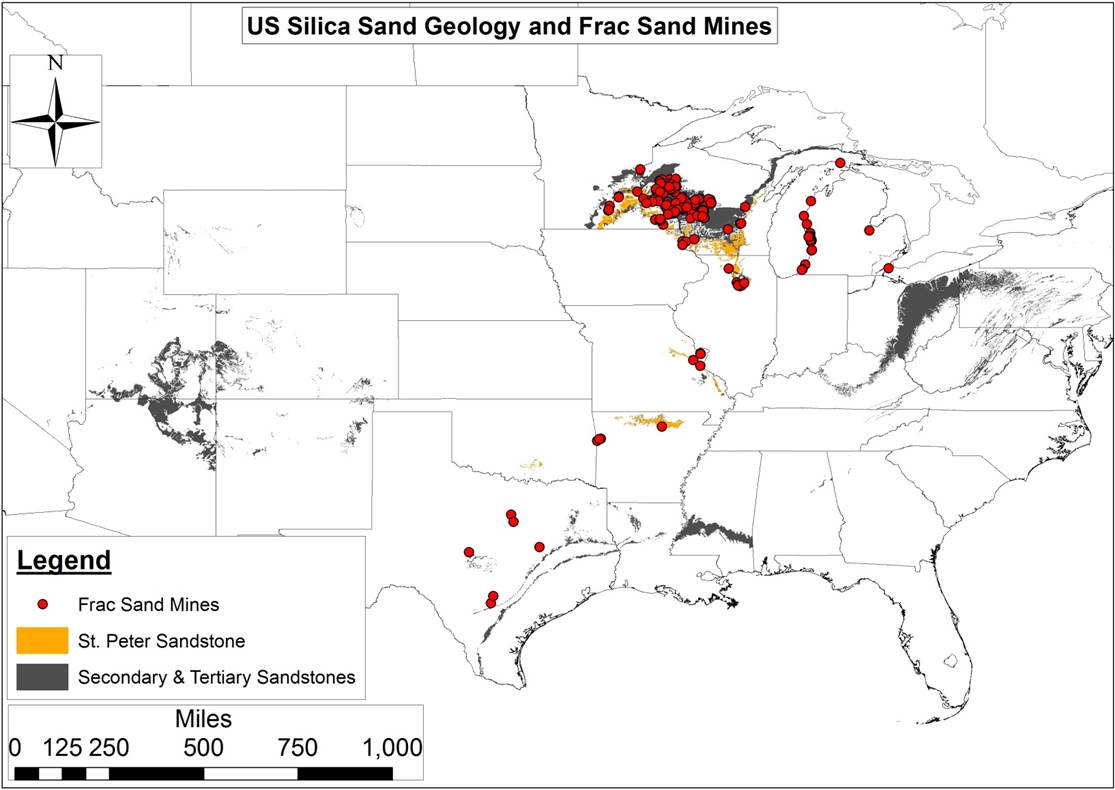
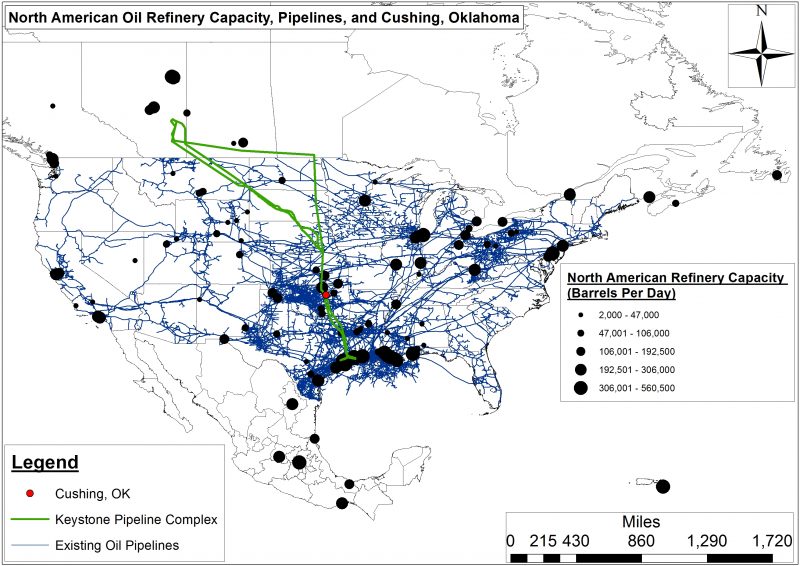
Primary and Secondary US Silica Sand Geologies and Existing Frac Sand Mines
Worse yet for the sand industry, this cycle has occurred in hyper speed. At first, just the small mines cut production. Outcompeted by larger operations, production at smaller mines was no longer profitable. Soon, the larger mines cut production due to the weakening demand. Many mines in the permit or early production phases never got started. Unlike the dairy industry, there was no rollercoaster effect because prices have yet to return to prior levels. The bubble, it seems, had popped.
With any kind of new mine developed comes the environmental impacts. Yet, I find the fervent negative reaction to such practices directly related to the end result. Fracking. Fracking isn’t magic. They’re not just mixing water with this sand and forcing oil and gas out of the ground. Harmful chemicals are being added to the mix. Worst yet, the quantity and potency of such chemicals is kept secret, closely guarded from the public. Harmful chemicals are being legally pumped into the ground. All the short-term gains will have long-term consequences. This is where I believe a significant backlash for new mines comes from. The end result. Can you imagine what the public’s perception of dairy farms would be if milk was mixed with chemicals and pumped into the ground?
The Future of Dairy Farming in Wisconsin
The 2016 presidential election has breathed some life into the frac sand industry. The new president promises to cut regulations interfering with business, and thus far has kept those promises. The environment will not be a detriment to his goals. Sand companies are returning with ads in the local papers, looking for qualified applicants and offering great salaries. In contrast, the dairy industry is stuck in a rollercoaster spiral. Milk prices have been too low for far too long. The dairy dispersal continues with some very good cows being sold and very good dairymen and women calling it quits. Naturally, some land will be sold. To what end remains to be seen. But it is a safe bet, the frac sand mining ride has not ended.