
Documenting emissions from new oil and gas wells in California
Working with the environmental nonprofit Earthworks, FracTracker Alliance filmed emissions from oil and gas sites that have been issued permits in California under Governor Gavin Newsom since the beginning of 2019. Using state-of-the-art technology called optical gas imaging (OGI), we documented otherwise invisible toxic pollutants and greenhouse gas emissions (GHGs) being released from oil and gas wells and other infrastructure. This powerful technology provides further evidence of the negative consequences that come from each issued permit. Every single permit approval enabled by decisions made under Newsom can have substantial, visible impacts on local and regional air quality, contributes to climate change, and potentially exposes communities to health-harming pollution.
Despite a stated commitment to transition rapidly off fossil fuels, California has issued 7,625 permits to drill new oil and gas wells and rework existing wells since the beginning of 2019 — that is, on Governor Gavin Newsom’s watch. This expansion of the industry has clear implications for climate change and public health, as this article will demonstrate.
Intro
In collaboration with Consumer Watchdog, FracTracker Alliance has been periodically reporting on the number and locations of oil and gas wells permitted by Governor Newsom in California. In July of 2019, we showed how the rate of fracking under Governor Newsom had doubled, as compared to counts under former Governor Brown. Since then we have continued tracking the numbers and updating the California public via multiple news stories, blog reports, and with a map of new permits on NewsomWellWatch.com, where permitting data for the third quarter of 2020 has just been posted.
Now again, the rate of new oil and gas well permits issued by the California Geologic Energy Management division (CALGEM) continues to increase even faster in 2020, with permits issued to drill new oil and gas production wells nearly doubling since 2019. But what exactly does this mean for Frontline Communities and climate change? To answer this question, FracTracker Alliance and Consumer Watchdog teamed up with Earthworks’ Community Empowerment Project (CEP).
CEP’s California team worked with community members and grassroots groups to film emissions of methane and other volatile organic compounds (VOCs) emitted from oil and gas extraction sites, including infrastructure servicing oil and gas production wells such as the well-heads, separators, compressors, crude oil and produced water tanks, and gathering lines. Emissions of GHGs, such as methane, are a violation of the California Air Resources Board’s (CARB) California oil and gas rule (COGR), California Code of Regulations, Title 17, Division 3, Chapter 1, Subchapter 10 Climate Change, Article 4, § 95669, Leak Detection and Repair.
The emissions were filmed by a certified thermographer with a FLIR (Forward Looking Infrared) GF320 camera that uses optical gas imaging (OGI) technology. The OGI technology allows the camera to film and record visualizations of VOC emissions based on the absorption of infrared light. It is the exact same technology required by the U.S. EPA under the rule for new source performance standards and the by California Air Resources Board for Leak Detection and Repair (LDAR) to properly inspect oil and gas infrastructure. The video footage clearly shows the presence of a range of VOCs, methane, and other gases that are otherwise invisible to the naked eye.
The footage shown below is in greyscale and can appear grainy when the camera is being operated in high sensitivity modes, which is sometimes necessary to visualize certain pollution releases. The descriptions preceding each video explain what the trained camera operator saw and documented. A map of these sites is presented at NewsomWellWatch.com.
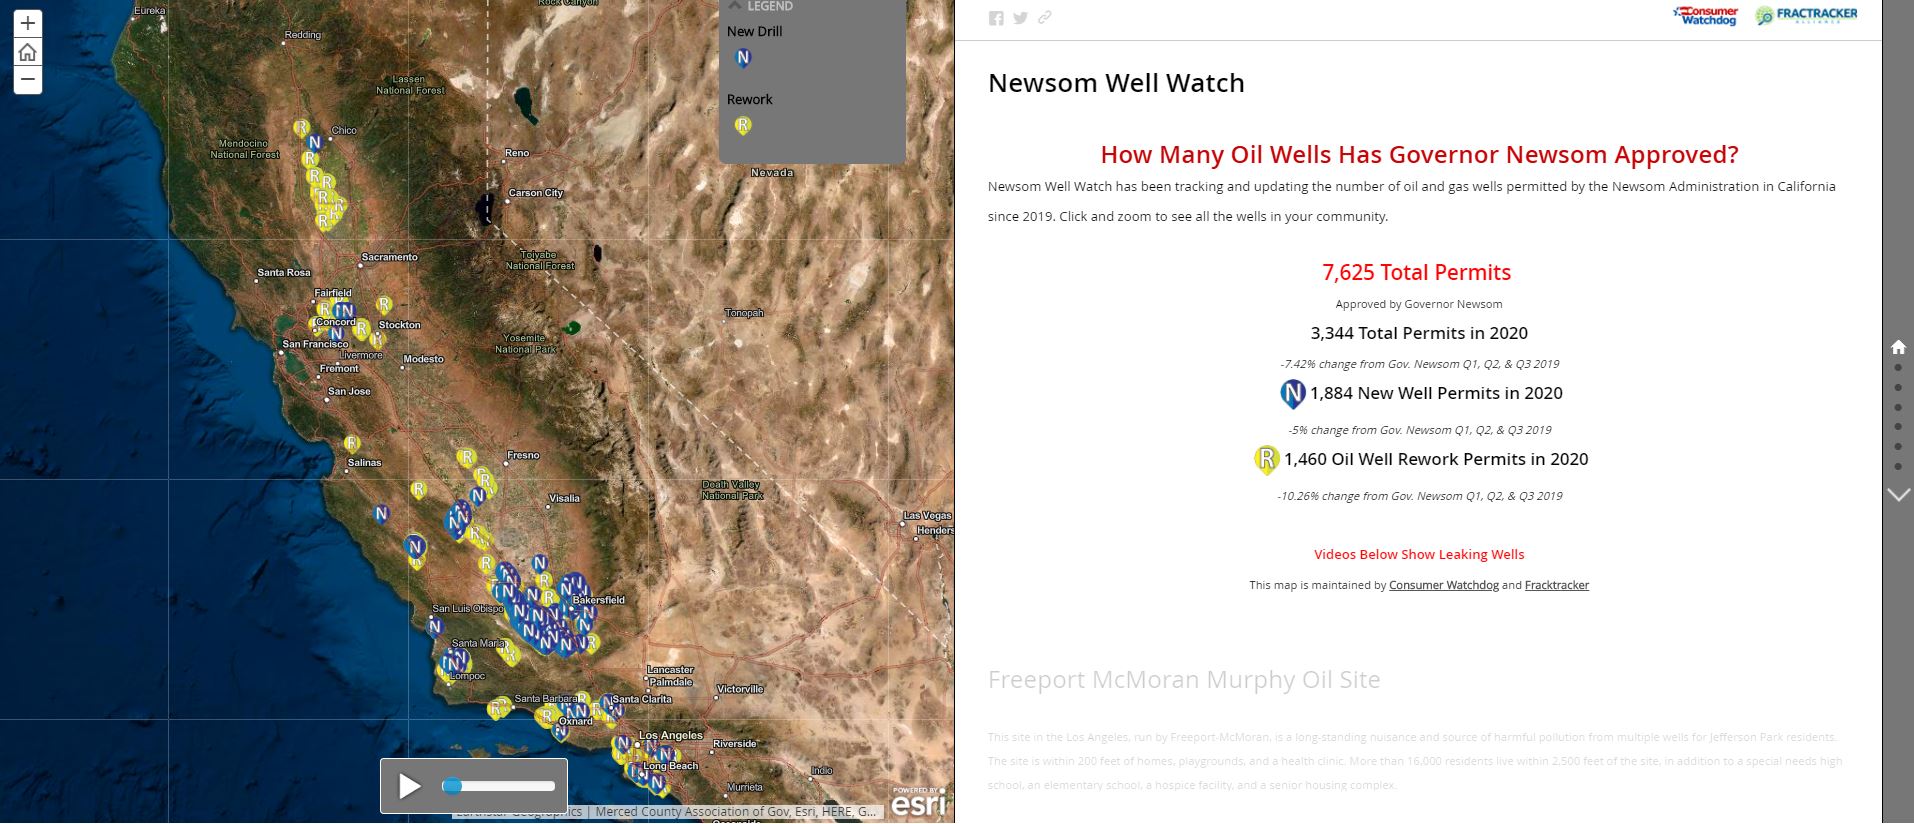
Newsom Well Watch interactive map
Navigate to the next slide using the arrows at the bottom of the map.
Find the story map, and more by clicking the image below.
Case Studies on Permitted Sites
Cat Canyon Tunnell Well Pad.
Earthworks’ California CEP thermographer visited this site in December of 2019, and just happened to arrive while the operator (oil and gas company) was conducting activities underground, including drilling new wells and reworking existing wells. In 2019 the operator, Vaquero Energy, was approved to drill 10 new cyclic steam wells and rework 23 existing oil and gas production wells at this site.
The footage shows significant emissions coming from an unknown source near the wellheads on the well pad; most likely these emissions were coming directly from the open boreholes of the wells. The emissions potentially include a cocktail of VOCs and GHGs such as methane, ethane, benzene, and toluene. This footage provides a candid view of what is released during these types of activities. The pollution shown appears to be the result of an uncontrolled source commonly resulting from drilling and reworking wells
Additionally, inspectors are rarely, if ever, present during these types of activities to ensure that they are conducted in accordance with regulations. The CEP camera operator reported the emissions and provided the OGI video to the Santa Barbara County Air Pollution Control District. By the time the inspector arrived, however, the drilling crew had ceased operations. The inspector did not detect any of these emissions, and as a result the operator was not held accountable for this large pollution release.
In the footage below, the emissions can be seen traveling over the fenceline of the well pad, swirling and mixing with the wind. This site is a clear example of what to look for in the following videos, since the emissions are so obvious. Fortunately, there are no homes or buildings in close proximity to this site, which potentially limited direct pollution exposure — although the pollution still degrades air quality and can pose an occupational health risk to oil field workers.
South Los Angeles Murphy Drill Site
The Murphy Drill Site in Los Angeles has been a long-standing nuisance and source of harmful pollution for neighbors in Jefferson Park. The site houses 31 individual operational wells, including 9 enhanced oil recovery injection wells and 22 oil and gas production wells, as shown below in the map in Figure 1. The wells are operated by Freeport-McMoran, while the site is owned by the Catholic archdiocese of Los Angeles. The site is within 200 feet of homes, playgrounds and a health clinic. There are over 16,000 residents within 2,500’ of the site, as well as a special needs high school, an elementary school, a hospice facility, and a senior housing complex.
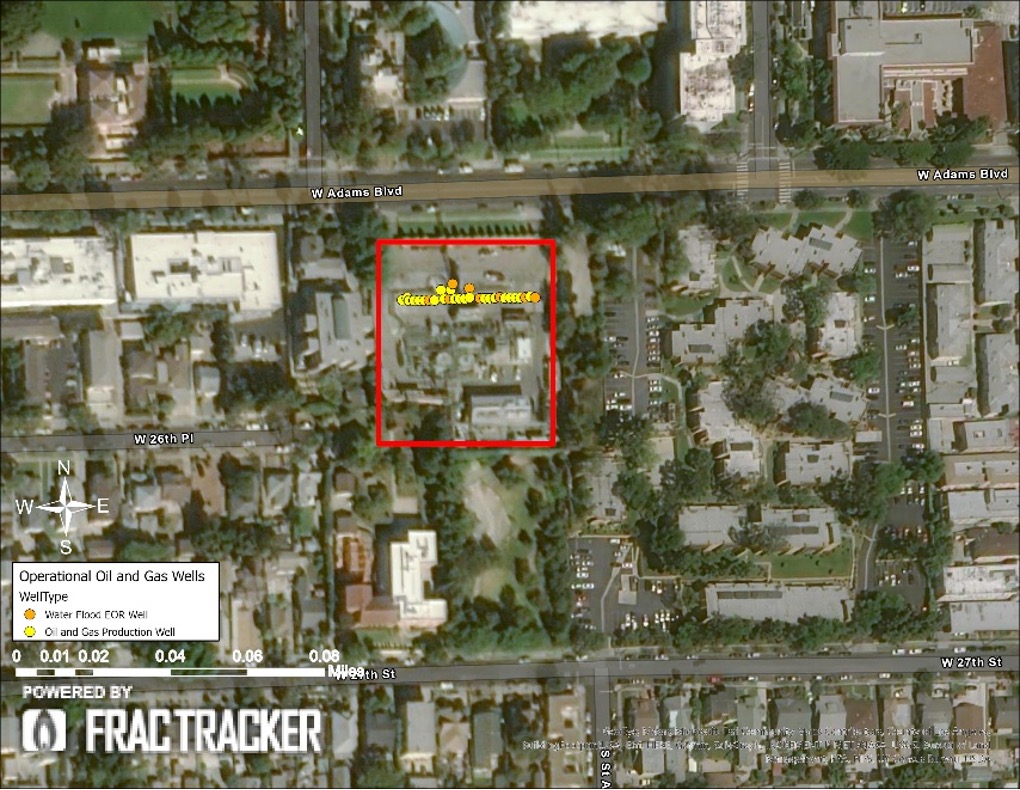
Figure 1. Map of the Murphy drill site
The neighborhoods near the Murphy Site are plagued with strong chemical odors, including those linked to oil and gas operations (such as the “rotten egg” smell of health-harming hydrogen sulfide), most likely from the toxic waste incinerators on site. Community members have suffered from respiratory problems, chronic nosebleeds, skin and eye irritation, and headaches. The operators have received multiple violations, including for releasing emissions at concentrations 400% over the allowable limit of methane and VOCs. Some of these violations were the direct result of complaints from the community and the Earthworks CEP team, which filmed pollution from the site on multiple occasions. Yet despite receiving “Notices of Violations” and fines, Freeport-McMoran has been allowed to continue operations. In OGI footage, emissions are visible continuously escaping from a vent on the equipment. While this leak has been addressed by regulators, each new visit to this site tends to result in finding new uncontrolled emissions sources.
South Los Angeles Jefferson Drill Site
The Jefferson drill site is very similar situation to the Murphy Site. The sites have the same operator, Freeport-McMoran, and surrounding neighborhoods in both locations have suffered from exposure to toxic pollution as well as odors, truck traffic, and noise. The Jefferson site has 49 operational wells, including 15 enhanced oil recovery wells, as shown below in Figure 2. In 2013 the operator reported using over 130,000 pounds of corrosive acids and other toxic chemicals for enhanced oil recovery operations. Regardless, an environmental impact report has never been completed for this site.
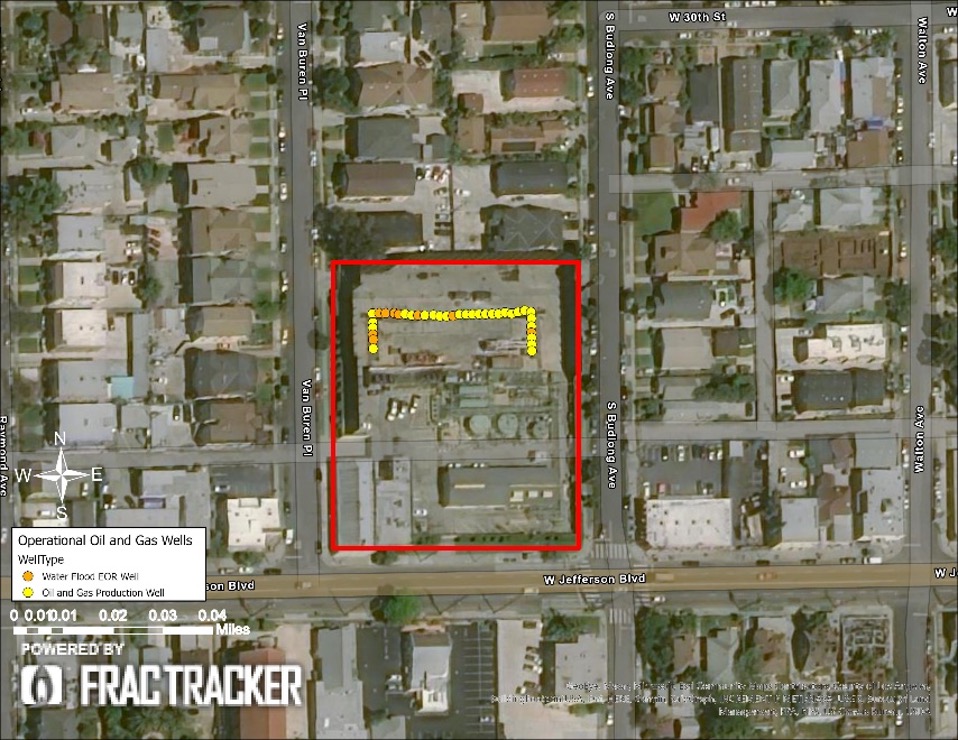
Figure 2. Map of the Jefferson drill site in South Los Angeles.
The site is located 3 feet from the nearest home, and the surrounding residential buildings are considered “buffers” for the rest of the neighborhood, which also includes an elementary school about 700 feet away. The site was nearly shut down by the City of Los Angeles in 2019, but is currently still operational. In 2019 the site was even issued a permit to rework an existing well in order to increase production from the site. The footage below shows a large, consistent release of pollution from equipment on the well pad. The plume appears above the site and is visible against the background of the sky. The Earthworks CEP team reported the pollution to the South Coast Air Quality Management District (SCAQMD), which conducted an inspection, stopped the leak, and issued a notice of violation and a fine. It is not clear exactly how long this pollution problem had gone unnoticed or unaddressed, and it is not unlikely that another leak will occur without being quickly identified.
Wilmington E&B Resources WNF-I Site on Main St
The WNF-I drilling site is located in Carson in the City of Los Angeles. Operated by E&B Natural resources in the Wilmington oil and gas field, the site houses 35 operational oil and gas wells, including 12 enhanced oil recovery wells and a wastewater disposal well. There is also extensive above-ground infrastructure on the well site, including a large, high-volume tank battery used to store oil and wastewater produced from numerous oil and gas wells in the area.
Using OGI, Earthworks identified a large pollution release from the top of the largest tank. In the video footage, the plume or cloud of gases (likely methane and VOCs) can be seen hovering over the site and slowly dispersing over the fence-line into the communities of West Carson and Avalon Village. Despite clear operational problems, CalGEM approved this site for two rework permits in 2019 and then three re-drills (known as sidetracks) of existing wells in 2020 in order to increase production. The SCAQMD reports that they have inspected this facility, but it is not clear whether this major uncontrolled source has been stopped.
Long Beach Signal Hill Drill Site
At an urban drilling site in the neighborhood of Signal Hill in Los Angeles County, Earthworks filmed and documented pollution releases from numerous pieces of equipment. The site includes 15 operational oil and gas wells operated by Signal Hill Petroleum and The Termo Company. Emissions of gases (likely methane and VOCs) were documented on infrastructure from both operators. At this site, Signal Hill Petroleum received a permit in April 2019 to rework an operational well to increase production. That well is located less than 70’ from a home.
While this site is located within Los Angeles County, it is outside the jurisdiction of the city itself. Any local protections for drilling sites within the Los Angeles city limits are not afforded to communities such as Signal Hill. This area that includes the Signal Hill oil field and the Signal Hill portion of the Long Beach oil field, where many well sites are unmaintained and oversight is limited — conditions that in turn can result in corrosion and pollution leaks. The SCAQMD inspected this site and reported that these uncontrolled sources of emissions have been addressed by the operator, but it is not clear if the emission have stopped.
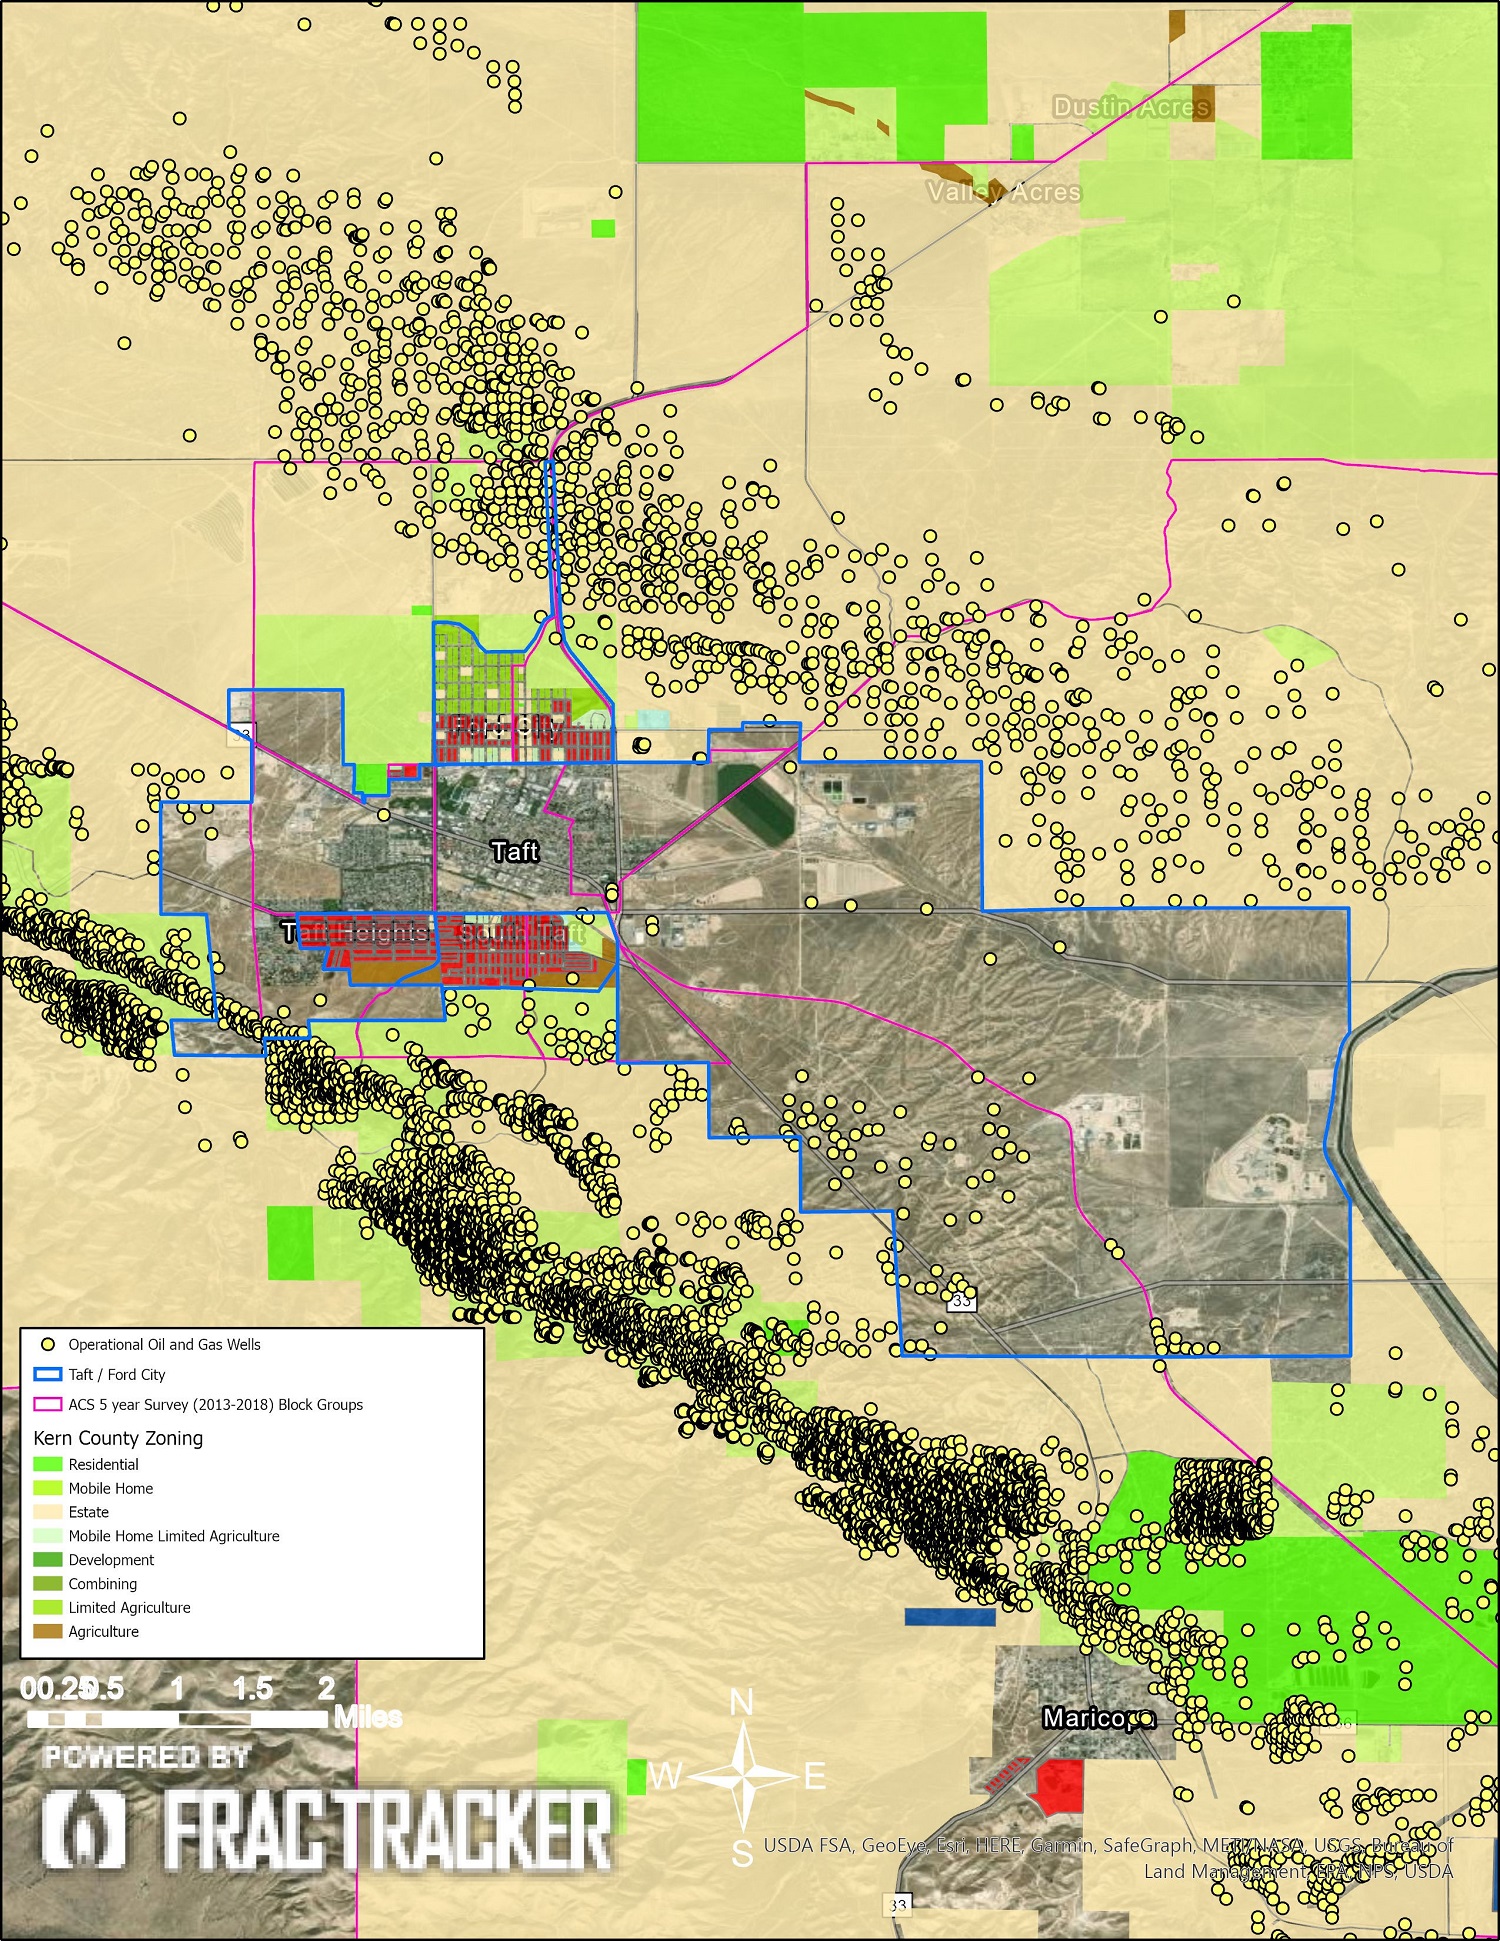
Midway-Sunset Crail Tank Farm
This tank farm, located in Kern County, services a number of wells operated by Holmes Western Oil Corporation on the outskirts of the Mid-Way Sunset Field. Of the wells serviced by this site, permits were issued to four active oil and gas production wells in 2019. The permits authorized the operator to rework the wellbores in order to increase production. The site contains nine operational oil and gas wells, including eight production wells pumping oil to the surface and one wastewater disposal well. There are multiple homes near this site, within 400’ to the west and within 300’ to the northeast.
For each gallon of oil produced, another ten gallons of contaminated wastewater are brought to the surface. Using diesel or gas generators this wastewater is pumped back into the ground. California regulators have a bad track record of managing underground injection of wastewater, which is now under the U.S. EPA’s oversight. The groundwater in this area of Kern County is largely contaminated and considered a sacrifice zone.
The emissions from this site are from the pressure release valves on the tops of multiple tanks. The tanks store both crude oil and wastewater. The infrared spectrum allows the camera to film the tank levels, which are nearly full. As the tanks fill with more crude oil and hydrocarbon contaminated wastewater the head space of the tank pressurizes with more VOC’s. This footage was also filmed at night when emissions are typically much lower. During the day heat from the sun (radiative energy) heats the tanks and increases the head space pressure resulting in greater emissions. While the San Joaquin Valley Air Pollution Control District (SJVAPCD) was notified of these uncontrolled sources of emissions, their own inspections of the site did not identify an actionable offense on the part of the operator and these uncontrolled emissions continue to be released.
Tank Emissions
Crude oil and wastewater storage tanks are a common source of fugitive emissions and represent the majority of emissions presented in this report. Some tanks and well-sites use best practices that include closed vapor recovery systems to prevent venting tanks from leaking, but the vast majority do not and vent directly to the atmosphere. In all cases, tanks and pipeline infrastructure use pressure release valves to vent emissions when pressure builds too high. This venting is permitted as strictly an emergency activity to prevent hazardous build-up of pressure. Vents are even designed to open and reset themselves automatically. Consequently, tank venting is a common practice and operators seem to often leave these valves open.
While the recently enacted California Oil and Gas Rule (COGR) places limits on GHG emissions from all oil and gas facilities, internal policy of the San Joaquin Air Valley Air Pollution Control District has previously exempted tanks at low-producing well sites from having to be kept in a leak-free condition, creating a regulatory conflict that air districts and CARB need to resolve. This type of emissions source is also difficult for regulators to identify during inspections, for a number of reasons. These valves are typically located on the tops of large tanks where they are difficult to access and view, and inspections and sampling can only occur by chance (i.e., when the valve in open). Further, these valves can be immediately closed by operators during or upon notification of an upcoming inspection.
New Permits: Moving in the Wrong Direction
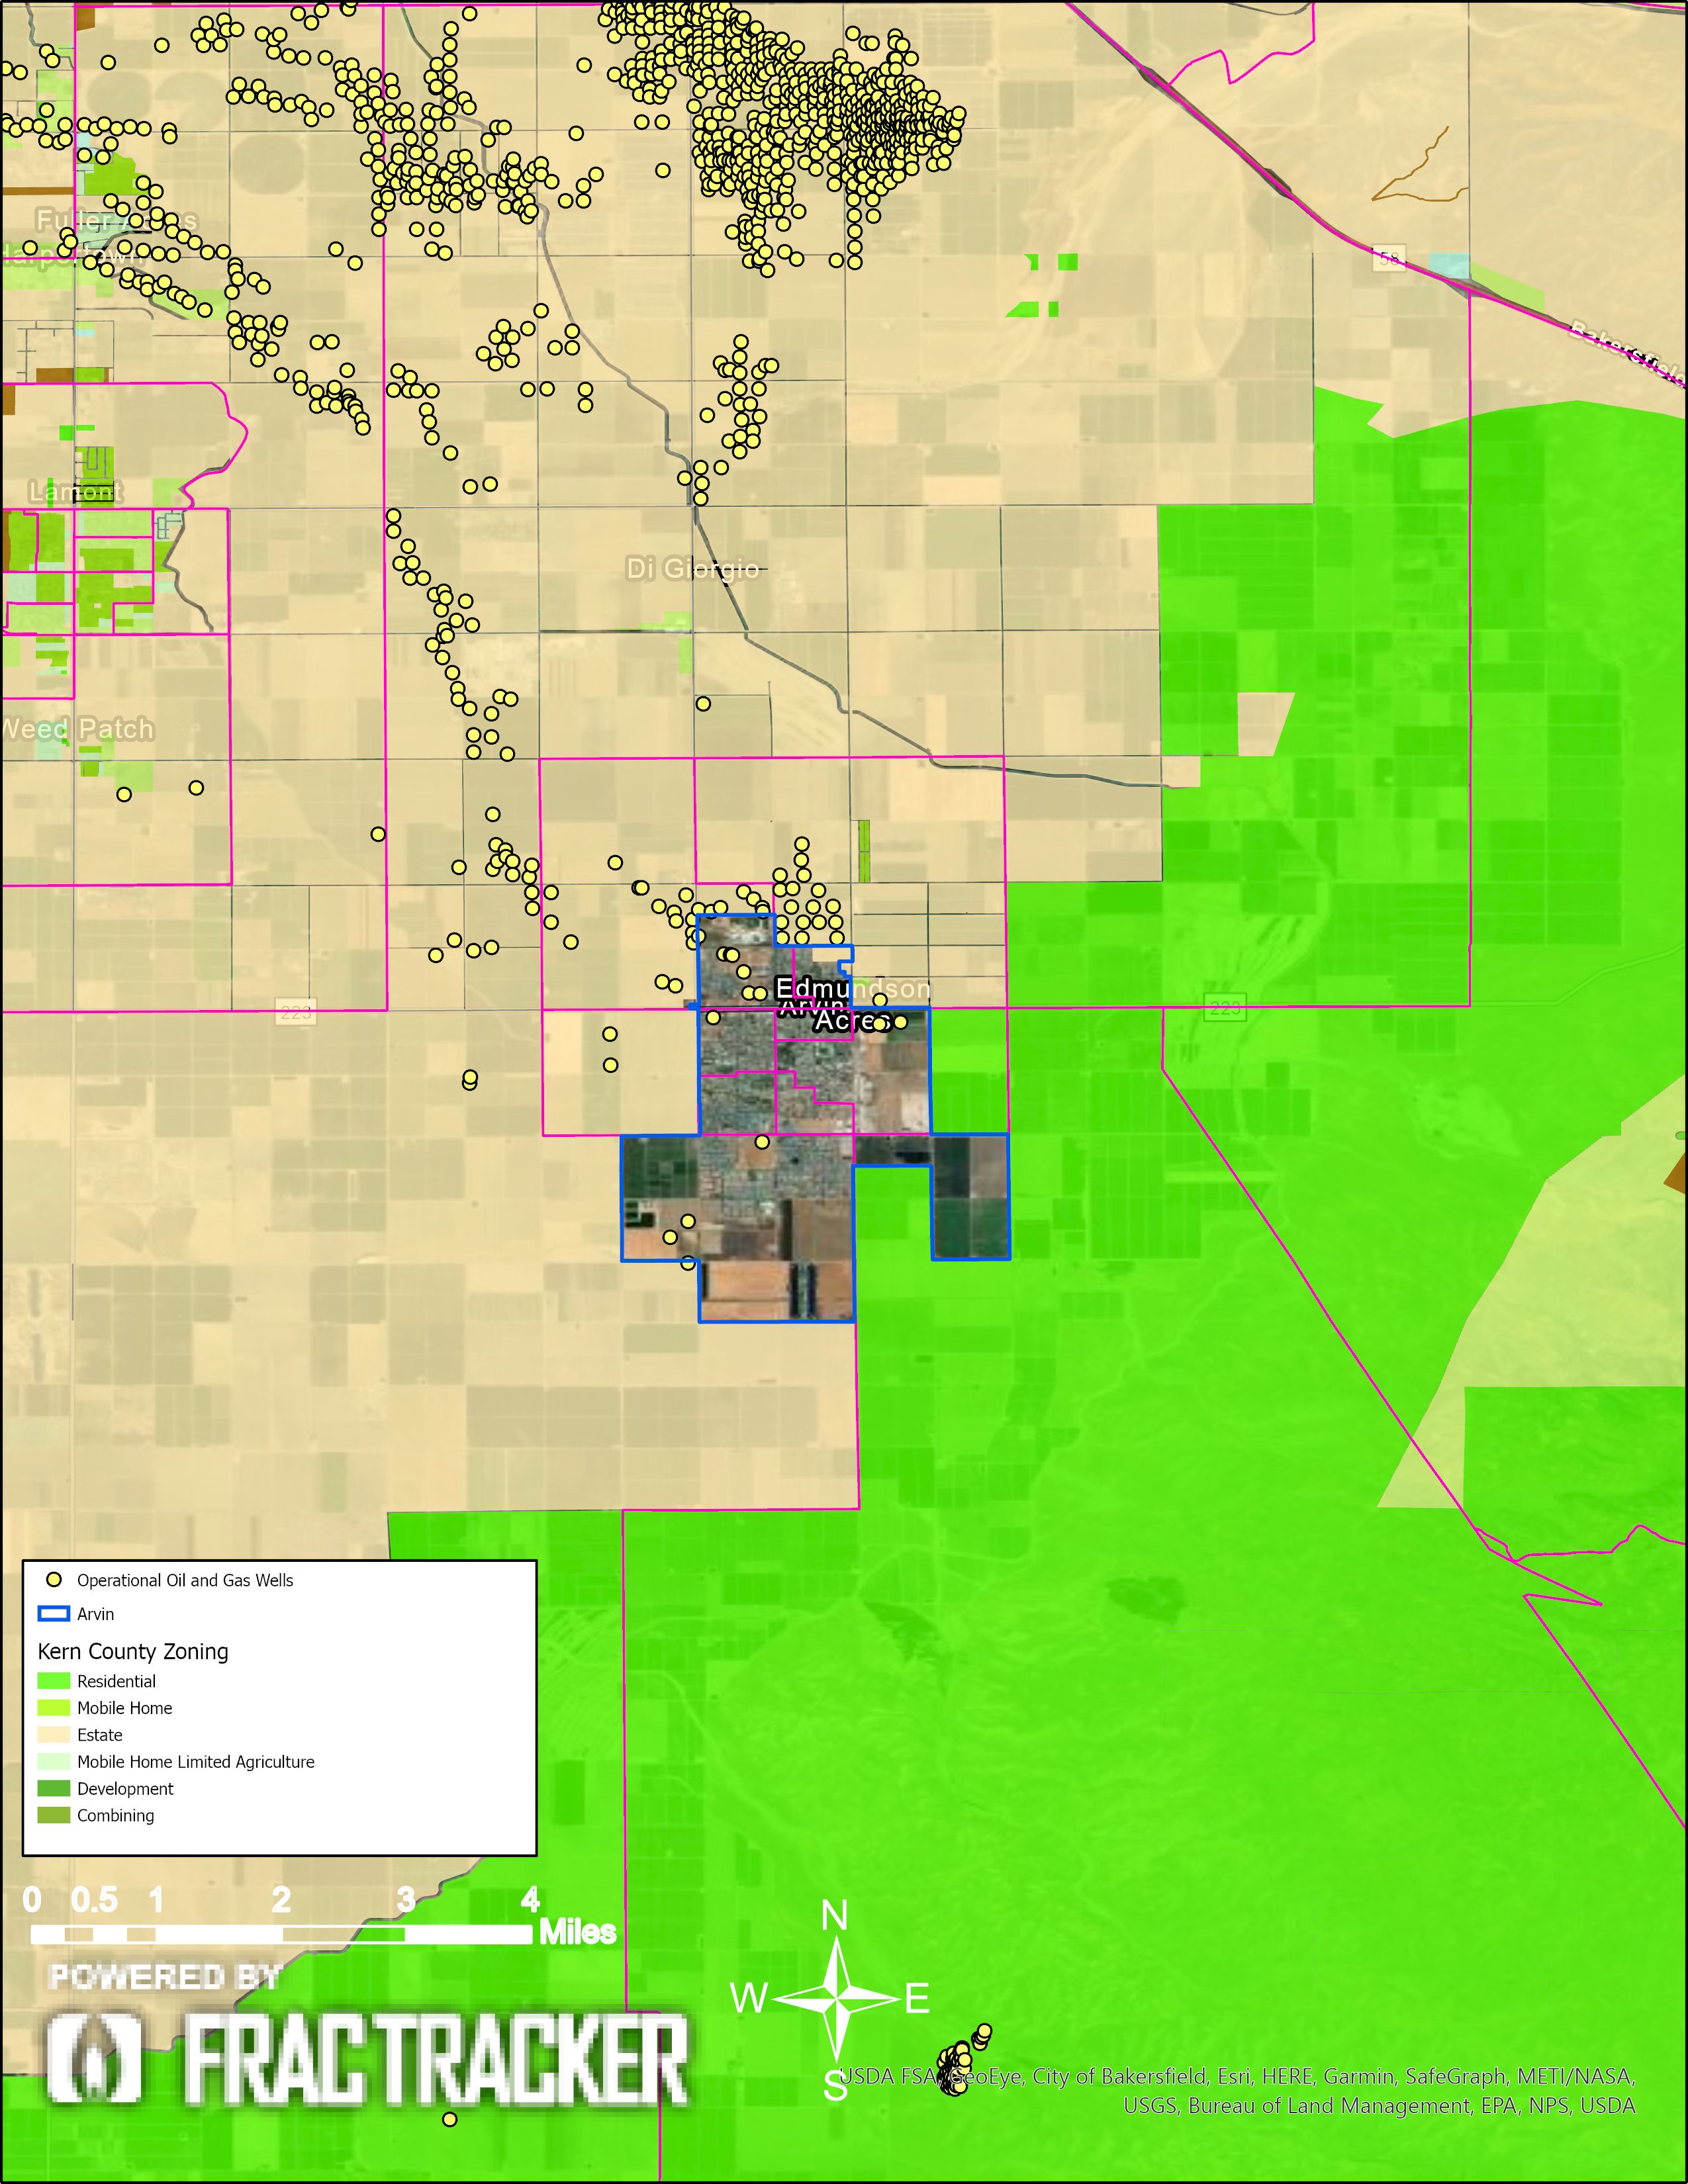
When Earthworks CEP uses OGI cameras to inspect an oil and gas site in California, finding and documenting pollution releases is so common that it is the default expectation. Because of access and proximity limitations, it is possible that more pollution is being released from sites than CEP can identify. All of these examples of pollution, including releases of methane and VOCs, add up to potentially degrade air quality and expose Frontline Communities to health risks — as well as many others just like them. This summary represents a small collection of leaking well sites visited by Earthworks CEP, which have coincidentally received new permits to operate and rework existing wells since January 1, 2019. CEP has also documented many other hazardous cases, such as the Jewett 1-23 site in Arvin (shown in the footage below), that is persistently exposing elementary school students to VOCs. These sites surely make up only a small proportion of the polluting oil and gas sites in California that harm climate and health.
From the initial drilling of an oil and gas well, during production, and into subsequent reworks, all phases of a well’s lifetime result in unpermitted and undocumented fugitive emissions. Regulating emissions from oil and gas extraction operations has not been effective in California. Regardless of notices of violations and fines, polluting facilities and well sites continue to operate and even receive new permits. Even the COGR rule, lauded as the most stringent GHG emissions regulation in the nation is technically unable to eliminate or even identify these uncontrolled sources. It is clear that the only ways to reduce exposures to these emissions for Frontline Communities is to institute protective setbacks and stop permitting the drilling of new wells and the reworking of aging wells.
By Kyle Ferrar, Western Program Coordinator, FracTracker Alliance
 Ted Auch
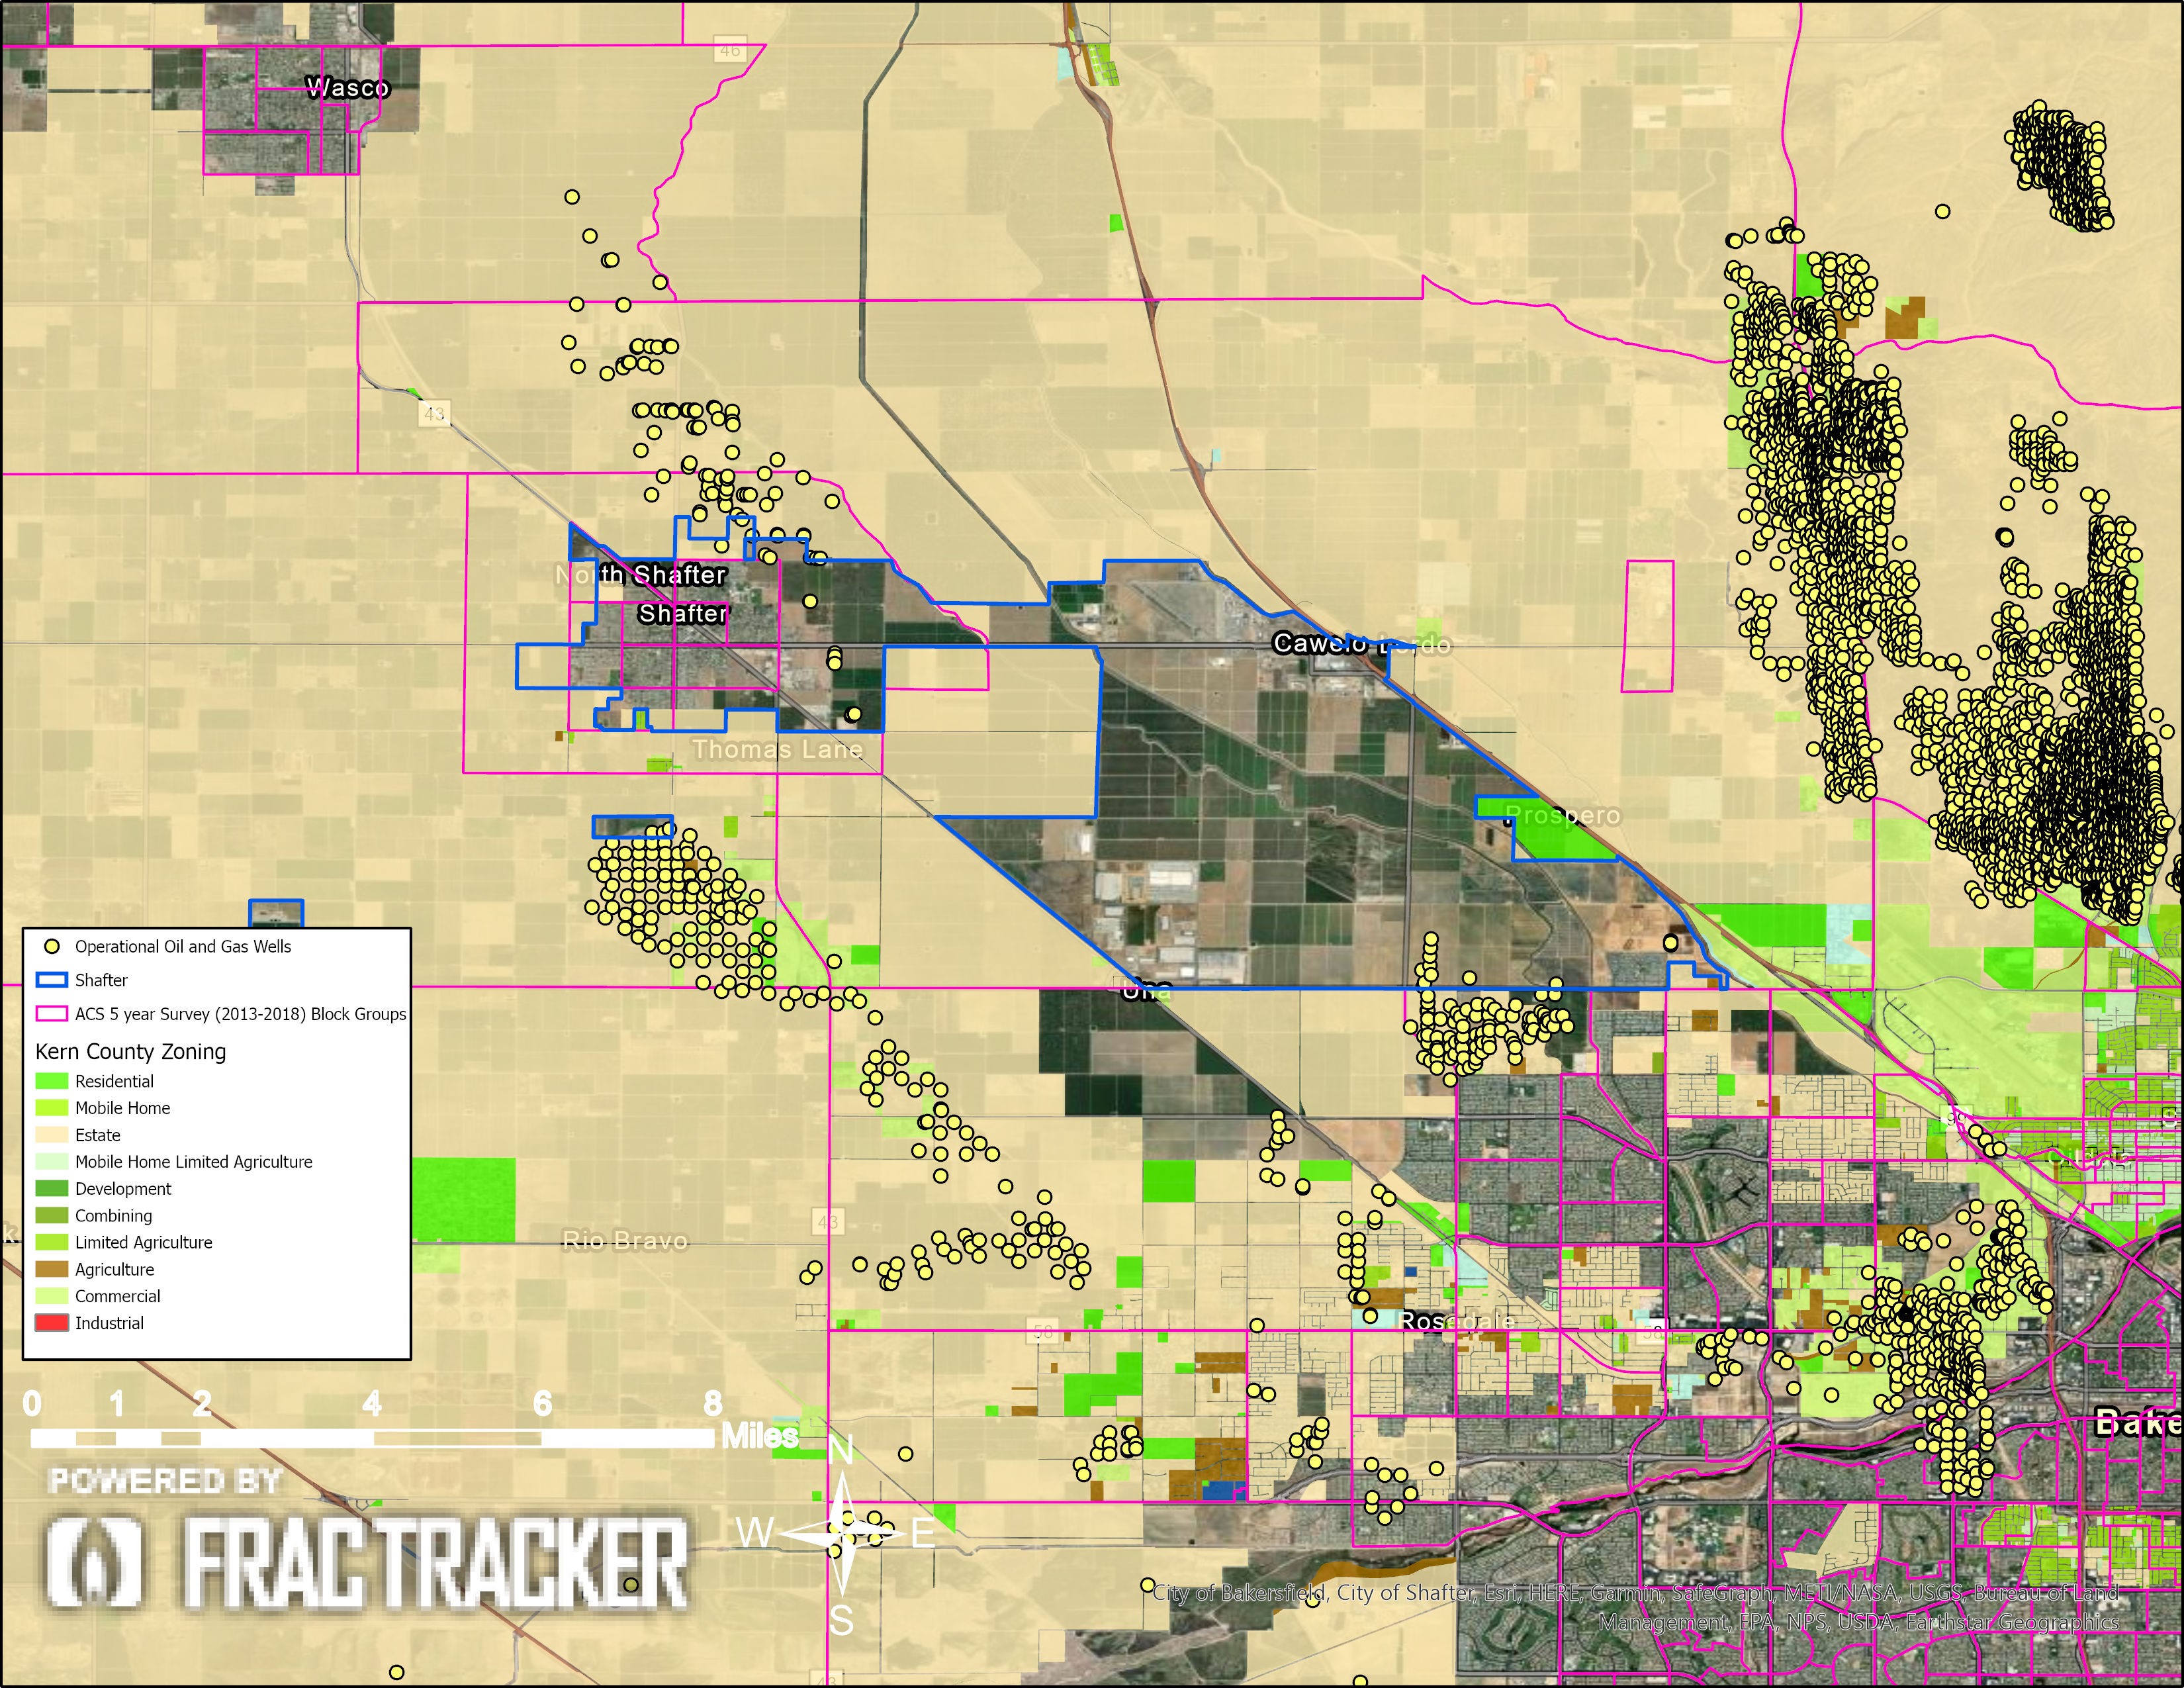

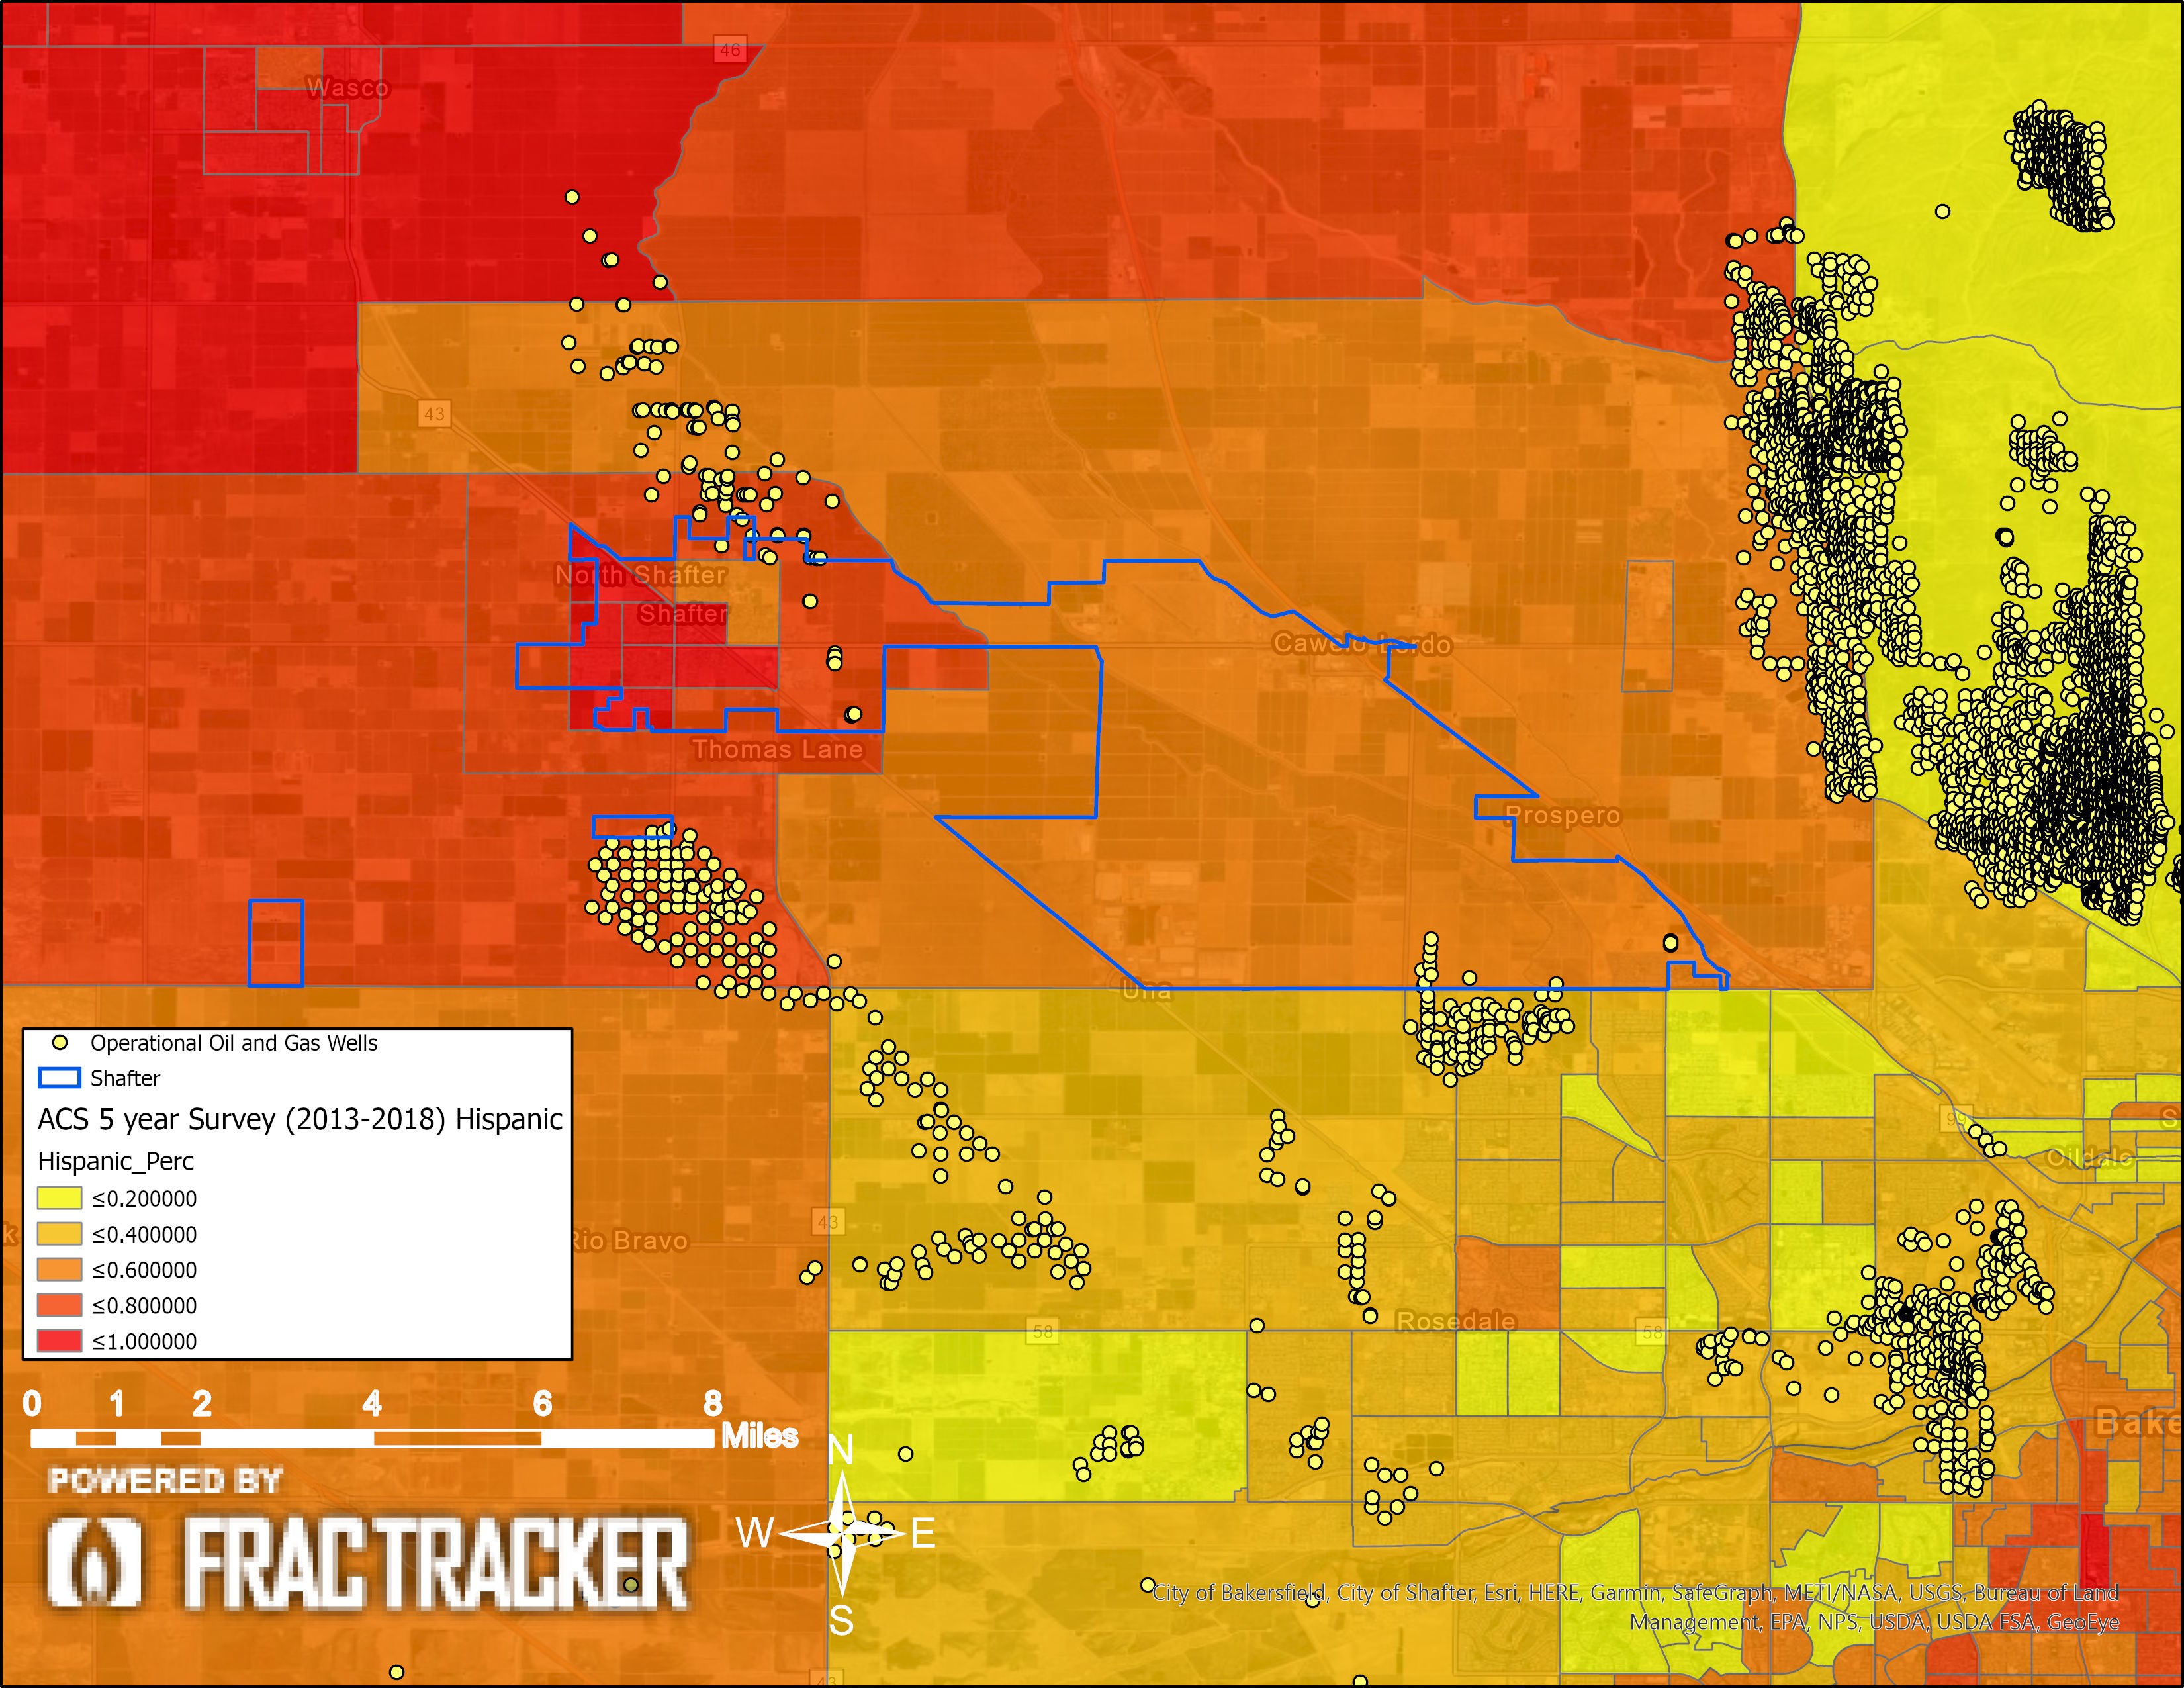
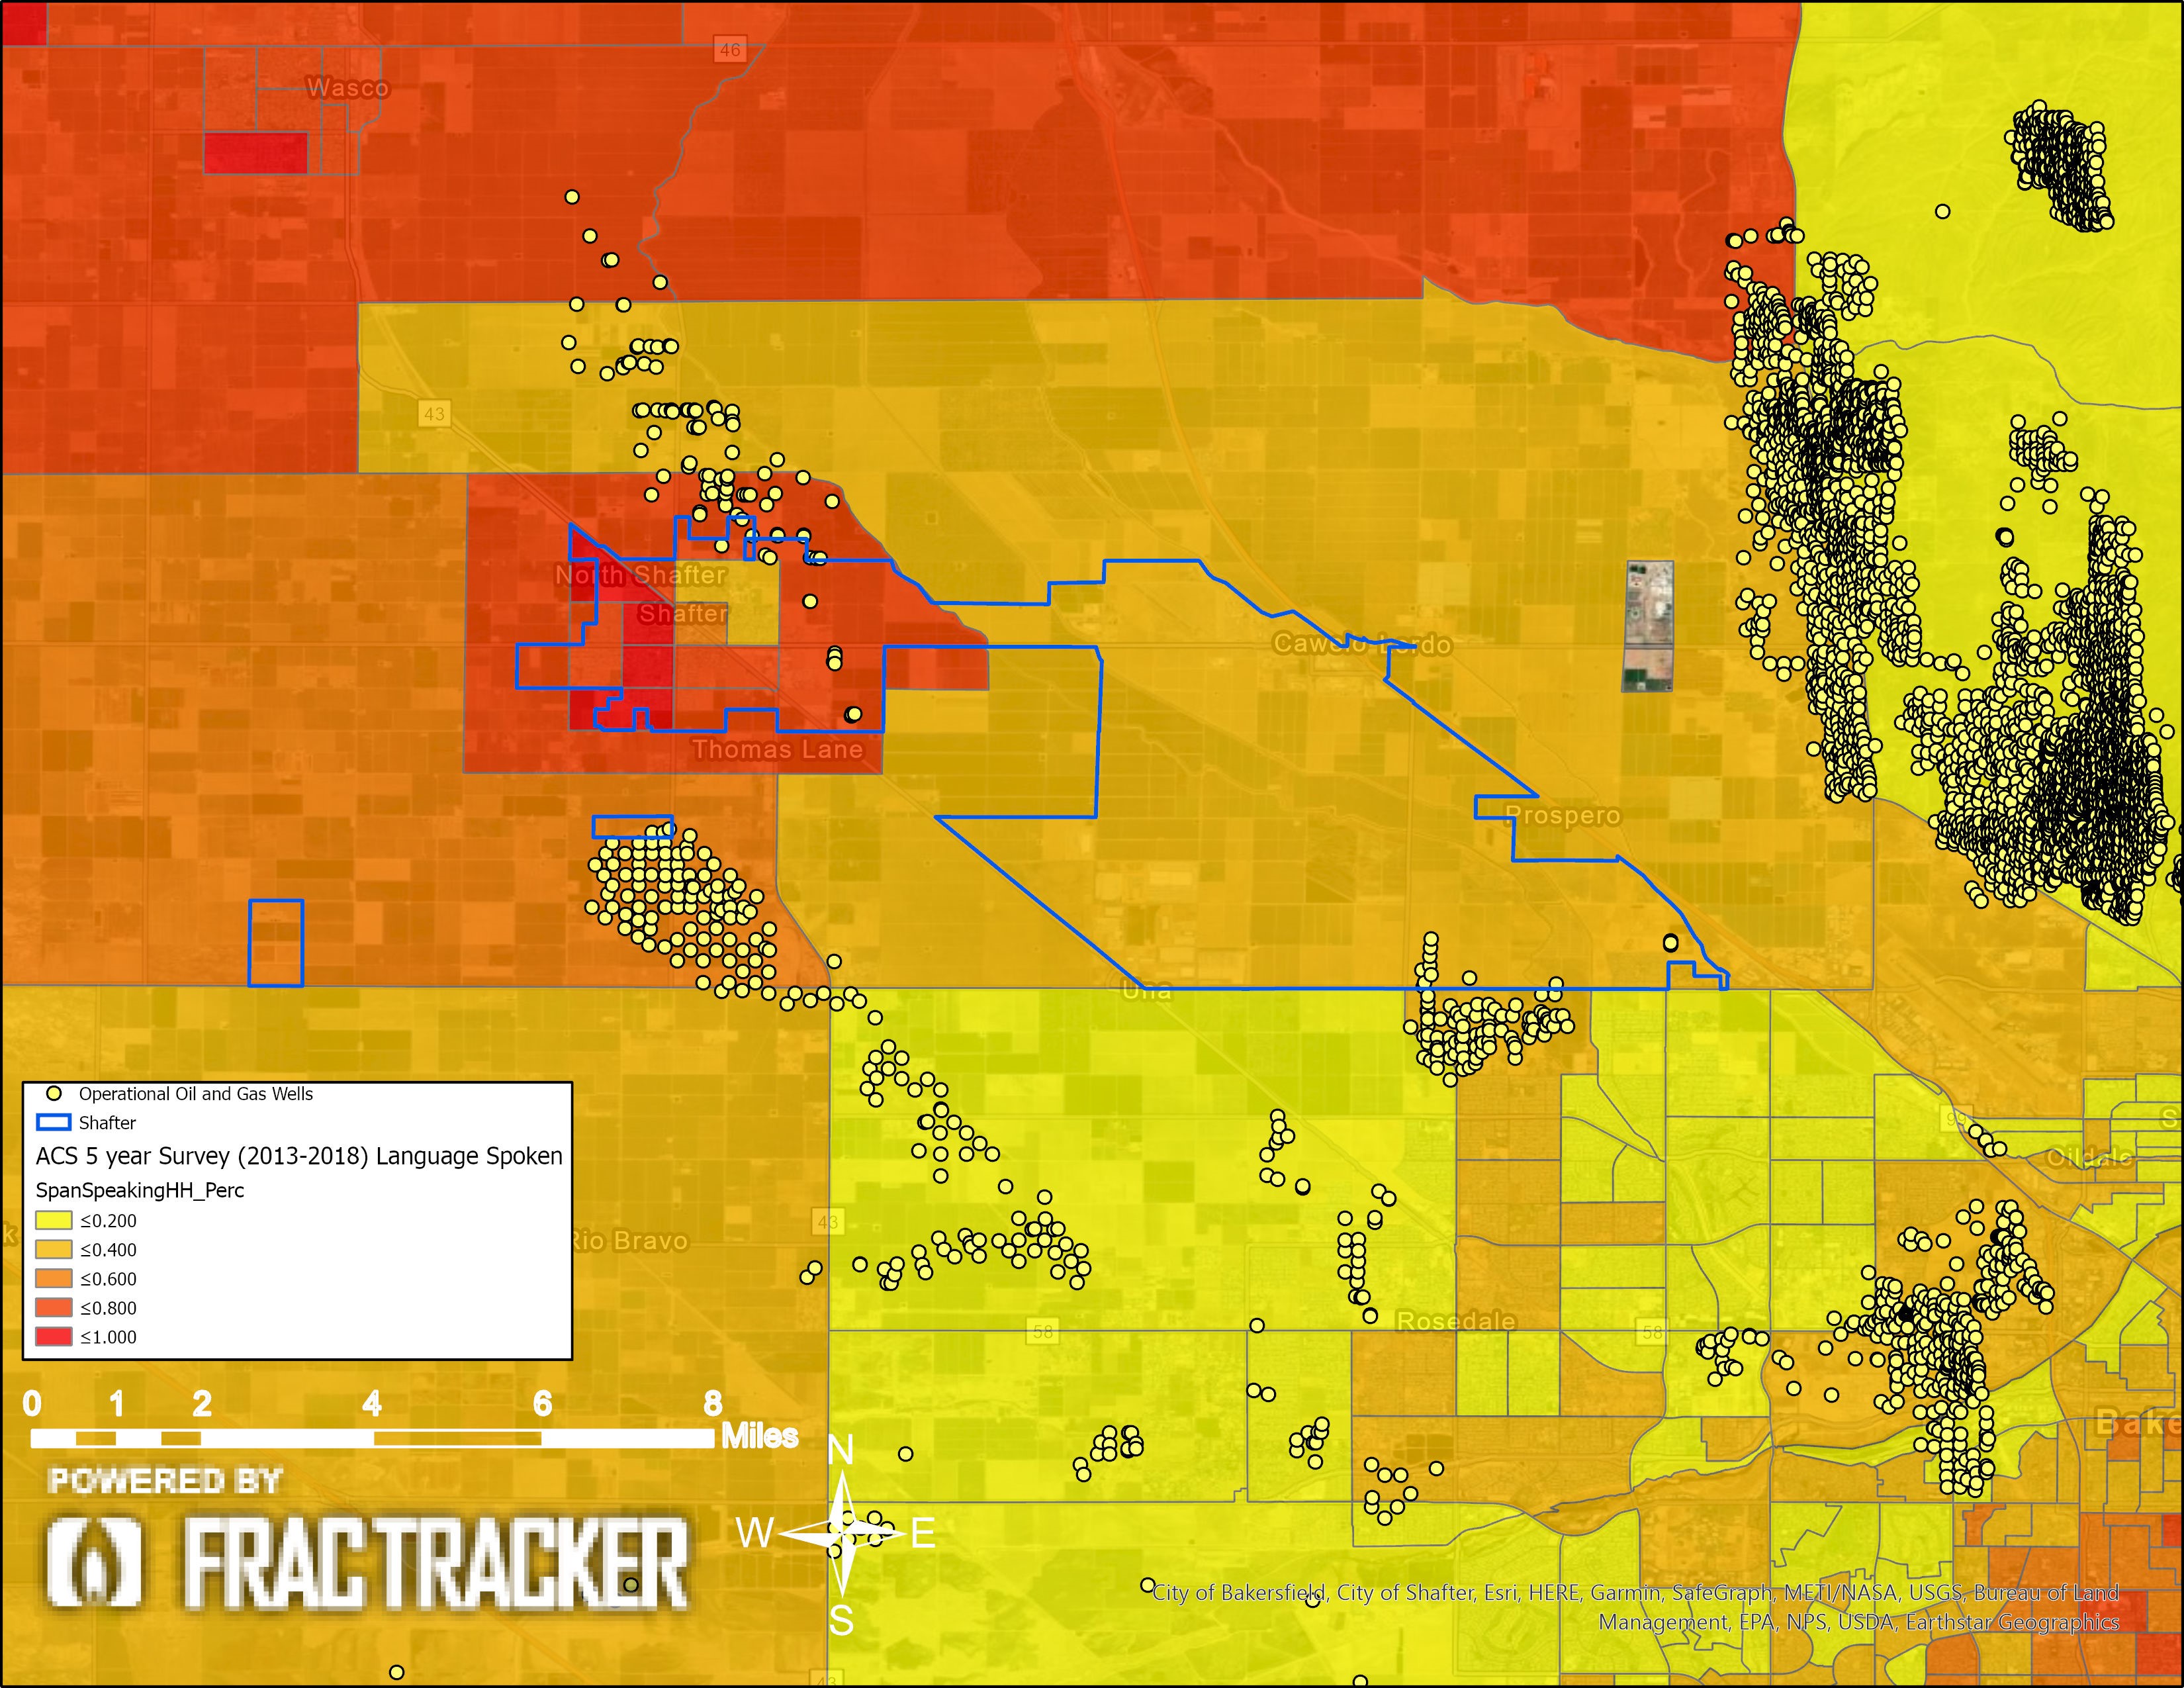
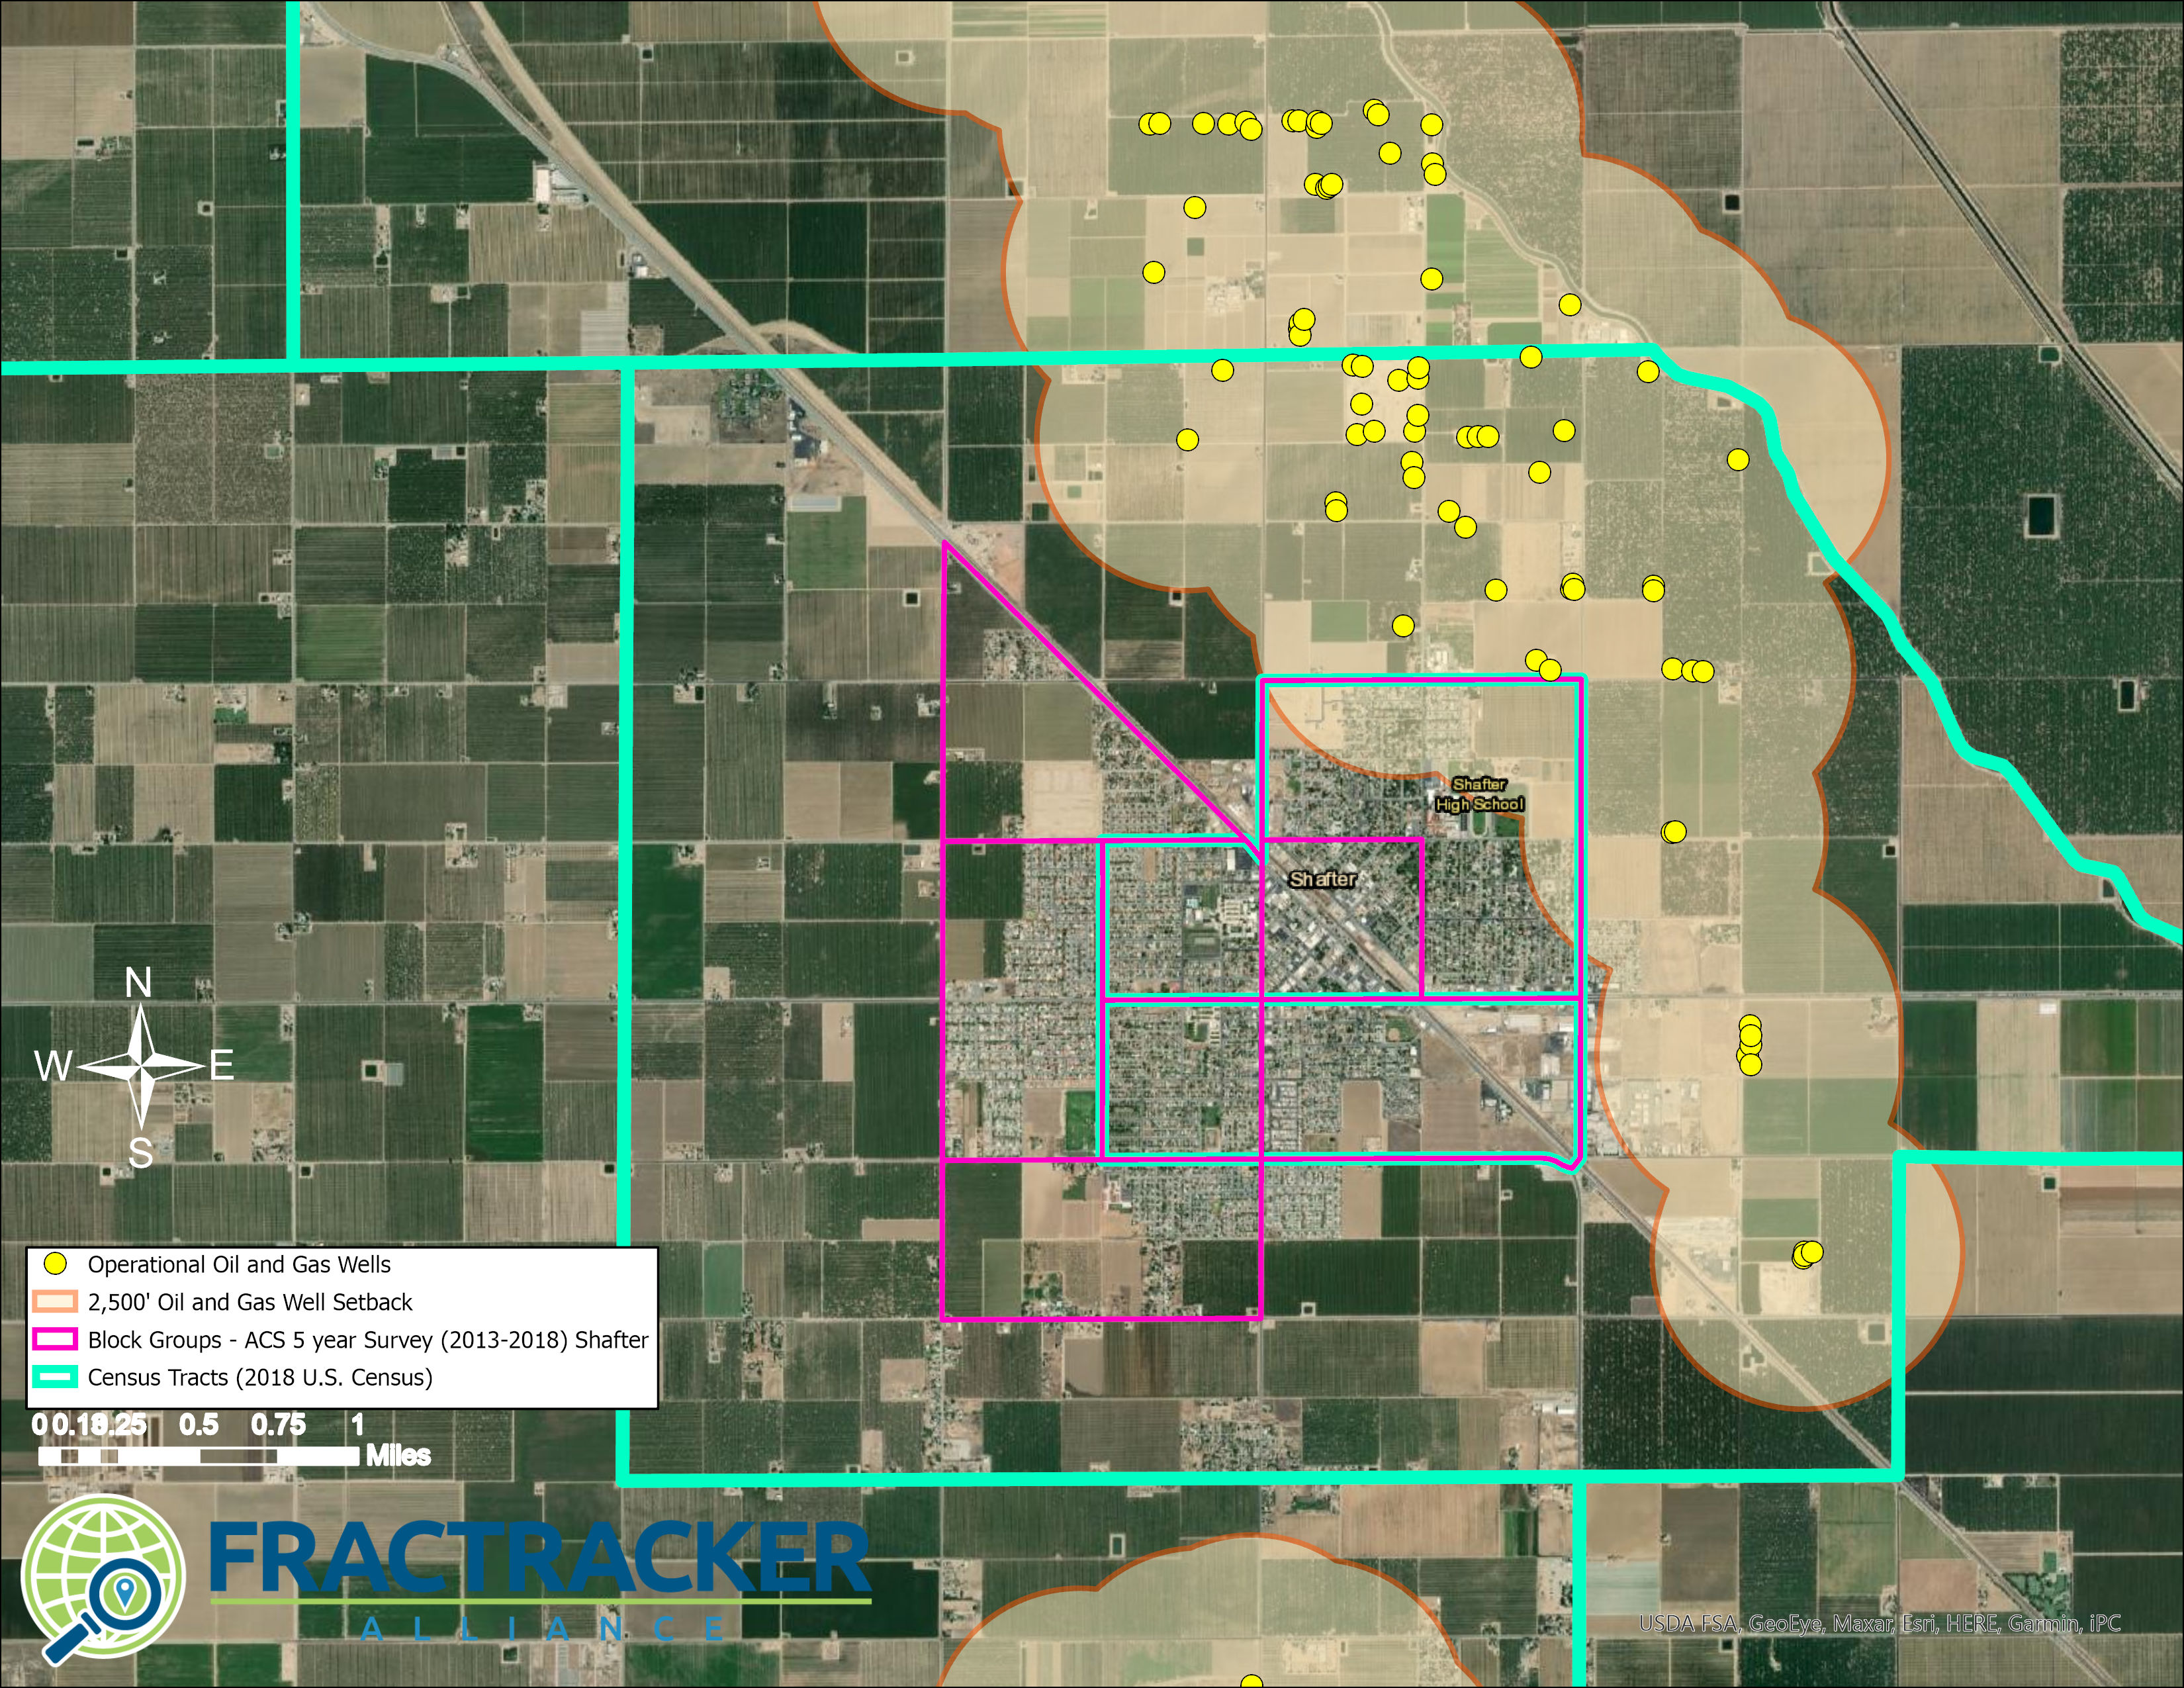
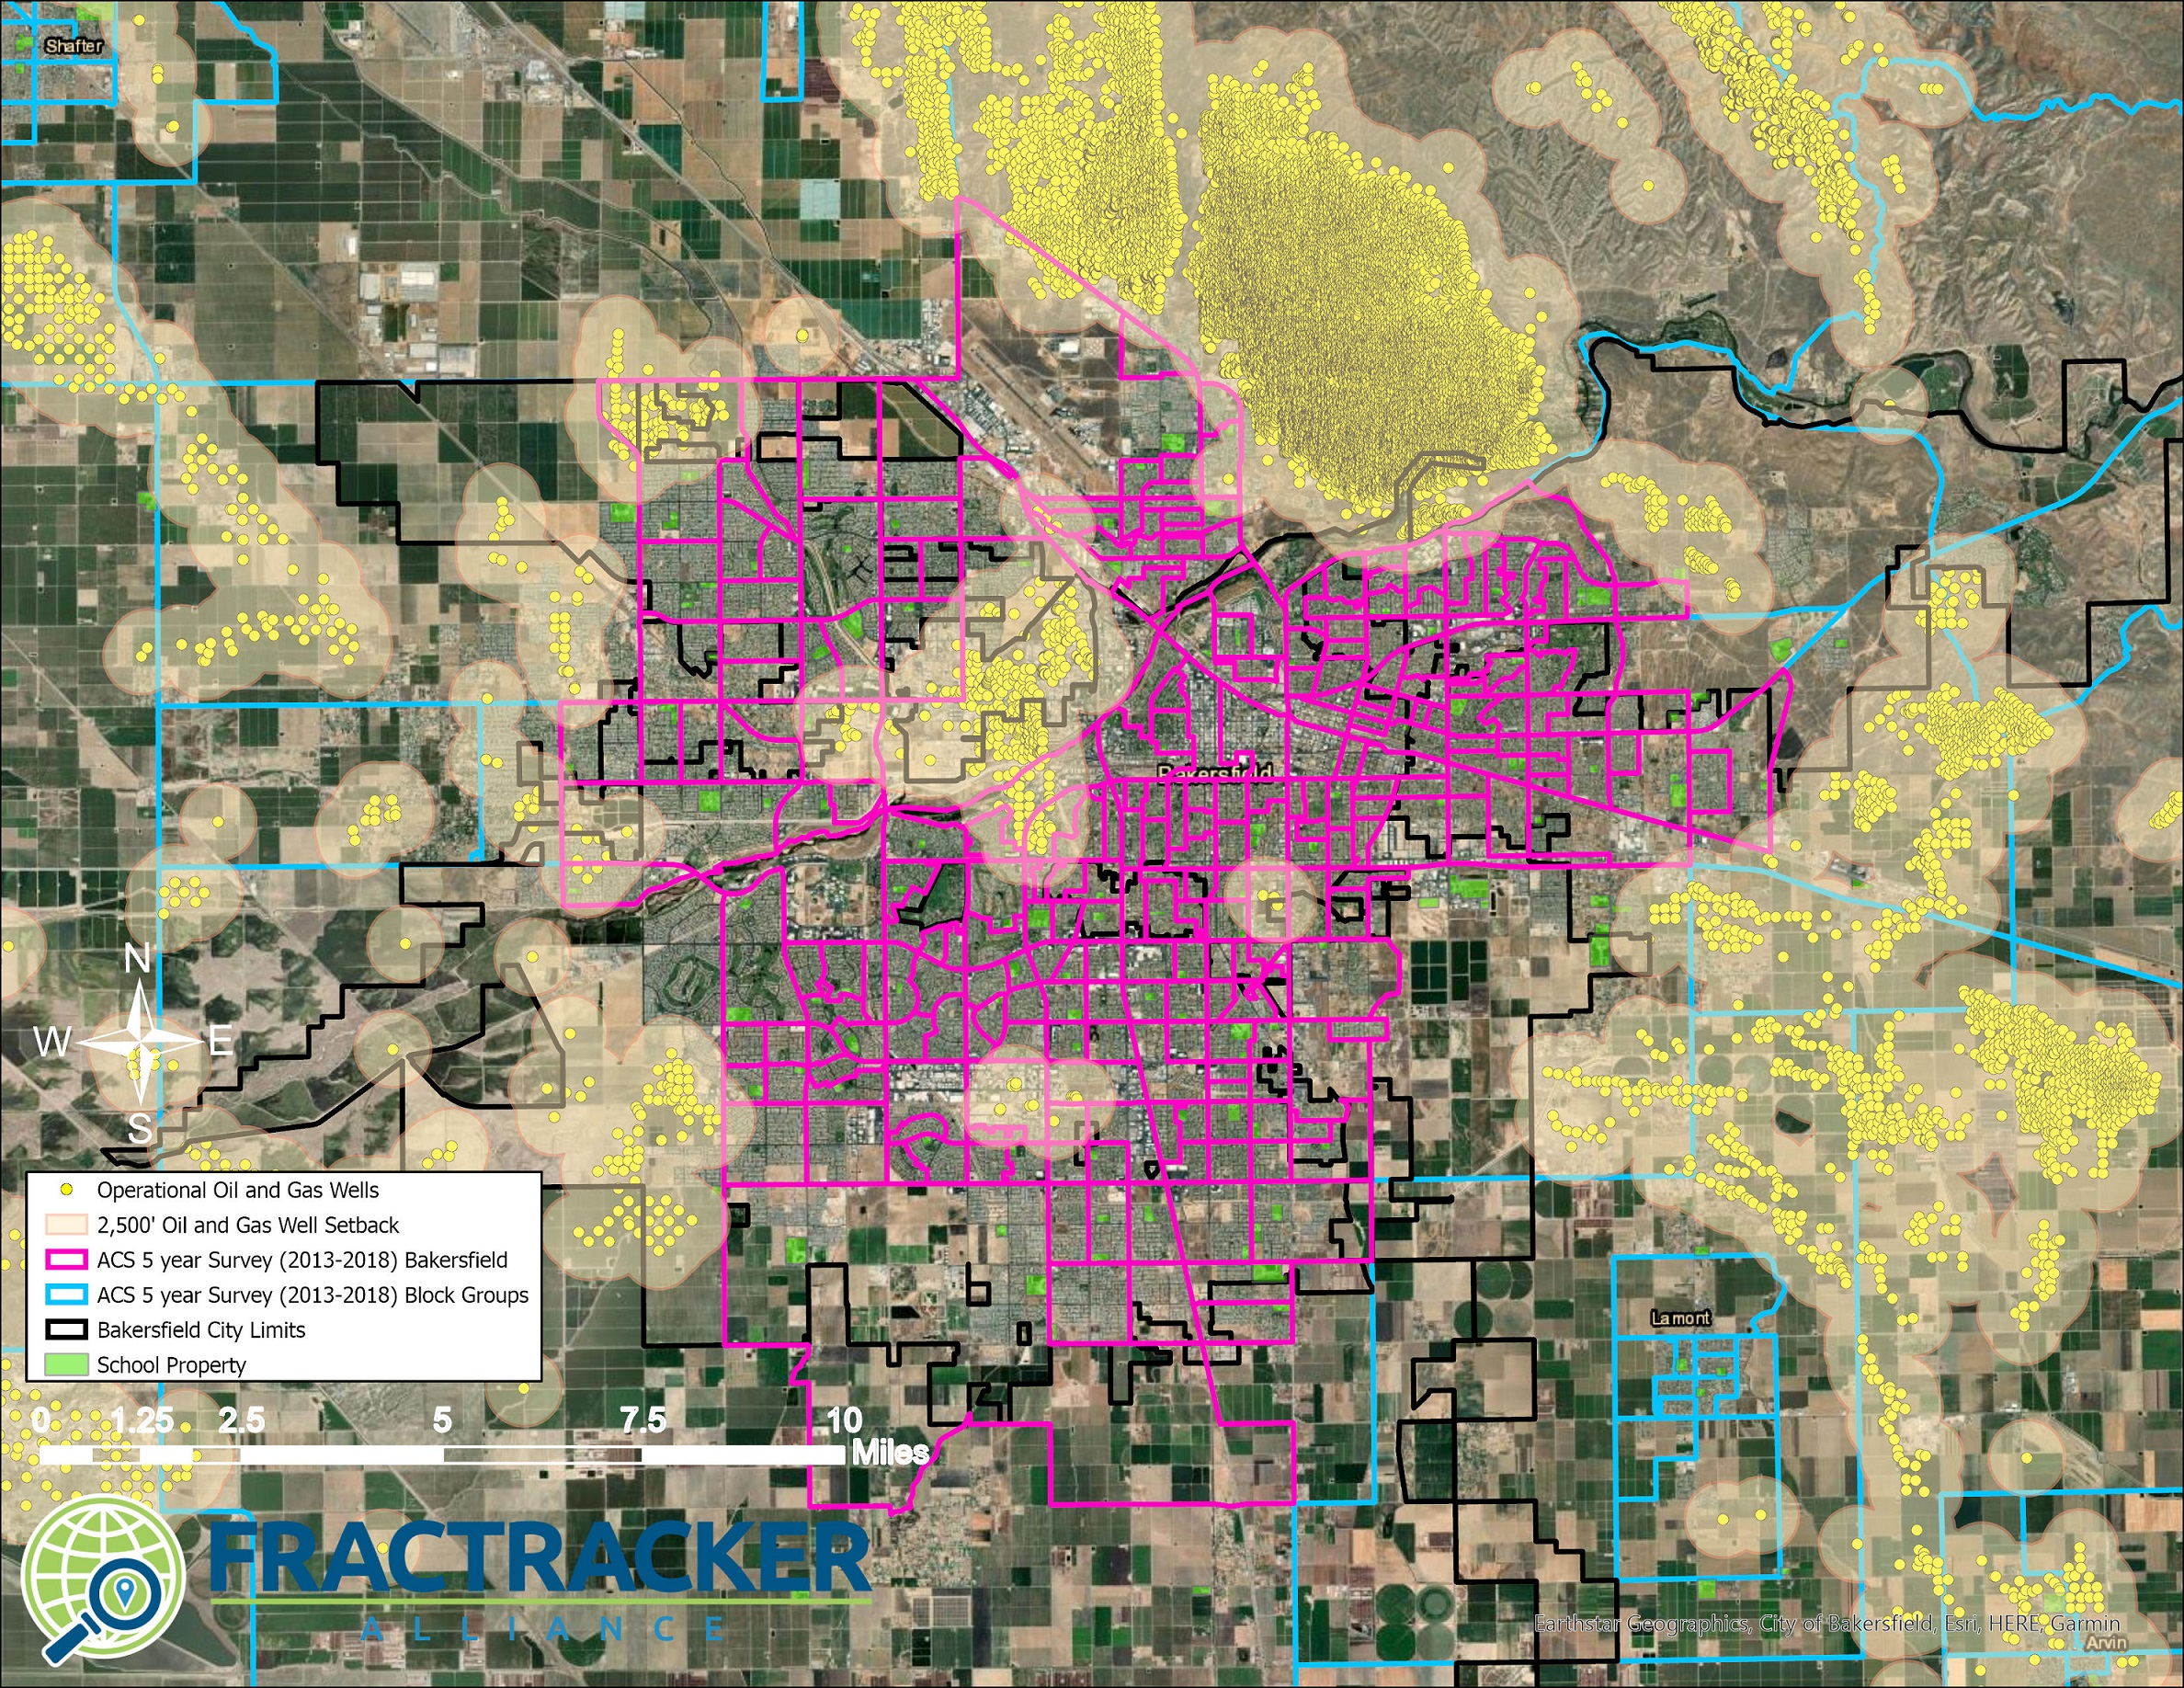
 Map A2. Shafter Census Designated Areas. The map shows the city of Shafter and includes both census tracts and census block groups for comparison. It shows operational oil and gas wells in the map, along with 2,500’ buffers. This Frontline Community would not be included in an analysis that only considers census tracts containing Tier 1 areas negatively impacted by oil and gas extraction operations. The census tract containing the North Shafter oil field forms a donut around the city of Shafter.

 Ted Auch, FracTracker Alliance