The majority of FracTracker’s posts are generally considered articles. These may include analysis around data, embedded maps, summaries of partner collaborations, highlights of a publication or project, guest posts, etc.
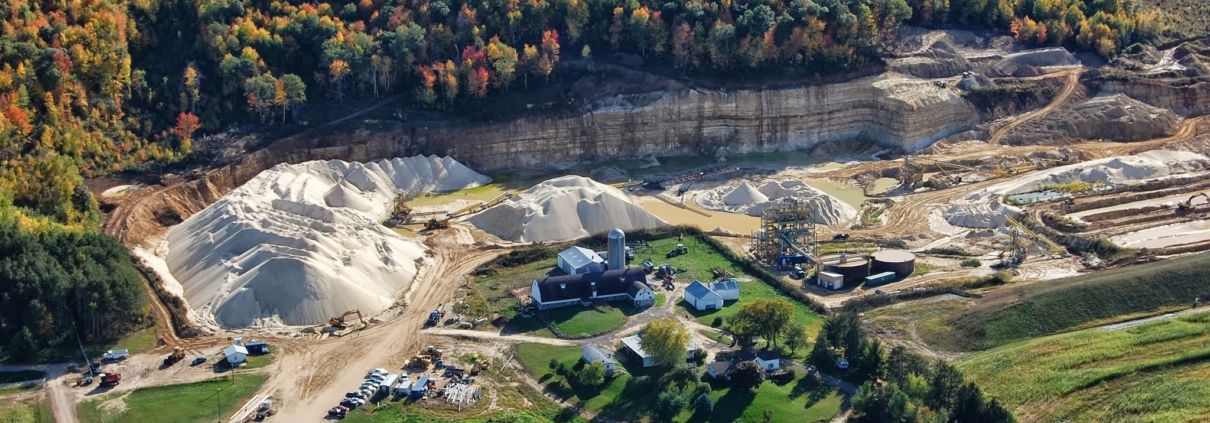
We updated the FracTracker North Dakota Shale Viewer with current data and additional details on the astronomical levels of water used and waste produced throughout the process of fracking for oil and gas in North Dakota.
As folks who visit the FracTracker website may know, the fracking industry is predicated on cheap sources of water and waste disposal. The water they use to bust open shale seams becomes part of the waste stream that they refer to by the benign term “brine,” equating it to nothing more than the salt water we swim in when we hit the beaches.
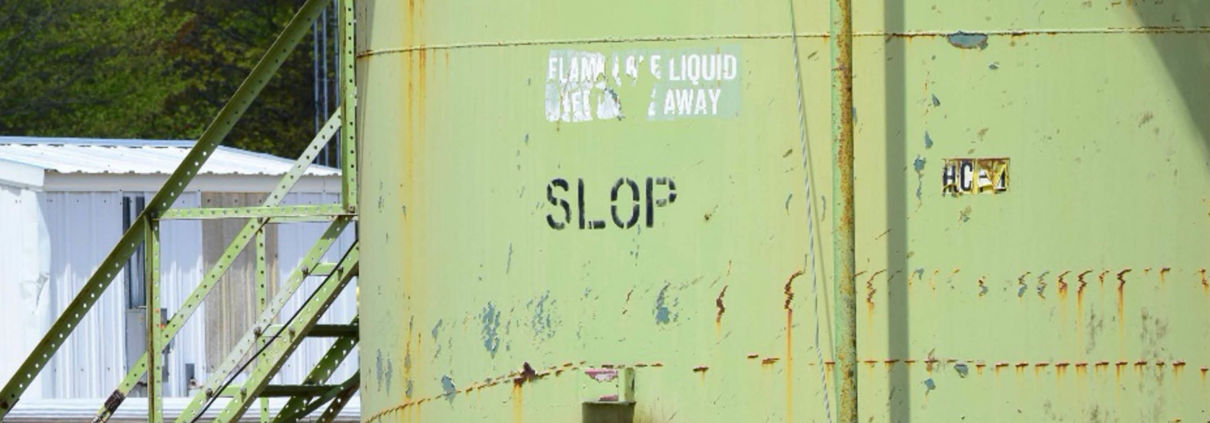
Some oil and gas operators like SWEPI and Enervest in Michigan, however, have taken to calling their waste “SLOP” (Figure 1), which from my standpoint is actually refreshingly honest.
Since we created our North Dakota Shale Viewer on October 5th, 2012, much has changed across the fracking landscape, while other songs have remained the same. Both of these truths exist with respect to fracking’s impact on water and the industry’s inability to get its collective head around the billions of barrels of oftentimes radioactive waste it produces by its very nature. From the outset, fracking was on dubious footing when it came to the water and waste associated with its operations, and we have seen a nearly universal and exponential increase in water demand and waste production on a per well basis since fracking became the highly divisive topic it remains to this day.
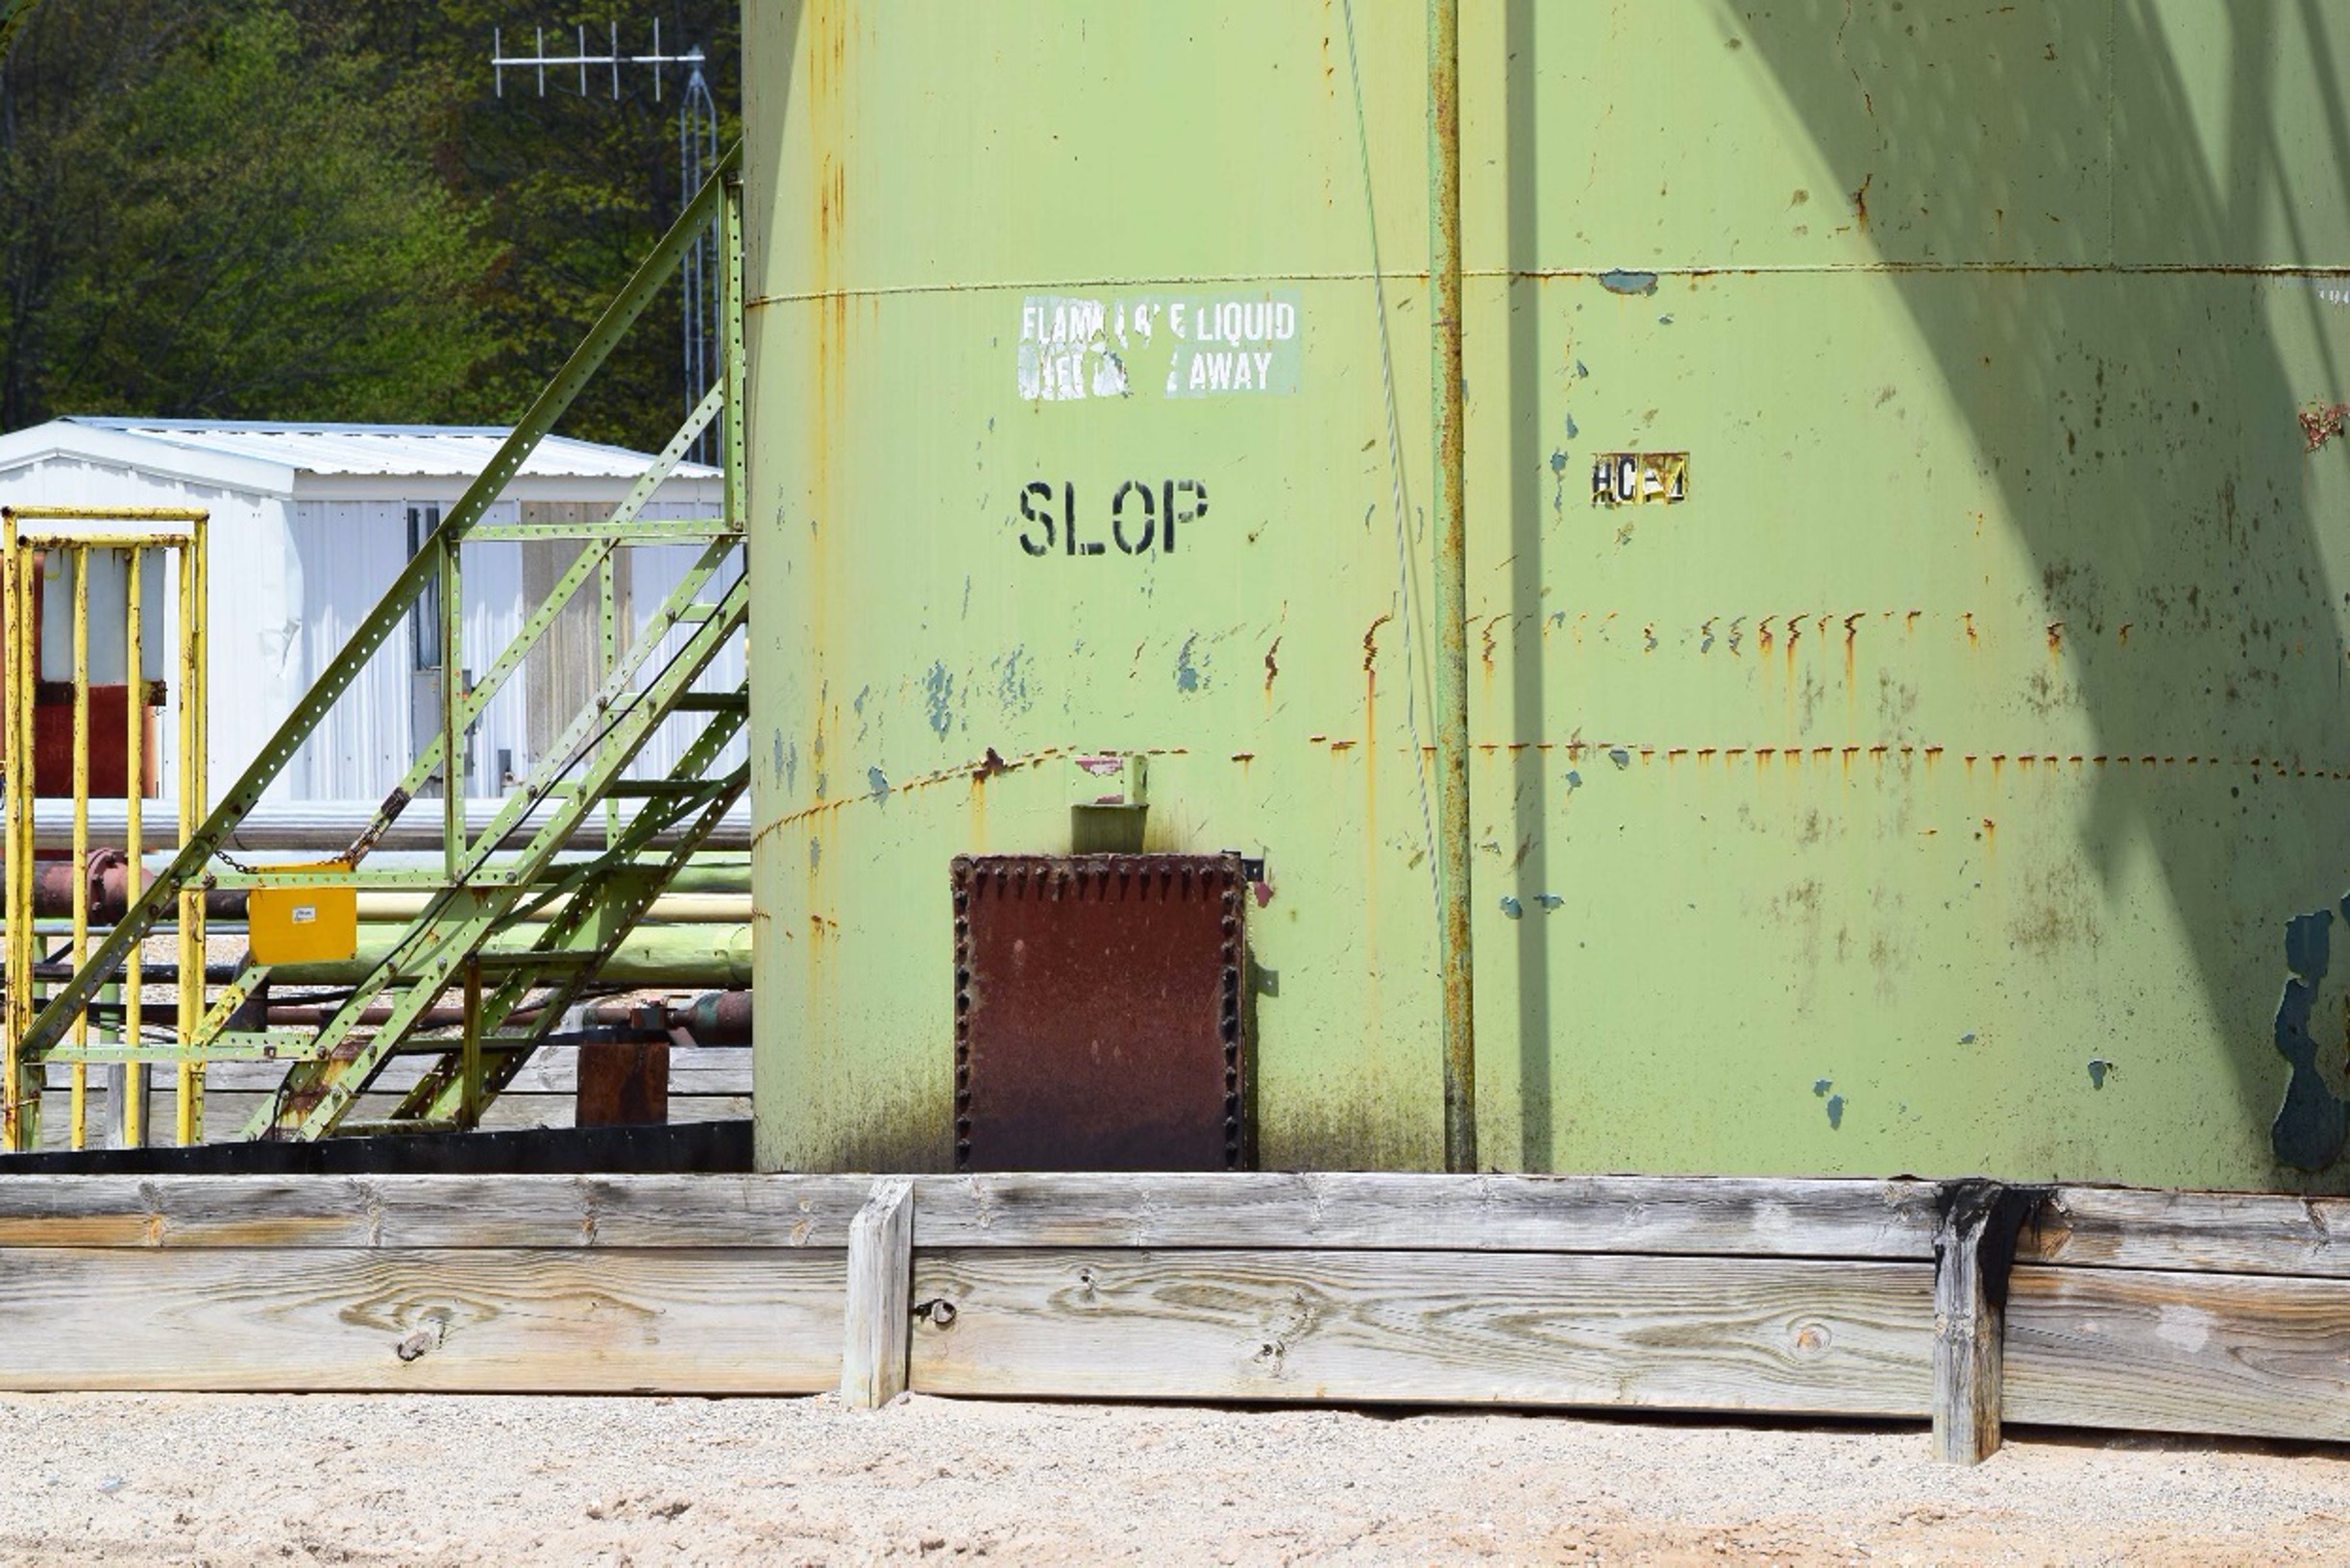
Figure 1. Oil & Gas waste tank operated by SWEPI and Enervest at the Hayes pad, Otsego County, Michigan May 21st, 2016 (44.892933, -84.786530). Photo by Ted Auch, FracTracker Alliance.
Environmental economists like to look at energy sources from a more holistic standpoint vis a vis engineers, traditional economists, and the divide-and-conquer rhetoric from Bismarck to the White House. They do this by placing all manner of energy sources along a spectrum of Energy Return On Energy Invested (EROEI).
Since the dawn of the fracking revolution, shale gas from horizontal wells has been near the bottom of the league tables with respect to EROEI which means it “…has decreased from more than 1000:1 in 1919 to 5:1 in the 2010s, and for production from about 25:1 in the 1970s to approximately 10:1 in 2007” for US oil and gas according to Hall et al. (2014). This is what John Erik Meyer has come the “EROI Mountain” whereby we’ve already “burned through the richest resources.”
It stands to reason that if natural gas from fracking were a real “bridge fuel” in the transition away from coal, it would at least approach or exceed the EROEI of the latter, but at 46:1 coal is still four times more efficient than natural gas. However, it must be said that coal’s days are numbered as well. Witness the recent bankruptcy of coal giant Murray Energy, and the only reason its EROEI has increased or remained steady is because the mining industry has transitioned to almost exclusively mountaintop removal and/or strip mining and the associated efficiencies resulting from mechanization/automation.
We enhanced our North Dakota Shale Viewer nearly eight years since it debuted. This exercise included the addition of several data layers that speak to the above issues and how they have changed since we first launched the North Dakota Shale Viewer.
It is worth noting that oil production in total across North Dakota has not even doubled since 2012, and gas production has only managed to increase 3.5-fold. However, the numbers look even worse when you look at these totals on a per well basis, which as I have mentioned seems to me to be the only way reasonable people should be looking at production. Using this lens, we see that production of oil in North Dakota on a per well basis oil is 1% less than it was in 2012 and gas production has not even doubled per well. This is a stunning contrast to the upticks in water and waste we have documented and are now including in our North Dakota Shale Viewer.
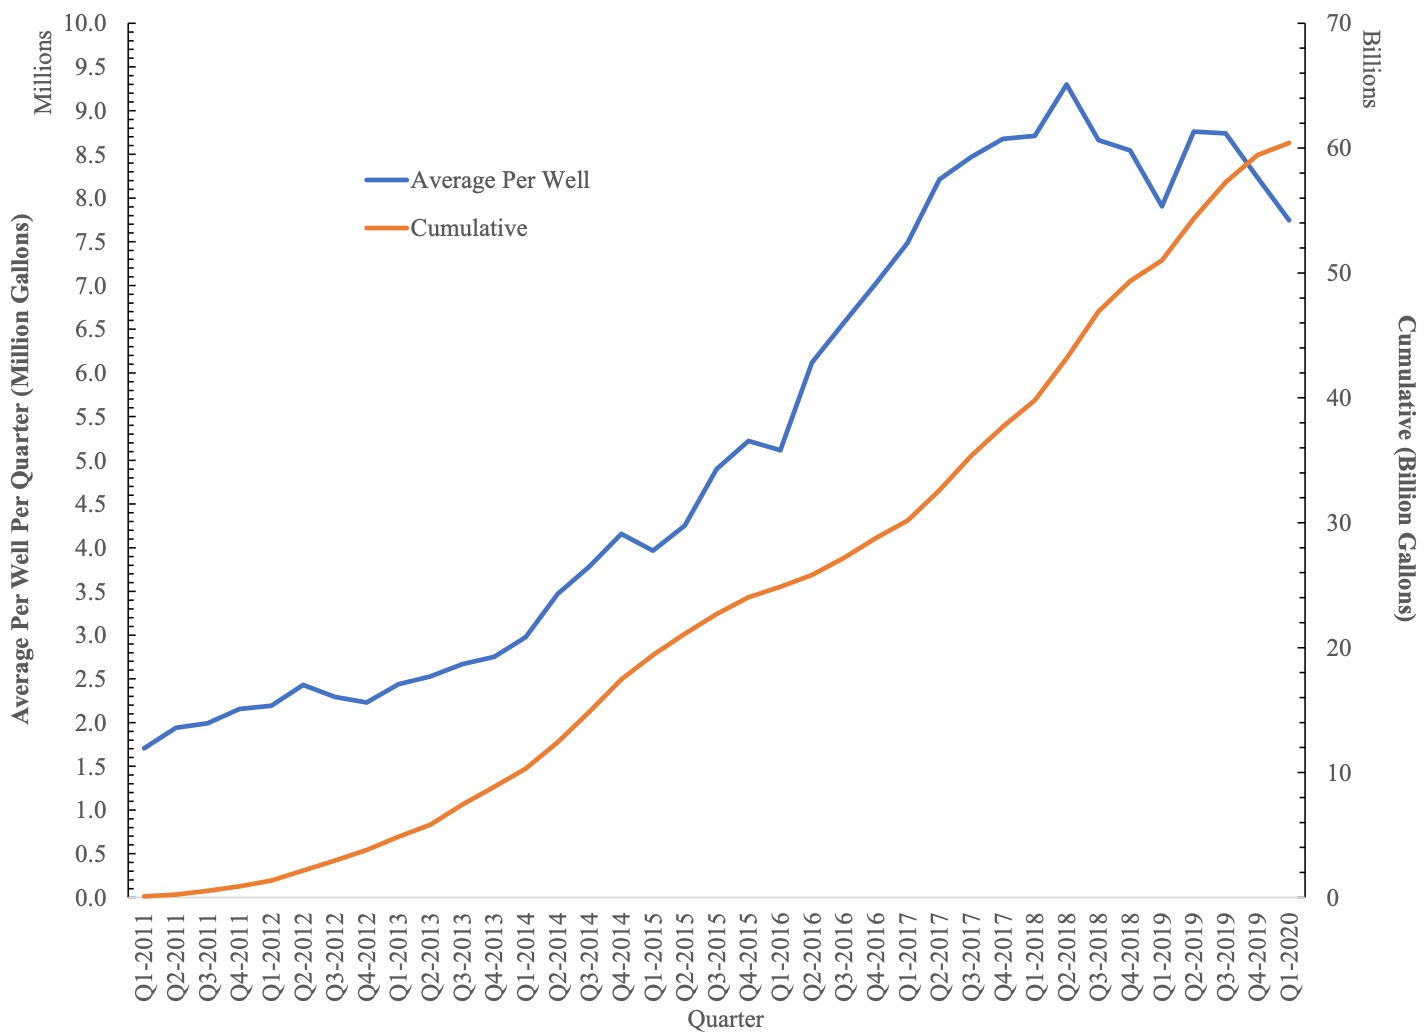
We’ve incorporated individual horizontal well freshwater demand for nearly 12,000 wells up to and including Q1-2020. The numbers are jaw dropping when you consider that at the time we debuted this map North Dakota, unconventional wells were using roughly 2.1 million gallons per well compared to an average of 8.3 million gallons per well so far this year. This per well increase is something we have been documenting for years now in states like Pennsylvania, Ohio, and West Virginia.
For more analysis around water used for fracking, see “The Human Right to Water and Unconventional Energy,” a paper co-authored by Dr. Ted Auch with partners in the UK.
This is concerning for multiple reasons, the first being that if fracking ever were to rebound to its halcyon days of the early teens, it would mean some of our country’s most prized and fragile watersheds would be pushed to an irreversible hydrological tipping point. Hoekstra et al. (2012) have come to call this the “blue water” precautionary principle whereby “depletion beyond 20% of a river’s natural flow increases risks to ecological health and ecosystem services.”
Another concern is that while permitting in North Dakota has slowed like it has nationwide, the aforementioned quarterly water usage totals per well are now 5.25 times what they were in October 2012 and the total water used by the industry in North Dakota now amounts to 60.43 billion gallons– that we know of — which is nearly 50 times what the industry had used when we created our North Dakota Shale Viewer (Figure 2).[1]
With respect to the points made earlier about the value of EROEI, this increase in water demand has not been reflected in the productivity of North Dakota’s oil and gas wells, which means the EROEI continues to fall at rate that should make the industry blush. Furthermore, this trend should prompt regulators and elected officials in Bismarck and elsewhere to begin to ask if the long-term and permanent environmental and/or hydrological risk is worth the short-term rewards vis à vis the “blue water” precautionary principle, in this case of the Missouri River, outlined by Hoekstra et al. (2012). It is my opinion that it most assuredly is not and never was worth the risk!
The most stunning aspect of the above divergence in production and water demand is that on a per well basis, water only costs the industry roughly 0.46-0.76% of total well pad costs. This narrow range is a function of the water pricing schemes shared with me by the North Dakota Western Area Water Supply Authority (WAWSA). This speaks to an average price of water between $3.68 and $4.07 per 1,000 gallons for “industrial” use (aka, fracking industry) by way of eight depots and “several hundred miles of transmission and distribution lines” spread across the state’s four northwest counties of Mountrail, Divide, Williams, and McKenzie.
Figure 2. Average Freshwater Demand Per Well and Cumulative Freshwater Demand by North Dakota fracking industry from 2011 to Q1-2020.
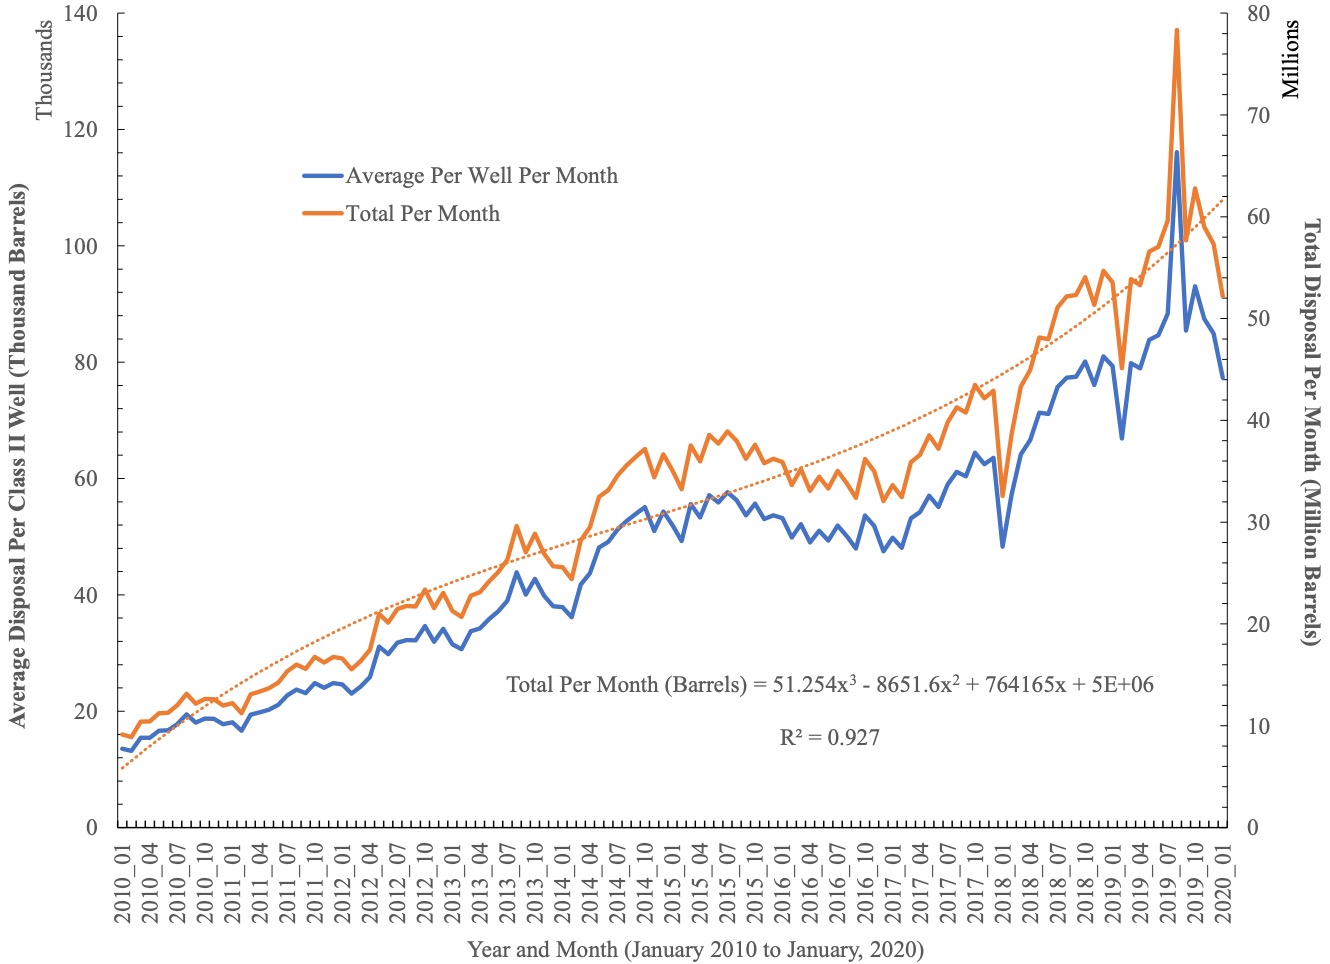
On the fracking waste front, the monthly trend is quite volatile relative to what we’ve documented in states like Oklahoma, Kansas, and Ohio. Nonetheless, the amount of waste produced is increasing per well and in total. How you quantify this increase is quite sensitive to the models you fit to the data. The exponential and polynomial (Plotted in Figure 3) fits yield 4.76 to 9.81 million barrel per month increases, while linear and power functions yield the opposite resulting in 1.82 to 10.91 million-barrel declines per month. If we assume the real answer is somewhere in between we see that fracking waste is increasingly slightly at a rate of 1.51% per year or 460,194 barrels per month.
Figure 3. Average Per Well and Monthly Total Fracking Waste Disposal across 675 North Dakota Class II Salt Water Disposal (SWD) wells from 2010 to Q1-2020.
North Dakota has concerning legislation related to oil and gas waste disposal. Senate Bill 2344 claims that landowners do not actually own the “subsurface pore space” beneath their property. The bill was passed into law by Legislature last Spring but there are numerous lawsuits working against it. We will have further analysis of this bill published on FracTracker.org soon.
FracTracker collaborated with Earthworks to create an interactive map that allows North Dakota residents to determine if oil and gas waste is disposed of or has spilled near them in addition to a list of recommendations for state and local policymakers, including the closing of the state’s harmful oil and gas hazardous waste loophole. Read the report for detailed information about oil and gas waste in North Dakota.
This data is critical to understanding the environmental and/or hydrological impact(s) of fracking, whether it is Central Appalachia’s Ohio River Valley, or in this case North Dakota’s Missouri River Basin. We will continue to periodically update this data.
Without supply-side price signaling or adequate regulation, it appears that the industry is uninterested and insufficiently incentivized to develop efficiencies in water use. It is my opinion that the only way the industry will be incentivized to do so is if states put a more prohibitive and environmentally responsible price on water and waste. In the absence of outright bans on fracking, we must demand the industry is held accountable for pushing watersheds to the brink of their capacity, and in the process, compromising the water needs of so many communities, flora, and fauna.
[1] Here in Ohio where I have been looking most closely at water supply and demand across the fracking landscape it is clear that we aren’t accounting for some 10-12% of water demand when we compare documented water withdrawals in the numerator with water usage in the denominator.
By Ted Auch, PhD, Great Lakes Program Coordinator
Part of the Falcon Public Environmental Impact Assessment – a FracTracker series on the impacts of Falcon Ethane Pipeline System
Challenges have plagued Shell’s construction of the Falcon Pipeline System through Pennsylvania, Ohio, and West Virginia, according to documents from the Pennsylvania Department of Environmental Protection (DEP) and the Ohio Environmental Protection Agency (EPA).
Records show that at least 70 spills have occurred since construction began in early 2019, releasing over a quarter million gallons of drilling fluid. Yet the true number and volume of spills is uncertain due to inaccuracies in reporting by Shell and discrepancies in regulation by state agencies.
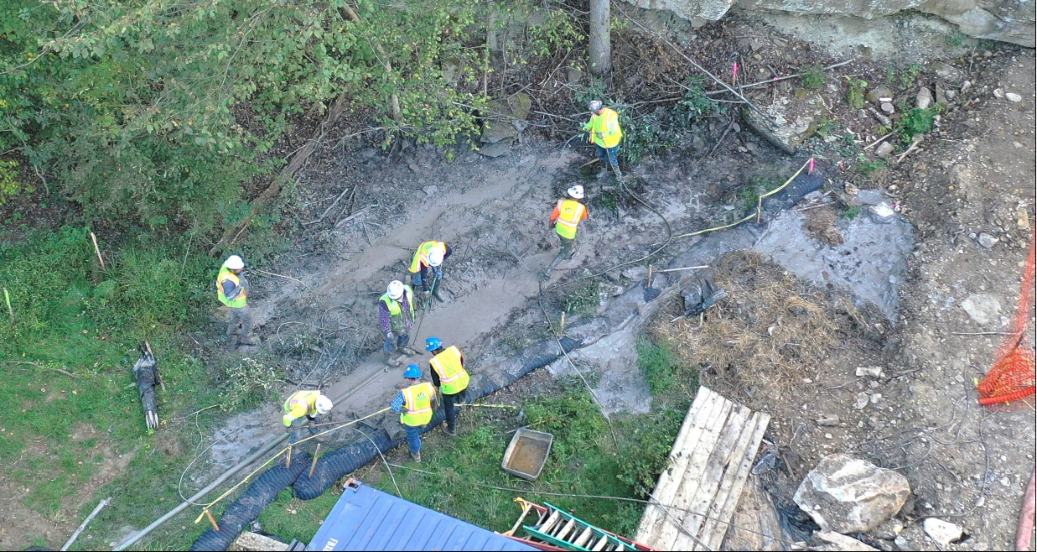
A drilling fluid spill from Falcon Pipeline construction near Moffett Mill Road in Beaver County, PA. Source: Pennsylvania DEP
Releases of drilling fluid during Falcon’s construction include inadvertent returns and losses of circulation – two technical words used to describe spills of drilling fluid that occur during pipeline construction.
Drilling fluid, which consists of water, bentonite clay, and chemical additives, is used when workers drill a borehole horizontally underground to pull a pipeline underneath a water body, road, or other sensitive location. This type of installation is called a HDD (horizontal directional drill), and is pictured in Figure 1.
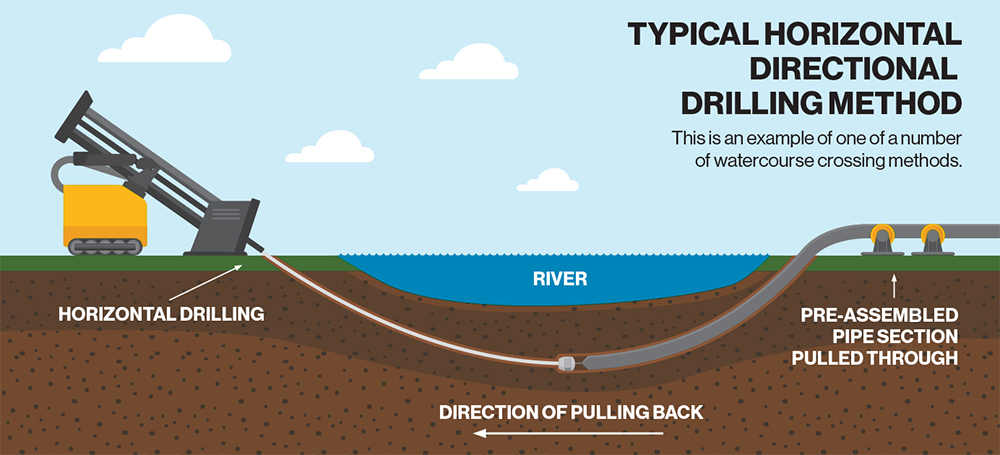
Figure 1. An HDD operation – Thousands of gallons of drilling fluid are used in this process, creating the potential for spills. Click to expand. Source: Enbridge Pipeline
Here’s a breakdown of what these types of spills are and how often they’ve occurred during Falcon pipeline construction, as of March, 2020:
However, according to the Ohio EPA, Shell is not required to submit reports for losses of circulation that are less than the definition of an inadvertent return, so many losses may not be captured in the list above. Additionally, documents reveal inconsistent volumes of drilling mud reported and discrepancies in the way releases are regulated by the Pennsylvania DEP and the Ohio EPA.
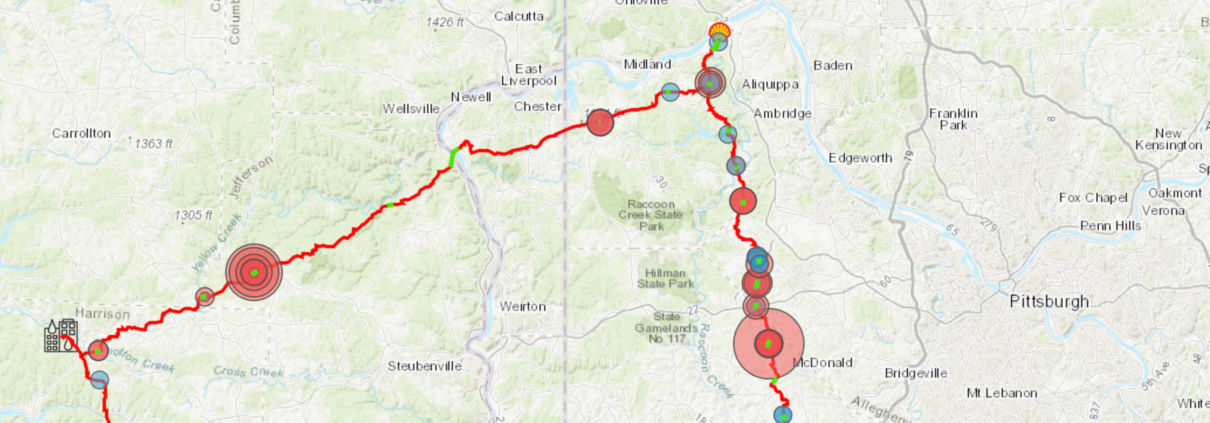
Very few of these incidents were published online for the public to see; FracTracker obtained information on them through a public records request. The map below shows the location of all known drilling fluid releases from that request, along with features relevant to the pipeline’s construction. Click here to view full screen, and add features to the map by checking the box next to them in the legend. For definitions and additional details, click on the information icon.
Our investigation into these incidents began early this year when we received an anonymous tip about a release of drilling fluids in the range of millions of gallons at the SCIO-06 HDD over Wolf Run Road in Jefferson County, Ohio. The source stated that the release could be contaminating drinking water for residents and livestock.
Working with Clean Air Council, Fair Shake Environmental Legal Services, and DeSmog Blog, we quickly discovered that this spill was just the beginning of the Falcon’s construction issues.
Documents from the Ohio EPA confirm that there were at least eight losses of circulation at this location between August 2019 and January 2020, including losses of unknown volume. The SCIO-06 HDD location is of particular concern because it crosses beneath two streams (Wolf Run and a stream connected to Wolf Run) and a wetland, is near groundwater wells, and runs over an inactive coal mine (Figure 2).
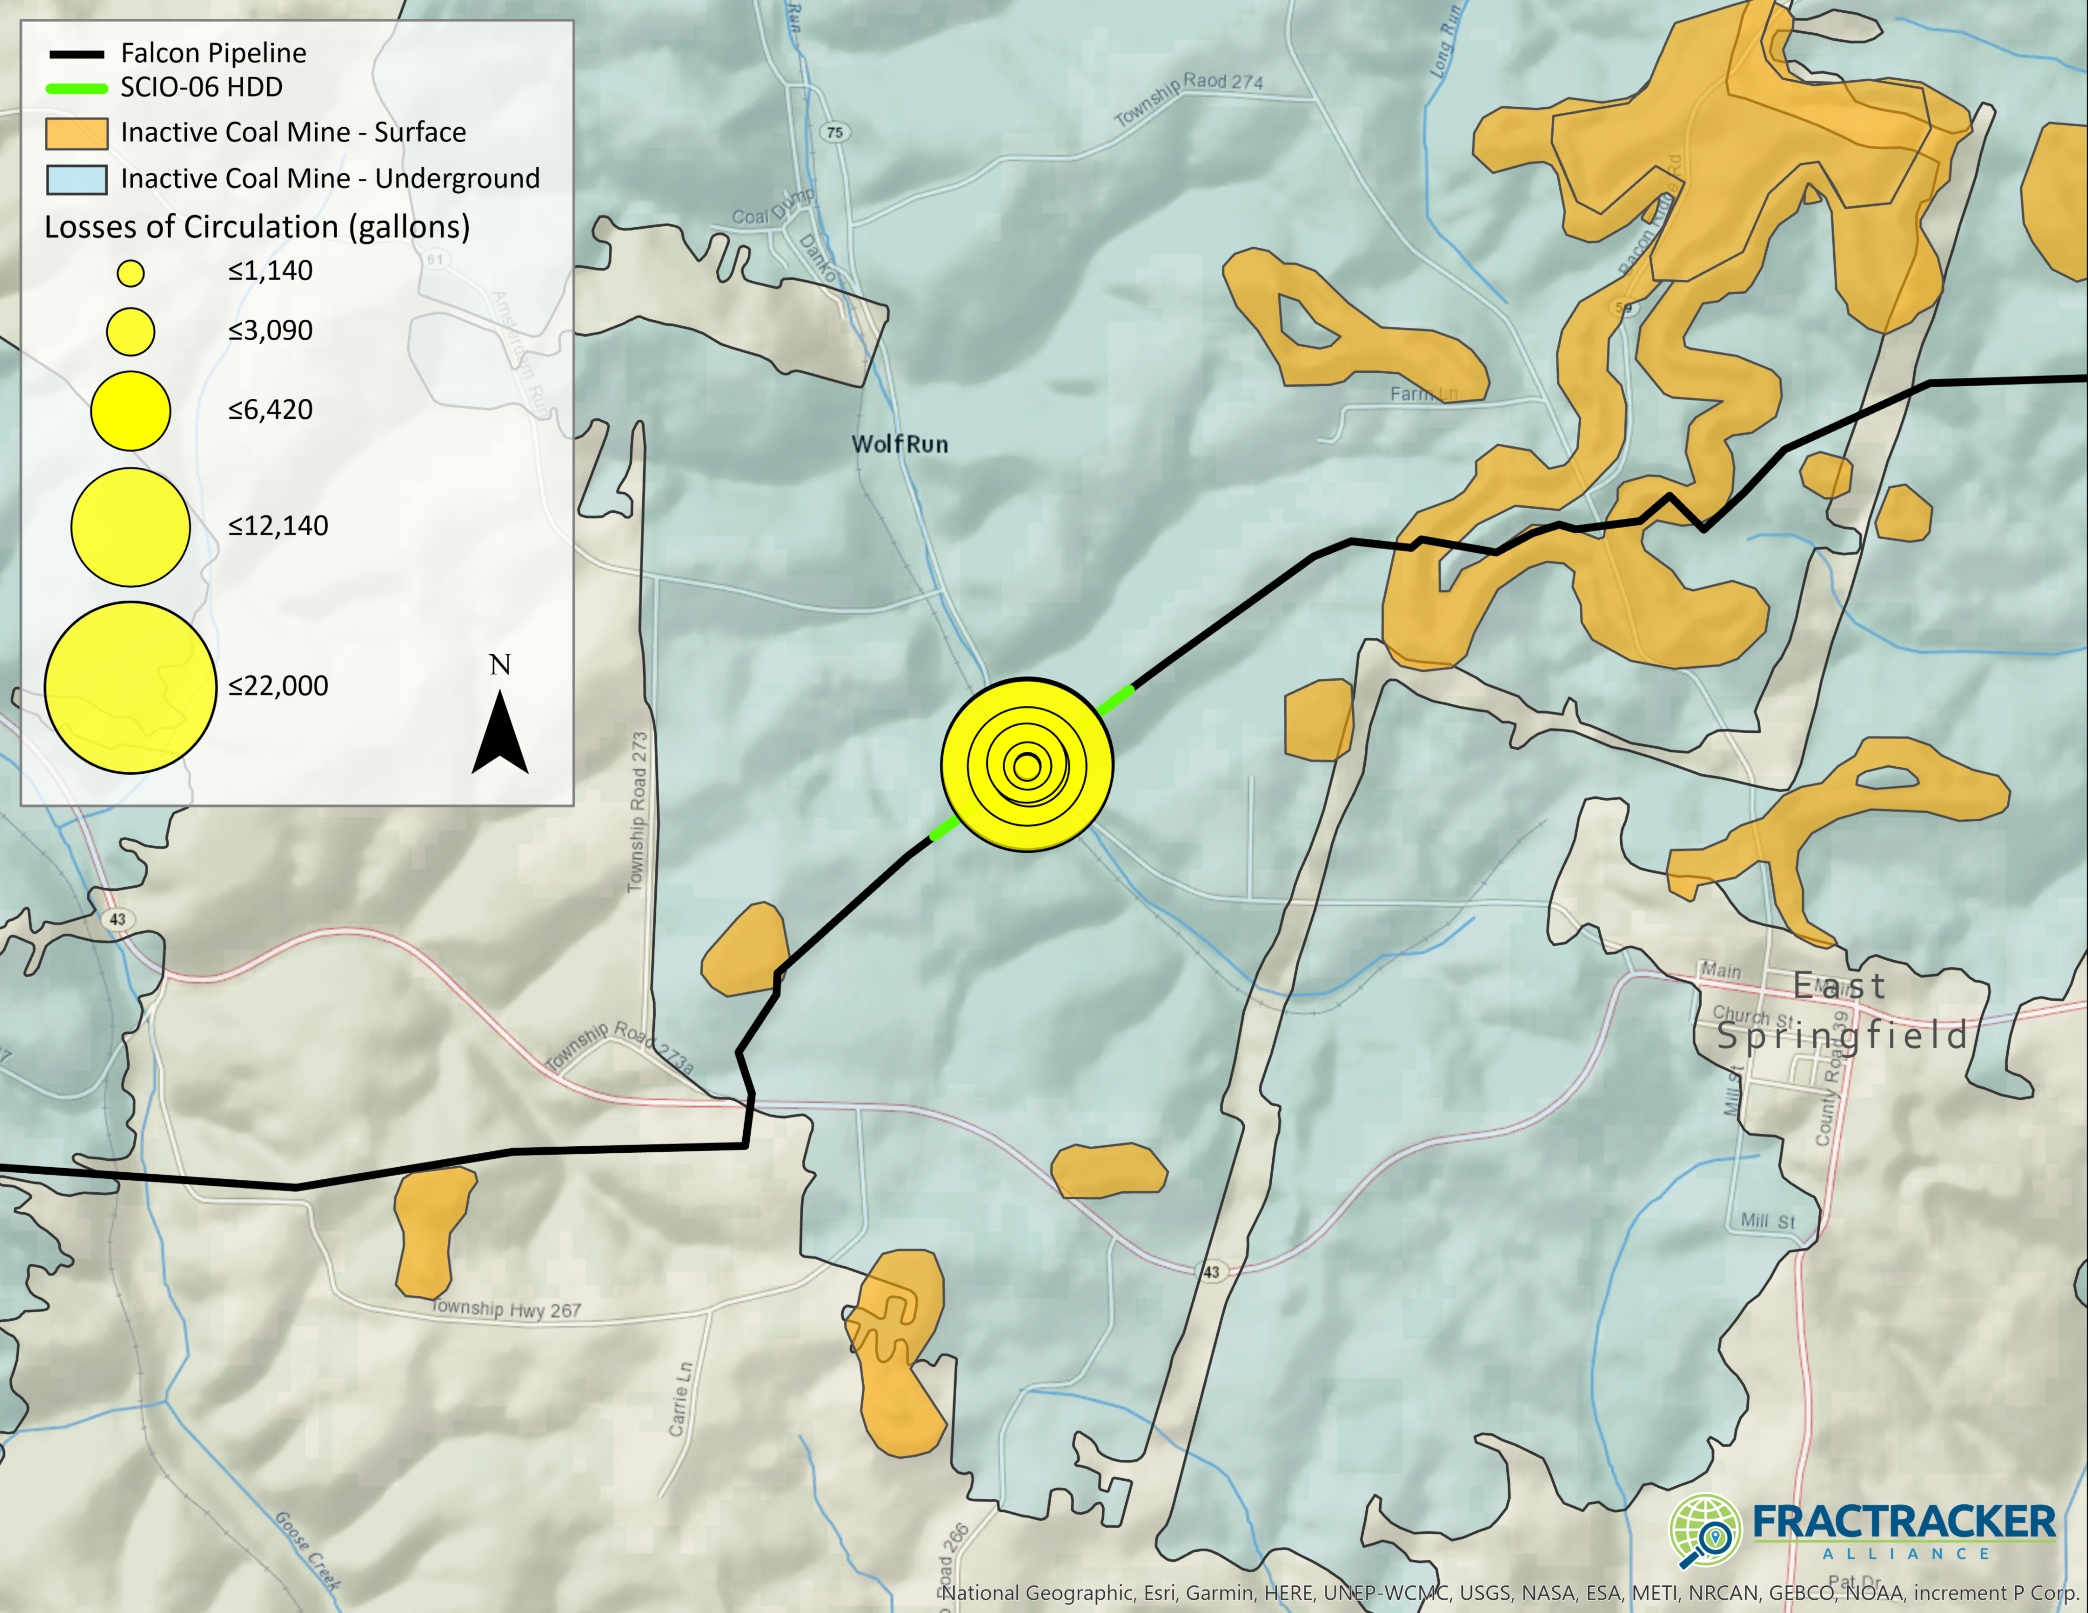
Figure 2. Losses of circulation that occurred at the SCIO-06 horizontal directional drill (HDD) site along the Falcon Pipeline in Jefferson County Ohio. Data Sources: OH EPA, AECOM
According to Shell’s survey, the coal mine (shown in Figure 2 in blue) is 290 feet below the HDD crossing. A hazardous scenario could arise if an HDD site interacts with mine voids, releasing drilling fluid into the void and creating a new mine void discharge.
A similar situation occurred in 2018, when EQT Corp. was fined $294,000 after the pipeline it was installing under a road in Forward Township, Pennsylvania hit an old mine, releasing four million gallons of mine drainage into the Monongahela River.
The Ohio EPA’s Division of Drinking and Ground Waters looked into the issues around this site and reported, “GIS analysis of the pipeline location in Jefferson Co. does not appear to risk any vulnerable ground water resources in the area, except local private water supply wells. However, the incident location is above a known abandoned (pre-1977) coal mine complex, mapped by ODNR.”
While we cannot confirm if there was a spill in the range of millions of gallons as the source claimed, the reported losses of circulation at the SCIO-06 site total over 60,000 gallons of drilling fluid. Additionally, on December 10th, 2019, the Ohio EPA asked AECOM (the engineering company contracted by Shell for this project) to estimate what the total fluid loss would be if workers were to continue drilling to complete the SCIO-06 crossing. AECOM reported that, in a “very conservative scenario based on the current level of fluid loss…Overall mud loss to the formation could exceed 3,000,000 gallons.”
Despite this possibility of a 3 million+ gallon spill, Shell resumed construction in January, 2020. The company experienced another loss of circulation of 4,583 gallons, reportedly caused by a change in formation. However, in correspondence with a resident, Shell stated that the volume lost was 3,200 gallons.
Whatever the amount, this January loss of circulation appears to have convinced Shell that an HDD crossing at this location was too difficult to complete, and in February 2020, Shell decided to change the type of crossing at the SCIO-06 site to a guided bore underneath Wolf Run Rd and open cut trench through the stream crossings (Figure 3).
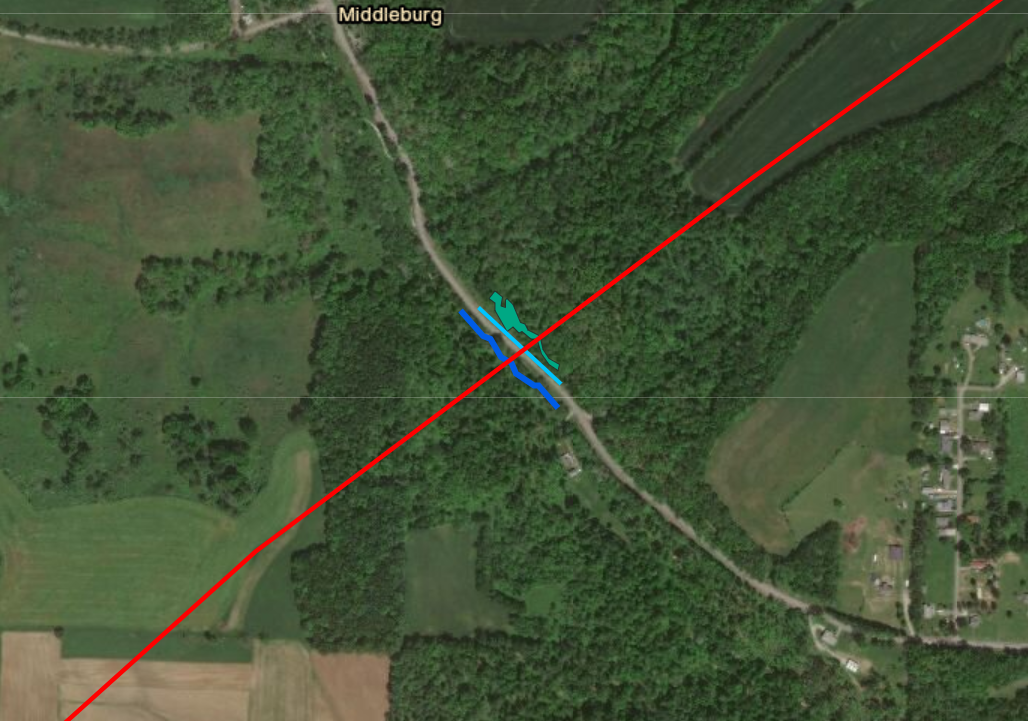
Figure 3. The SCIO-06 HDD site, which may be changed from an HDD crossing to an open cut trench and conventional bore to cross Wolf Run Rd, Wolf Run stream (darker blue), an intermittent stream (light blue) and a wetland (teal). Click to expand.
An investigation by DeSmog Blog revealed that Shell applied for the route change under Nationwide Permit 12, a permit required for water crossings. While the Army Corps of Engineers authorized the route change on March 17th, one month later, a Montana federal court overseeing a case on the Keystone XL pipeline determined that the Nationwide Permit 12 did not meet standards set by federal environmental laws – a decision which may nullify the Falcon’s permit status. At this time, the ramifications of this decision on the Falcon remain unclear.
In looking through Shell’s loss of circulation reports, we noted several discrepancies about the volume of drilling fluid released for different spills, including those that occurred at the SCIO-06 site. As one example, the Ohio EPA stated an email about the SCIO-06 HDD, “The reported loss of fluid from August 1, 2019 to August 14, 2019 in the memo does not appear to agree with the 21,950 gallons of fluid loss reported to me during my site visit on August 14, 2019 or the fluid loss reported in the conference call on August 13, 2019.”
In addition to errors on Shell’s end, our review of documents revealed significant confusion around the regulation of drilling fluid spills. In an email from September 26, 2019, months after construction began, Shell raised the following questions with the Ohio EPA:
A possible explanation for why Shell reported inconsistent volumes of spills is because they were not using the proper technology to measure them.
Shell’s “Inadvertent Returns from HDD: Assessment, Preparedness, Prevention and Response Plan” states that drilling rigs must be equipped with “instruments which can measure and record in real time, the following information: borehole annular pressure during the pilot hole operation; drilling fluid discharge rate; the spatial position of the drilling bit or reamer bit; and the drill string axial and torsional loads.”
In other words, Shell should be using monitoring equipment to measure and report volumes of drilling fluid released.
Despite that requirement, Shell was initially monitoring releases manually by measuring the remaining fluid levels in tanks. After inspectors with the Pennsylvania DEP realized this in October, 2019, the Department issued a Notice of Violation to Shell, asking the company to immediately cease all Pennsylvania HDD operations and implement recording instruments. The violation also cited Shell for not filing weekly inadvertent return reports and not reporting where recovered drilling fluids were disposed.
In Ohio, there is no record of a similar request from the Ohio EPA. The anonymous source that originally informed us of issues at the SCIO-6 HDD stated that local officials and regulatory agencies in Ohio were likely not informed of the full volumes of the industrial waste releases based on actual meter readings, but rather estimates that minimize the perceived impact.
While we cannot confirm this claim, we know a few things for sure: 1) there are conflicting reports about the volume of drilling fluids spilled in Ohio, 2) according to Shell’s engineers, there is the potential for a 3 million+ gallon spill at the SCIO-06 site, and 3) there are instances of Shell not following its permits with regard to measuring and reporting fluid losses.
The inconsistent ways that fluid losses (particularly those that occur underground) are defined, reported, and measured leave too many opportunities for Shell to impact sensitive ecosystems and drinking water sources without being held accountable.
Drilling fluid is primarily composed of water and bentonite clay (sodium montmorillonite), which is nontoxic. If a fluid loss occurs, workers often use additives to try and create a seal to prevent drilling fluid from escaping into underground voids. According to Shell’s “Inadvertent Returns From HDD” plan, it only uses additives that meet food standards, are not petroleum based, and are consistent with materials used in drinking water operations.
However, large inadvertent returns into waterways cause heavy sedimentation and can have harmful effects on aquatic life. They can also ruin drinking water sources. Inadvertent returns caused by HDD construction along the Mariner East 2 pipeline have contaminated many water wells.
Losses of circulation can impact drinking water too. This past April in Texas, construction of the Permian Highway Pipeline caused a loss that left residents with muddy well water. A 3 million gallon loss of circulation along the Mariner East route led to 208,000 gallons of drilling mud entering a lake, and a $2 million fine for Sunoco, the pipeline’s operator.
Our Falcon Public EIA Project found 240 groundwater wells within 1/4 mile of the pipeline and 24 within 1,000 ft of an HDD site. The pipeline also crosses near surface water reservoirs. Drilling mud spills could put these drinking water sources at risk.
But when it comes to understanding the true impact of the more than 245,000+ gallons of drilling fluid lost beneath Pennsylvania and Ohio, there are a lot of remaining questions. The Falcon route crosses over roughly 20 miles of under-mined land (including 5.6 miles of active coal mines) and 25 miles of porous karst limestone formations (learn more about karst). Add in to the mix the thousands of abandoned, conventional, and fracked wells in the region – and you start to get a picture of how holey the land is. Where or how drilling fluid interacts with these voids underground is largely unknown.
In addition to the SCIO-04 HDD, there are other drilling fluid losses that occurred in sensitive locations.
In Robinson Township, Pennsylvania, over a dozen losses of circulation (many of which occurred over the span of several days) released a reported 90,067 gallons of drilling fluid into the ground at the HOU-04 HDD. This HDD is above inactive surface and underground mines.
The Falcon passes through and near surface drinking water sources. In Beaver County, Pennsylvania, the pipeline crosses the headwaters of the Ambridge Reservoir and the water line that carries out its water for residents in Beaver County townships (Ambridge, Baden, Economy, Harmony, and New Sewickley) and Allegheny County townships (Leet, Leetsdale, Bell Acres, and Edgeworth). The group Citizens to Protect the Ambridge Reservoir, which formed in 2012 to protect the reservoir from unconventional oil and gas infrastructure, led efforts to stop Falcon Construction, and the Ambridge Water Authority itself called the path of the pipeline “not acceptable.” In response to public pressure, Shell did agree to build a back up line to the West View Water Authority in case issues arose from the Falcon’s construction.
Unfortunately, a 50-gallon inadvertent return was reported at the HDD that crosses the waterline (Figure 4), and a 160 gallon inadvertent return occurred in Raccoon Municipal Park within the watershed and near its protected headwaters (Figure 5). Both of these releases are reported to have occurred within the pipeline’s construction area and not into waterways.
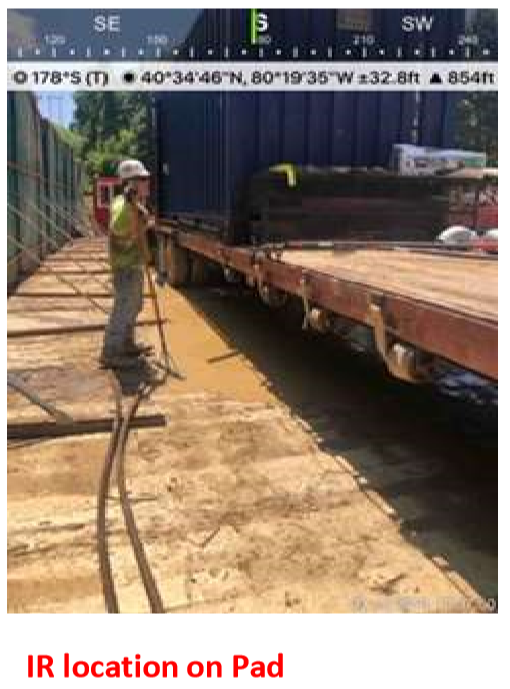
Figure 4) HOU-10 HDD location on the Falcon Pipeline, where 50 gallons were released on the drill pad on 7/9/2019
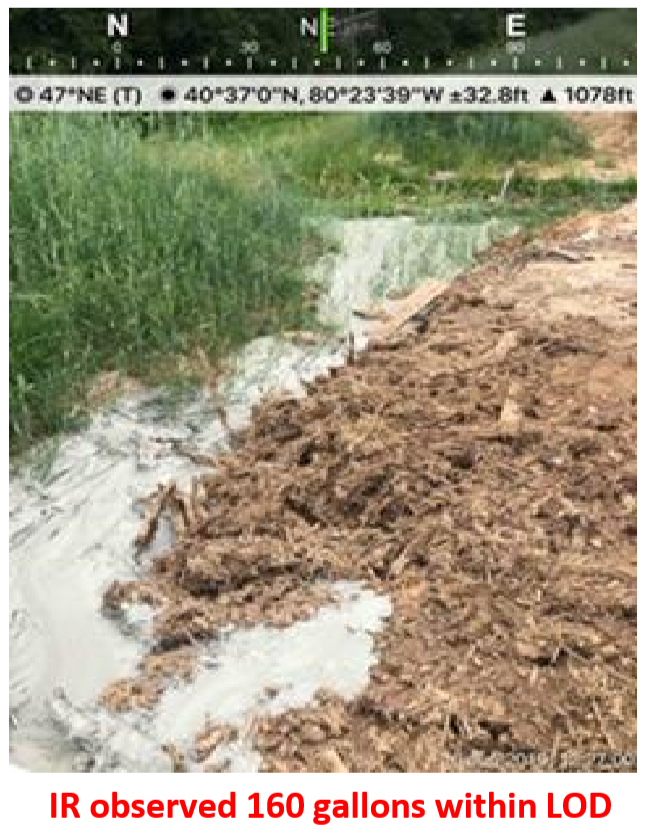
Figure 5) SCIO-05 HDD location on the Falcon Pipeline, where 160 gallons were released on 6/10/19, within the pipeline’s LOD (limit of disturbance)
Farther west, the pipeline crosses through the watershed of the Tappan Reservoir, which provides water for residents in Scio, Ohio and the Ohio River, which serves over 5 million people.
A 35- gallon inadvertent return occurred at a conventional bore within the Tappan Lake Protection Area, impacting a wetland and stream. We are not aware of any spills impacting the Ohio River.
This investigation makes it clear that weak laws and enforcement around drilling fluid spills allows pipeline construction to harm sensitive ecosystems and put drinking water sources at risk. Furthermore, regulations don’t require state agencies or Shell to notify communities when many of these drilling mud spills occur.
Despite the issues Shell experienced during construction, work on the Falcon continued over the past months during state shelter-in-place orders, while many businesses were forced to close.
The problem continues where the 97-mile pipeline ends – at the Shell ethane cracker. In March, workers raised concerns about the unsanitary conditions of the site, and stated that crowded workspaces made social distancing impossible. While Shell did halt construction temporarily, state officials gave the company the OK to continue work – even without the waiver many businesses had to obtain.
The state’s decision was based on the fact it considered the ethane cracker to “support electrical power generation, transmission and distribution.” The ethane cracker – which is still months and likely years away from operation – does not currently produce electrical power and will only provide power generation to support plastic manufacturing.
This claim continues a long pattern of the industry attempting to trick the public into believing that we must continue expanding oil and gas operations to meet our country’s energy needs. In reality, Shell and other oil and gas companies are attempting to line their own pockets by turning the country’s massive oversupply of fracked gas into plastic. And just as Shell and state governments have put the health of residents and workers on the line by continuing construction during a global pandemic, they are sacrificing the health of communities on the frontlines of the plastic industry and climate change by pushing forward the build-out of the petrochemical industry during a global climate crisis.
This election year, while public officials are pushing forward major action to respond to the economic collapse, let’s push for policies and candidates that align with the people’s needs, not Big Oil’s.
By Erica Jackson, Community Outreach & Communications Specialist, FracTracker Alliance
Kern County, California has approved at least 18,356 illegal permits to drill new and rework existing oil and gas wells from 2015 – 2019 (data downloaded May 18, 2020). In a monumental decision in February of 2020, a California court ruled that a Kern County oil and gas ordinance paid for and drafted by the oil industry violated the state’s foundational environmental law. Kern County has failed to consider the environmental harms resulting from oil and gas drilling, such as water supply and air quality problems, farmland degradation, and increased noise, and communities have had enough.
Starting in 2015, Kern County used a local ordinance to fast-track the drilling of up to 72,000 new oil and gas wells over the next 25 years. The court’s recent decision allows the existing 18,356 permits to remain valid, but blocked the county from issuing any more permits after the end of April, 2020. This is an important victory for Kern County communities, but the existing permits present a public health threat that regulators have never adequately addressed.
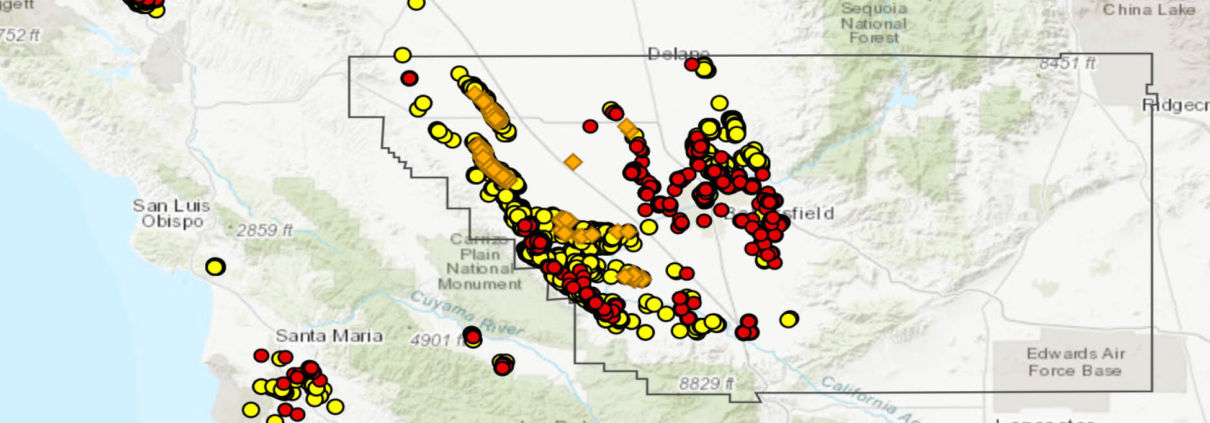
To better understand the impacts of these illegal permits, and identify the communities most impacted, FracTracker Alliance has conducted an environmental justice spatial analysis based on the location of the permits. A map of the permits is found below in Figure 1. shows that there are 18,356 “Drilling” and “Rework” permits issued in Kern County since 2015, as well as the 1,304 permits located within 2,500’ of a sensitive receptor, including hospitals, schools, daycares, and homes.
Figure 1. Map of California Geologic Energy Management Division (CalGEM), formerly the California Division of Oil, Gas, and Geothermal Resources (DOGGR), approved drilling and rework permits, 2015-2019.
View map fullscreen | How FracTracker maps work
The ordinance, written by oil industry consultants, sidestepped state requirements for environmental reviews or public notices, as required by the California Environmental Quality Act (CEQA). It was used as a blanket environmental impact report (EIR), so that the threats of specific projects need not be considered.
To pass the ordinance, the county used a flawed study to hide the immense harm caused by oil and gas drilling and extraction. The appellate court that ruled against the ordinance stated it was passed “despite its significant, adverse environmental impacts.” As a result, the county allowed wells to be constructed next to people’s homes, schools, daycares, and healthcare facilities.
FracTracker aggregated, cleaned, and compiled California Geologic Energy Management Division’s (CalGEM) datasets of well permits. A breakdown of the statewide counts of permit types is shown below in Table 1. The table shows that in 2019, permits to drill new oil and gas wells made up about 34% of total permits. Over the course of the last five years, statewide permits have been distributed pretty equally between drilling wells, reworking wells to increase production (including re-drilling activities like deepening and sidetracking wells), and plugging and abandoning wells.
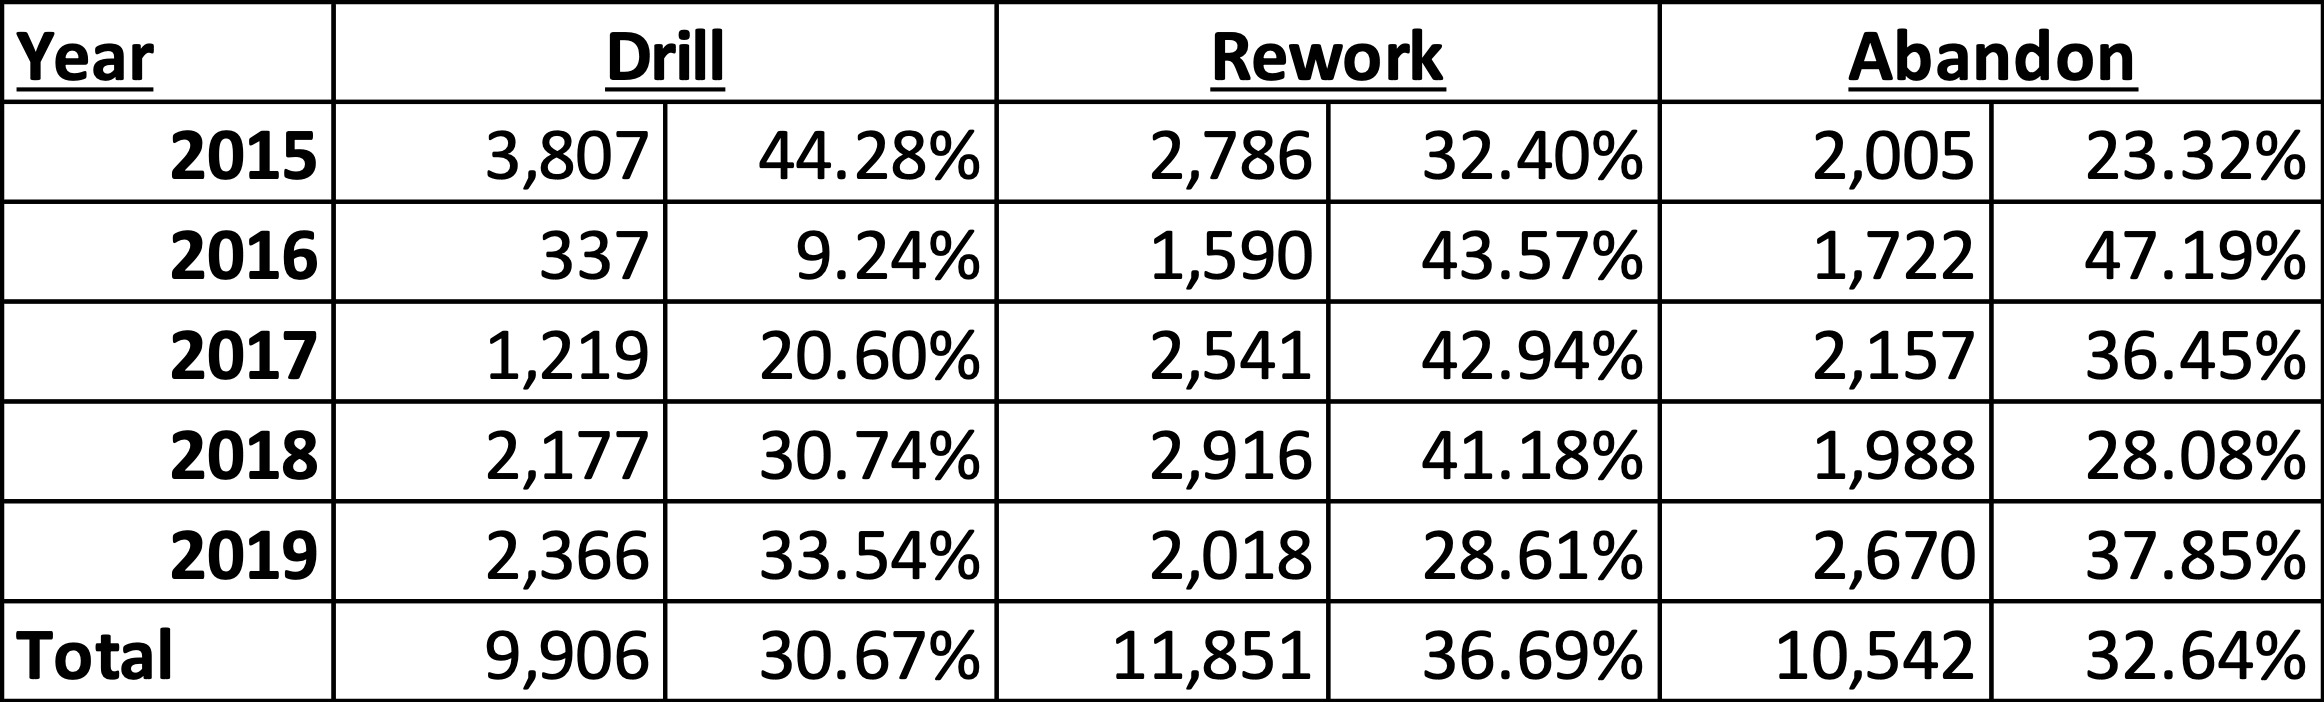
Table 1. Breakdown of permit types issued by California Geologic Energy Management Division (CalGEM), formerly the California Division of Oil, Gas, and Geothermal Resources (DOGGR), 2015-2019.
The illegal Kern County ordinance took effect in 2015, and permit counts for Kern County are shown in Table 2 and Figure 2 below. Note the permit count increase from 2014 to 2015 in the graph in Figure 2. The data shows that Kern County permitting counts increased in 2015 with the passage of the illegal ordinance. In 2016, a new statewide rule (State Bill 4) took effect regulating hydraulic fracturing. Since most oil and gas drilling in California was using hydraulic fracturing, permit numbers statewide, including in Kern, fell drastically. Since 2016, permitting rates have been climbing back up to pre-2016 levels. As of May 18, 2020, Kern County has already approved 1,310 new drilling permits, putting Kern County on track to meet or exceed 2015 permit numbers.
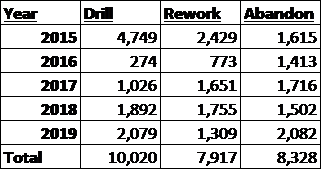
Table 2. Breakdown of permit types issued by California Geologic Energy Management Division (CalGEM) in Kern County alone, 2015-2019.
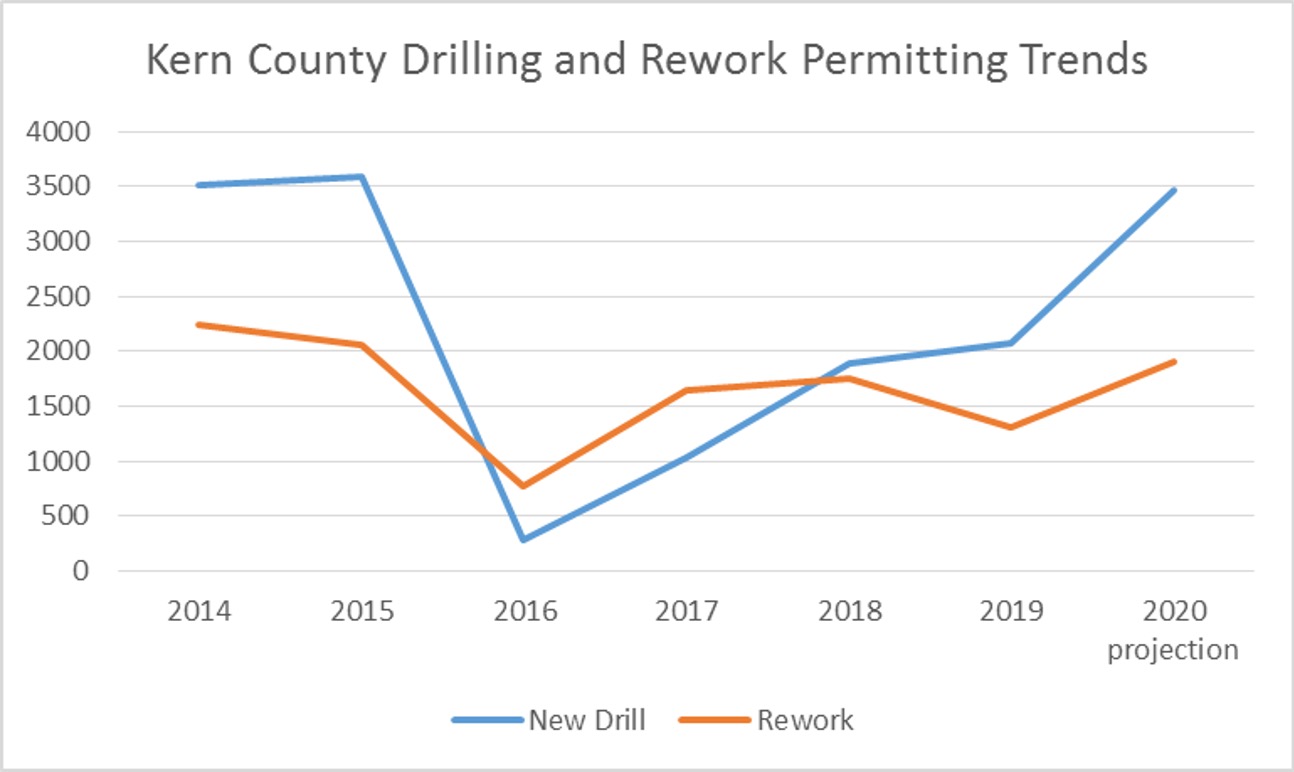
Figure 2. Time Series of drilling permits issued by Kern County, California, 2014 to present.
Kern County is the most heavily drilled county in the United States, and from 2015 to 2019 well permits were issued in Kern at elevated numbers as compared to the rest of the state. From the implementation of the ordinance (2014 to 2015), the proportion of drilling permits issued by Kern County increased from 82% to 94% of the state total. In Figure 3 below, the time series shows that Kern County makes up the majority of permits issued to drill new wells in California, and the proportion of wells drilled in Kern County has been higher from 2015 to 2019 than it had been prior. Not only did the ordinance allow permits to be drilled without any consideration for the community and public health impacts of Frontline Communities, but the actual numbers and proportions of wells drilled in Kern County increased as well. We have mapped these permits in Figure 3 below to show exactly where they are located.
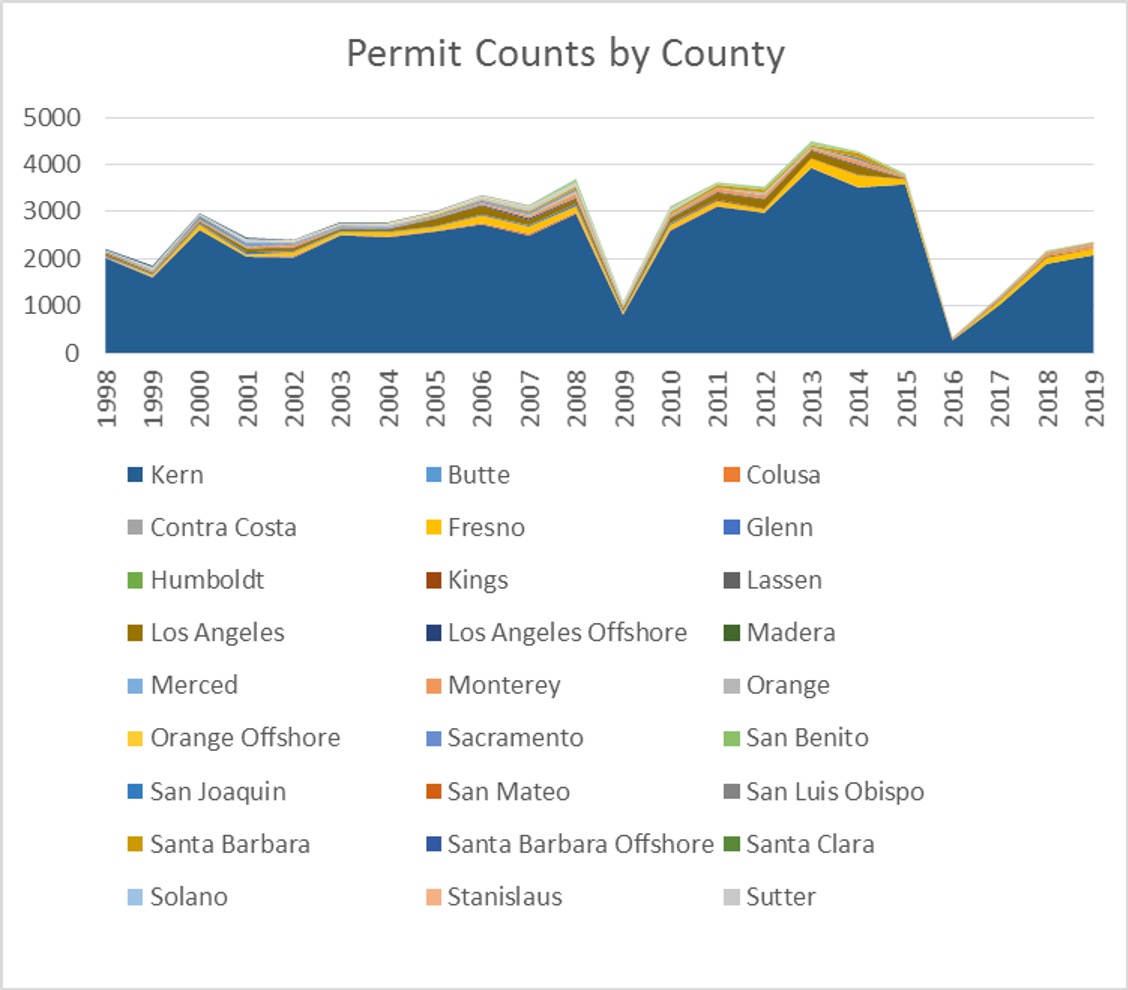
Figure 3. Time series of permits issued to drill new wells in California from 1998 to 2019. The contribution of individual counties is shown with different colors, the area under the trend line representing the cumulative total.
The locations of well permits were mapped using GIS software and overlaid with indicators of social and environmental justice. The layers of Environmental Justice (EJ) mapping data were derived from CalEnviroScreen 3.0 census tract data, assigned to the block level, and 2015 American Community Survey demographical data, also summarized at the census block data.
One of the major failings of the Kern County ordinance was the lack of risk communication with Frontline Communities. Not only were communities not informed of proposed drilling projects, all communications from Kern County and CalGem have been posted solely in English. Any attempts at communication of impacts and notices have excluded non-English speakers. Providing notices and information in non-English languages, at the very least in Spanish, needs to be a top priority for any regulatory body in California. The current permitting policy leverages systematic racism to preclude communities from participating in the decision-making processes that directly affect their families’ health.
As shown below in map in Figure 4, the majority of Kern County ranks high in “linguistic isolation” according to CalEnviroScreen 3.0. Our analysis shows that 11,244 permits were issued in block groups that CalEnviroscreen 3.0 has ranked in the top 60th percentile for linguistic isolation. A total 16,143 permits were issued in block groups that are 40% or more Hispanic, and that number increases to 18,000 (98.1%) permits if you include the permits issued in the Midway-Sunset Field, located on the border of one of Kern’s largest, and predominantly “Hispanic,” census block groups.
View map fullscreen | How FracTracker maps work
Figure 4. Map of Oil and Gas Permits with Kern County “Hispanic” Demographics and Language Disparities. The shades of yellow to red census blocks represent the 60th percentile and above linguistic isolation. Hatched census tracts are census blocks with demographical profiles over 40% Hispanic.
Within Kern County, these permits were approved mostly in low income areas, and areas with pre-existing environmental degradation. In the map in Figure 5, below, permit locations were overlaid with CalEnviroScreen 3.0 rankings for existing environmental degradation and median income data from the American Community Survey (2015) to visually show the disparity.
Our analysis shows that 17,978 0f the 18,356 total drilling and reworking permits were issued in census block groups where the median income was at least 20% lower than that of Kern County (Kern median income = $51,579). Additionally, these areas are more impacted by existing sources of pollution. In fact, 18,298 (99.7%) permits were issued in census blocks designated as the above the 60th percentile of those suffering from existing pollution burden by CalEnviroScreen 3.0.
View map fullscreen | How FracTracker maps work
Figure 5. Map of oil and gas permits with Kern County environmental justice areas. Shown in shades of blue are the block groups with median incomes less than 80% of that of the Kern County ($51,579). The hatched areas are above the 60th percentile for CalEnviroScreen pollution burden.
Our results find that from 2015-2019, very few well permits were issued in census blocks that are predominantly white, with median incomes above the median, and low rankings of linguistic isolation. The policies enacted by Kern County to fast track permits were instituted in predominantly poor, linguistically isolated, Hispanic communities already suffering from existing environmental degradation. Through systematic racism, these areas have become Kern County’s “sacrifice zones.” Moving forward, we are pressuring Kern County to adopt a permitting approach that considers the health of Frontline Communities.
Unfortunately, since the court’s decision, well permitting in Kern County has not only continued, but actually accelerated. While the appellate court ordered permitting to stop for one month, the gap was quickly filled. Between March 28 and May 18, 2020; CalGEM approved 733 permits to drill new wells and rework existing wells in Kern County. In addition, CalGEM approved 38 new fracking permits in 2020 since March 28th, all in Kern County (regulated separately under State Bill 4), increasing the environmental burden on Kern communities further. Like Kern County, CalGEM’s permitting process also deserves scrutiny, as state permitting requirements are lax.
These irresponsible policies have had a direct impact on the health of Central Valley communities. Environmental monitoring has shown time and again that emissions from oil and gas wells include a cocktail of air toxics and carcinogens, and that living near oil and gas activity has been shown to be associated with numerous health impacts such as low birth weight, cancer, skin problems, asthma, and depression, The exclusion of Spanish-speaking residents from notifications and information on decisions that affect their health is an even further condemnation of the systematic and outright racism of Kern County’s permitting approach.
There is more work to be done, but the elimination of Kern County’s fast-tracking ordinance is a major win for public health and democracy.
FracTracker Alliance would like to congratulate the organizations responsible for this legislative victory and thank them for all their hard work. They include Committee for a Better Arvin, Committee for a Better Shafter, and Greenfield Walking Group, represented by the Center on Race, Poverty & the Environment, together with the Center for Biological Diversity, and Sierra Club, who was represented by Earthjustice.
By Kyle Ferrar, MPH, Western Program Coordinator, FracTracker Alliance
Unconventional wells in Pennsylvania were always resource-intensive, but the maps below show how the amount of water used per well has grown significantly in recent years. In 2013, these wells used an average of 5.8 million gallons per well. By 2019, that figure had increased 145%, consuming more than 14.3 million gallons per well. This is a glimpse into the unsustainable resource demands of this industry and the decreasing energy returned on investment.
As fracking proponents will eagerly remind you, hydraulic fracturing was invented decades ago – back in 1947 – so the practice has been in use for quite a while. What really separates modern unconventional shale gas wells from the supposedly traditional, conventional wells is more a matter of scale than anything else. While conventional wells are typically fracked with tens of thousands of gallons of fluid, their unconventional counterparts are far thirstier, consuming millions of gallons per well.
And of course, more inputs translate into more outputs — not necessarily in the form of gas, but in the form of toxic, radioactive waste. This creates a slew of problems ranging from health impacts, to increased transportation, to disposal.
View map fullscreen | How FracTracker maps work
However, this increase in consumption has continued to grow on a per-well basis, so that wells drilled in recent years aren’t really in the same category as wells drilled a decade ago at the beginning of Pennsylvania’s unconventional boom.
In Pennsylvania, unconventional wells are primarily drilled into two deep shale layers, the Devonian-aged Marcellus Shale, which is about 390 million years old, and the Utica Shale from the Late Ordovician period, which was deposited about 60 million years before the Marcellus. These formations have been known about for decades, but did not yield enough gas justify the expense of drilling until the 21st century, when horizontal drilling allowed for a much greater surface area of exposure to the shale formations. However, stimulating this increased distance also requires significantly more fracking fluid – a mixture of water, sand, and chemicals – which increased the consumptive use of water by several orders of magnitude. And in the end, all of this extra work that is required to extract the gas from the ground has made the industry unprofitable, as high production numbers have outpaced demand.
As residents in shale fields around the country started to see impacts to their drinking water, they began to demand to know more about what was injected into the ground around them. The industry’s response was FracFocus, a national registry to address the water component of this question, if not the issue of fracking chemicals. In the early days, visitors to the site could only access data one well at a time, so systematic analyses by third parties were precluded. Additionally, record keeping was sloppy, with widespread data entry issues, incorrect locations, duplicate entries, and so forth.
Many of these issues were addressed with the rollout of FracFocus 2.0 in May of 2013. This fixed many of the data entry issues, such as the six different spellings of “Susquehanna” that were used, and enabled downloads of the entire data set. For that reason, when we wanted to look at changes over time, our analysis started in 2013, where only minimal obvious corrections were required at the county level.
Unconventional wells in Pennsylvania were always resource-intensive, but this GIF shows that the amount of water used per well has grown significantly in recent years. In 2013, these wells used an average of 5.8 million gallons per well. By 2019, that figure had increased 145%, consuming more than 14.3 million gallons per well. This is a glimpse into the unsustainable resource demands of this industry and the decreasing energy returned on investment.
However, statewide data is available since 2008, and as long as we keep in mind the data quality issues from the earlier years, the results are even more stark.
| Year | FracFocus Reports | Total Water (gal) | Average Water per Well (gal) | Maximum Water (gal) |
| 2008 | 2 | 4,117,827 | 4,117,827 | 4,117,827 |
| 2009 | 19 | 37,415,216 | 4,157,246 | 6,176,104 |
| 2010 | 57 | 123,747,550 | 4,267,157 | 7,595,793 |
| 2011 | 1,174 | 786,513,944 | 4,345,381 | 12,146,478 |
| 2012 | 1,375 | 2,721,696,367 | 4,676,454 | 14,247,085 |
| 2013 | 1,272 | 7,431,752,338 | 5,842,573 | 19,422,270 |
| 2014 | 1,277 | 10,359,150,398 | 8,112,099 | 26,927,838 |
| 2015 | 904 | 8,216,787,382 | 9,089,367 | 32,049,750 |
| 2016 | 589 | 5,933,622,817 | 10,074,063 | 32,701,940 |
| 2017 | 710 | 8,547,034,675 | 12,038,077 | 38,681,496 |
| 2018 | 805 | 10,901,333,749 | 13,542,030 | 36,812,580 |
| 2019 | 686 | 9,811,475,207 | 14,302,442 | 39,329,556 |
| 2020 | 76 | 986,425,600 | 12,979,284 | 29,177,980 |
| Grand Total | 8,946 | 65,861,073,069 | 9,248,852 | 39,329,556 |
Figure 1: While the total number of frack jobs reported to FracFocus has declined over the years, the amount of water per well has increased substantially.
In terms of the total number of unconventional wells drilled, the boom years in Pennsylvania were around 2010 to 2014, with more than 1,000 wells drilled each of those years, a total that has not been achieved again since. It is important to note that in this FracFocus data, we are not counting the wells, per se, but the reported instances of well stimulation through hydraulic fracturing, commonly called frack jobs. In the earliest portion of the date range, submitting data to FracFocus was voluntary, and therefore the total activity from 2008 through 2010 is vastly undercounted, but we have included what data was available.
It should be noted that the average consumption for frack jobs started in 2020 are down from the 2019 totals, however, the sample size is considerably smaller. This smaller sample due, in part, to reduced drilling activity due to oversupply of gas in the Northeast, but also due to the fact that the year is still in progress. This analysis is based on data downloaded from FracFocus in April 2020.
As we examine changes in the average water consumption over time from Figure 1, we can see that operators in Pennsylvania averaged between 4-5 million gallons of water per well from 2008 to 2012. The numbers take off from there, tripling to more than 14 million gallons for 2019, the last full year available. At the same time, drilling operators began experimenting with truly monstrous quantities of water. In 2008, the only well with water data available used just over 4.1 million gallons. By 2019, there was a well that used 39.3 million gallons of water, almost a tenfold increase.
From late 2008 through early 2020, the industry recorded the use of 65.8 billion gallons of water in unconventional wells. Since we know that many wells during the early boom years did not report to FracFocus, the actual usage must be substantially higher. For the years with the most reliable and complete data – 2013 to 2019 – total water consumption ranged from 5.9 to 10.9 billion gallons per year. For context, the average Pennsylvanian uses about 100 gallons per day, or 36,500 gallons per year.
That means that the 10.9 billion gallons that were pumped into fracked wells in 2018 equals the total usage of 298,667 residents for an entire year. Alternatively, that water could have filled 16,517 Olympic-sized swimming pools. It is equivalent to 33,455 acre-feet, meaning it could fill an acre-sized column of water that stretches more than six miles high.
Surely, there must be a better way to make use of our precious resources than to turn millions upon millions of gallons of water into toxic waste.
By Matt Kelso, Manager of Data & Technology, FracTracker Alliance
By Kim Fraczek (Sane Energy Project), with input and mapping by Karen Edelstein (FracTracker Alliance)
Despite overwhelming concern about the impacts of fossil fuels on climate chaos, pipeline projects are springing up all over the country in an effort find markets for the surplus of fracked gas extracted from the Marcellus region in Pennsylvania. New Yorkers are directly impacted by these problematic supply chains. The energy company, National Grid, is proposing to raise New Yorkers’ monthly bills in order to complete a new, 30-inch high-pressure fracked gas transmission pipeline through Brooklyn, New York. National Grid euphemistically named the 350-psi pipeline the “The Metropolitan Reliability Pipeline Project.” Gas moving through this pipeline is destined for a National Grid Depot on Newtown Creek, which divides Brooklyn from the borough of Queens. National Grid plans to expand liquefied natural gas (LNG) storage and vaporizer operations at the Depot. The Depot expansion will also facilitate trucking transport of gas to and from North Brooklyn to destinations in Long Island and Massachusetts.
For an industry explanation on how vaporizers work, click here.
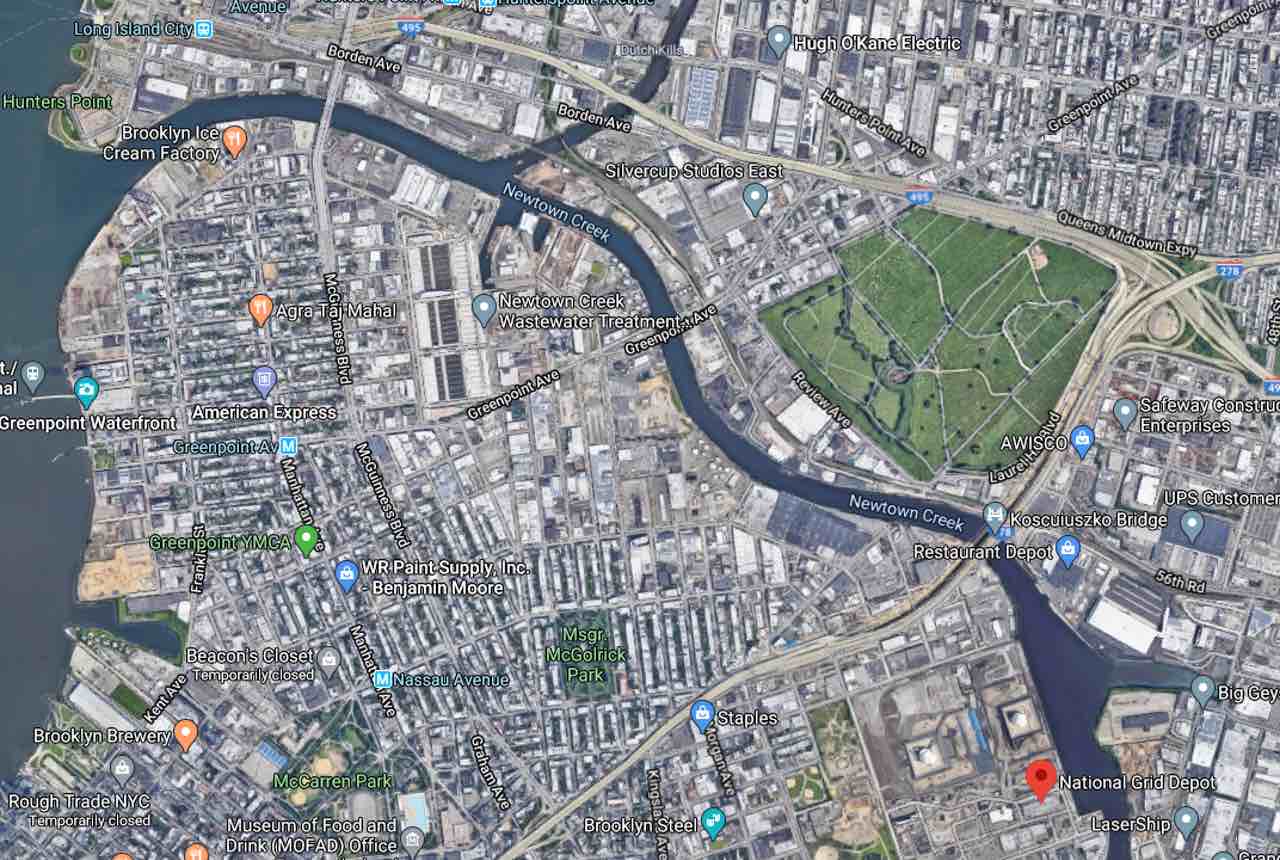
National Grid Depot is located on the western bank of Newtown Creek. Source: Google Maps
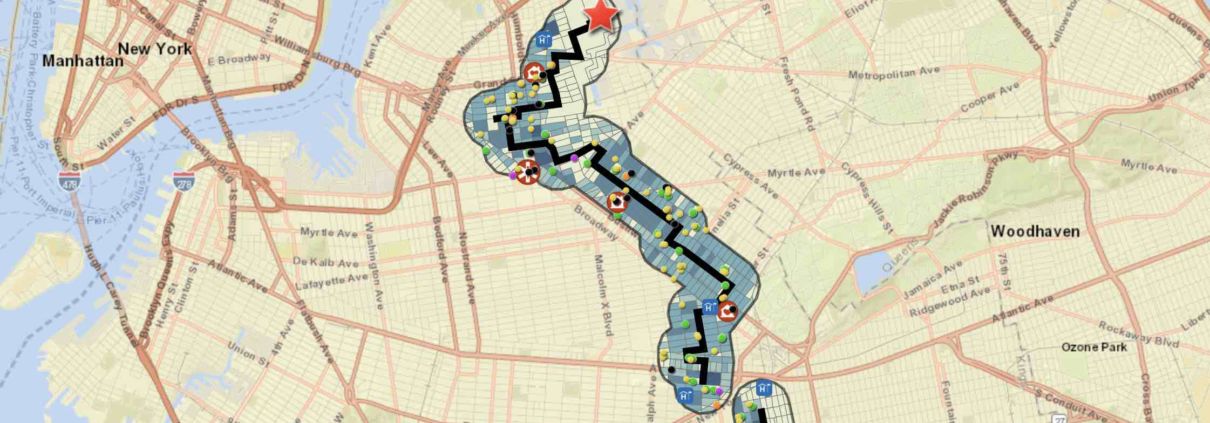
Pipelines also present risks of catching fire and exploding. On average, a 350-psi gas pipeline has an evacuation radius of approximately 1275 feet. FracTracker Alliance created the interactive map, below, using 2010 census data to show population density in the neighborhoods within this blast zone. According to FracTracker, there were 614 reported pipeline incidents in the United States in 2019 alone, resulting in the death of 10 people, injuries to another 35, and about $259 million in damages.
View map fullscreen | How FracTracker maps work
There is widespread community opposition to this pipeline, LNG expansion, and trucking proposal because it will:
Opponents of this pipeline project also raise objections that the pipeline will:
National Grid is currently constructing Phase 4 of the pipeline. However, public pressure and concern about COVID-19 safety measures forced them to stop construction on March 27, 2020. After Governor Cuomo issued an executive order to halt all non-essential work, neighbors reported the company was not mandating personal protective equipment (PPE) nor social distancing for its workers.
Additionally, funding to build north of Montrose Avenue in Bushwick through to Greenpoint—neighborhoods in northeastern Brooklyn on the border with Queens that make up the fifth phase of the pipeline construction—is pending a decision by the Public Service Commission. The approval of the fifth phase of the pipeline would allow it to reach the LNG facility at Greenpoint.
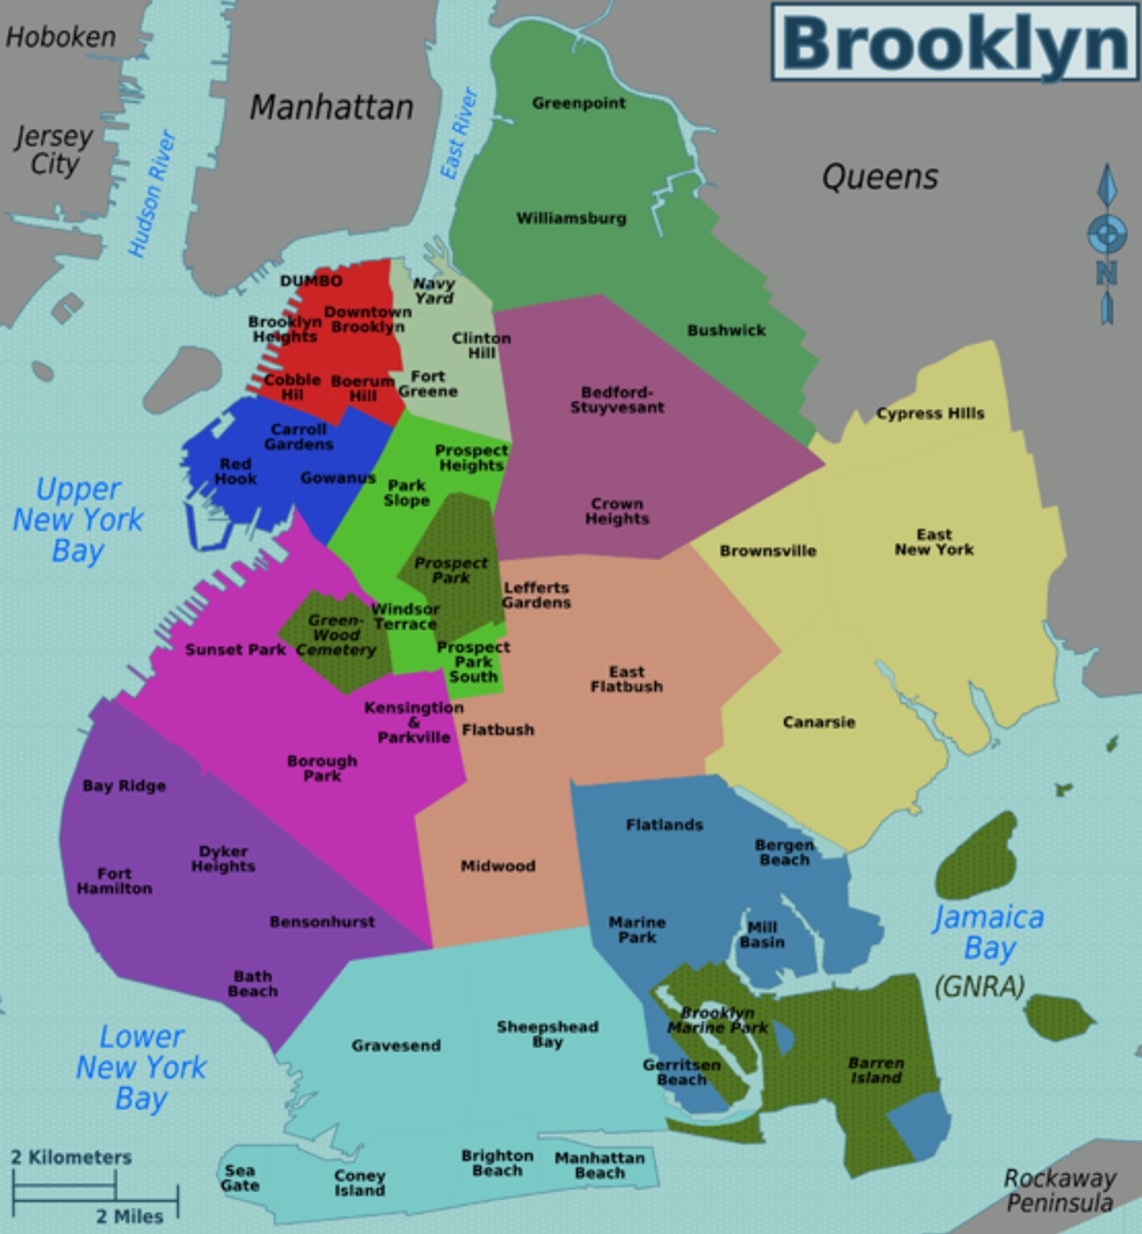
Generalized map of Brooklyn neighborhoods. Source: Wikipedia.
The current National Grid rate case proceeding is in its last stage of discovery, testimony, cross-examination, and final briefs from parties to the rate case. The Administrative Law Judges overseeing the proceeding will review all parties’ information, and make a recommendation to the Public Service Commission, a five-person panel appointed by New York State Governor Cuomo to regulate our utilities. This decision will most likely happen at the monthly meeting on June 18, 2020, where they also may make a decision on National Grid’s Long Term Plan proceeding that could determine the future of LNG expansion in North Brooklyn.
Sane Energy Project has laid out a clear and cogent set of arguments. These include:
As gas prices continue to drop and renewable energy technologies are more accessible and wide-spread, the whole equation that relies on a fossil fuel-based economy becomes more desperate and unsustainable. Many communities are also saying “no” to new pipelines in their communities, so industry is looking to ship fracked gas over land by truck. Another method for disposing of surplus gas is to compress it into LNG (liquefied natural gas) and ship it to international markets by boat.
For more updates on the North Brooklyn Pipeline, check Sane Energy Project’s website. If you live in the New York/Metropolitan area and want to get involved in this fight, there are numerous ways in which you can work with Sane Energy. Click here for details.
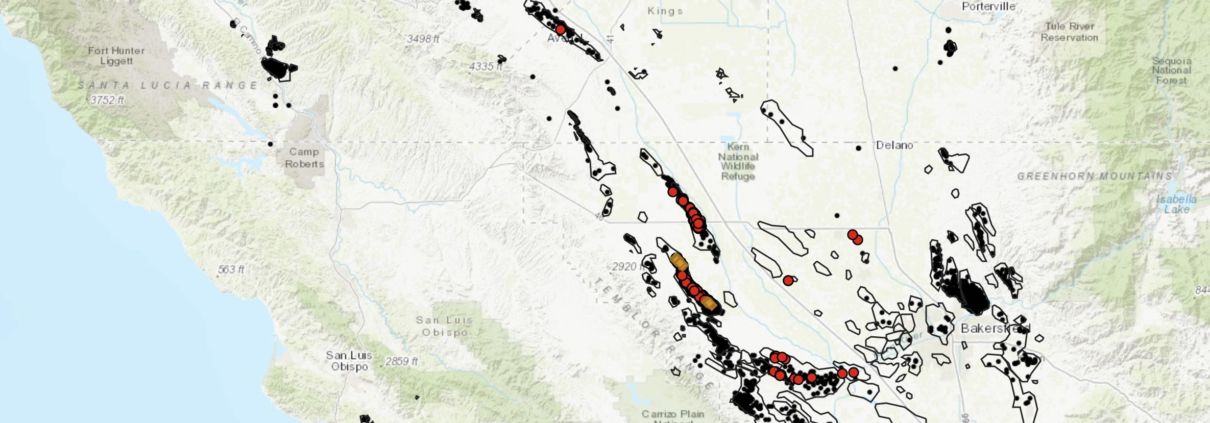
California is once again a fracked state. The moratorium on well stimulations (hydraulic fracturing and acidizing) that lasted since June 26, 2019 has now come to an end. As of April 3rd, 2020, California’s oil and gas regulatory body, California Geological Energy Management Division (CalGEM), approved 24 new permits to frack new wells. The wells were permitted to the operator Aera Energy. Well types to be fracked include 22 oil and gas production wells and 2 water flood wells; 18 of which are in the South Belridge Field and 6 North Belridge Field. Locations of the wells are shown in the map in Figure 1, and are mapped with the rest of 2020’s approved well drilling and rework permits in Consumer Watchdog’s updated release on NewsomWellWatch.com. Please read our press release with Consumer Watchdog here!
Figure 1. Map of New Fracking Permits in California
View map fullscreen | How FracTracker maps work
Fortunately, these 24 approved well stimulation permits are not located in close proximity to communities that would be directly impacted by the negative contributions to air quality and potential groundwater quality degradation that result from drilling and stimulating oil and gas wells. Regardless of where oil and gas wells and stimulations are permitted in relation to Frontline Communities, these wells will still degrade the regional air quality of the San Joaquin Valley. The San Joaquin Valley has the worst air quality in the country. According to the U.S. EPA, oil and gas production is a main contributor of volatile organic compounds (VOC’s) and NOX in the Valley. In addition to VOC’s being carcinogens, these pollutants are precursors to the ozone and smog that cause health impacts such as asthma, chronic obstructive pulmonary disease (COPD), cardiovascular disease, and negative birth outcomes.
Additionally, the dolomite formations where these 24 stimulations were permitted have also experienced the same type of oil seeps and spills (known as surface expressions) as the Cymric Field just to the south. Readers may remember the operator Chevron spilling 1.3 million gallons of oil and wastewater in an uncontrollable seep resulting from high pressure injection wells.
Whereas Governor Newsom may have put a halt to unpermitted high-pressure injections, regulators have just approved permits for 24 new fracking operations, a.k.a well stimulations. The irony here is that risks inherent in the fracking process in California include the same risks associated with high pressure steam injection operations. Both techniques elevate the downhole pressure of a well to the point that the formation “source” rock is fractured. These techniques increase the likelihood of downhole communication with other surrounding wells, both active and plugged. Downhole communication events between wells, in this case known as “frack hits” are a major cause of well casing failures and blowouts, which in turn are the primary cause of surface expressions. Simply put, high pressure injections in over-developed oil fields result in spills, and in this case, these 24 permitted stimulations are within 1,500’ of over 7,000 existing wells, a distance specifically identified by CalGEM as a high-risk zone for downhole communication between wells.
So how did these wells get approved? Here’s the story, as told by CalGEM:
In November, CalGEM requested a third-party scientific review of pending well stimulation permit applications to ensure the state’s technical standards for public health, safety and environmental protection are met prior to approval of each permit. To ensure the proposed permits comply with California law, including the state’s technical standards to protect public health, safety, and environmental protection, the Department of Conservation asked experts at the Lawrence Livermore National Laboratory (LLNL) to assess CalGEM’s permit review process. LLNL also evaluated the completeness of operators’ application materials and CalGEM’s engineering and geologic analyses.
The independent scientific review is one of Governor Newsom’s initiatives to ensure oil and gas regulations protect public health, safety, and environmental protection. This review, which assesses the completeness of each proposed hydraulic fracturing permit, is taking place as an interim measure while a broader audit is completed of CalGEM’s permitting process for well stimulation. That audit is being completed by the Department of Finance Office of Audits and Evaluation (OSAE) and will be completed and shared publicly later this year. LLNL experts are continuing evaluation on a permit-by-permit basis and conducting a rigorous technical review to verify geological claims made by well operators in the application process. Permit by permit review will continue until the Department of Finance Audit is complete later this year.
LLNL’s scientific review of the permit applications and process found that the permitting process met statutory and regulatory requirements. LLNL found, however, that CalGEM could improve its evaluation of the technical models used in the permit approval process. As a result, CalGEM now requires all operators to provide an Axial Dimensional Stimulation Area (ADSA) Narrative Report for each oilfield and fracture interval which must be validated by LLNL and conform to the new CalGEM permitting process. This will improve CalGEM’s ability to independently validate applicants’ fracture modeling.
While this sounds like a methodological approach to the permitting process, it is still flawed in several ways. First and foremost, there is still no process for community input, let alone community decision-making. Community stakeholders are not engaged at in point in this process. Furthermore the contribution of oil and gas extraction operations to the degradation of environmental quality is already well established. In the case of these 24 fracking permits, they will contribute to the further degradation of regional air quality and continue the legacy of groundwater contamination within the sacrifice zone surrounding the Belridge fields.
While we are critical of Governor Newsom’s climate-changing oil extraction policies, FracTracker would like to recognize the leadership Governor Newsom has shown instituting responsible policies to keep Californians as safe as possible and protected from the threat of COVID-19. While there can still be more done to provide relief for the most financially vulnerable, such as instituting a rent moratorium for those that do not own their own homes, California leads as an example for the public health interventions that need to be instituted nation-wide. The Governors inclusion of undocumented citizens in the state’s economic stimulus program is a first step, and FracTracker Alliance fully supports increasing the amount to at least match the $1,200 provided to the rest of Californians.
Regardless, the threat of COVID-19 cannot be addressed in a vacuum. Threats of infection are magnified for Frontline Communities. Living near oil and gas operations exposes communities to a cocktail of volatile organic compounds that suppress the immune system, increasing the risk of contracting viral lung infections. Frontline Communities are therefore particularly vulnerable to the threat of COVID-19. California and Governor Newsom need to consider the public health implications of permitting new fracking and new oil and gas wells, particularly those permits within 2,500’ of hospitals, schools, and other sensitive sites, above all during an existing pandemic.
By Kyle Ferrar, MPH, Western Program Coordinator, FracTracker Alliance

What difficult times. The pandemic is beyond our common experience. Deadly and pervasive, it afflicts our physical wellbeing and our economy. The virus exposes and exploits the inequities in society, with harsh, disproportionate burdens on those most marginalized. The suffering sickens us to the core.
Hope is an essential nutrient manifesting in different, often unassuming, forms. The 50th anniversary of Earth Day, while dampened by our current troubles, reminds us of the tenacity and resiliency of the human spirit.
A small idea, sparked in 1970, blossomed into a global observance. People mobilized by the thousands to testify to the defilement of the planet and to demand bold action. In the story map below, take a tour through 50 years of technology, protest, economics, and policy that shaped the country’s energy landscape. Witness the power of people bringing dramatic changes to our energy system, despite forces working to preserve the status quo.
The 50th occurrence of Earth Day presents a ripe opportunity to honor the dedication and sacrifice of those who help keep our lights on and celebrate the bravery of those fighting to build an energy system that ensures environmental and economic justice for all.
Physical gathering is a bad idea but intellectually, virtually, we can elevate the dialogue and plant good seeds, literal and figurative, to accelerate restoration and cool our climate. The constraints of COVID-19 reveal the virtue of simplicity, the conservation bounty of taking the slower road, where every milepost matters.
Plug in however, wherever you can. Look for local chances to engage. Check out the Earth Day Network for digital events near and far or plan your own action.
Make a statement, take a stand, and write the future.
Wishful thinking? Maybe, but as a wise-old band once sang, “Don’t Stop Believing.”
FracTracker Alliance has conducted numerous spatial analyses concerning the proximity of oil and gas extraction infrastructure to sensitive receptors, including healthcare centers, locations where children congregate, locations where the elderly congregate, as well sensitive habitat for endangered and threatened wildlife. In this article, we summarize the results of a handful of these analyses that are most relevant to the impact a 2,500’ minimum setback would have on oil and gas extraction in California, discussed here in our recent article. We are providing these summaries as useful references for creating materials and crafting documents in support of establishing policies to protect public health and Frontline Communities, such as setbacks regulations. For further readings on the health threats oil and gas poses for Frontline Communities see PSE Healthy Energy’s literature review of the negative impacts of oil and gas extraction (2009-2015)1, FracTracker Alliance’s literature review of negative health impacts (2016-2019)2, and Stand-LA’s review of literature showing health impacts at multiple distances with reference to 2,500’.3
In the 2018 The Sky’s Limit report by Oil Change International (OCI),4 FracTracker’s analysis showed that 8,493 active or newly permitted oil and gas wells were located within a 2,500’ buffer of sensitive sites including occupied dwellings, schools, hospitals, and playgrounds. At the time, it was estimated that over 850,000 Californians lived within the setback distance of at least one of these oil and gas wells.
An assessment of the number of California citizens living proximal to active oil and gas production wells was also conducted for the CCST State Bill 4 Report on Well Stimulation in 2016.5 The analysis calculated the number of California residents living within 2,500’ of an active (producing) oil and gas well, and based estimates of demographic percentages on 2015 ACS data at the census block level. The report found that:
Population counts within the setbacks were calculated for smaller census designated areas including counties and census tracts. The results of the calculations are presented in Table 1 and the analysis is shown in the maps in Figure 1 and Figure 2 below.
Data for the City of Los Angeles was also aggregated. Results showed:
Table 1. Population Counts by County. The table presents the counts of individuals living within 2,500’ of an active oil and gas well, aggregated by county. The top 12 counties with the highest population counts are shown. “Impacted Population” is the count of individuals estimated to live within 2,500’ of an oil and gas well. The “% Non-white” and “% Hispanic” columns report the estimated percentage of the impacted population of said demographic.
| County | Total Pop. | Impacted Pop. | Impacted % Non-white | Impacted % Hispanic |
| Los Angeles | 9,818,605 | 541,818 | 0.54 | 0.46 |
| Orange | 3,010,232 | 202,450 | 0.25 | 0.19 |
| Kern | 839,631 | 71,506 | 0.34 | 0.43 |
| Santa Barbara | 423,895 | 8,821 | 0.44 | 0.71 |
| Ventura | 823,318 | 8,555 | 0.37 | 0.59 |
| San Bernardino | 2,035,210 | 6,900 | 0.42 | 0.59 |
| Riverside | 2,189,641 | 5,835 | 0.46 | 0.33 |
| Fresno | 930,450 | 2,477 | 0.34 | 0.50 |
| San Joaquin | 685,306 | 2,451 | 0.55 | 0.42 |
| Solano | 413,344 | 2,430 | 0.15 | 0.15 |
| Colusa | 21,419 | 1,920 | 0.39 | 0.70 |
| Contra Costa | 1,049,025 | 1,174 | 0.35 | 0.30 |
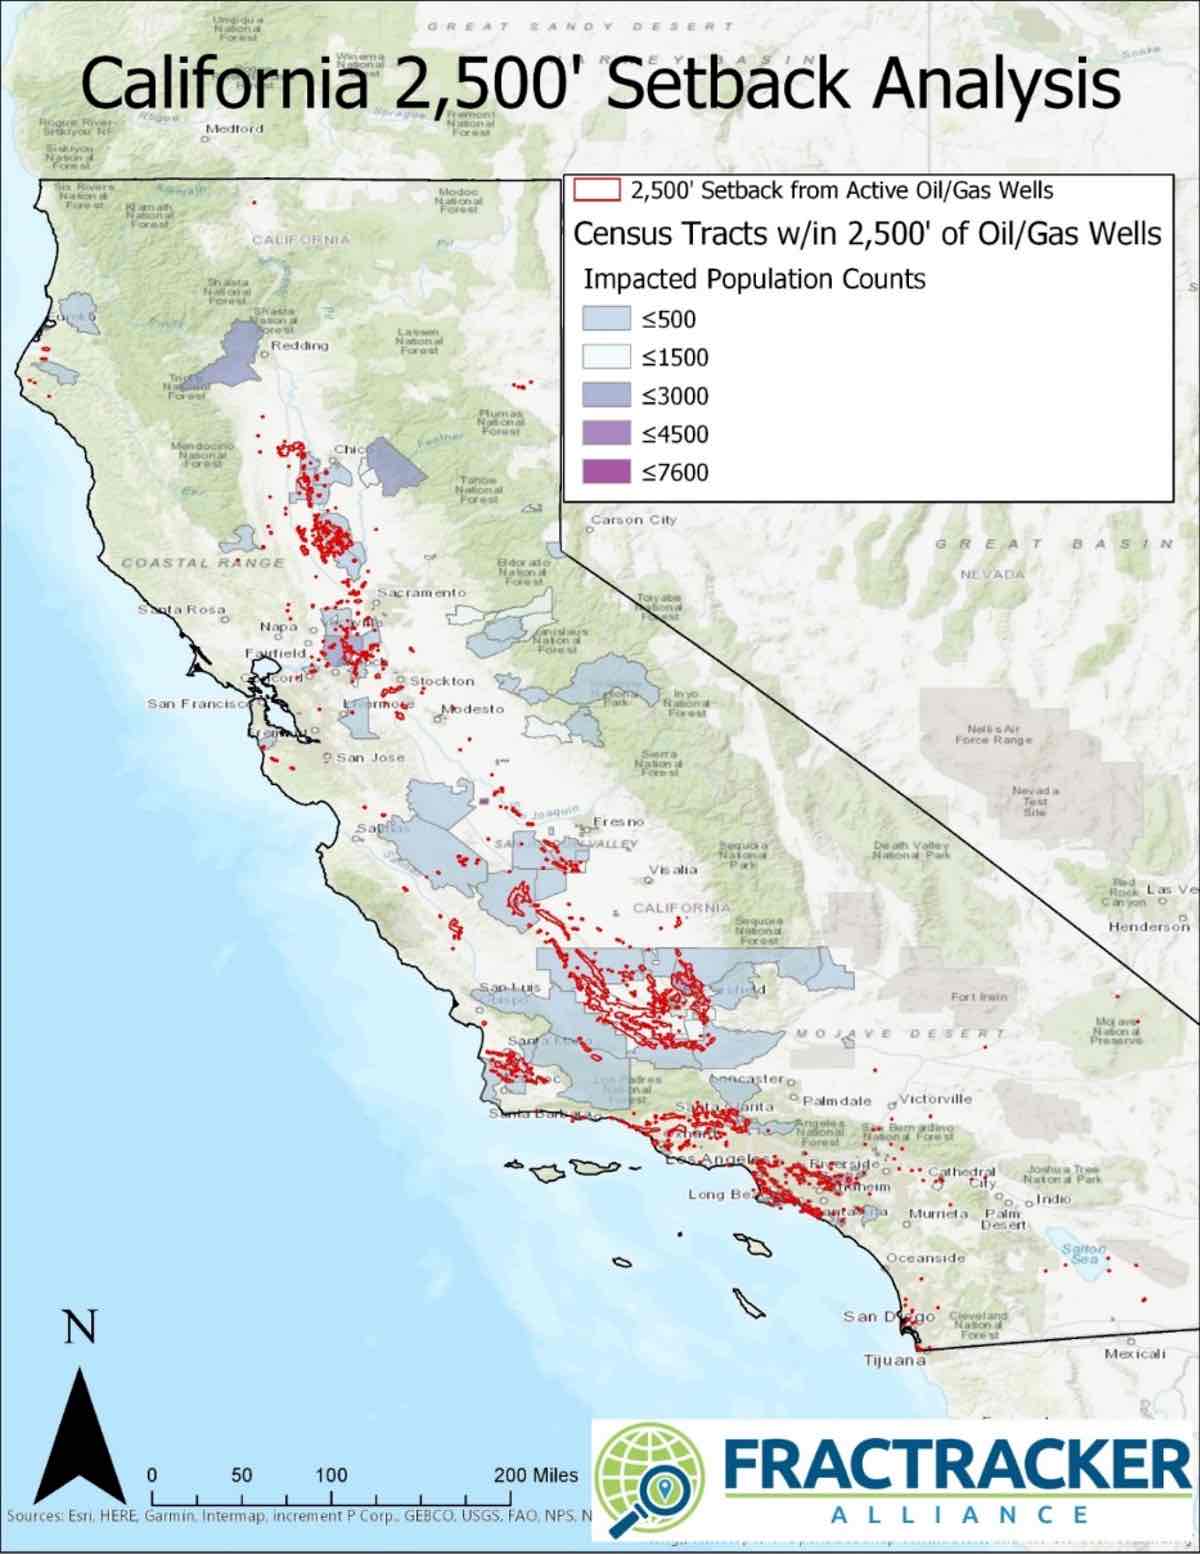
Figure 1. Map of impacted census tracts for a 2,500’ setback in California. The map shows areas of California that would be impacted by a 2,500’ setback from active oil and gas wells in California.
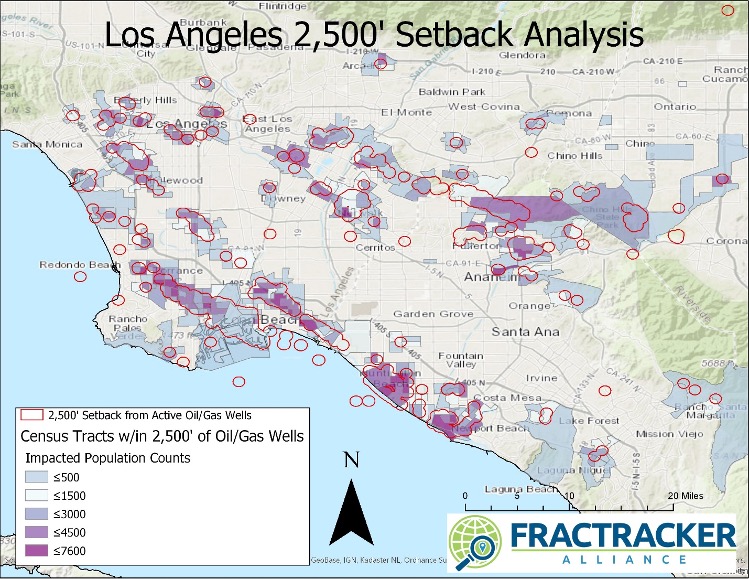
Figure 2. Map of impacted census tracts for a 2,500’ setback in Los Angeles. The map shows areas of California that would be impacted by a 2,500’ setback from active oil and gas wells in Los Angeles.
From the analysis we find that the majority of California citizens living near active production wells are located in Los Angeles County. This amounts to 61% of the total count of individuals within 2,500’ in the full state. Additionally, the well sample population is limited to only wells that are reported with an “active” status. Including wells identified as idle or support wells such as Class II injection or EOR wells would increase both the total numbers and the demographical percentages because of the high population density in Los Angeles.
Using California Geologic Energy Management Division (CALGEM) data published March 1, 2020, we find that there are 105,808 wells reported as Active/Idle/New in California. There are 16,690 are located within 2,500′ of a sensitive receptor (15.77%). Of the 74,775 active wells in the state, 9,835 fall within the 2,500’ setback distance.6
There are 6,558 idle wells that fall within the 2500’ setback distance, of nearly 30,000 idle wells in the state. Putting these idle wells back online would be blocked if they required reworks to ramp up production. For the most part operators do not intend for most idle wells to come back online. Rather they are just avoiding the costs of plugging.
Of the 3,783 permitted wells not yet in production, or “new wells,” 298 are located within the 2,500’ buffer zone (235 in Kern County).
In Los Angeles, Rule 1148.2 requires operators to notify the South Coast Air Quality Management District of activities at well sites, including permit approvals for stimulations and reworks. Of the 1,361 reports made to the air district since the beginning of 2018 through April 1, 2019; 634 (47%) were for wells that would be impacted by the setback distance; 412 reports were for something other than “well maintenance” of which 348 were for gravel packing, 4 for matrix acidizing, and 65 were for well drilling.
We also analyzed data reported to DOGGR under the well stimulation requirements of SB4. From 1/1/2016 to 4/1/19 there were 576 well stimulation treatment permits granted under the SB4 regulations. Only 1 hydraulic fracturing event, permitted in Goleta, would have been impacted by a 2,500’ setback.
Also part of the OCI The Sky’s Limit report,4 we approximated the amount of oil produced from wells within 2,500’ of sensitive receptors. Using the API numbers of wells identified as being within the buffer area, we pulled production data for each well from the Division of Oil, Gas, and Geothermal Resources (DOGGR) database. The results are based on 2016 production data, the latest complete data available at the time of the analysis. The data indicated that 12% of statewide production came from wells within the buffer zone in 2016. Looking at the production data for a full 6 year period (2010 – 2016), production from wells within the buffer zone was 10% on average statewide. Limiting the analysis to only Kern County, the result was actually smaller. About 5% of countywide production in 2016 (6.1 million barrels) was found to come from wells in the buffer zone.
FracTracker conducted an analysis in Kern County for the California Environmental Justice Alliance’s 2018 Environmental Justice Agency Assessment.7 We assessed the proportions of wells near sensitive receptors that are located in low-income communities (at or below 80% of the Kern County Average Median Income). We found that 5,229 active/idle/new oil and gas wells were within 2,500’ from sensitive receptors in low-income communities, including 3,700 active, 1,346 idle, and 183 newly permitted “new” oil and gas wells. The maps in Figures 3 and 4 below show these areas of Kern County and specifically Bakersfield, California.
FracTracker’s analysis of low income communities in Kern County showed the following:
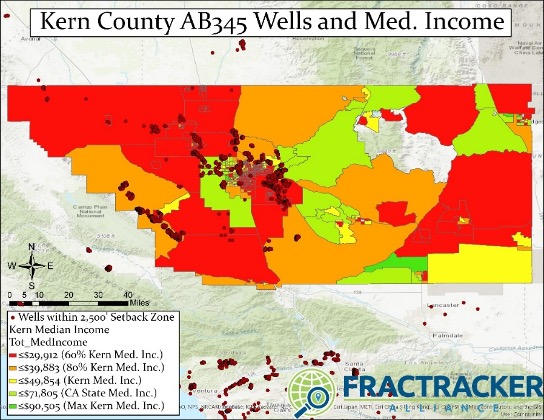
Figure 3. Map of Kern County census tracts with wells impacted by a 2,500’ setback, with median income brackets.
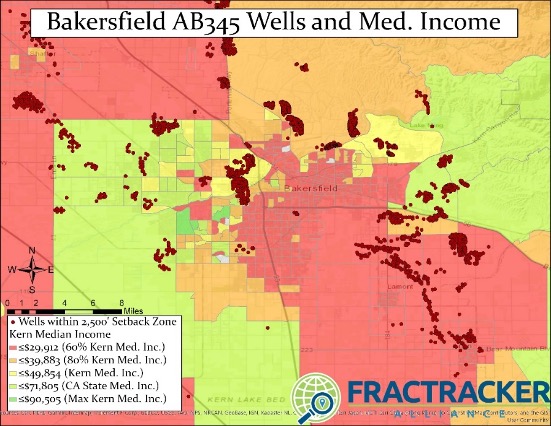
Figure 4. Map of Kern County census tracts with wells impacted by a 2,500’ setback, with median income brackets.
FracTracker conducted an environmental justice analysis to investigate student demographics in schools near oil and gas drilling in California.8 The school enrollment data is from 2013 and the oil and gas wells data is from June 2014. For the analysis we used multiple distances, including 0.5 miles (about 2,500’). Based on the statistical comparisons in the report, we made the following conclusions:
In collaboration with Consumer Watchdog,9 we counted permit applications that were approved in 2018 during Governor Brown’s administration, as well as in 2019 and 2020 under Governor Newsom. The analysis included permits for drilling new wells, well reworks, deepening wells and well sidetracks. Almost 10% of permits issued during the first two months of 2020 have been issued within 2,500’ of sensitive receptors including homes, hospitals, schools, daycares, and nursing facilities. This is slightly lower than the average for all approved permits in 2019 (12.2%). In 2018, Governor Brown approved 4,369 permits, of which 518 permits (about 12%) were granted within the proposed 2,500’ setback.
FracTracker Alliance’s body of work in California provides a summary of the population demographics of communities most impacted by oil and gas extraction. It is clear that communities of color in Los Angeles and Kern County make up the majority of Frontline Communities. New oil and gas wells are not permitted in equitable locations and setbacks from currently active oil and gas extraction sites are an environmental justice necessity. Putting a ban on new permits and shutting down existing wells located within 2,500’ of sensitive receptors such as schools, hospitals, and homes would have a very small impact on overall production of oil in California. It is clear that the public health and environmental equity benefits of a 2,500’ setback far outweigh any and all drawbacks. We hope that the resources summarized in this article provide a useful source of condensed information for those that feel similarly.
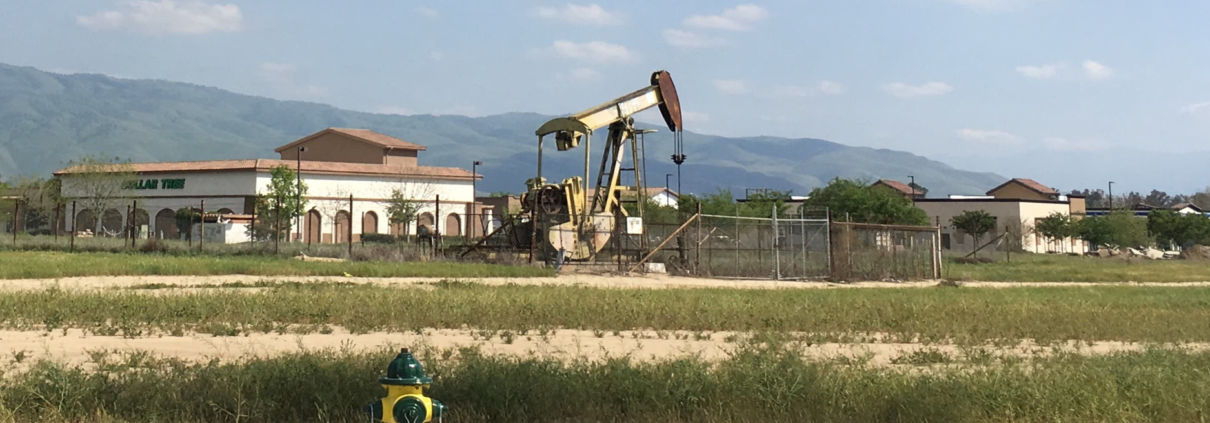
Feature photo of a well pad in California in April 2018, by Brook Lenker, FracTracker Alliance.
COVID-19 and the oil and gas industry are at odds. Air pollution created by oil and gas activities make people more vulnerable to viruses like COVID-19. Simultaneously, the economic impact of the pandemic is posing major challenges to oil and gas companies that were already struggling to meet their bottom line. In responding to these challenges, will our elected leaders agree on a stimulus package that prioritizes people over profits?
People living in areas with poor air quality may be more vulnerable to COVID-19, a disease that affects the lungs. Poor air quality is linked to higher rates of asthma and chronic obstructive pulmonary disease (COPD), even without a pandemic.
Air pollution from oil and gas development can come from compressor stations, condensate tanks, construction activity, dehydrators, engines, fugitive emissions, pits, vehicles, and venting and flaring. The impact is so severe that for every three job years created by fracking in the Marcellus Shale, one year of life is lost due to increased exposure to pollution.
Yes, air quality has improved in certain areas of China and elsewhere due to decreased traffic during the COVID-19 pandemic. But despite our eagerness for good news, sightings of dolphins in Italian waterways does not mean that mother earth has forgiven us or “hit the reset button.”
Significant environmental health concerns persist, despite some improvements in air quality. During the 2003 SARS outbreak, which was caused by another coronavirus, patients from areas with the high levels of air pollution were twice as likely to die from SARS compared to those who lived in places with little pollution.
On March 8th, Stanford University environmental resource economist Marshall Burke looked at the impacts of air quality improvements under COVID-19, and offered this important caveat:
“It seems clearly incorrect and foolhardy to conclude that pandemics are good for health. Again I emphasize that the effects calculated above are just the health benefits of the air pollution changes, and do not account for the many other short- or long-term negative consequences of social and economic disruption on health or other outcomes; these harms could exceed any health benefits from reduced air pollution. But the calculation is perhaps a useful reminder of the often-hidden health consequences of the status quo, i.e. the substantial costs that our current way of doing things exacts on our health and livelihoods.”
This is an environmental justice issue. Higher levels of air pollution tend to be in communities with more poverty, people of color, and immigrants. Other health impacts related to oil and gas activities, from cancer to negative birth outcomes, compromise people’s health, making them more vulnerable to COVID-19. Plus, marginalized communities experience disproportionate barriers to healthcare as well as a heavier economic toll during city-wide lockdowns.
The COVID-19 health crisis is setting off major changes in the oil and gas industry. The situation may thwart plans for additional petrochemical expansion and cause investors to turn away from fracking for good.
Oil, gas, and petrochemical producers were facing financial uncertainties even before COVID-19 began to spread internationally. Now, the economics have never been worse.
In 2019, shale-focused oil and gas producers ended the year with net losses of $6.7 billion. This capped off the decade of the “shale revolution,” during which oil and gas companies spent $189 billion more on drilling and other capital expenses than they brought in through sales. This negative cash flow is a huge red flag for investors.
“North America’s shale industry has never succeeded in producing positive free cash flows for any full year since the practice of fracking became widespread.” IEEFA
Shale companies in the United States produce more natural gas than they can sell, to the extent that they frequently resort to burning gas straight into the atmosphere. This oversupply drives down prices, a phenomenon that industry refers to as a “price glut.”
The oil-price war between Russia and Saudi Arabia has been taking a toll on oil and gas prices as well. Saudi Arabia plans to increase oil production by 2 – 3 million barrels per day in April, bringing the global total to 102 million barrels produced per day. But with the global COVID-19 lockdown, transportation has decreased considerably, and the world may only need 90 million barrels per day.
If you’ve taken Econ 101, you know that when production increases as demand decreases, prices plummet. Some analysts estimate that the price of oil will soon fall to as low as $5 per barrel, (compared to the OPEC+ intended price of $60 per barrel).
Oil and gas industry lobbyists have asked Congress for financial support in response to COVID-19. Two stimulus bills in both the House and Senate are currently competing for aid.
Speaker McConnell’s bill seeks to provide corporate welfare with a $415 billion fund. This would largely benefit industries like oil and gas, airlines, and cruise ships. Friends of the Earth gauged the potential bailout to the fracking industry at $26.287 billion. In another approach, the GOP Senate is seeking to raise oil prices by directly purchasing for the Strategic Petroleum Reserve, the nation’s emergency oil supply.
Speaker Pelosi’s proposed stimulus bill includes $250 billion in emergency funding with stricter conditions on corporate use, but doesn’t contain strong enough language to prevent a massive bailout to oil and gas companies.
Hopefully with public pressure, Democrats will take a firmer stance and push for economic stimulus to be directed to healthcare, paid sick leave, stronger unemployment insurance, free COVID-19 testing, and food security.
Fracking companies were struggling to stay afloat before COVID-19 even with generous government subsidies. It’s becoming very clear that the fracking boom is finally busting. In an attempt to make use of the oversupply of gas and win back investors, the petrochemical industry is expanding rapidly. There are currently plans for $164 billion of new infrastructure in the United States that would turn fracked natural gas into plastic.
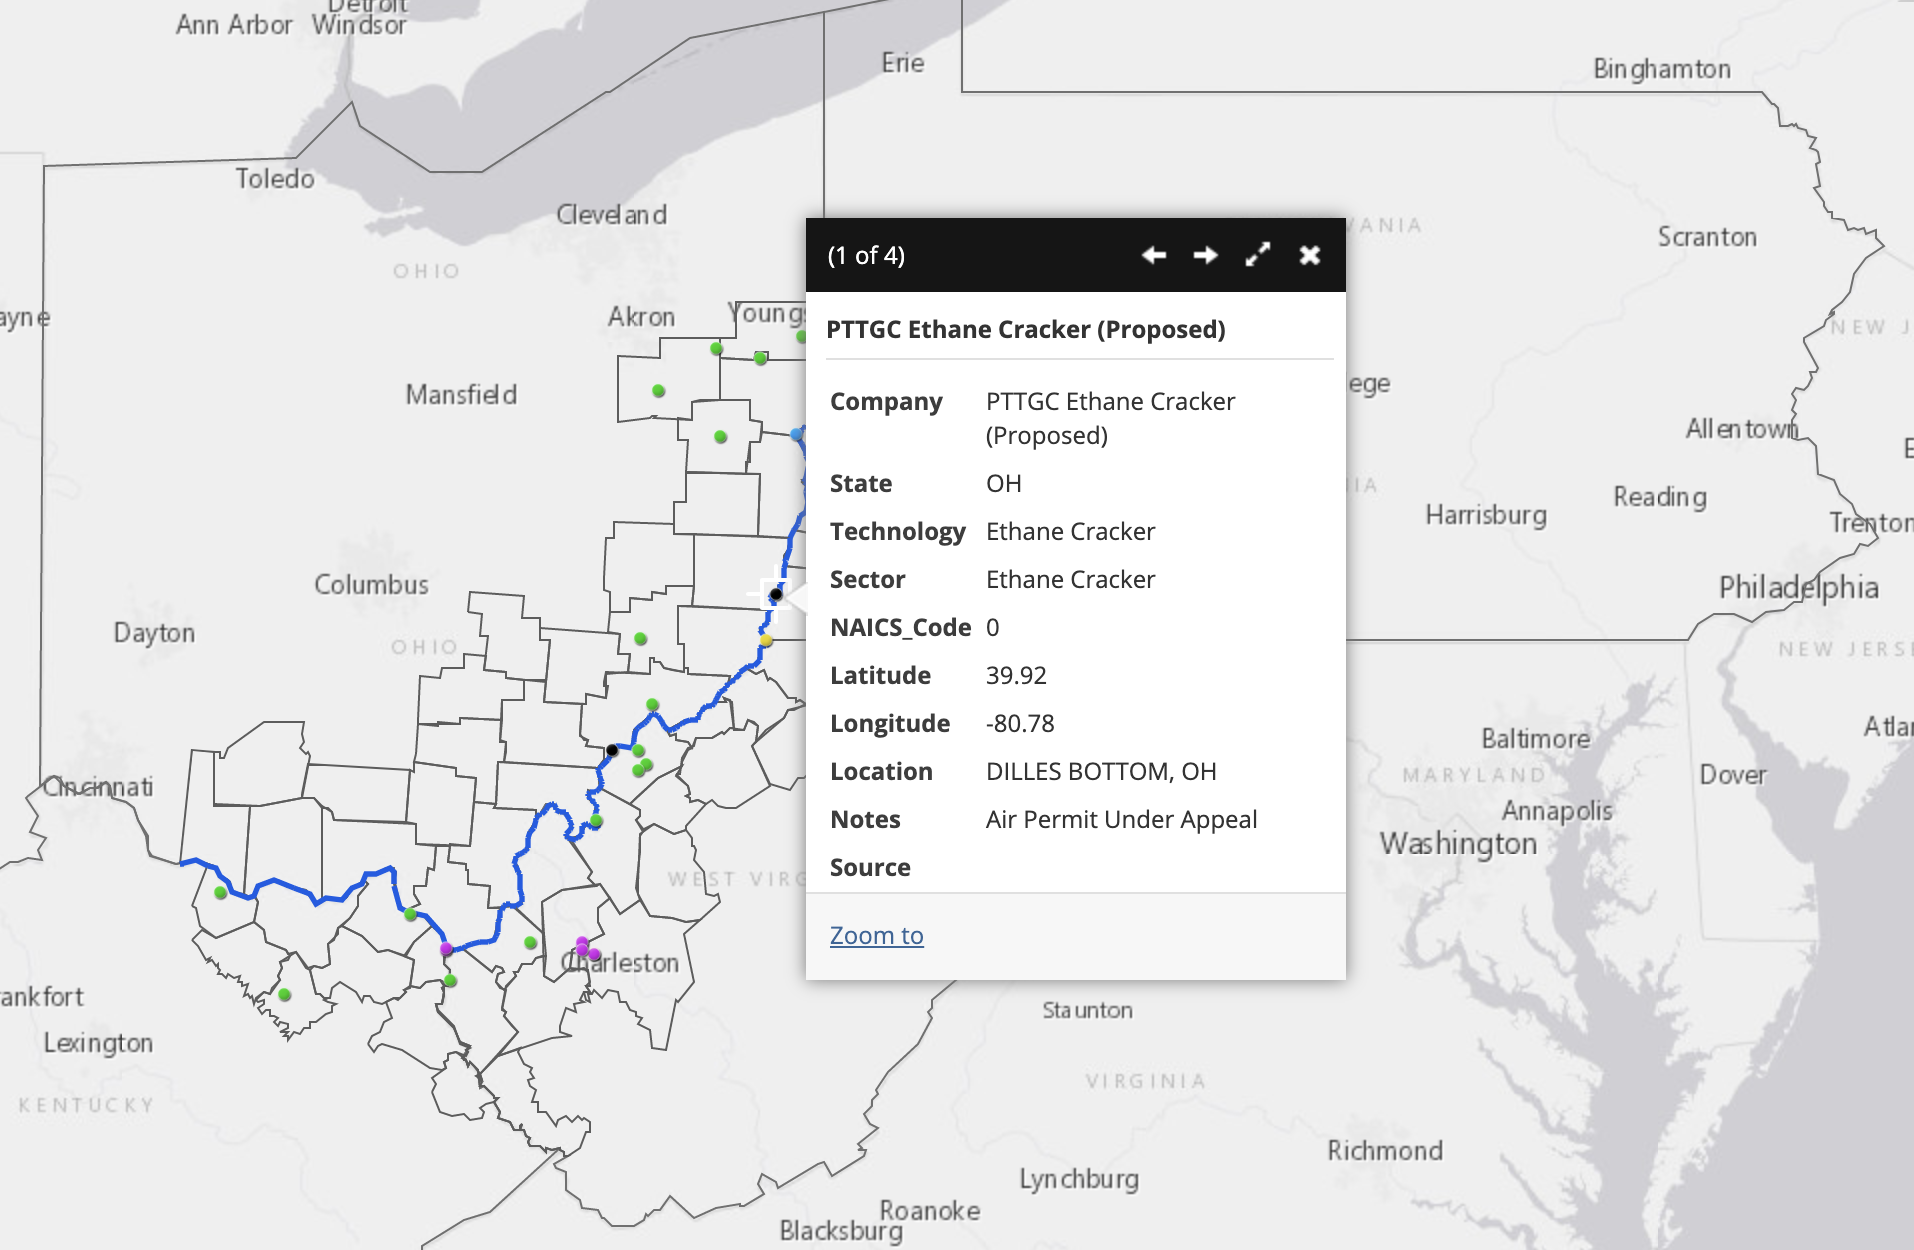
The location of the proposed PTTGC Ethane Cracker in Belmont, Ohio. Go to this map.
There are several fundamental flaws with this plan. One is that the price of plastic is falling. A new report by the Institute for Energy Economics and Financial Analysis (IEEFA) states that the price of plastic today is 40% lower than industry projections in 2010-2013. This is around the time that plans started for a $5.7 billion petrochemical complex in Belmont County, Ohio. This would be the second major infrastructural addition to the planned petrochemical buildout in the Ohio River Valley, the first being the multi-billion dollar ethane cracker plant in Beaver County, Pennsylvania.
Secondly, there is more national and global competition than anticipated, both in supply and production. Natural gas and petrochemical companies have invested in infrastructure in an attempt to take advantage of cheap natural gas, creating an oversupply of plastic, again decreasing prices and revenue. Plus, governments around the world are banning single-use plastics, and McKinsey & Company estimates that up to 60% of plastic production could be based on reuse and recycling by 2050.
Sharp declines in feedstock prices do not lead to rising demand for petrochemical end products.
Third, oil and gas companies were overly optimistic in their projections of national economic growth. The IMF recently projected that GDP growth will slow down in China and the United States in the coming years. And this was before the historic drop in oil prices and the COVID-19 outbreak.
“The risks are becoming insurmountable. The price of plastics is sinking and the market is already oversupplied due to industry overbuilding and increased competition,” said Tom Sanzillo, IEEFA’s director of finance and author of the report.
Oil, gas, and petrochemical companies are facing perilous prospects from demand and supply sides. Increasing supply does not match up with decreasing demand, and as a result the price of oil and plastics are dropping quickly. Tens of thousands of oil and gas workers are being fired, and more than 200 oil and gas companies have filed for bankruptcy in North America in the past five years. Investors are no longer interested in propping up failing companies.
Natural gas accounts for 44% of electricity generation in the United States – more than any other source. Despite that, the cost per megawatt hour of electricity for renewable energy power plants is now cheaper than that of natural gas power plants. At this point, the economy is bound to move towards cleaner and more economically sustainable energy solutions.
It’s not always necessary or appropriate to find a “silver lining” in crises, and it’s wrong to celebrate reduced pollution or renewable energy achievements that come as the direct result of illness and death. Everyone’s first priority must be their health and the health of their community. Yet the pandemic has exposed fundamental flaws in our energy system, and given elected leaders a moment to pause and consider how we should move forward.
It is a pivotal moment in terms of global energy production. With determination, the United States can exercise the political willpower to prioritize people over profits– in this case, public health over fossil fuel companies.
Top photo of petrochemical activity in the Houston, Texas area. By Ted Auch, FracTracker Alliance. Aerial assistance provided by LightHawk.
![]()
216 Franklin St, Suite 400, Johnstown, PA 15901
Phone: +1 (717) 303-0403 | info@fractracker.org
FracTracker Alliance is a 501(c)3 non-profit: Tax identification number: 80-0844297
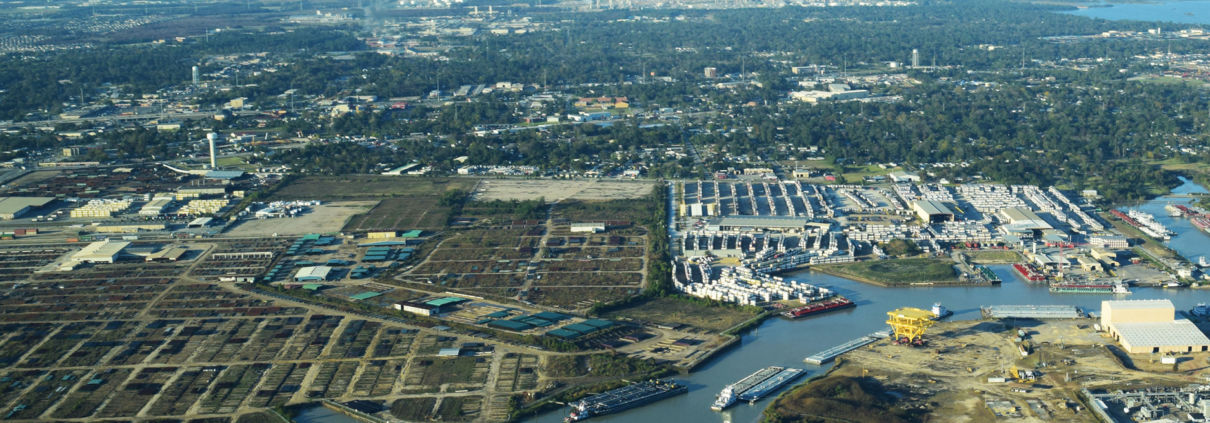 Photo by Ted Auch, FracTracker Alliance, with aerial support by LightHawk