The majority of FracTracker’s posts are generally considered articles. These may include analysis around data, embedded maps, summaries of partner collaborations, highlights of a publication or project, guest posts, etc.
Never has the saying “adding fuel to the fire” been so literal.
California wildfires have been growing at unheard of rates over the last five years, causing record breaking destruction and loss of life. Now that we’ve had a little rain and perhaps a reprieve from this nightmare wildfire season, it is important to consider the factors influencing the risk and severity of fires across the state.
Oil and gas extraction and consumption are major contributors to climate change, the underlying factor in the recent frequent and intense wildfires. A lesser-known fact, however, is that many wildfires have actually burned in oil fields in California – a dangerous circumstance that also accelerates greenhouse gas emissions. Our analysis shows where this situation has occurred, as well as the oil fields most likely to be burned in the future.
First, we looked at where wildfires are currently burning across the state, shown below in Map 1. This map is from CAL FIRE and is continuously updated.
Map 1. The CAL FIRE 2018 Statewide Incidents Map
CAL FIRE map showing the locations and perimeters of California wildfires
California’s recent fire seasons
The two largest wildfires in California recorded history occurred last year. The Mendocino Complex Fire burned almost a half million acres (1,857 square kilometers) in Mendocino National Forest. The Thomas Fire in the southern California counties of Ventura and Santa Barbara burned nearly 282,000 acres (1,140 square kilometers). A brutal 2017 fire season, however is now overshadowed by the ravages of 2018’s fires.
With the effects of climate change increasing the severity of California’s multi-year drought, each fire season seems to get worse. The Woolsey Fire in Southern California caused a record amount of property damage in the hills of Santa Monica and Ventura County. The Camp Fire in the historical mining town of Paradise resulted in a death toll that, as of early December, has more than tripled any other wildfire. And many people are still missing.
The Thomas Fire
A most precarious situation erupts when a wildfire spreads to an oil field. Besides having a surplus of their super flammable namesake liquid, oil fields are also storage sites for various other hazardous and volatile chemicals. The Thomas Fire was such a scenario.
The Thomas fire burned through the steep foothills of the coastal Los Padres mountains into the oil fields. When in the oil fields, the oil pumped to the surface for production and the stores of flammable chemicals provided explosive fuel to the wildfire. While firefighters were able to get the majority of the fire “contained,” the oil fields were too dangerous to access. According to the community, oil fires remained burning for weeks before they were able to be extinguished.
The Ventura office of the Division of Oil Gas and Geothermal Resources (DOGGR) reported that the Thomas Fire burned through the Taylor Ranch oil fields and a half dozen other oil fields including the Ventura, San Miguelito, Rincon, Ojai, Timbe Canyon, Newhall-Portrero, Honor Rancho and Wayside Canyon. DOGGR Ventura officials said Newhall-Potrero was “half burned over.” Thomas also burned within a 1/3 mile of the Sespe oil field. Schools and other institutions closed down throughout the Los Angeles Basin, but DOGGR said there was no impact on oil and gas operations that far south. The fire spurred an evacuation of the Las Flores Canyon Exxon oil storage facility but thankfully was contained before reaching the facility.
The Thomas Fire was not the first time or the last time an oil field burned in a California wildfire. Map 2 above shows state wildfires from the last 20 years overlaid with maps of California oil fields, oil wells, and high threat wildfire zones. The map shows just the oil fields and oil and gas wells in California that have been burned by a wildfire.
We found that 160 of California’s 517 oil fields (31%) have been burned by encroaching wildfires, affecting more than 10,000 oil and gas well heads.
An ominous finding: the state’s highest threat zones for wildfires are located close to and within oil and gas fields.
The map shows that wildfire risk is greatest in Southern California in Ventura and Los Angeles counties due to the arid environment and high population density. Over half the oil fields that have burned in California are in this small region.
Who is at fault?
Reports show that climate change has become the greatest factor in creating the types of conditions conducive to uncontrollable wildfires in California. Climate scientists explain that climate change has altered the natural path of the Pacific jet stream, the high-altitude winds that bring precipitation from the South Pacific to North America.
In a recent study, researchers from the University of Idaho and Columbia University found that the impact of global warming is growing exponentially. Their analysis shows that since 2000, human-caused climate change prompted 75% more aridity — causing peak fire season to expand every year by an average of nine days. The Fourth National Climate Assessment details the relationship between climate change and wildfire prevalence, and comes to the same conclusion: impacts are increasing.
On the cause of wildfires, the report explains:
Compound extremes can include simultaneous heat and drought such as during the 2011–2017 California drought, when 2014, 2015, and 2016 were also the warmest years on record for the state; conditions conducive to the very large wildfires, that have already increased in frequency across the western United States and Alaska since the 1980s.
Both 2017 and 2018 have continued the trend of warmest years on record, and so California’s drought has only gotten worse. The report goes on to discuss the threat climate change poses to the degradation of utilities’ infrastructure. Stress from climate change-induced heat and drought will require more resources dedicated to maintaining utility infrastructure.
The role of public utilities
The timing of this report could not be more ironic considering the role that utilities have played in starting wildfires in California. Incidents such as transformer explosions and the degradation of power line infrastructure have been implicated as the causes of multiple recent wildfires, including the Thomas Fire and the most recent Woolsey and Camp wildfires – three of the most devastating wildfires in state history. As public traded corporations, these utilities have investors that profit from their contribution to climate change which, in turn, has created the current conditions that allow these massive wildfires to spread. On the other hand, utilities in California may be the least reliant on fossil fuels. Southern California Edison allows customers to pay a surcharge for 100% renewable service, and Pacific Gas and Electric sources just 20% of their electricity from natural gas.
The CPUC is one of the government agencies tasked with ensuring that investor-owned utilities operate a safe and reliable grid… An essential component of providing safe electrical service is the financial wherewithal to carry out safety measures.
Along with regulation and oversight, part of the agency’s work involves ensuring utilities are financially solvent enough to carry out safety measures.
Conclusion
January 1, 2019 will mark the seventh year of drought in California. Each fall brings anxiety and dread for state residents, particularly those that live in the driest, most arid forests and chaparral zones. Data show that the wildfires continue to increase in terms of intensity and frequency as the state goes deeper into drought induced by climate change.
While California firefighters have been incredibly resourceful, over 70% of California forest land is managed by the federal government whose 2019 USDA Forest Service budget reduces overall funding for the National Forest System by more than $170 million. Moving forward, more resources must be invested in supporting the health of forests to prevent fires with an ecological approach, rather than the current strategy which has focused predominantly on the unsustainable practice of fuel reduction and the risky tactics of “fire borrowing”. And of course, the most important piece of the puzzle will be addressing climate change.
By Kyle Ferrar, Western Program Coordinator, FracTracker Alliance
Feature image by Marcus Yam, LA Times
https://www.fractracker.org/a5ej20sjfwe/wp-content/uploads/2018/11/ThomasFire_MarcusYam_LATimes_re.jpg400900Kyle Ferrar, MPHhttps://www.fractracker.org/a5ej20sjfwe/wp-content/uploads/2025/09/2025-Wordmark-Logo.pngKyle Ferrar, MPH2018-12-04 13:32:592021-04-15 14:57:06California’s Oil Fields Add Fuel to the Fire
In 2012, a battle between Ohio, West Virginia, and Pennsylvania was underway. Politicians and businesses from each state were eagerly campaigning for the opportunity to host Royal Dutch Shell’s “world-class” petrochemical facility. The facility in question was an ethane cracker, the first of its kind to be built outside of the Gulf Coast in 20 years. In the end, Pennsylvania’s record-breaking tax incentive package won Shell over, and construction on the ethane cracker plant began in 2017.
Once completed, the ethane cracker will convert ethane from fracked wells into 1.6 million tons of polyethylene plastic pellets per year.
Shell’s ethane cracker, under construction in Beaver County, PA. Image by Ted Auch, FracTracker.
Aerial support provided by LightHawk.
Ohio and West Virginia, however, have not been left out of the petrochemical game. In addition to the NGL pipelines, cryogenic plants, and fractionation facilities in these states, plans for ethane cracker projects are also in the works.
In 2017, PTT Global Chemical (PTTGC) put Ohio in second place in the “race to build an ethane cracker,” when it decided to build a plant in Belmont County, Ohio.
But first, why is the petrochemical industry expanding in the Ohio River Valley?
Fracking has opened up huge volumes of natural gas in the Marcellus and Utica shales in Pennsylvania, Ohio, and West Virginia. Fracked wells in these states extract methane, which is then transported in pipelines and used as a residential, industrial, or commercial energy source. The gas in this region, however, contains more than just methane. Classified as “wet gas,” the natural gas stream from regional wells also contains natural gas liquids (NGLs). These NGLs include propane, ethane, and butane, and industry is eager to create a market for them.
Plastic pellets, also called “nurdles,” the end product of ethane crackers.
Major processing facilities, such as cryogenic and fractionation plants, receive natural gas streams and separate the NGLs, such as ethane, from the methane. After ethane is separated, it can be “cracked” into ethylene, and converted to polyethylene, the most common type of plastic. The plastic is shipped in pellet form to manufacturers in the U.S. and abroad, where it is made into a variety of plastic products.
By building ethane crackers in the Ohio River Valley, industry is taking advantage of the region’s vast underground resources.
PTTGC ethane cracker: The facts
PTTGC’s website states that the company “is Thailand’s largest and Asia’s leading integrated petrochemical and refining company.” While this ethane cracker has been years in the making, the company states that “a final investment decision has not been made.” The image below shows land that PTTGC has purchased for the plant, totaling roughly 500 acres, in Dilles Bottom, Mead Township.
According to the Ohio EPA, the plant will turn ethylene into:
700,000 tons of high density polyethylene (HDPE) per year
900,000 tons Linear low-density polyethylene (LLDPE)
HDPE is a common type of plastic, used in many products such as bags, bottles, or crates. Look for it on containers with a “2” in the recycling triangle. LLDPE is another common type of plastic that’s weaker and more flexible; it’s marked with a “4.”
The ethane cracker complex will contain:
An ethylene plant
Four ethylene-based derivatives plants.
Six 552 MMBtu/hour cracking furnaces fueled by natural gas and tail gas with ethane backup
Three 400 MMBTU/hr steam boilers fueled by natural gas and ethane
A primary and backup 6.2 MMBtu/hour thermal oxidizer
A high pressure ground flare (1.8 MMBtu/hour)
A low pressure ground flare (0.78 MMBtu/hour)
Wastewater treatment systems
Equipment to capture fugitive emissions
Railcars for pygas (liquid product) and HDPE and LLDPE pellets
Emergency firewater pumps
Emergency diesel-fired generator engines
A cooling tower
Impacts on air quality
The plant received water permits last year, and air permits are currently under review. On November 29, 2018, the Ohio EPA held an information session and hearing for a draft air permit (the permit can be viewed here, by entering permit number P0124972).
The plant will be built in the community of Dilles Bottom, on the former property of FirstEnergy’s R.E. Burger Power Station, a coal power plant that shut down in 2011. The site was demolished in 2016 in preparation for PTTGC’s ethane cracker. In 2018, PTTGC also purchased property from Ohio-West Virginia Excavating Company. In total, the ethane cracker will occupy 500 acres.
R.E. Burger Power Station, which has been demolished for the PTTGC Ethane Cracker. Image Source
Table 1, below, is a comparison of the previous major source of air pollution source, the R.E. Burger Power Station, and predictions of the future emissions from the PTTGC ethane cracker. The far right column shows what percent of the former emissions the ethane cracker will release.
Table 1: Former and Future Air Emissions in Dilles Bottom, Ohio
Pollutant
R.E.Burger Power Station (2010 emissions, tons per year)
PTTGC Ethane Cracker (predicted emissions, tons per year)
Percent of former emissions
CO (carbon monoxide)
143.33
544
379.5%
NOx (nitrogen oxides)
1861.2
164
8.81%
SO2 (sulfur dioxide)
12719
23
0.18%
PM10 (particulate matter, 10)
179.25
89
49.65%
PM2.5 (particulate matter, 2.5)
77.62
86
110.8%
VOCs (volatile organic compounds)
0.15
396
264000%
As you can see, the ethane cracker will emit substantially less sulfur dioxide and nitrogen dioxides compared with the R.E. Burger site. This makes sense, as these two pollutants are associated with burning coal. On the flip side, the ethane cracker will emit almost four times as much carbon monoxide and 263,900% more volatile organic compounds (percentages bolded in Table 1, above).
In addition to these pollutants, the ethane cracker will emit 38 tons per year of Hazardous Air Pollutants (HAPS), a group of pollutants that includes benzene, chlorine, and ethyl chloride. These pollutants are characterized by the EPA as being “known or suspected to cause cancer or other serious health effects, such as reproductive effects or birth defects, or adverse environmental effects.”
Finally, the ethane cracker is predicted to emit 1,785,043 tons per year of greenhouse gasses. In the wake of recent warnings on the urgent need to limit greenhouse gas emissions from the Intergovernmental Panel on Climate Change and National Climate Assessment, this prediction is highly concerning.
While these emission numbers seem high, they still meet federal requirements and nearly all state guidelines. If the ethane cracker becomes operational, pollutant monitoring will be important to ensure the plant is in compliance and how emissions impact air quality. The plant will also attract more development to an already heavily industrialized area; brine trucks, trains, pipelines, fracked wells, compressor stations, cryogenic facilities, and natural gas liquid storage are all part of the ethane-to-plastic manufacturing process. The plastics coming from the plant will travel to facilities in the U.S. and abroad to create different plastic products. These facilities are an additional source of emissions.
Air permitting does not consider the full life cycle of the plant, from construction of the plant to its demolition, or the development associated with it.
As such, this plant will be major step back for local air quality, erasing recent improvements in the Wheeling metropolitan area, historically listed as one of the most polluted metropolitan areas in the country. Furthermore, the pollutants that will be increasing the most are associated with serious health effects. Over short term exposure, high levels of VOCs are associated with headaches and respiratory symptoms, and over long term exposure, cancer, liver and kidney damage.
Emergency preparedness
In addition to air quality impacts, ethane cracker plants also pose risks from fires, explosions, and other types of unplanned accidents. In 2013, a ruptured boiler at an ethane cracker in Louisiana caused an explosion that sent 30,000 lbs. of flammable hydrocarbons into the air. Three hundred workers evacuated, but sadly there were 167 suffered injuries and 2 deaths.
While researching Shell’s ethane cracker in Beaver County, FracTracker worked with the Emergency Operations Center (EOC) in St. Charles Parish, Louisiana, to learn about emergency planning around the petrochemical industry. Emergency planners map out two and five mile zones around facilities, called emergency planning zones, and identify vulnerabilities and emergency responders within them.
With this in mind, the map below shows a two and five-mile radius around PTTGC’s property, as reported by Belmont County Auditor. Within these emergency planning zones are the locations of schools, day cares, hospitals, fire stations, emergency medical services, hospitals, and local law enforcement offices, reported by Homeland Infrastructure Foundation Level Data.
The map also includes census data from the EPA that identifies potential environmental justice concerns. By clicking on the census block groups, you will see demographic information, such as income status, age, and education level. These data are important in recognizing populations that may already be disproportionately burdened by or more vulnerable to environmental hazards.
Finally, the map displays environmental data, also from the EPA, including a visualization of particulate matter along the Ohio River Valley, where massive petrochemical development is occurring. By clicking on a census block and then the arrow at the top, you will find a number of other statistics on local environmental concerns.
Emergency planning zones for Shell’s ethane cracker are available here.
Within the 5 mile emergency planning zone, there are:
9 fire or EMS stations
17 schools and/or day cares
1 hospital
6 local law enforcement offices
Within the 2 mile emergency planning zone, there are:
3 fire or EMS stations
7 schools and/or day cares
No hospitals
3 local law enforcement offices
Sites of capacity, such as the fire and EMS stations, could provide emergency support in the case of an accident. Sites of vulnerability, such as the many schools and day cares, should be aware of and prepared to respond to the various physical and chemical risks associated with ethane crackers.
The census block where the ethane cracker is planned has a population of 1,252. Of this population, 359 are 65 years or older. That is well above national average and important to note; air pollutants released from the plant are associated with health effects such as cardiovascular and respiratory disease, to which older populations are more vulnerable.
Conclusion
PTTGC’s ethane cracker, if built, will drastically alter the air quality of Belmont County, OH, and the adjacent Marshall County, WV. Everyday, the thousands of people in the surrounding region, including the students of over a dozen schools, will breathe in its emissions.
This population is also vulnerable to unpredictable accidents and explosions that are a risk when manufacturing products from ethane, a highly flammable liquid. Many of these concerns were recently voiced by local residents at the air permit hearing.
Despite these concerns and pushback, PTTGC’s website for this ethane cracker, pttgcbelmontcountyoh.com, does not address emergency plans for the area. It also fails to acknowledge the potential for any adverse environmental impacts associated with the plant or the pipelines, fracked wells, and train and truck traffic it will attract to the region.
With this in mind, we call upon PTTGC to acknowledge the risks of its facility to Belmont County and provide the public with emergency preparedness plans, before the permitting process continues.
If you have thoughts or concerns regarding PTTGC’s ethane cracker and its impact on air quality, the Ohio EPA is accepting written comments through December 11, 2018. We encourage you to look through the data on this map or conduct your own investigations and submit comments on air permit #P0124972.
How the frac sand industry is circumventing local control, plus where the industry is migrating
What is nonmetallic mineral mining?
It was more than a year and half ago that anti-frac sand organizer – and movement matriarch – Pat Popple published a white paper by attorney Elizabeth Feil in her Frac Sand Sentinel newsletter. The paper outlined potential impacts of something the Wisconsin Department of Natural Resources (DNR) calls the “Marketable Nonmetallic Mineral Deposit Registration” (MNMDR) program.
The program, passed in 2000, is outlined in Wisconsin’s administrative code under Subchapter VI “Registration of Marketable Nonmetallic Mineral Deposits (NR 135.53-NR 135.64). This program allows landowners to register parcels that sit atop marketable nonmetallic mineral deposits, such as frac sand, according to a licensed professional geologist. The geologist uses “logs or records of drilling, boring, geophysical surveys, records of physical inspections of outcrops or equivalent scientific data” to outline the quality, extent, depth, accessibility, and current market value of the minerals.
If a mine operator is not the landowner, it must first coordinate registration with the landowner to:
… provide protection against present or future land uses, such as the erection of permanent structures, that would impede their development…to promote more orderly future development of identified nonmetallic mineral resources and minimize conflict among land uses.
Photos by Ted Auch, Fractracker Alliance, and aerial support provided by LightHawk
Limitations of the registration program
The only requirement under this program is that the landowner “provide evidence that nonmetallic mining is a permitted or conditional use for the land under zoning in effect on the day in which notice is provided to the zoning authorities.” All registrations must be recorded in the county’s registrar of deeds 120 days before filing the registration. This process results in zoning authorities having a 60-day window to determine if they support or object to registrations in circuit courts.
Once counties are notified, they have no recourse for objection aside from proving that the deposit is not marketable or the parcel is not zoned for mining.
As Ms. Feil wrote, this program “preserves…[parcel] eligibility for nonmetallic mining in the future, even if a local governing body later passes new mining restrictions.” The former will have already been proven by the licensed geologist, and the latter is highly unlikely given lax or non-existent zoning in rural Wisconsin, where many land parcels are outside incorporated townships. Any parcel registered on this program remains in the program for a 10 year period and may be automatically re-registered under the initial geological assessment for another 10 year term “at least 10 days and no more than one year before registration expires.”
After this 20-year period, parcels start from scratch with respect to the registration process.
Initial inquiry and map methodology
As part of her white paper, Ms. Feil noted that in a quick check of her home county’s register of deeds, she found six nonmetallic mineral deposit registrations since 2000 in Trempealeau County and nine in neighboring Chippewa County. As a result of Ms. Feil’s initial inquiry, we decided it would be worth conducting a sweeping search for all nonmetallic parcel registrations in the nine most heavily frac sand-mined Wisconsin counties: Trempealeau, Barron, Crawford, Chippewa, Monroe, Jackson, Clark, Dunn, and Eau Claire.
“Wisconsin Nonmetallic Mineral Deposit Parcel Registrations and Likely Mine Parcels” Map
We were fortunate enough to receive funding from the Save The Hills Alliance (STHA) to conduct this research. We received “boots on the ground” assistance from the likes of Ms. Feil, Ms. Popple, and several other volunteers for acquiring hard copies of registrations as of the summer of 2018.
Our goal was to construct a map that would provide a predictive and dynamic tool for residents, activists, non-profits, researchers, local governments, and journalists to understand the future scale and scope of frac sand mining across West Central Wisconsin. We hope this will inspire a network of citizen scientists and mapping tools that can serve as a model for analogous efforts in Illinois, Minnesota, and Southeastern Michigan.
In addition to identifying parcels falling under Wisconsin DNR’s MNMDR registration program, we also used Wisconsin’s State Cartographer’s Office and Land Information Program “V4 Statewide Parcel Data” to extract all parcels:
Currently owned by active or historically relevant frac sand mine operators and their subsidiaries,
Owned by families or entities that have allowed for mining to occur on their property and/or have registered parcels under the MNMDR program, and,
All cranberry production parcels in Wisconsin frac sand counties – namely Monroe, Jackson, Clark, Wood, and Eau Claire, with Monroe, Jackson, and Wood the state’s top producing counties by acreage.
The latter were included in the map because Wisconsin DNR identified the importance of cranberry bogs in their Silica Sand Mining in Wisconsin January 2012 report. The report defined the “Cranberry Exemption” as follows:
Some of the counties in central Wisconsin that are seeing an increase in frac sand mining are also home to much of the state’s cranberry farming. Mining sand is a routine practice in the process of raising cranberries. Growers use sand in the cranberry beds to provide adequate drainage for the roots of the cranberry plants. The sand prevents root rot and fosters plant growth. Chapter 94.26, Wis. Stats, was established in 1867 and exempts cranberry growers from much of the laws applying to waters of the state under Chapter 30, Wis. Stats. With this exemption in place cranberry growers can, in theory, mine sand wherever and however they desire for use in cranberry production. Some cranberry growers are taking advantage of the high demand for sand and are selling their sand on the frac sand market (emphasis added). However, the Department has recently determined that the exemption in Ch. 94.26, Wis. Stats., from portions of Chapters 30 and 31, Wis. Stats., for cranberry culture is not applicable to non-metallic mining sites where a NR 216, W is. Adm. Code, stormwater permit is required. For those non-metallic mining operations where the material is sold and hauled off site, Chapters 30 and 31, Wis. Stats., jurisdiction will be applied.
Finally, the last data layer we’ve included in this map speaks to the enormous volumes of subsurface water that the industrial sand mining industry has consumed since 2010. This layer includes monthly and annual water volume withdrawals by way of 137 industrial sand mine (i.e., IN 65) high capacity wells (Our thanks to Wisconsin DNR Water Supply Specialist – Bureau of Drinking Water and Groundwater’s Bob Smail for helping us to compile this data.)
We have coupled that data to annual tonnages in order to quantify gallons per ton ratios for several mines across several years.
Results
Below is the completed map of current and potential frac sand mines in West Central Wisconsin, as well as high capacity wells. Click on the features of the map for more details.
We identified 4,049 nonmetallic parcel registration and existing sand mine operator parcels totaling 113,985 acres or 178 square miles spread across 14 counties in West Central Wisconsin (Table 1). The largest parcel sizes were U.S. Silica’s 398-acre parcel in Sparta, Monroe County and Badger Mining’s 330-acre parcel in St. Marie, Green Lake County. The average parcel is a mere 28 acres.
To put these figures in perspective, back in 2013 we quantified the full extent of land-use change associated with frac sand mining in this same region and found that the 75 active mines at the time occupied a total of 5,859 acres and averaged roughly 75 acres in size. This means that if current parcel ownership and nonmetallic parcel registrations run their course, the impact of frac sand mining from a land-use perspective could potentially increase by 1,900%!
Table 1. Nonmetallic or operator-owned frac sand parcels and their total and average acreage in 14 West Central Wisconsin counties
County
Number of Parcels
Total Acreage
Average Parcel Acreage
Barron
267
8,737
33
Buffalo
211
5,902
28
Burnett
4
140
35
Chippewa
580
15,585
27
Clark
74
2,391
32
Dunn
73
2,245
31
Eau Claire
151
4,101
27
Green Lake
74
2,648
36
Jackson
1,128
36,152
32
Monroe
459
11,185
24
Pierce
168
3,415
20
Rusk
2
64
32
Trempealeau
787
19,375
25
Wood
71
2,044
29
As for the “Cranberry Exemption” identified by Wisconsin DNR, we identified an additional 3,090 cranberry operator or family-owned parcels totaling 98,217 acres or 153 square miles – nearly equal to the acreage identified above. Figure 1 shows the extent of cranberry bog parcels and frac sand mines in Monroe, Wood, and Jackson Counties. The two largest parcels in this inquiry were the 275-acre parcel owned by Fairview Cranberry in Monroe County and a 231 acre-parcel owned by Ocean Spray in Wood County. Interestingly, the former is already home to a sizeable (i.e., 266 acres) frac sand mine operated by Smart Sand pictured and mapped in Figure 2.
Figure 1. Cranberry bog parcels and frac sand mines in the Wisconsin counties of Monroe, Jackson, and Wood
Figure 2. Current and potential extent of Smart Sand’s Fairview Cranberry frac sand mine, Tomah, Monroe County, Wisconsin
In total, the potential for mine expansion in West Central Wisconsin could consume an additional 212,202 acres or 331 square miles. Characterized by dairy farms, and also known as The Driftless Area, this region is where Aldo Leopold penned his masterpiece, A Sand County Almanac. To give a sense of scale to these numbers, it is worth noting that this type of acreage would be like clearing an area the size of the Dallas-Fort Worth metropolis.
Project limitations and emerging concerns
After completing this project, Liz Feil, Pat Popple, and I got on the phone to discuss what we perceived to be its limitations, as well as their concerns with the process and the implications of the MNMDR program, which are listed below:
1. Both Liz and Pat found that when they visited certain counties to inquire as to parcel registrations, most of the registrars of deeds had very little, if any, idea as to what they were talking about, which begged the questions:
Why does Wisconsin not have a uniform protocol and archival process for such registrations?
What are the implications of this program with respect to county and township taxable lands, future zoning, and/or master planning?
What does this program mean for surface and mineral rights ownership in Wisconsin, a state where these two are coupled or decoupled on a parcel by parcel basis?
2. Liz and Pat felt they ended up teaching county registrars more about this registration process during this exercise than they ended up learning themselves.
3. Given the potential ramifications of these types of programs, such registrations should be centrally archived rather than archived at disparate sites across the state. Registrations should be explicitly bolted onto efforts like the aforementioned statewide V4 Statewide Parcel Data, given the fact that the MNMDR parcels are registered for 10 years.
The footprint of frac sand mining at any one point is just a glimpse into how vast its influence could be in the future. Mapping parcel ownership like we’ve done gives people a more realistic sense for the scale and scope of mining in the future and is a more realistic way to analyze the costs/benefits of such an industry. This type of mapping exercise would have greatly benefited those that live in the coal fields of Appalachia and the Powder River Basin as they began to debate and regulate mining, rather than the way they were presented with proposals as smaller discrete operations.
This piecemeal process belies the environmental and social impact of any industrial process, which frac sand mining very much is.
Industrial sand mining and high capacity wells
There is a growing concern, based on a thorough analysis of the data, that the High Volume Hydraulic Fracturing (HVHF) industry’s unquenchable thirst for freshwater is growing at an unsustainable rate. Here at FracTracker, we have been quantifying the exponential increase in HVHF water use, namely in Ohio’s Muskingum River Watershed and northern West Virginia, for more than five years now. More recently, Duke University’s Avner Vengosh has conducted a thorough national analysis of this trend.
While the trends in HVHF water use and waste production are disturbing, such analysis leaves out the water industry uses to mine and process frac sand, or “proppant” in places like Wisconsin, Minnesota, and Illinois. Failure to incorporate such values in an analysis of HVHF’s impact on freshwater, both surface and subsurface, grossly underestimates the industry’s impact on watersheds and competing water uses.
Figure 3 shows monthly and cumulative water demand of frac sand mining. The first thing to point out is the marked seasonal disparities in water withdrawals due to the fact that many of Wisconsin’s frac sand mines go dormant during the winter and ramp up as soon as the ground thaws. The most important result of this work is that we finally have a sense for the total volumes of water permanently altered by the frac sand mining industry:
An astounding 30 billion gallons of water were used between January 2010 and December 2017
This figure is equivalent to the annual demand of ~72,500 US residents (based on an assumption of 418,184 gallons per year). This figure is also equivalent to between 2,179 and 3,051 HVHF wells in Ohio/West Virginia.
Figure 3. Cumulative and monthly water demand by Wisconsin’s frac sand mine Hi-Cap wells, January 2010-December 2017
Figure 4 shows water use by operator. The worst actors with respect to water withdrawals over this period were two wells serving Hi-Crush’s active Wyeville mine that in total used 9.6 billion gallons of subsurface water. Covia Holdings, formerly Unimin and Fairmount Santrol, utilized 5.8 billion gallons in processing an undisclosed amount of frac sand at their Tunnel City mine. Covia’s neighboring mine in Oakdale, owned by Wisconsin White Sand and Smart Sand, used more than 2.5 billion gallons during this period spread across six high-capacity wells.
Figure 4. Total water usage by operator, January 2010-December 2017
These tremendous water volumes prompted us to ask whether we could determine the amount of water needed to mine a typical ton of Wisconsin frac sand. There are numerous issues with data quality and quantity at the individual mine level and those issues stretch from the USGS all the way down to individual townships. However, some townships do collect tonnage records and/or “Fees Tied to Production” from mine operators which allow us to quantify productivity. Using this scant data and the above water volume data we were able to determine “gallons to tons of sand mined” ratios for the years of 2013, 2014, 2015, and/or 2017 for four mines and those ratios range between 30-39 to as much as 521 gallons of water per ton of sand (Table 2).
Table 2. Gallons of water per ton of sand mined for four Wisconsin frac sand mines, 2013-2017
Owner
Property
City
County
Gallon Per Ton
2013
2014
2015
2017
Wisconsin Industrial Sand
Maiden Rock Facility
Maiden Rock
Pierce
98
90
66
—
Thompson, Terry
Thompson Hills Mine
Chetek
Barron
—
30
521
—
Lagesse, Samuel
NA
Bloomer
Chippewa
39
—
48
—
CSP
Rice Lake Mine
Rice Lake
Barron
—
—
—
104
Conclusions
For far too long we’ve been monitoring frac sand mining retrospectively or in the present tense. We’ve had very little data available to allow for prospective planning or to model the impact of this industry and its role in the Hydraulic Fracturing Industrial Complex writ large. Given what we are learning about the fracking industry’s insatiable appetite for water and sand, it is imperative that we understand where frac sand mining will occur if this appetite continues to grow (as we expect it may, given the current political environment at the state and federal level).
Three examples of this growing demand can be found in our work across the Great Lakes:
2) In Le Sueur County, MN Covia – which is a recent merger of silica mining giants Unimin and Fairmount Santrol – has plans and/or parcel ownership speaking to the potential for an 11-fold increase in their mining operations, which would increase acreage from 560 to 6,500 acres (if sand demand increases at its current clip) (Figures 5 and 6).
Figure 5. Unimin’s current 560-acre frac sand mine parcel in Kasota, Le Sueur County
Figure 6. The potential 6,500 extent of Unimin mining by way of parcel ownership search
3) As we’ve previously highlighted, the potential outside Detroit, Michigan for US Silica to expand its current frac sand mining operations would displace hundreds of families. The planned expansion would grow their mine from its current 650-acre footprint to nearly 1,400 acres in the town of South Rockwood, Monroe County (Figure 7).
Figure 7. US Silica’s current (642 acres) and potential (1,341 acres) frac sand mine footprint in Monroe County, Michigan.
Given our experience mapping and quantifying the current and future impact of frac sand mining in states with limited mining activity, we felt it was critical that we apply this methodology to the state where industry is mining a preponderance of frac sand. However, this analysis was rendered a bit more complicated by the presence of the MNMDR program and Wisconsin DNR’s “Cranberry Exemption.” Adding to the challenge is the fact that many in Wisconsin’s frac sand communities demanded that we address the tremendous volumes of water being used by the industry and work to incorporate such data into any resulting map.
We hope that this map allows Wisconsin residents to act in a more offensive and prospective way in voicing their concerns, or simply to become better informed on how sand mining has impacted other communities, will influence them, and what the landscape could look like in the future.
It is critical that we see sand mining not as discrete mines with discrete water demands but rather as a continuum, or better yet an ecosystem, that could potentially swallow large up sizeable chunks of Western Wisconsin.
By Ted Auch, Great Lakes Program Coordinator, FracTracker Alliance
P.S. We’ll continue to add MNMDR registered parcels periodically. As parcels change ownership, we will be sure to update both the cranberry bog and industry owned parcel inventory in the comings months and years.
In recent years, Pennsylvanians have had to endure numerous massive pipeline projects in the Commonwealth. Some of these, such as the Mariner East 2, the Revolution, and the Atlantic Sunrise, have been beset with continuous problems. In fact, both the Mariner East 2 and the Revolution projects had their operations suspended in 2018. The operators have struggled to grapple with a variety of issues – ranging from sinkholes near houses, erosion and sediment issues, hundreds ofbentonite spillsinto the waters and upland areas of Pennsylvania, and more.
Part of the reason for the recent spate of incidents is the fact that so many pipelines are being built right now. These lines are traversing through undermined areas and land known to have underground karst formations, which are prone to subsidence and sinkholes. With more than 90,000 miles of pipelines and 84,000 miles of streams in Pennsylvania, substantial erosion and runoff issues are unfortunately quite common.
Map of pipeline routes in southwestern PA, various pipeline incidents, and karst formations:
Click here to learn more about recent pipeline incidents in Pennsylvania, along with how users of the FracTracker App have helped to chronicle problems associated with them.
Residents keeping track
Many residents have been trying to document issues in their region of Pennsylvania for a long time. Any pipeline incident should be reported to the Department of Environmental Protection (DEP), but in some instances, people want other residents to know and see what is going on, and submission to DEP does not allow for that. FracTracker’s Mobile App allow users to submit a detailed report, including photographs, which are shared with the public. App users have submitted more than 50 photographs of pipelines in Pennsylvania, including these images below.
The FracTracker Mobile App uses crowd-sourced data to document and map a notoriously nontransparent industry. App users can also report violations, spills, or whatever they find striking. For example, the first image shows construction of the Mariner East 2 in extreme proximity to high density housing. While regulators did approve this construction, and it is therefore not a violation, the app user wanted others to see the impact to nearby residents. Other photos do show incidents, such as the second photo on the second row, showing the sinkhole that appeared along the Mariner East 1 during the construction of the nearby Mariner East 2 pipeline.
Please note that app submissions are not currently shared with DEP, so if you happen to submit an incident on our app that you think they should know about, please contact their office, as well. The FracTracker Mobile App provides latitude and longitude coordinates to make it easier for regulators to find the issue in question.
Why have there been so many problems with pipelines in recent years?
Drillers in Pennsylvania’s Marcellus Shale and other unconventional formations predicted that they would find a lot of natural gas, and they have been right about that. However, the large resulting supply of natural gas from this industrial-scaled drilling is more than the region can use. As a result, gas prices remain low, making drilling unprofitable in many cases, or keep profit margins very low in others.
The industry’s solution to this has been two-pronged. First, there is a massive effort underway to export the gas to other markets. Although there are already more than 2.5 million miles of natural gas pipelines in the United States, or more than 10 times the distance from the Earth to the Moon, it was apparently an insufficient network to achieve the desired outcome in commodity prices. The long list of recent and proposed pipeline projects, complete with information about their status, can be downloaded from the Energy Information Administration (Excel format).
The industry’s other grand effort is to create demand for natural gas liquids (NGLs, mostly ethane, propane, and butane) that accompanies the methane produced in the southwestern portion of the state. The centerpiece of this plan is the construction of multiple ethane crackers, such as the one currently being built in Beaver County by Royal Dutch Shell, for the creation of a new plastics industry in northern Appalachia. These sites will be massive consumers of NGLs which will have to be piped in through pressurized hazardous liquid routes, and would presumably serve to lock in production of unconventional gas in the region for decades to come.
Are regulators doing enough to help prevent these pipeline development problems?
In 2010, the Pipeline and Hazardous Materials Safety Administration (PHMSA) led the formation of an advisory group called Pipelines and Informed Planning Alliance (PIPA), comprised mostly of industry and various state and local officials. Appendix D of their report includes a long list of activities that should not occur in pipeline rights-of-way, from all-terrain vehicle use to orchards to water wells. These activities could impact the structural integrity of the pipeline or impede the operator’s ability to promptly respond to an incident and excavate the pipe.
However, we find this list to be decidedly one-directional. While the document states that these activities should be restricted in the vicinity of pipelines, it does not infer that pipelines shouldn’t be constructed where the activities already occur:
This table should not be interpreted as guidance for the construction of new pipelines amongst existing land uses as they may require different considerations or limitations. Managing land use activities is a challenge for all stakeholders. Land use activities can contribute to the occurrence of a transmission pipeline incident and expose those working or living near a transmission pipeline to harm should an incident occur.
Pipeline being constructed near a home
While we understand the need to be flexible, and we certainly agree that every measure should be taken by those engaging in the dozens of use types listed in the PIPA report, it equally makes sense for the midstream industry to take its own advice, and refrain from building pipelines where these other land uses are already in place, as well. If a carport is disallowed because, “Access for transmission pipeline maintenance, inspection, and repair activities preclude this use,” then what possible excuse can there be to building pipelines adjacent to homes?
What distance is far enough away to escape catastrophic failure in the event of a pipeline fire or blast?
This chart shows varying hazard distances from natural gas pipelines, based on the pipe’s diameter and pressure. Source: Mark J. Stephens, A Model for Sizing High Consequence Areas Associated with Natural Gas Pipelines
It turns out that it depends pretty dramatically on the diameter and pressure of the pipe, as well as the nature of the hydrocarbon being transported. A 2000 report estimates that it could be as little as a 150-foot radius for low-pressure 6-inch pipes carrying methane, whereas a 42-inch pipe at 1,400 pounds per square inch (psi) could be a threat to structures more than 1,000 feet away on either side of the pipeline. There is no way that the general public, or even local officials, could know the hazard zone for something so variable.
While contacting Pennsylvania One Call before any excavation is required, many people may not consider a large portion of the other use cases outlined in the PIPA document to be a risk, and therefore may not know to contact One Call. To that end, we think that hazard placards would be useful, not just at the placement of the pipeline itself, but along its calculated hazard zone, so that residents are aware of the underlying risks.
Valve spacing
If there is an incident, it is obviously critical for operators to be able to respond as quickly as possible. In most cases, a part of this process will be shutting off the flow at the nearest upstream valve, thereby stopping the flow of the hydrocarbons to the atmosphere in the case of a leak, and cutting the source of fuel in the event of a fire. Speed is only one factor in ameliorating the problem, however, with the spacing between shutoff valves being another important component.
Comprehensive datasets on pipeline valves are difficult to come by, but in FracTracker’s deep dive into the Falcon ethane pipeline project, which is proposed to supply the Shell ethane cracker facility under construction Beaver County, we see that there are 18 shutoff valves planned for the 97.5 mile route, or one per every 5.4 miles of pipe. We also know that the Falcon will operate at a maximum pressure of 1,440 psi, and has pipe diameters ranging from 10 to 16 inches. The amount of ethane that could escape is considerable, even if Shell were able to shut the flow off at the valve instantly. It stands to reason that more shutoff valves would serve to lessen the impact of releases or the severity of fires and explosions, by reducing the flow of fuel to impacted area.
Conclusion
Groups promoting the oil and gas industry like to speak of natural gas development as clean and safe, but unless we are comparing the industry to something else that is dirtier or more dangerous, these words are really just used to provoke an emotional response. Even governmental agencies like PHMSA are using the rhetoric.
PHMSA’s mission is to protect people and the environment by advancing the safe transportation of energy and other hazardous materials that are essential to our daily lives.
If the safe transportation of hazardous materials sounds oxymoronic, it should. Oil and gas, and related processed hydrocarbons, are inherently dangerous and polluting.
Report
Events
Fatalities
Injuries
Explosions
Evacuees
Total Damages
Gas Distribution
29
8
19
12
778
$6,769,061
Gas Transmission / Gathering
30
0
2
2
292
$51,048,027
Hazardous Liquids
49
0
0
1
48
$9,115,036
Grand Total
108
8
21
15
1,118
$66,932,124
Impacts of pipeline incidents in Pennsylvania from January 1, 2010 through July 13, 2018. National totals for the same time include 5,308 incidents resulting 125 fatalities, 550 injuries, 283 explosions, and nearly $4 billion in property damage.
Current investments in large-scale transmission pipelines and those facilitating massive petrochemical facilities like ethane crackers are designed to lock Pennsylvania into decades of exposure to this hazardous industry, which will not only adversely the environment and the people who live here, but keep us stuck on old technology. Innovations in renewable energy such as solar and wind will continue, and Pennsylvania’s impressive research and manufacturing capacity could make us well positioned to be a leader of that energy transformation. But Pennsylvania needs to make that decision, and cease being champions of an industry that is hurting us.
Offshore drilling in the United States federal waters has caused the most environmentally destructive disasters in North America. Yet, new policy is pushing for the expansion of offshore drilling, particularly off the coast of California.
Offshore Drilling History
In 1969, Union Oil’s offshore rig Platform A had a blowout that leaked 100,000 barrels into the Santa Barbara Channel, one of the most biologically diverse marine environments in the world. The spill lasted ten days and killed an estimated 3,500 sea birds, as well as an untold number of marine mammals. Unbelievably, the Santa Barbara spill is only the third largest spill in U.S. waters. It follows the 1989 Exxon Valdez and the 2010 Deepwater Horizon spills. These incidents keep getting bigger.
More offshore drilling means a higher risk of catastrophe, additional contamination of air and water locally, and more greenhouse gas emissions globally.
Federal Moratorium on California Offshore Leases
Up until the beginning of 2018, further oil and gas development using offshore oil rig platforms seemed quite unlikely. After the 1969 oil spill from Platform A and the subsequent ban on further leasing in state waters, the risk of another devastating oil spill was too large for even the federal government to consider new leases. The fact that the moratorium lasted through 16 years of Bush presidencies is truly a victory. Across the aisle, expanding offshore operations has been opposed. In Florida, even Republican Governor Rick Scott teamed up with environmental groups to fight the Department of Interior’s recent sales of offshore leases.
Trump’s New Gas Leasing Program
Now, the U.S. Bureau of Ocean Energy Management (BOEM) is preparing a new 2019-2024 national Outer Continental Shelf (OCS) oil and gas leasing program to replace the existing 2017-2022 program. This is an unusual practice, and part of Trump’s America-First Offshore Energy Strategy. The Trump administration opened up most of the US coastal waters for new oil and gas drilling with a recent draft proposal offering 47 new offshore block lease sales to take place between 2019 and 2024.
Where might these new leases occur?
The offshore federal waters that are open for oil and gas leases are shown in dark blue in the map below (Figure 1). Zoom out to see the extent.
Southern California has a legacy of oil extraction, particularly Los Angeles. It’s not just the federal government that is keen on continuing this legacy. While the state has not permitted the leasing of new blocks in offshore waters, Governor Brown’s policies have been very friendly to the oil and gas industry. According to Oil Change International’s Sky’s the Limit report: “Under the Brown administration, the state has permitted the drilling of more than 20,000 new wells,” including 5,000 offshore wells in state waters. About 2,000 of these offshore wells have been drilled since 2012.
Southern California is the main target for future offshore leasing. The Monterey Shale formation, which underlies the city of Los Angeles and expands north offshore to the Ventura Coast, is thought to contain the largest conventional oil plays left IN THE WORLD! The map above shows the locations of state and federal offshore oil and gas wells and the rigs that service them. It also shows historical wells off the coast of Northern California.
Northern California, both onshore and offshore, sits on top of major reserves of natural gas, which may also be developed given the political climate. With an increase in the price of natural gas, operators will be developing these gas fields. Some operators, such as Chevron, have already drilled natural gas wells in northern California, but have left the wells “shut in” (capped) until production becomes more profitable.
FracTracker, in collaboration with Earthworks, recently teamed up with the Center for Biological Diversity and Greenpeace International to get up close to offshore oil rigs. As a certified Optical Gas Imaging Thermographer, Kyle Ferrar (Western Program Coordinator for FracTracker Alliance and California Community Empowerment Project Organizer for Earthworks), took footage of the offshore oil rigs.
Using infrared technology, we were able to visualize and record emissions and leaks of volatile hydrocarbons and other greenhouse gases coming from these offshore sites. We documented many cases of intense flaring from the rigs, including several cases where the poorly burning flare allowed hydrocarbons to be leaked to the atmosphere prior to complete combustion of CO2.
Below you can view a compilation of the footage we were able to capture from small pontoon boats.
Conclusion
FracTracker has looked at offshore oil and gas drilling from many different angles. We have looked to the past, and found the most egregious environmental damages in U.S. history. We have analyzed the data and shown where, when, and how much offshore drilling is happening in California. We have demonstrated that much of the drilling and many of the proposed leases are in protected and sensitive habitats. We have looked at policy and found that both Governor Brown and President Trump are aligned to promote more oil and gas development. We have even looked at the rigs in person in multiple spectrums of light and found that these operations continuously leak and emit greenhouse gases and other air toxins.
No matter which way you look at offshore oil and gas drilling, it is clearly one of the most threatening methods of oil and gas extraction in use today.
By Kyle Ferrar, Western Program Coordinator, FracTracker Alliance
https://www.fractracker.org/a5ej20sjfwe/wp-content/uploads/2018/10/CA-Offshore-Feature.png400900Kyle Ferrar, MPHhttps://www.fractracker.org/a5ej20sjfwe/wp-content/uploads/2025/09/2025-Wordmark-Logo.pngKyle Ferrar, MPH2018-11-05 14:32:422021-04-15 14:57:10The Feds Trump California’s State Ban on Offshore Oil Drilling
Industry, not deterred by resistance from regulators and environmentalists, has developed a new work-around method to get their product to market. Rather than build pipelines across rugged, remote, or highly-populated terrain, a new “solution” called “virtual pipelines” has come on the scene, with roots in New England in 2011.
The term “virtual pipeline,” itself, is so new that it is trademarked by Xpress Natural Gas (XNG), Boston, MA. XNG and other virtual pipeline companies use specially-designed tanker trucks to move compressed natural gas (CNG) or liquefied natural gas (LNG) via our public roads and highways. CNG in this system is under very high pressure — up to 3,600 psi when tank trailers are full. Rail and barge shipments are also considered part of the system, and trailers are designed to be easily loaded onto train cars or boats.
For the gas industry, virtual pipelines can be used in locales where gas is only needed for a limited time period, the pipeline network is not developed, or opposition by landowners is too contentious to make eminent domain an option, among other issues.
Restricted only by permissible weight limits on roads (up to 80,000 pounds or more), 5-axle trucks may make in excess of 100 round trips a day from the fueling location to their destination — sometimes hundreds of miles away. These trucks, which may travel alone or in caravans, are identifiable by the hazard class 2.1 placard they carry: 1971, indicative of flammable, compressed natural gas or methane. Manufacturers of these virtual pipeline rigs tout the safety considerations that go into their engineered design. These considerations include special pressure monitoring for the dozens of tanks and super-strength materials to protect against ruptures.
Specialized equipment has been created to load compressed gas tanks into the trailers that will carry them to their destinations. Here’s a promotional video from Quantum:
Loading CNG into specialized trailers for transport
Impacts on Communities
Following New York State’s rejection of the Constitution Pipeline in 2016 based on water quality concerns, industry has been looking for ways to move natural gas from Pennsylvania’s Marcellus gas fields to the Iroquois Pipeline. The current strategy is to load the gas in canisters from a special compressor facility, and re-inject the gas to a pipeline at the journey’s endpoint. The extent to which virtual pipelines may be utilized in New York State and New England is not well known, but the natural gas industry does speak in sanguine terms about this strategy as a solution to many of its transportation issues.
Citizen blogger/activist Bill Huston has compiled a list accidents that have occurred with CNG transport trucks along the virtual pipeline that runs from a “mother station” at Forest Lake, PA to Manheim, NY, near the Iroquois pipeline. While there have been no explosions or loss of life as a result of these accidents, there are a number of reported incidents of trucks tipping or rolling over, sliding off the road, or spontaneously venting.
To move CNG from “Point A” to “Point B,” truck traffic through populated areas is unavoidable. In central New York, public outcry about virtual pipelines is rising, due in large part to the safety issues associated with increased truck traffic on state highways. In rural New York, state highways run through towns, villages, and cities. They are not separated from population centers in the way that interstate highways typically are. Traffic from CNG transport trucks clogs roadways, in some cases burdening the pass-through communities with 100 or more tractor trailers a day. Routes pass directly in front of schools and health care facilities.
In short, virtual pipelines present a public safety hazard that has yet to be addressed.
Virtual Pipelines and the Cayuga Power Plant
In Lansing, NY, there is an inefficient and economically-beleaguered power plant, currently run on coal, that the power utility would prefer to see shut down. The Cayuga Power Plant was cited in 2016 for exceeding mercury emissions by nearly 2000%. Its inherently inefficient design makes it a significant greenhouse gas contributor. Years ago, it provided considerable tax benefits to its host community of Lansing, and as such has some lingering support. After both a devastating fire in one stack and mechanical failure in another, the plant has been barely running for the past 3 or 4 years. It is currently used as a “peaker plant“, operating only during periods of excessive demand on the electric grid, during summer months.
New York State’s Governor, Andrew Cuomo, has stated that all coal-power plants will be shut down by 2020.
Cayuga Power Plant in Lansing, NY.
Nonetheless, the plant owners are pushing to re-power the Cayuga Power Plant with natural gas. Currently, however, there is no pipeline to deliver the gas to the plant. Without support by the public nor the Public Service Commission for the construction of a supply pipeline, Cayuga Power Plant has revealed they plan to receive gas deliveries via truck.
Scenario Maps
FracTracker has modeled the five most likely scenarios that would take compressed natural gas from a loading station in northern Pennsylvania to the Cayuga Power Plant in Lansing. All of the scenarios bring the trucks through populated communities, in dangerous proximity to high-risk facilities where both human safety and evacuations are problematic. The routes also pass through intersections and road stretches that have some of the highest accident rates in the area.
Route 1
Route 1: This route passes within a half mile of homes of 36,669 people in the Villages of Lansing, Candor, Spencer, Owego; Towns of Ithaca, Lansing, Newfield, Danby, Candor, Spencer, Tioga, Owego, Vestal; and the City of Ithaca. Within the half-mile evacuation zone of this route, should there be an accident, are:
17 health care facilities
20 day care centers
4 private school
21 public schools
Route 2
Route 2: This route passes within a half mile of homes of 54,182 people in the Villages of Groton, Marathon, Whitney Point, Johnson City; Towns of Lansing, Dryden, Cortlandville, Groton, Virgil, Lapeer, Marathon, Lisle, Triangle, Barker, Chenango, Dickinson, Union, Vestal; and Cities of Cortland and Binghamton. Within the half-mile evacuation zone of this route, should there be an accident, are:
31 health care facilities
37 day care centers
3 private school
19 public schools
Route 3
Route 3: This route passes within a half mile of homes of 39,638 people in the Villages of Dryden, Lisle, Whitney Point, Johnson City; Towns of Lansing, Dryden, Groton, Harford, Richford, Lisle, Triangle, Barker, Chenango, Dickinson, Union, Vestal; and the City of Binghamton. Within the half-mile evacuation zone of this route, should there be an accident, are:
17 health care facilities
23 day care centers
1 private school
14 public schools
Route 4
Route 4: This route passes within a half mile of homes of 44,804 people in the Villages of Homer, Marathon, Whitney Point, Johnson City; Towns of Lansing, Summerhill, Locke, Genoa, Homer, Cortlandville, Virgil, Lapeer, Marathon, Lisle, Triangle, Barker, Chenango, Dickinson, Union, Vestal; and Cities of Cortland and Binghamton. Within the half-mile evacuation zone of this route, should there be an accident, are:
24 health care facilities
31 day care centers
2 private school
15 public schools
Route 5
Route 5: This route passes within a half mile of homes of 59,731 people in the Villages of Lansing, Lisle, Whitney Point, Johnson City; Towns of Lansing, Dryden, Ithaca, Caroline, Richford, Lisle, Triangle, Barker, Chenango, Dickinson, Union, Vestal; and Cities of Ithaca and Binghamton. Within the half-mile evacuation zone of this route, should there be an accident, are:
26 health care facilities
37 day care centers
3 private school
21 public schools
Click on the tabs in the box above to explore the five potential truck routes with maps.
Interactive Map
For a full interactive map of the potential routes for CNG delivery to the Cayuga Power Plant, and the schools, health care facilities, etc. within a half-mile evacuation zone of the routes, view the interactive map below.
Despite the apparent convenience that virtual pipelines present for the fossil fuel industry, they are not the solution the future energy supply needs. Yes, they present an alternative to pipeline transportation — but they also play a disastrous role in continuing our descent into climate chaos caused by increasing greenhouse gas concentrations in the atmosphere.
Methane leakage is an unavoidable component of the entire life cycle of natural gas usage — from “cradle to grave” — or more precisely, from the moment a well is drilled to when the gas is combusted by its end-user. And methane, as a greenhouse gas, is up to 100 times more potent than carbon dioxide. The Intergovernmental Panel on Climate Change’s (IPCC) recent report (see summary here) is unflinching in its clarion call for immediate, and extreme, cut-backs in greenhouse gas production. If we choose not to heed this call, much of humanity’s future survival is called into question.
By Karen Edelstein, Eastern Program Coordinator, FracTracker Alliance
More of the details about the Cayuga Power Plant will be explained in the upcoming weeks in a related guest blog by environmental activist and organizer, Irene Weiser, of Tompkins County, NY.
https://www.fractracker.org/a5ej20sjfwe/wp-content/uploads/2018/10/VirtualPipelines-Feature-Map.png400900Karen Edelsteinhttps://www.fractracker.org/a5ej20sjfwe/wp-content/uploads/2025/09/2025-Wordmark-Logo.pngKaren Edelstein2018-10-30 15:49:512021-04-15 14:57:33Virtual pipelines: Convenient for Industry, a Burden on Communities
Guest blog byChristine Yellowthunder, an environmental activist, tree farmer, and poet
Most people living in Wisconsin, Minnesota and Iowa have increased their knowledge over the past six years regarding the fracking destruction occurring across the country. The horror of fracking damages to life and land remain in the minds of most people who live near the massive land destruction from silica sand mining for what the unconventional oil and gas industry lovingly calls “proppant”.
Very often, we in the Midwest wonder if the rest of the country knows that this specialized form of silica sand mining destroys our rolling hills, woodlands, and water sources in order for silica sand to feed the fracking industry’s insatiable proppant demand.
Those of us who live in the direct path of this unhealthy silica sand mining need to make our stories known.
Bridge Creek Town, Wisconsin
The quiet abundance of life on an 80-acre tree farm in Wisconsin, fed by natural springs and wetlands, has nurtured every dream this prairie-raised transplant could conceive in the last 30 years. Six years of vigilance and rational debate has led to loss on every front when addressing the local government’s permitting of silica sand mines and its health and safety impacts on the community.
The largest sand mine in Bridge Creek Town lies one mile north of our tree farm. Two years ago, 40 acres of trees were culled for the installation of high intensity power lines to feed anticipated silica sand mine expansion under the legal provision of “Right-of-Way.” That document was signed by a previous land owner in 1948. No specific amount of land was specified on the original right-of-way, thus allowing significant legal destruction and permanent loss against the farm.
However, from a tree farm owner’s perspective, we have seen the variety and number of wildlife species increase at our farm over the past six years – likely because these species view our farm as an oasis, or what ecologists call a refugium, in an otherwise altered mixed-use landscape. The maximum capacity of the tree farm as a wildlife sanctuary is unknown. The adjacent silica Hi-Crush sand mine depletes the hillsides and woodlots in its path.
Frac sand mine in Eau Claire County, WI
Hi-Crush Partners LP’s frac sand mine
The weekly blasting away of the hillsides sends shock waves – shaking homes and outbuildings weekly, along with our nerves. Visible cracks appear in the walls of buildings, and private wells are monitored for collapse and contamination. The sand mine only guarantees repair to property lying within a half-mile of the mine. The mine blasts the land near Amish schools and has had a noticeable effect on the psyche of countless farm animals. The invisible silica is breathed by every living thing much to the mine’s denial, with deadly silicosis appearing up to 15 years after initial exposure. Our community is left to wonder who will manifest the health effects first. Blasting unearths arsenic, lead, and other contaminants into private wells and into the remaining soil.
There has been no successful reclamation of the land after it is mined, with most residents wondering what the actual point is of developing a reclamation plan is if timely implementation and stringent reclamation metrics are not enforced. All useful topsoil has been stripped away and is dead with the land only able to support sedge grasses and very few of them at best. No farming on this mined land can occur even though these mining companies promise farm owners that when they are done mining, soil productivity will meet or exceed pre-mining conditions and much milder slopes than the pre-mining bluffs that contained the silica sand. Needless to say, land values of homes, farms, and property decrease as the mines creeps closer.
Explore photos of Hi-Crush Partner’s frac sand mine:
The people of Bridge Creek
Bridge Creek, as well as many other towns, have been easy picking for the mines. Many towns are unzoned, having little industry, a meager tax base, and a huge land area for a very sparse population. The unemployment and underemployment rates are quite high. Many residents in Bridge Creek farm, including a very large population of Amish who own a checkerboard of land used for farming and saw mills. Most of these Amish families arrived here from Canada and bought farms when the mid 80’s drought put small farms up for sale. The Amish community seldom votes, and their strong religious beliefs prevent them from taking a stand on any political issues.
Video of contaminated well water an Amish farm in Augusta, WI near frac sand mining
Scroll to the end of the article to explore more impacts to the Amish community
The original residents of this land, the Ho-Chunk people, are few in number and wish to protect their home lands that they had purchased back from the government.
Furthermore, a significant number of artists live in this community and have chosen to keep their homes and studios in anonymity. Thus, it is very difficult to amass any unity among this diverse population to stand up to the local government. Many long-time residents have the attitude that you can’t stop “progress.” I wonder if they know that this kind of progress kills the future?
Broken promises made by the mining company for jobs and huge payments to the initial land sellers have divided families and the community. Even though the mining boom was sold as a job provider, few locals are employed by the mines. There is little faith that the local government will provide for the safety and well being of its residents. Presentation of research, facts regarding aquifer endangerment and silica sand health risks, and proposals written in detail outlining potential protective ordinances have cost citizens, including myself, enormous amounts of time and money. The government responses remain the same. The sand mines have been allowed to continue destruction of the natural resources to no one’s benefit except for the enormous profits lining the coffers of the mining corporations.
Today, after six years of continuous silica sand mining moving ever closer, I can no longer fight logically and linearly to eliminate the greed, injustice, and usurped power head on. I fight land destruction as a different warrior.
I choose to protect this land and wood by nurturing its existence through planting more native trees, educating others to the wisdom and wonder of nature, by photo journaling the struggle for its survival and documenting this land’s story so that future citizens will know the truth. Moreover, I will continue to spread the message loud and long: stopping the silica sand mining will stop fracking.
These efforts may be the best that I can manage with a grieving heart. A fierce spirit will continue to share this story and those of others living in the Midwest where the silica sand laden hills roll under the top soil of our lives.
Christine Yellowthunder is an environmental activist of Lakota heritage and is also a tree farmer and poet. She lives on her farm with her husband Ralph Yellowthunder, a Ho-Chunk elder and Vietnam combat veteran.
The Amish community in Bridge Creek:
Listen below to in interview of an Amish farmer and clock maker who lives adjacent to the Hi-Crush mine, by Ted Auch, FracTracker’s Great Lakes Program Coordinator, and local resident, Mary Ann O’Donahue:
The frac sand mine and its impact on well water
1:35 “We had no problem with the well until they started back here, and then from there on she was orange….in June, I put chickens in the barn and I put a new filter in the line…and in a month’s time it was stopped up”
4: 28 “They hauled all that toxic waste to the back of the mine and dumped it”
Water testing and dust in the air
1:35 “They test for magnesium and manganese and aluminum, metals…there’s like 5 pages of them, and iron, mercury, iodine…everything they say if it’s a certain color it’s high…It’s been going up ever since they started. The first test looked real good, before they started doing anything…and every year since, it’s getting higher and higher and higher…I don’t hear nothing from them, they take the sample and that’s it…They don’t come talk about it, they’re not concerned that it’s raising”
7:15 “I can have my cart sitting underneath the overhang by the shop and I’ve never had to worry about it being much dusty. But if it’s sitting underneath there over there in the summer time…it’s not there a day before it’s covered in it.” “And that stuff’s going in your mouth too.”
Hi-Crush pond and blasts from the mine
1:40 “Who knows what’s in the pond?” “Well, that’s the problem, all the chemicals they use they never tell anybody what they’re using to process this stuff, and it’s all in where ever it runs off”
7:15 “You should’ve been here Monday…It was a real hard blast… I had the engine running and was working in [the shop], and it was a very big shaking there, and I noticed it so it had to be a real big one and I came to the door to look and [the smoke from the blast] was still three lengths higher than the tree over there… Usually they’re doing it two times a week…I’m sure it [affected] my house, because my ceiling’s cracked more and more. There was one lady here once when it happened and she didn’t stay very long, she said ‘I’m going home, I’m not staying in this house'”
Impact to animals, light pollution, interactions with workers
0:50 “She was riding a buggy and…they just happened to blast about the time the horse was as close as it could be and the horse freaked out and ran and she couldn’t control it”
Relations between workers, local officials, and the Amish community
Accidents involving farm animals, workers, and residents
Feature image: Frac sand mining in Wisconsin. Photo by Ted Auch, FracTracker Alliance, with aerial assistance from LightHawk.
https://www.fractracker.org/a5ej20sjfwe/wp-content/uploads/2018/10/Featured_FracSand.jpg400900Guest Authorhttps://www.fractracker.org/a5ej20sjfwe/wp-content/uploads/2025/09/2025-Wordmark-Logo.pngGuest Author2018-10-29 11:45:292021-04-15 14:57:34Living on the Front Lines with Silica Sand Mines
In August 2016, Shell announced plans for the “Falcon Ethane Pipeline System,” a 97-mile pipeline network intended to feed Shell’s ethane cracker facility in Beaver County, Pennsylvania. In response to available data, FracTracker launched the Falcon Public EIA Project in January of 2018 to unearth the environmental and public health impacts of the proposed pipeline. As part of that project, today we explore Shell’s Chapter 105 application and the deficiencies the Pennsylvania Department of Environmental Protection (DEP) cited after reviewing Shell’s application.
Just a heads up… there are a lot.
Shell originally submitted a Chapter 105 application to the DEP to receive a permit for water obstruction and encroachment. The DEP began reviewing the application in January of 2018. On June 1st, they sent Shell technical deficiency letters listing several issues with the application. Shell responded to these deficiencies on August 1st.
Now, it’s up to the DEP to decide if Shell’s response is adequate, and if the department should go ahead and approve the application or require more work from Shell. Explore the technical deficiencies below for more information.
Technical Deficiencies
Below is a map that highlights several of the deficiencies the DEP found with Shell’s application and a brief explanation of each one. Expand the map full-screen to explore more layers – Some layers only become visible when you zoom in due to the level of detail they display.
Next, we’ll walk you through the technical deficiencies, which we have broken down into the following categories:
Wetlands, rivers, streams
Stormwater control
Public health and safety (drinking water & trails)
Conservation areas
Alternative routes
Geological concerns (including mining issues)
Documentation issues
Legend
A = Allegheny County, B = Beaver County, W = Washington County. The numbers reference the number listed in the deficiencies letter.
1. Wetlands, Rivers, & Streams
Water withdrawal from rivers and discharge
B2A2W2 The project will discharge waste water from an industrial activity to a dry swale, surface water, ground water, or an existing sanitary sewer system or separate storm water system. The DEP requested that Shell identify and describe this discharge, as the DEP’s Clean Water Program must authorize discharges. Shell stated that water will be discharged from hydrostatic testing, (which ensures a pipeline can withstand high pressure by pumping water through it to test for leaks), and a PAG-10 permit (needed for hydrostatic test water discharge) was submitted to the DEP July 27, 2018 with the locations of discharge. Drawings of the discharges are in Attachment O. (The locations of the discharges were not included in Shell’s public response to this deficiency.)
B33 A31 W31 Shell will be withdrawing water for hydrostatic testing. The DEP asked Shell to explain the intake and discharge methods so the DEP can decide if these should be included as impacts. The DEP also asked Shell to provide the location of intake and discharge. The DEP’s Clean Water Program must authorize discharges. In response, Shell stated that water will be withdrawn from Raccoon Creek and the Ohio River in West Virginia. The specific locations are listed in the PAG-10 permit, submitted to the DEP in July. Drawings of the discharges are included in Attachment O.
Wetlands and Streams
B5 A3 W4 The DEP asked Shell to identify the presence of wetlands within the project area that are identified by the US Fish & Wildlife Service’s National Wetlands Inventory (NWI) data system, and provide data on how they may be impacted by the proposed pipeline.Shell identified one NWI wetland in Beaver County, but did not delineate or provide information on it, due to safety concerns (it’s on a steep cliff). This wetland will be crossed via HDD (horizontal directional drill). In Allegheny County, there is an NWI wetland that Shell also did not provide data on. This wetland was not initially evident, and when staff returned to survey it, the property owner did not let them access the site becausethey did not want a pipeline on their property. According to Shell, this NWI wetland is not within the “Project’s Limit of Disturbance.” In Washington County, Shell stated that “all of the NWI-mapped wetlands that were determined not to be wetlands have been accounted for in Washington County. These NWI wetlands were all located in an area that had been previously strip-mined and due to mining activities, those wetlands are no longer there. Data were taken for these areas and included… separately as Attachment D.” Also in Washington County is an NWI wetland located above the Panhandle Trail, which Shell determined to be outside of the study area and therefore did not collect data on it. This wetland is not on the map, but Shell did provide this image of it.
B6 A4W5 The DEP requested that Shell match off-line wetland data with sampling point locations from study area maps. In response, Shell placed offline data sheets in the order that they are in Table 3 in the Wetlands Delineation Report and in Table 4 in the Watercourse Delineation Report.
B7 A5W6 Shell needed to discuss the types and conditions of riverine resources that the project impacts. Specifically, how the conditions of these resources relate to their hydrological functions, biogeochemical functions, and habitat attributes. These are discussed under question 7 for Beaver County, question 5 for Allegheny County, and question 6 for Washington County.
B8 A6 W7 Shell needed to discuss the types and conditions of wetlands that the project impacts. Specifically, how the conditions of these wetlands contribute to their hydrological functions, biogeochemical functions, and habitat attributes. Shell also needed to discuss impacts to wetlands that will be temporarily impacted, as it previously only discussed wetlands facing permanent impacts. These are discussed under question 8 for Beaver County, question 6 for Allegheny County, and question 7 for Washington County.
B9 A7 W8 The DEP asked Shell to evaluate the impact of open cut installation on wetlands with perched water tables and/or confining layers. Perched water tables have an impermeable confining layer (such as clay) between them and the main water table below. If open cut methods are used, the confining layer is destroyed and this water table will be lost. In Beaver County, Shell identified one wetland (W-PA-170222-MRK-002) will be open cut. If it is perched, Shell states it will replace the confining layer “along the same horizon during pipeline backfilling, and then [compact the layer] so that hydrology may be maintained.” Shell will also put trench plugs “on either side of the wetland on the ROW to prevent water from migrating out on the sides.” In Allegheny County, there are three wetlands potentially on perched water tables that will be open cut: W-PA-160401-MRK-006, W-PA-161220-MRK-001, and W-PA-161220-MRK-002.In Washington County, there are three wetlands potentially on perched water tables that will be open cut: W-PA-160407-JLK-002, W-PA-151203-MRK-005, and W-PA-151203-MRK-006.
A11 The DEP asked Shell to evaluate if any wetlands can be classified as “exceptional value” due to their proximity to nesting areas of the northern harrier (a threatened species in Pennsylvania). Wetlands are exceptional value if they serve as habitat for threatened or endangered species, or if they are hydrologically connected to or located within 0.5 miles of wetlands that maintain habitat for the species in the wetland. Shell determined that there are six wetlands that could be nesting areas for northern harriers, and therefore are exceptional value (W-PA-170207-MRK-002, W-PA-161205-WRA-001, W-PA-170207-MRK-003, W-PA-170207-MRK-001, W-PA-170113-MRK-008, W-PA-170113-MRK-001). Three of these wetlands are within the project’s LOD (W-PA-170207-MRK-002, W-PA-161205-WRA-001, W-PA-170207-MRK-003).
B13 A10W11 The DEP asked Shell to evaluate whether the proposed Falcon Pipeline will impact wetlands that are of “exceptional value” based on their proximity to public water systems. Wetlands can be considered “exceptional value” if they are located along public or private drinking water supplies (surface or ground water), and help maintain the quality or quantity of the supply. Shell stated that the (potentially man made) ponds near public water supply A could be considered exceptional value, however, they are located outside of the project’s study area and were not delineated, therefore Shell does not have information on them or their impact to this well. There were no other wetlands Shell considered to be exceptional value based on their proximity to public water systems.
B21 There were two protected plant species- harbinger of spring (PA threatened) and purple rocket (PA endangered)- located within the Raccoon Creek floodplain. The DEP asked Shell to evaluate whether there are wetlands in the project area that should be considered “exceptional value” due to their proximity to these species. Wetlands are considered “exceptional value” if they serve as habitat for a threatened or endangered plant or animal species. They are also exceptional value if they are hydrologically connected to or located within 0.5 miles of wetlands that maintain the habitat of the species. There are six wetlands near populations of these plant populations: W-PA-151014-MRK-001, W-PA-151013-MRK-002, -003, and -004, W-PA-170407-JLK-001, W-PA151013-MRK-001. However, Shell stated that the harbinger of spring is not dependent on wetland habitat for survival and the species is considered an upland plant species (because it is not listed on Eastern Mountains and Piedmont List or on the National Wetland Plant List). Purple rocket is listed as a “Facultative Wetland Plant” (FACW) on both lists. However, Shell stated that, “although it is a FACW, this plant is not one that occurs in wetlands,” and the population of purple rocket was found in an upland, disturbed area. Therefore, Shell determined that none of these wetlands are considered exceptional value.
B23 A21 W21 Shell needs to assess cumulative impacts to wetlands from the proposed pipeline and other existing projects and potential future projects. These are discussed in the Cumulative Impact Assessment document, Sections 4.1 and 4.2, and Tables B1 and B2.
B24 A22 W22 Shell needed to provide an explanation of how it will restore wetlands and streams disturbed during construction. The explanation needed to include information on seed mixes, shrubs, and trees that will restore stream banks and riparian areas.
B26 A24 W24 Shell needed to provide a table that lists, describes, and quantifies permanent impacts to wetlands and watercourses. Shell stated that there are no permanent fills associated with the project, but there will be permanent conversion impacts to the following wetlands. They total 10,862 ft2 or 0.25 acres in Beaver County, 5,166 ft2 (0.12 acres) in Allegheny County, and 4971 ft2 (0.11 acres) in Washington County. (W-PA-151013-JLK-005, W-PA-161202-MRK-001, W-PA-160404-MRK-001, W-PA-160412-CBA-004, W-PA-160412-CBA-001, W-PA-161205-WRA-003, W-PA-160401-MRK-005, W-PA-170213-JLK-003, W-PA-160406-MRK-001, W-PA-170413-RCL-005, W-PA-170214-CBA-005.)
B27 A25 W25 Shell needed to provide more information on the Neshannock Creek Restoration site, including a master restoration plan for the entire site. This mitigation is required to offset conversion impacts to wetlands along the pipeline route. The plan for the site is documented here.
B28 A26 W26 Shell needed to provide the location and resource crossing number for the HDDs in PA. They are listed in these tables:
Allegheny County:
Washington County:
Beaver County:
2. Stormwater control
B3 A1 W1 Shell indicated that the project was in a floodplain project by the Commonwealth, a political subdivision of the commonwealth or a public utility. The DEP asked for an identification of this floodplain project, to which Shell responded that it misunderstood the question and the pipeline will not go through a floodplain project by one of these entities, but rather a floodway. The pipeline will pass many floodways, which are listed in Table 1 in separate documents for Beaver County, Allegheny County, and Washington County.
W3 The DEP requested that Shell provide an analysis of impact to Act 167 plans. Act 167 requires counties to create stormwater management plans and municipalities to adopt ordinances to regulate development in accordance with these plans. The pipeline route occurs in areas with Act 167 plans in Chartiers Township, Mount Pleasant Township, and Robinson Township.
3. Public health and safety
B1 The proposed pipeline does not meet the provisions of a zoning ordinance or have zoning approval in a particular area. Specifically, in Independence Township, the pipeline is within setback distances of places of congregation and/or of residences. One example is the Beaver County Conservation District, considered a place of congregation. Shell responded to this deficiency, saying it is working with Independence Township to obtain necessary approvals, and the township will “officially remove the pipeline ordinance from their records and no variances or permits will be required.”
B10 A8W9 The DEP requested that Shell evaluate and discuss how the pipeline may impact public water systems that are within 1 mile of the pipeline route. Shell located 12 sites within a mile, most of which are ground water wells. One site is the Ambridge Water Authority, which provides drinking water for an estimated 30,000 people. Shell stated that impacts “might include an Inadvertent Return (IR) causing a bentonite slurry mix to enter the supply, which might contaminate the supply for any wells that are located near an HDD site or construction equipment.” Shell stated that all wells are a minimum of 1000 feet outside construction zones and built in thick bedrock which will minimize threat on contamination. The sites within 1 mile include:
Youthtowne Barn
Beaver County Conservation District
Independence Elementary School
Independence Volunteer Fire Department
McConnell’s Farm and Market, Inc
Ambridge Water Authority- Independence Township
Ambridge Water Authority- Raccoon Township
Hookstown Free Methodist Church
Hookstown Fair
Hookstown Grange
South Side Memorial Post 952
Jack’s Diner
NOVA Chemical, Inc
B11 A9 W10 The DEP asked Shell to discuss efforts to avoid/minimize impacts to the above public water systems, and suggested that efforts “might include, but are not limited to, considering alternative locations, routings or design for the proposed pipeline; providing provisions for shut-off in the event of break or rupture; etc.” Shell stated that the route avoids direct impacts to groundwater wells and surface water intake. Shell will provide water buffalos if wells are contaminated, and drill new wells if necessary. There are mainline valves approximately 7 to 7.5 miles apart that can automatically shut off the flow of ethane. There will also be staff living within the project area that can quickly respond to issues.
B12 The pipeline crosses headwaters of the Ambridge Reservoir and the Reservoir’s raw water service pipeline, which supplies water to 30,000 residents. The DEP noted significant public concern regarding this crossing, and asked Shell to evaluate and discuss the pipeline’s potential to affect the Reservoir and public water supply service. The DEP also asked Shell to elaborate on efforts to avoid/minimize impacts, and what measures will be implemented to mitigate any unavoidable impacts. In response, Shell stated the pipeline will cross the raw water line via an HDD 31 feet below the line. Shell explained that the water service line is made of pre-stressed concrete, which cannot be retrofitted in the field if a break occurs. It can take six weeks for pipe joints to be made and delivered from Ohio if there is a rupture. Shell stated it will supply extra pipe joints so the Ambridge Water Authority can have pieces on deck in case of a break. Shell also outlined the protective coatings and design of the HDD portion of the pipeline that will cross the water line, and said valves that can shut off the pipeline are located 2.4 miles from one side of the water line and 3.5 on the other.
A17W17 The DEP asked Shell to consider the proposed pipeline’s effect on the Montour Trail, a multi-use, recreational trail, and to consider re-routes that would avoid impacts to the Trail. Shell determined that routing around the trail is not feasible. Shell will use conventional bore or HDD methods. If the trail needs to be temporarily closed during construction, operation, or maintenance, Shell will notify the trail owner and provide alternate temporary access for trail users. Shell will also cross the Panhandle Trail by HDD. The entrance and exit sights of the bore will not be on the trail’s property. Shell has “unlimited ingress and egress over Owners property” for inspections, repair and maintenance of the pipeline, and in case of emergency situations.
B29 A27 W27 Shell needed to revise the “Shell Pipeline HDD Procedure” to include HDD site feasibility analysis, inadvertent return risk assessment, water supply protection, agency contact information, etc. Shell’s response is included in the document, Inadvertent Returns from HDD: Assessment, Preparedness, Prevention and Response Plan.
B30 A28 W28 Shell needed to include a preboring geologic evaluation to determine if drinking water supplies will be impacted around boring locations. Shell also needed to discuss how it will verify that drinking water sources and aquifers are protected and what measures will be taken in the event that they are impacted. Shell’s response is included as Appendix C to this document.
4. Conservation
B19 A18 W18 19A 19W – There are many areas important for the region’s biodiversity and natural heritage that the proposed pipeline passes near or through. The DEP asked Shell to evaluate impacts to these areas. Information on them is available from the Pennsylvania Natural Heritage Program. They include:
Ambridge Reservoir Valleys Natural Heritage Area
Lower Raccoon Creek Natural Heritage Area
Raccoon Creek Valley and Wildflower Reserve Natural Heritage Area
Raccoon Creek Floodplain Biologically Diverse Area
Raccoon Creek Landscape Conservation Area
Clinton Wetlands Biologically Diverse Area
Raccoon Creek Landscape Conservation Area
Raccoon Creek Valley & State Park Important Bird Area – Regarding the Important Bird Area, Shell stated that 23 miles of the pipeline is located within this area. Shell has not been able to get in contact with the National Audobon SW PA office. Shell added that the only waterbody large enough in the project area to support the documented waterfowl is the open water at Beaver County Conservation District.Shell stated that “an outlet has been installed at the far end of the lake to restore it to more of a wetland and less of a lake, as it was originally designed.” Raccoon Creek Valley is also a passageway for migratory birds, which are protected under the Migratory Bird Treaty Act. Shell stated that less than 2% of this Important Bird Area will be permanently impacted by pipeline construction and installation.
5. Alternative locations
B17 A15 W15 The DEP asked Shell to revise its current alternatives and provide a more detailed “analysis of the alternative locations and routes that were considered to avoid or minimize adverse environmental impacts.” The alternatives are discussed in Section 9 of Shell’s Comprehensive Environmental Assessment.
B18 16A16W According to the DEP, “18.5 of the 45 miles (41%) of the proposed pipeline are parallel to or adjacent to existing right-of-ways (ROWs).” The DEP asked Shell to see if there are additional opportunities to build the pipeline within existing ROWs, with the hope of reducing environmental impacts. In response, Shell discussed the additional ROWs that were considered (along Mariner West) but ultimately rejected. Shell discusses these routes more in Section 9.1 of the Comprehensive Environmental Assessment.
B32 A30 W30 The DEP asked Shell to discuss the feasibility of several changes to the proposed pipeline’s route, including avoiding impacts to wetlands, relocating resource crossings, moving valve sites outside of wetlands, moving HDD locations, and evaluating the impact to a coal refuse pile (the pipeline crosses underneath at least one pile via HDD). These reroutes are discussed under question 32 for Beaver County, question 30 for Allegheny County, and question 30 for Washington County.
6. Geological concerns
B14 12A 12W The pipeline is located in previously coal mined areas. The DEP asked Shell to provide a map of the pipeline that showed these mining areas, and GIS shape files with this information. Shell’s response is included in the HDD Subsurface Investigation Reports, which includes the following table of the extent of mined areas along the pipeline route:
B15 A13 W13 The pipeline is located in coal mined areas, which could be susceptible to subsidence and/or mine water discharge. The DEP requested that Shell revise drawings to show the limits of previously mined areas, depth of cover over the mine workings in areas the proposed pipeline crosses through, and the distance between mine workings and the proposed pipeline. Furthermore, the DEP asked Shell to “evaluate and discuss the potential for a subsidence event compromising the utility line, and the potential to create a mine water discharge.” Shell discusses this in Appendix B of this this document and in the Mining Summary Report. Shell also identifies the following areas as being at risk for coal mine discharge: HOU MM 1.2, HOU MM 8.9 (proposed HDD), HOU MM 12.1, HOU MM 12.95, HOU MM 13.1, HOU MM 13.6, HOU MM 17.4, and HOU MM 17.65 (proposed HDD).
B16 A1414W The DEP requested that Shell include areas where the pipeline will cross active mining permit boundaries. There is one active mining permit boundary that intersects the proposed pipeline, the Rosebud Mine in Beaver County.
B31 A29 W29 Shell needed to evaluate the potential for the project to encounter areas underlain by carbonate bedrock and landslide prone areas. Carbonate bedrock is indicative of a karst landscape, meaning an area likely to have underground sinkholes and caves. The DEP also asked Shell to discuss precautionary methods taken during construction in these areas. Shell’s response is included in the Carbonate Rock Analysis and Slope Stability and Investigation Report. The Carbonate Rock Analysis report shows that carbonate bedrock was encountered in 20 out of 40 of the borings taken during the analysis.
7. Documentation
B4 The PA DEP asked Shell to describe the structures and activities that occur within junction sites. Shell responded that there will be a Junction Custody Transfer Meter Station at the site, and provided maps of the site.
B22 20A 20w The DEP requested that Shell revise their Comprehensive Environmental Assessment to include alternatives, impacts, and mitigation items that were previously included in other sections of their environmental assessment.
B25 A23W23 The DEP asked Shell to provide a copy of the Mitigation Bank Credit Availability Letter from First Pennsylvania Resource, LLC. In response, Shell stated the Letter is no longer needed because “the permanent stream and wetland fills have been removed from this project.”
B35 A33 W33 Shell needs to include all of the above modifications to the application in the Chapter 103 permit application.
Conclusion
As evidenced by the list above, the proposed Falcon Pipeline poses a variety of threats to Pennsylvania’s natural resources, wildlife, and public health – but this deficiencies list is likely not complete. The pipeline also passes through West Virginia and Ohio, and if completed, will likely attract more pipelines to the area. As it feeds Shell’s ethane cracker plant in Beaver County, it is a major step towards the region becoming a hub for plastic manufacturing. Therefore, the public response to the above deficiencies and the decision the DEP makes regarding them will have major implications for the Ohio River Valley’s future.
Of note: The DEP’s letters and Shell’s response to them are available to the public in separate documents for Allegheny, Beaver, and Washington Counties.
By Erica Jackson, Community Outreach and Communications Specialist
PITTSBURGH, PA – At last night’s County Council meeting, Councilwoman Anita Prizio unveiled a new bill to create an oil and gas lease registry for Allegheny County, which would help the area’s residents and municipalities better plan for oil and gas development within their communities.
The legislation, which has been referred to committee, would establish a publicly-available database of drilling leases across the county, organized by address, municipality, and company lease holder.
In 2016, FracTracker Alliance noted many issues with the county’s existing system during a lease mapping project and supports the move to make county lease data more transparent. For example, entries in the current database recorded after 2010 do not list street addresses or parcel IDs, which are necessary for proper mapping of local drilling activity.
“The proposed oil and gas lease registry would be a step in the right direction for improving the industry’s transparency and accountability in an area surrounded by extensive drilling,” remarked FracTracker’s Manager of Data and Technology and Allegheny County resident, Matt Kelso. “These agreements are already public data, but they’re burdensome to access and essentially impossible to analyze in any comprehensive fashion.”
Industrial-scaled oil and gas development has steadily increased in Allegheny County, with permits for 258 unconventional wells, more than half of which are now operational. Based on its earlier mapping work, FracTracker estimates that 63,014 acres – roughly 18% of the county – are already under some kind of mineral rights lease or pipeline rights-of-way agreement, a calculation that did not include parcels that were not identified due to missing data.
The lease registry, which would disclose permitting statuses and well type, would also play a large part in supporting local zoning efforts and helping public safety officials prepare for incidents that could put residents and infrastructure at risk.
# # #
About FracTracker Alliance
FracTracker Alliance is a national organization with regional offices across the United States in Pennsylvania, Washington DC, New York, Ohio, and California. Our mission is to study, map, and communicate the risks of oil and gas development to protect our planet and support the renewable energy transformation. We accomplish this by supporting advocacy groups at the local, regional, and national level – informing actions to positively shape our nation’s energy future. Check out FracTracker’s 2016 Allegheny Lease Mapping Project.
https://www.fractracker.org/a5ej20sjfwe/wp-content/uploads/2018/09/AlleghenyCounty-Map-Feature.jpg400900FracTracker Alliancehttps://www.fractracker.org/a5ej20sjfwe/wp-content/uploads/2025/09/2025-Wordmark-Logo.pngFracTracker Alliance2018-09-26 12:40:032021-04-15 14:57:37Supporting accessible oil and gas lease data in Allegheny County
California has become a battleground for real climate action. The state Governor, Jerry Brown prides himself in his own climate leadership, and California has pushed EU nations and countries worldwide to take climate change seriously. As a final tribute to his own tenure as a term-limited governor, Brown has organized and hosted a Global Climate Action Summit, September 12-14th. The summit convenes an international invitation list of “climate leaders” to, in their words:
“Take Ambition to the Next Level.” It will be a moment to celebrate the extraordinary achievements of states, regions, cities, companies, investors and citizens with respect to climate action. It will also be a launchpad for deeper worldwide commitments and accelerated action from countries—supported by all sectors of society—that can put the globe on track to prevent dangerous climate change and realize the historic Paris Agreement.
Meanwhile, frontline communities, community organizers, and grassroots organizations contest the perspective that real change has been made. While investors and green capitalists celebrate, frontline communities fight daily for clean air and water. In solidarity with and led by frontline communities, activists have protested the summit, in an attempt to hold policy makers accountable to those most affected by the fossil fuel industry.
Rise for Climate, Jobs, and Justice
One quarter of a million people worldwide, and well over 30,000 in San Francisco hit the streets during the Rise for Climate last Saturday, September 8th. With over 900 actions taking place simultaneously people worldwide demanded real climate action from their local leaders. FracTracker Alliance staff helped coordinate and participated in events nationwide.
In San Francisco, the march was led by members of the Indigenous community, making up the Indigenous Bloc, on the frontlines of the action. The day officially started with prayers from Indigenous leaders and a moment of silence for Indigenous Peoples that have been most harmed by the effects of climate change. Dozens of various other movements followed the Indigenous Bloc in a parade of support. FracTracker took the opportunity to document this monumental event, and photos from the march are shown below.
March Photos
For California and international “climate leaders” in attendance, Rise kicked off a long week of climate action culminating with the Global Action Climate Summit. The week is full of activities geared towards movement building, including the Solidarity to Solutions Summit (#sol2sol) by It Takes Roots; Women’s Assembly for Climate Justice, hosted by Women’s Earth and Climate Action Network; and mass actions including a march and occupation of the Global Climate Action Summit!
SB100
To mark such a momentous movement, the Brown administration signed a new bill into law, SB100. The new law, authored by Kevin De León (D-Los Angeles), pledges that all of California’s electricity will come from clean power sources by 2045. Brown said, “California is committed to doing whatever is necessary to meet the existential threat of climate change.” This is the most ambitious state climate policy in the U.S. The legislation barely passed the state Legislature after nearly two years of debate, with opponents arguing that it would lead to higher electric bills for all Californians.
Opposition from Eco-Activists
In opposition to the feel-good, pat-yourself-on-the-back feelings from delegates at the summit, frontline communities and activists respond that the SB100 legislation does nothing to stop harms to frontline communities caused by extraction and the supply side of the fossil fuel economy. The Against Climate Capitalism campaign is a coalition of Diablo Rising Tide teamed up with Idle No More SF Bay, the Ruckus Society, It Takes Roots, Indigenous Environmental Network and the Brown’s Last Chance. Members of the coalition have been outspoken proponents organizing in support of real climate leadership. The coalition is pushing for Governor Jerry Brown and the California legislature to end the extraction of new fossil fuels in California. The green groups making up these larger coalition networks encompass a broad range research and advocacy groups, from international groups like Greenpeace to local grassroots movements from Los Angeles and California’s Central Valley. FracTracker Alliance is also a campaign member.
The goal of the campaign is to keep fossil fuels in the ground, and supports a just transition from a fossil fuel economy to clean energy sources. A petition to pressure California Governor Jerry Brown to end fossil fuel extraction can be found on their website. The California legislature and the Brown administration has consistently failed to address the impacts of extraction in its own backyard. While frontline communities are suffering, the Brown administration continues to take the easy way out with future legislation such as SB100, which does nothing to address the environmental justice spector of actual oil drilling and production. In response to SB100, the campaign has issued response:
Governor Brown has consistently failed to address the supply side of oil and the drilling in California, which is an indispensable step to avoid the worst effects of climate destruction.
Some 5.4 million Californians live within a mile of at least one oil or gas well, and this includes hundreds of thousands of children. Many suffer illnesses from toxic exposure and cannot wait for action.
Brown’s failure to act on this issue is a massive moral failure from which no bill signing can distract. Despite his signing of an important and historical bill he did nothing to draft or support, Governor Brown can expect to be greeted with energetic and committed protest at the Global Climate Action summit this week.
With these poignant criticisms, it begs the question; how can Governor Jerry Brown continue to ignore the actual cause of climate change? Brown has passed legislation ensuring that everyday Californians will bear the costs for clean energy utilities, but has done nothing to hold accountable the actual culprits responsible for climate change, the oil and gas corporations extracting the 5.7 million barrels of oil per year from California soil.
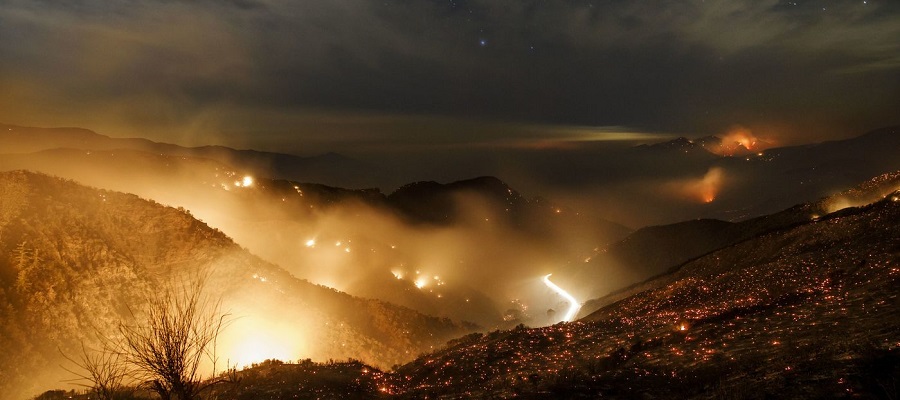
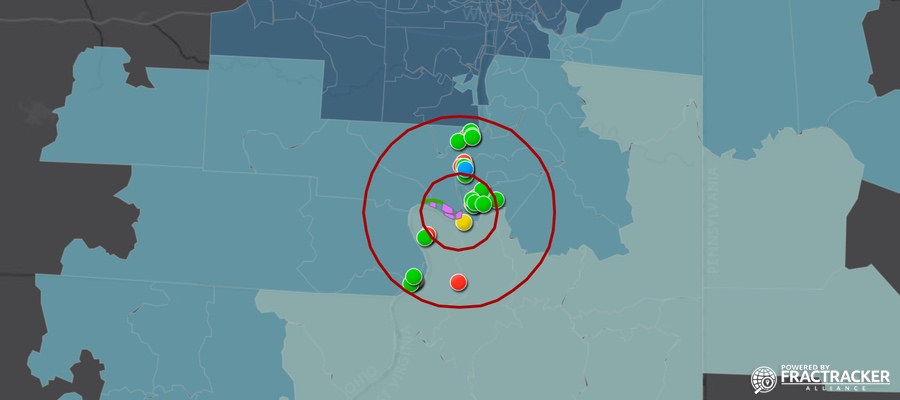
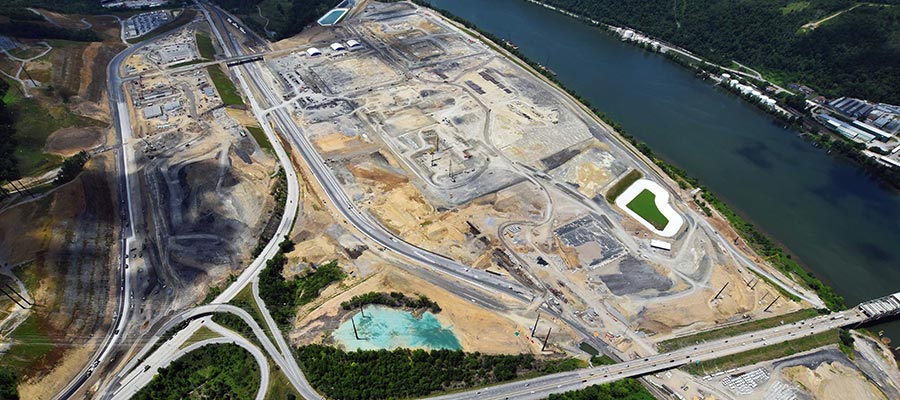


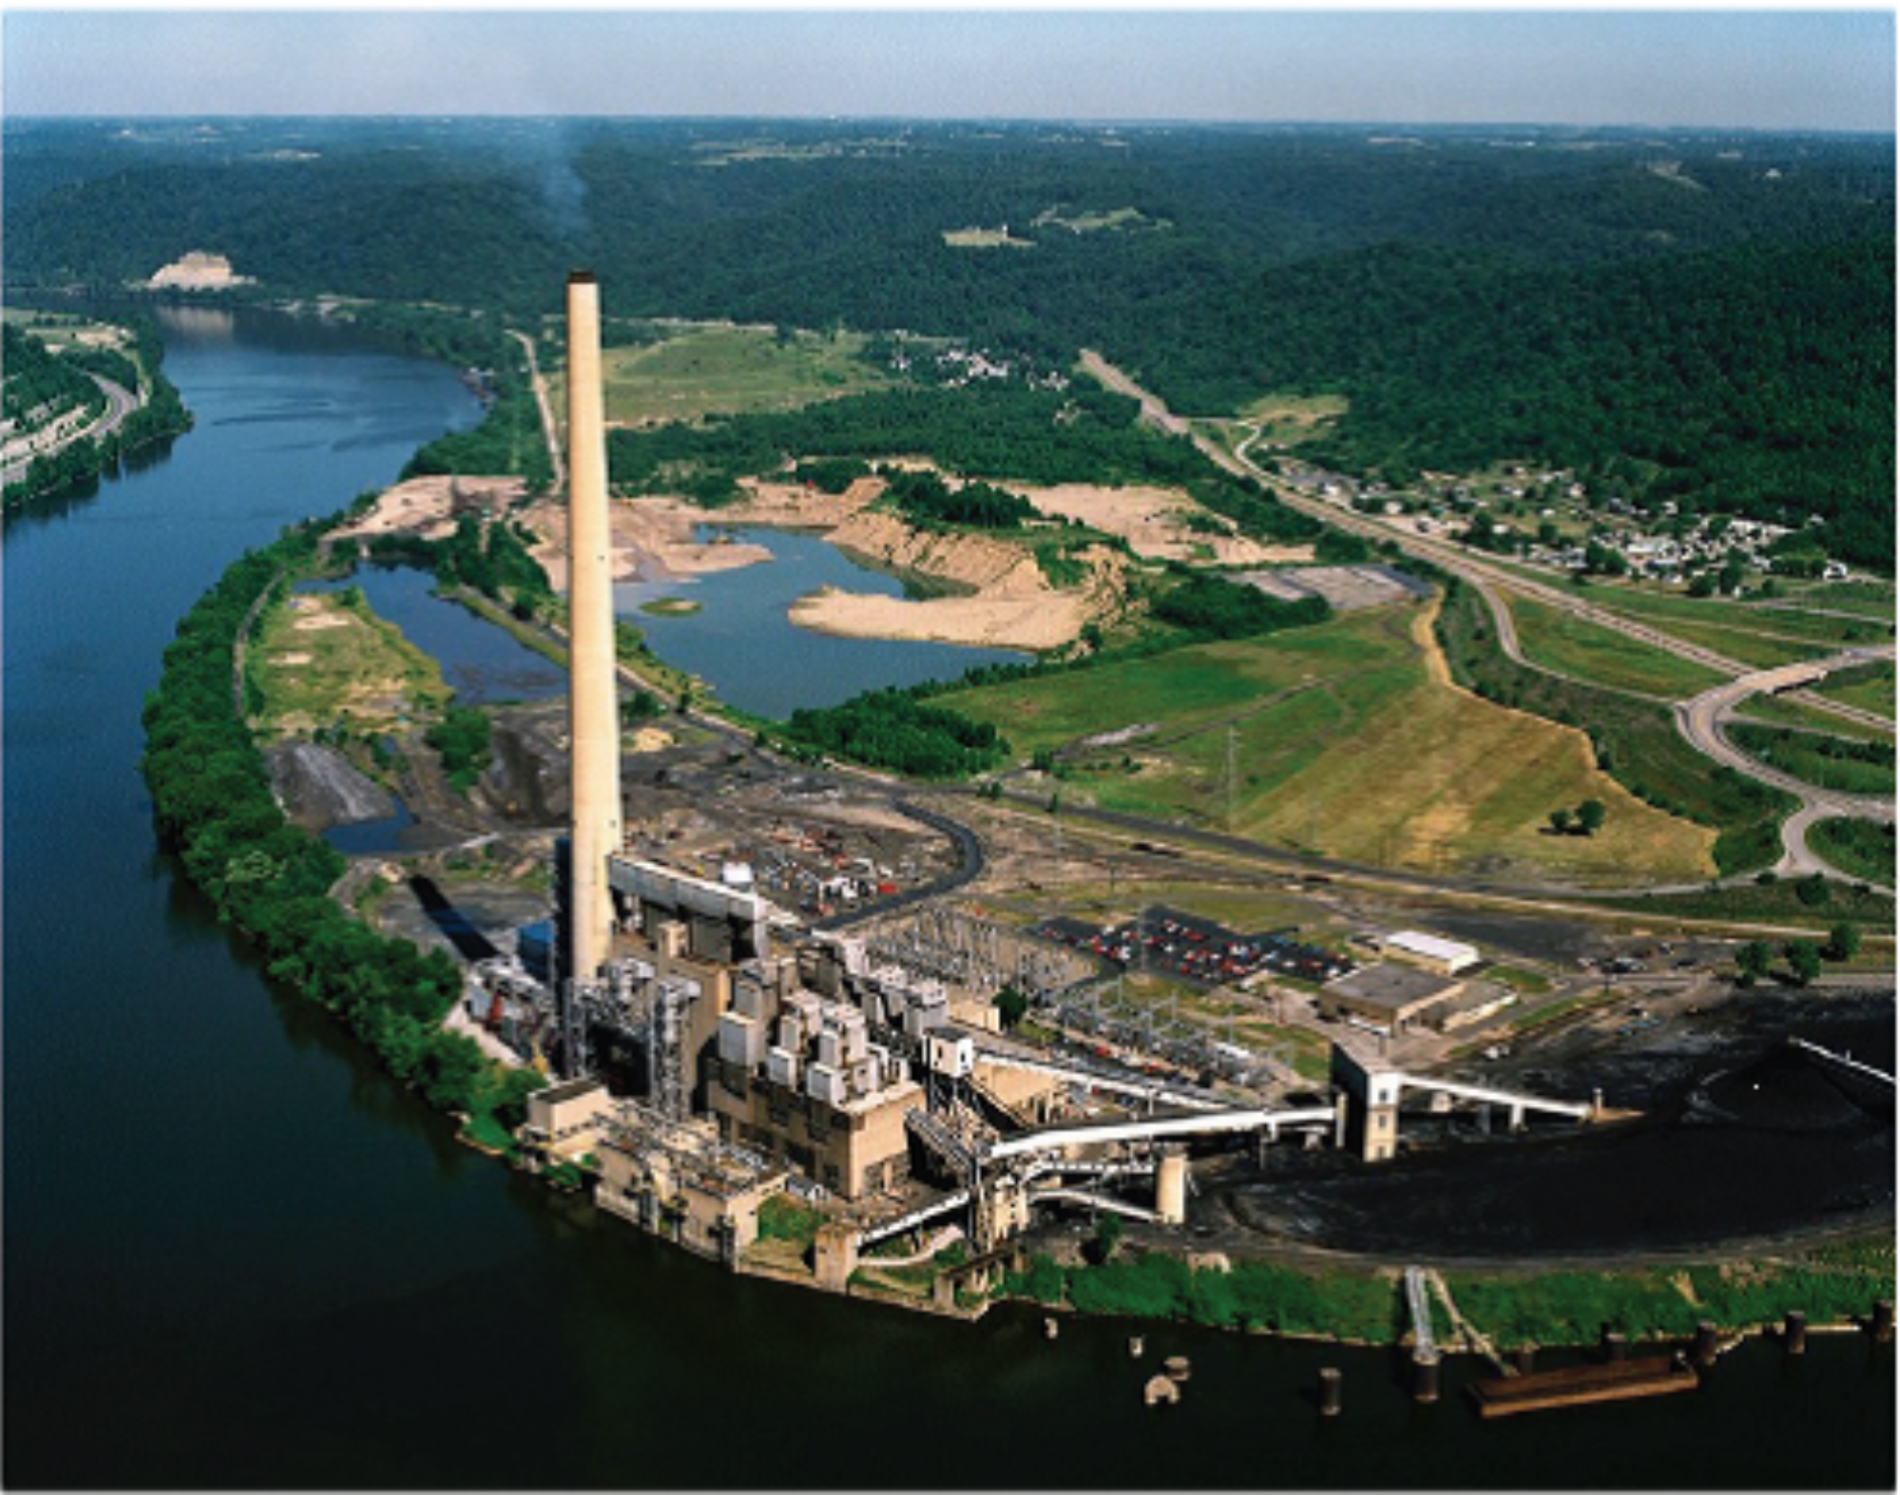
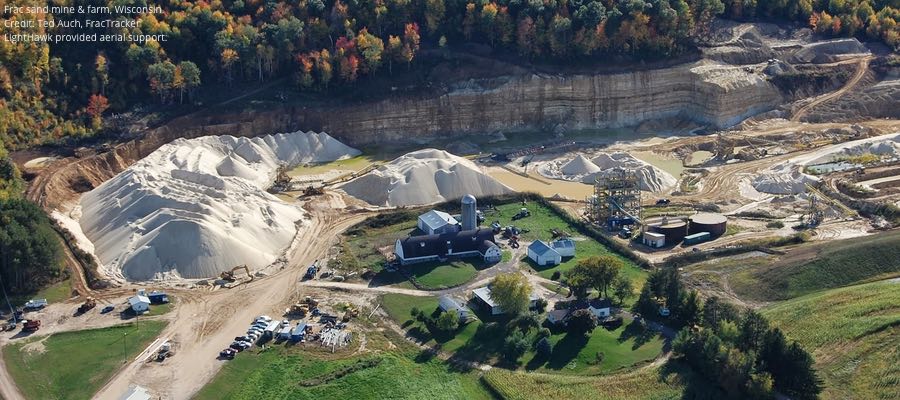
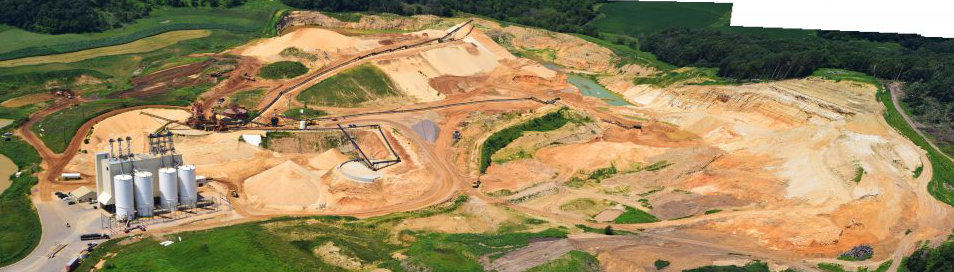
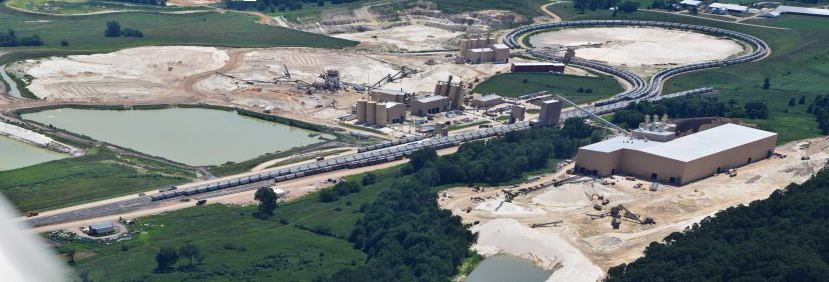
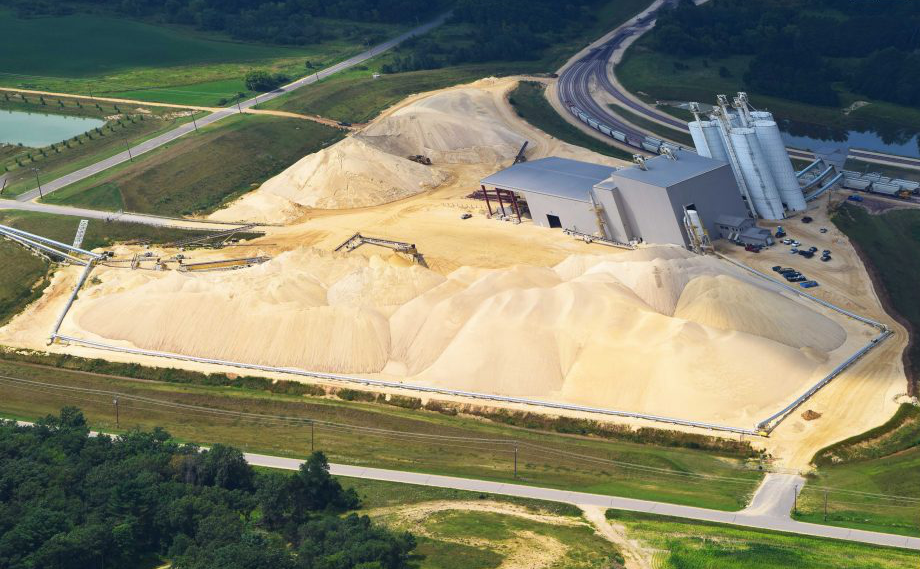
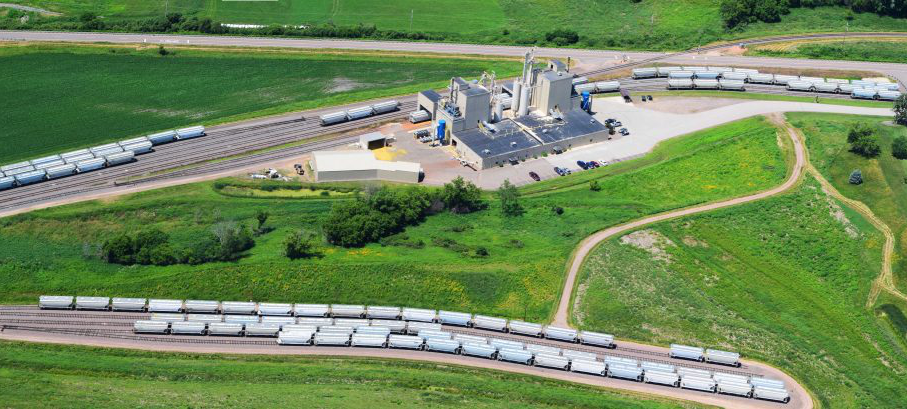

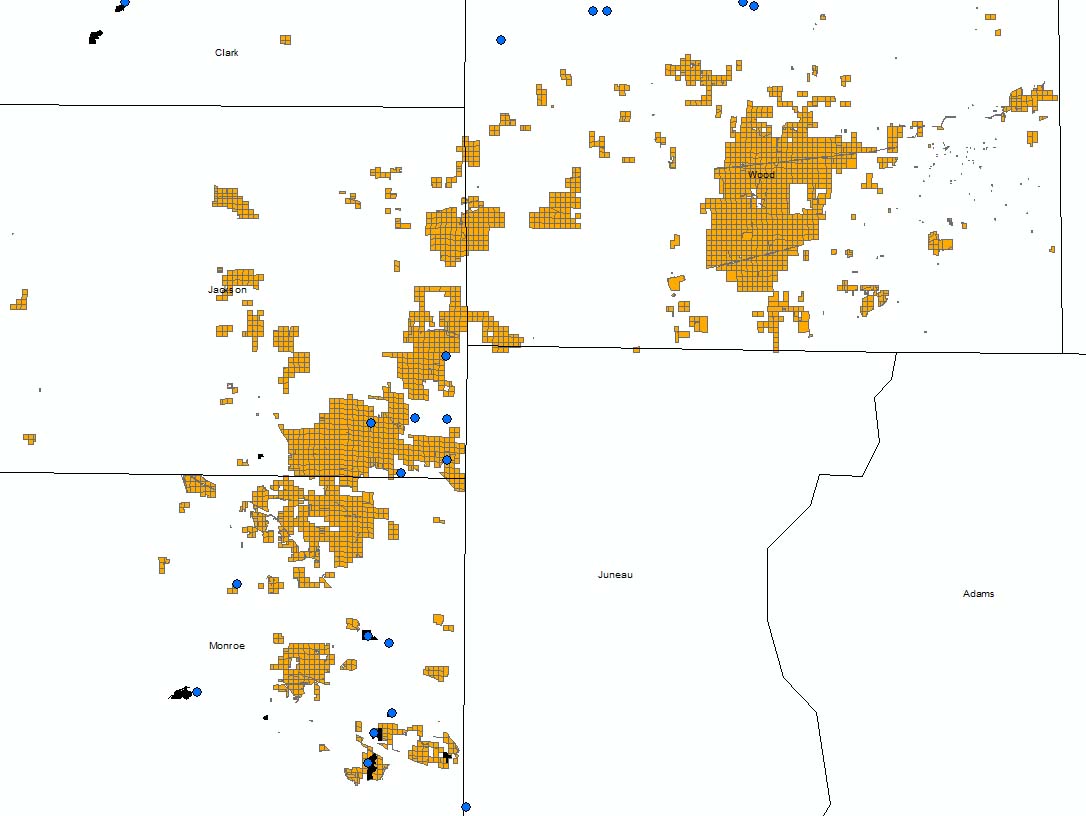
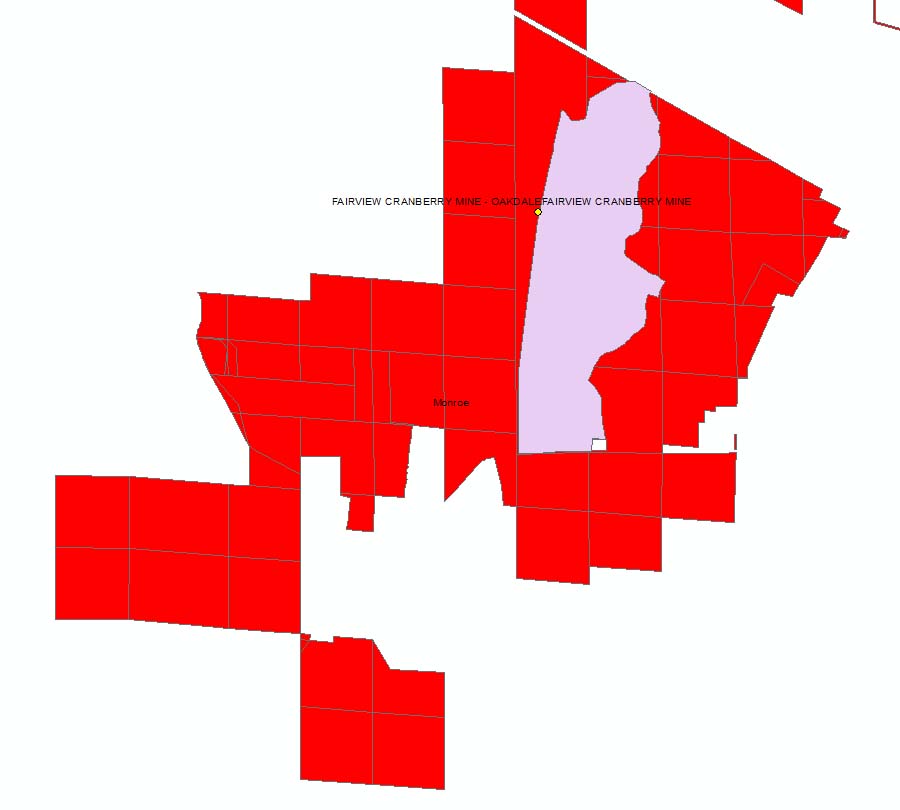
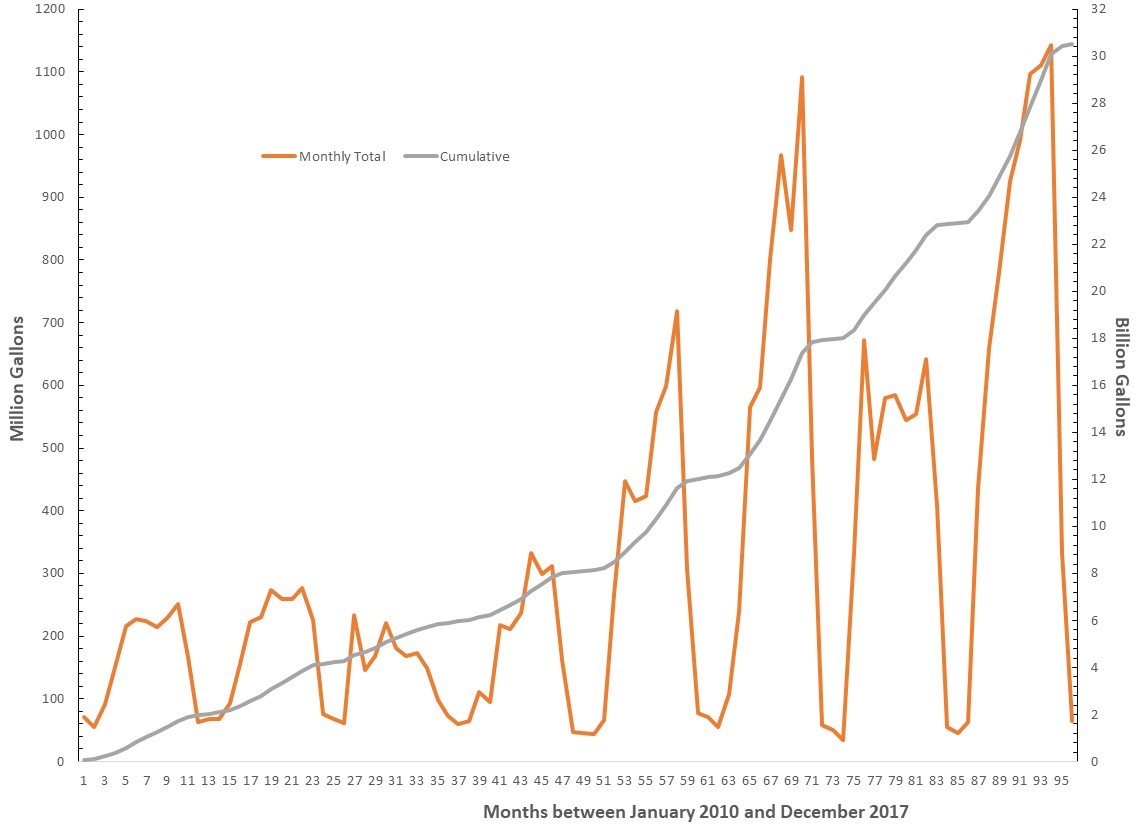
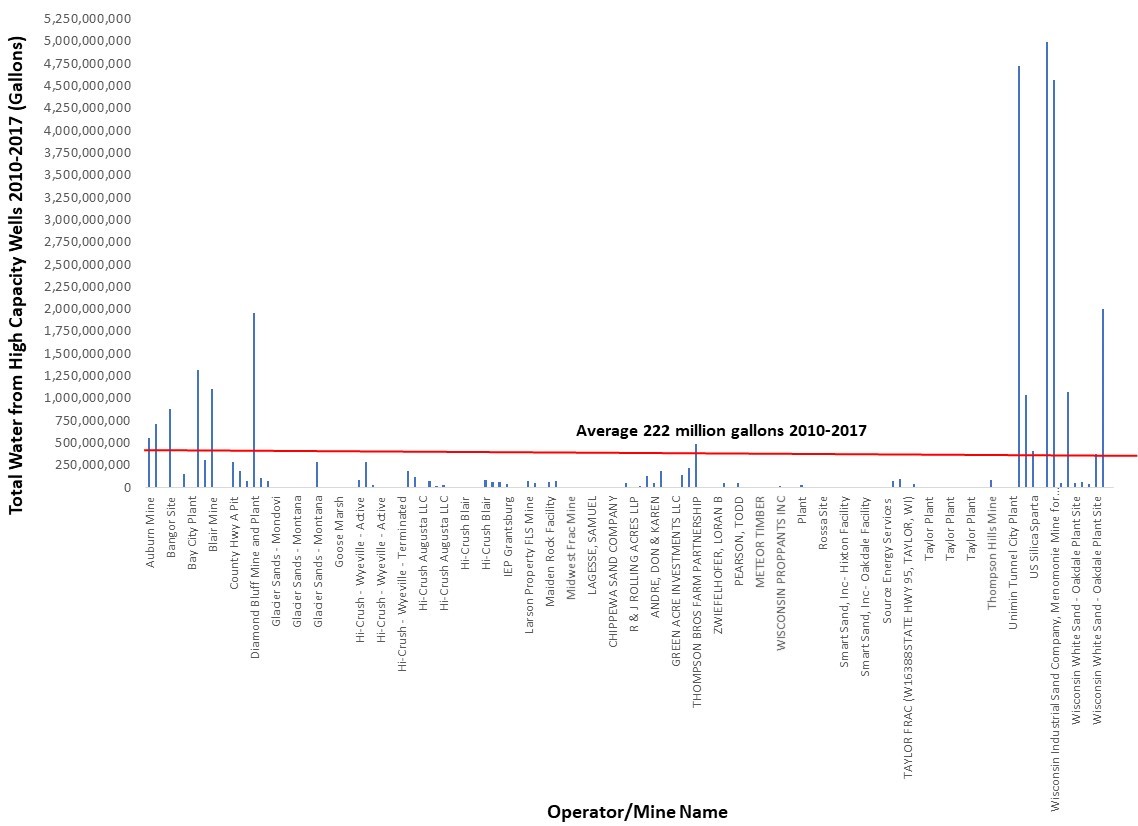
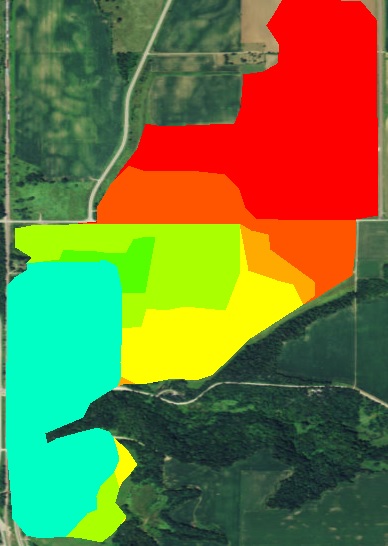
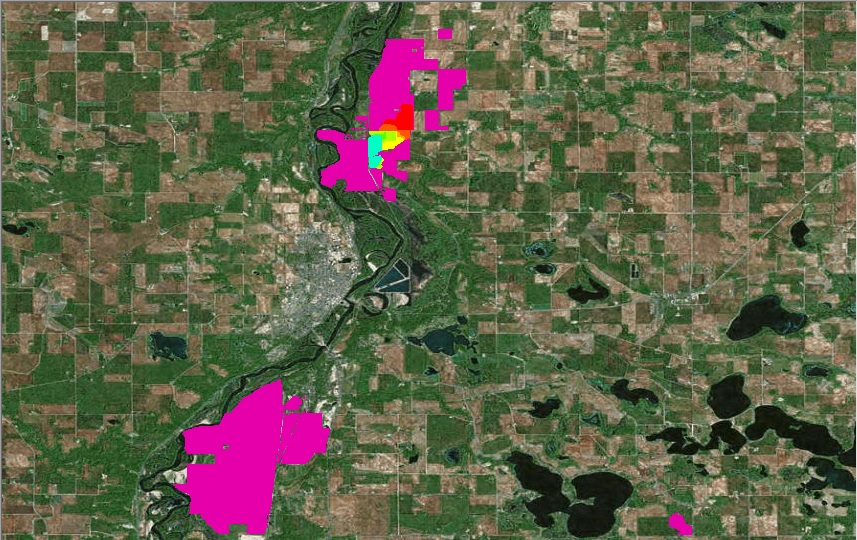
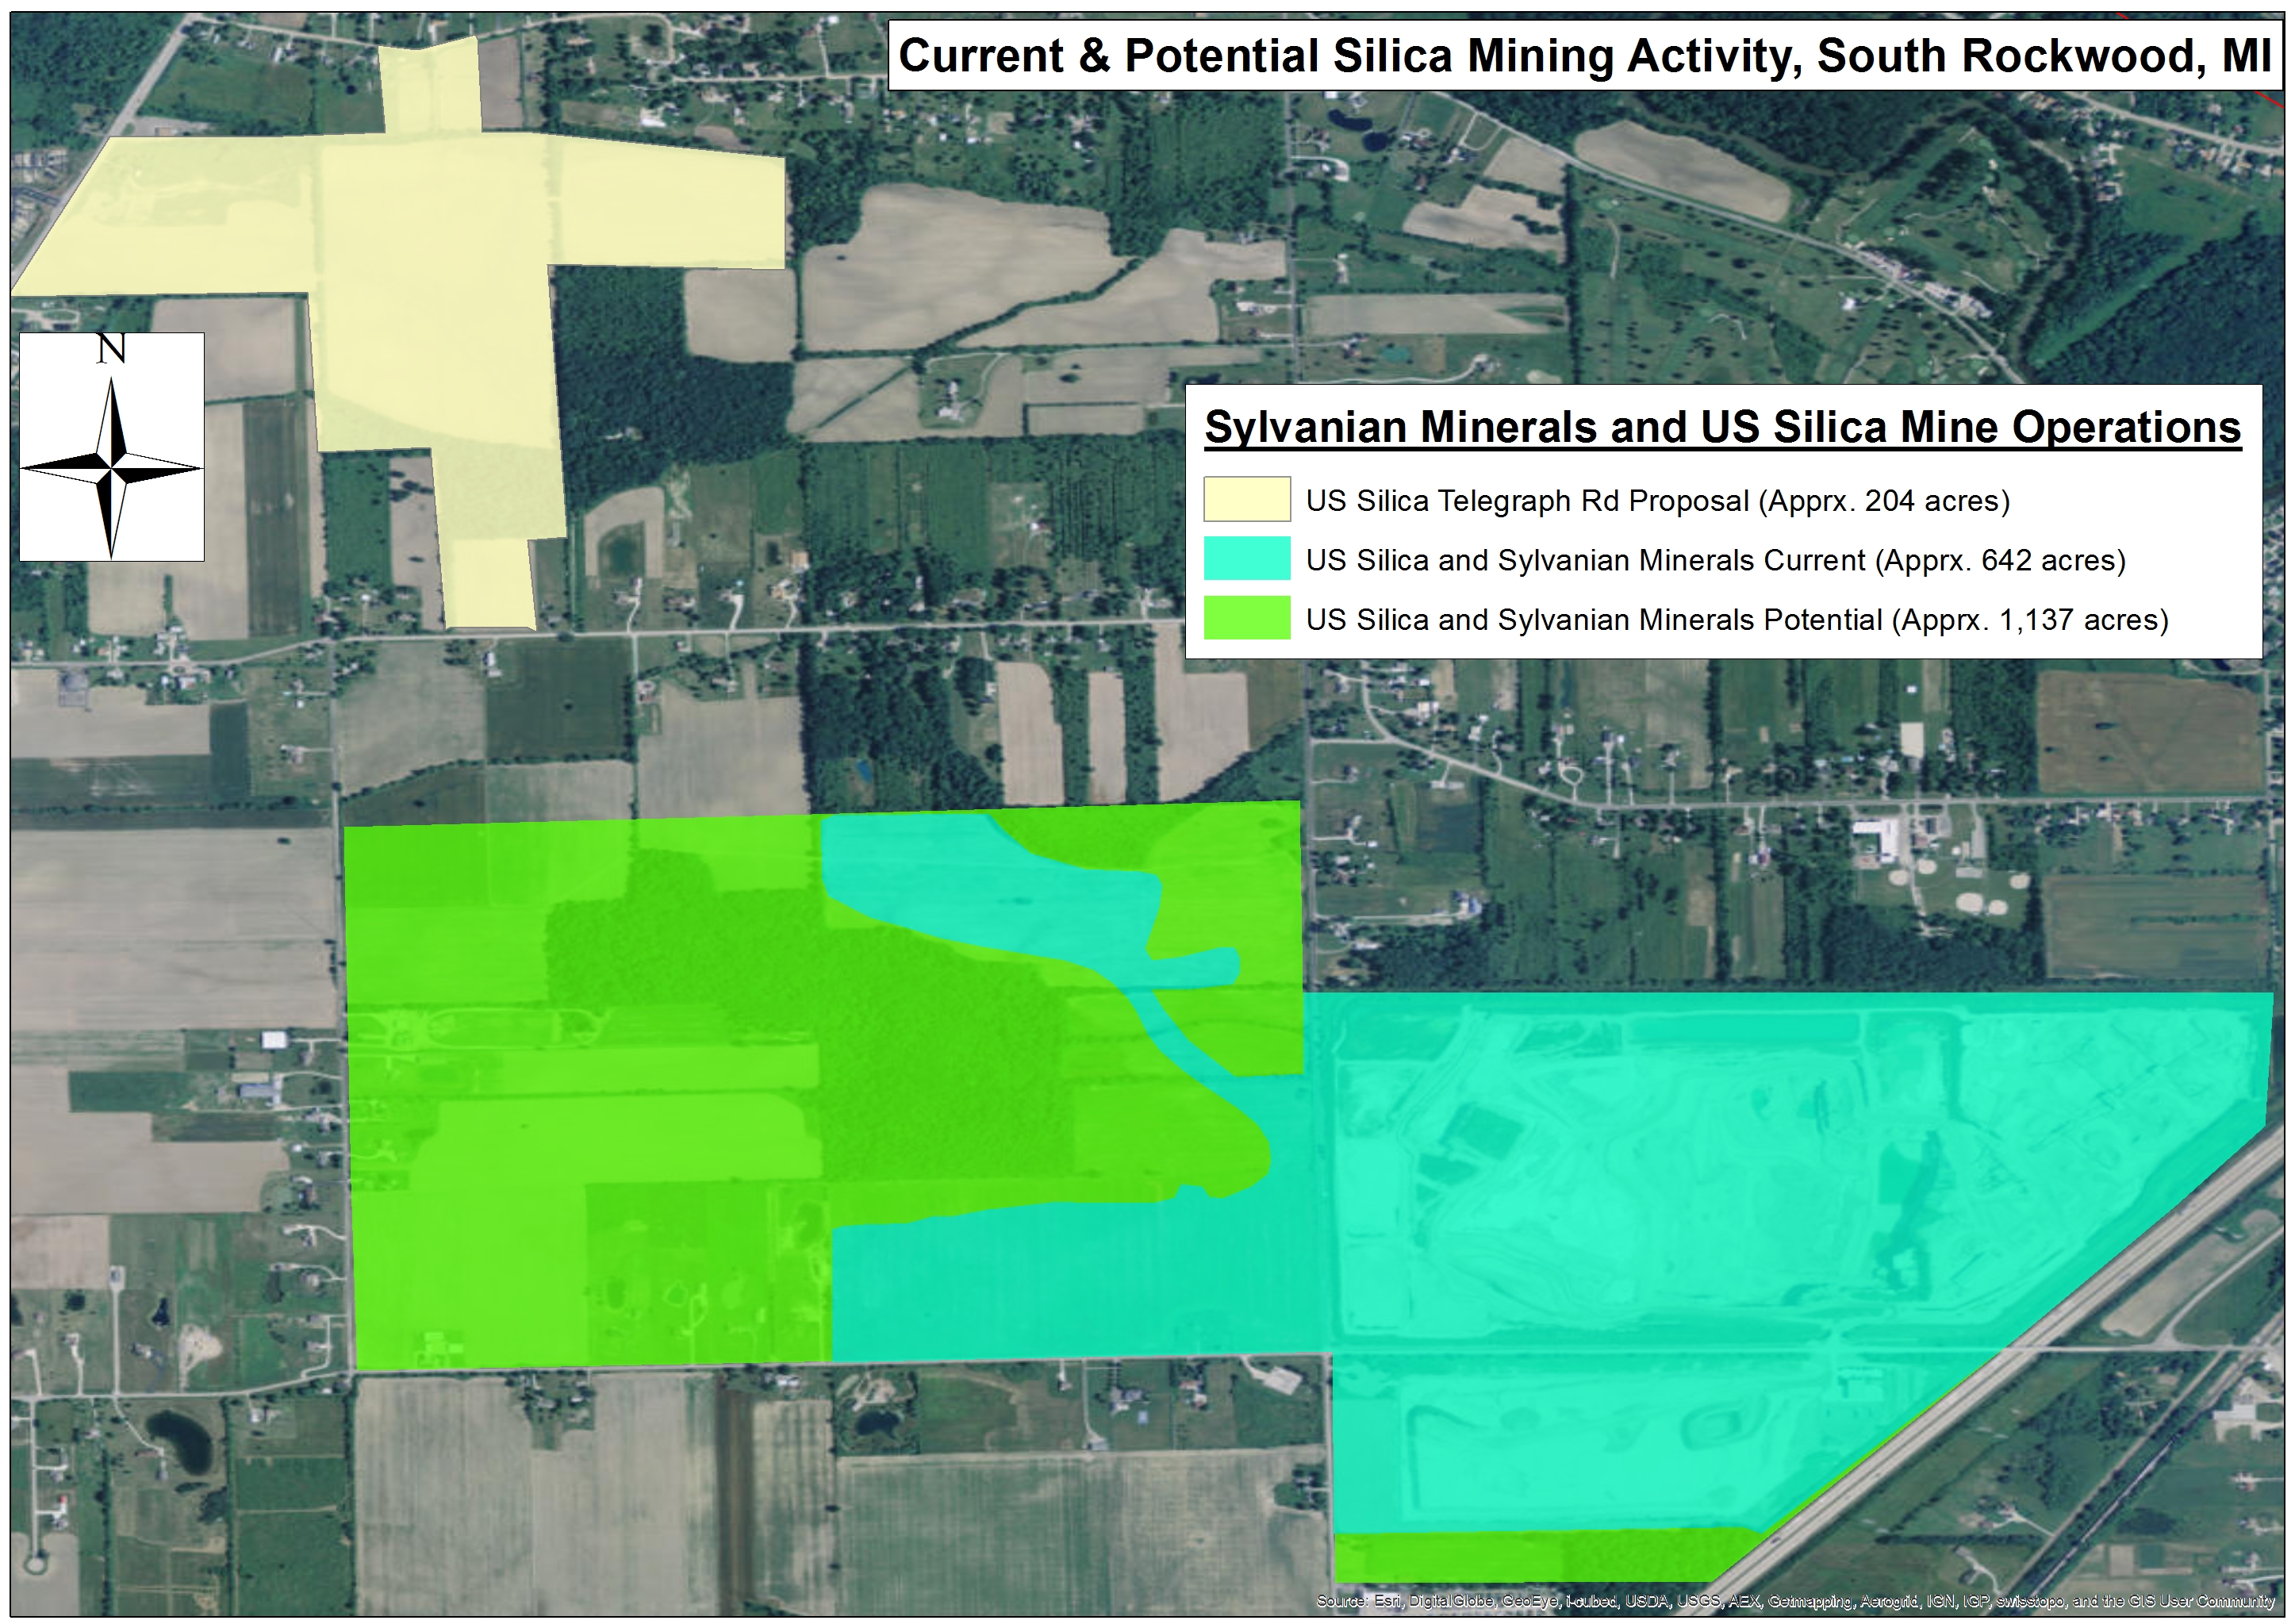
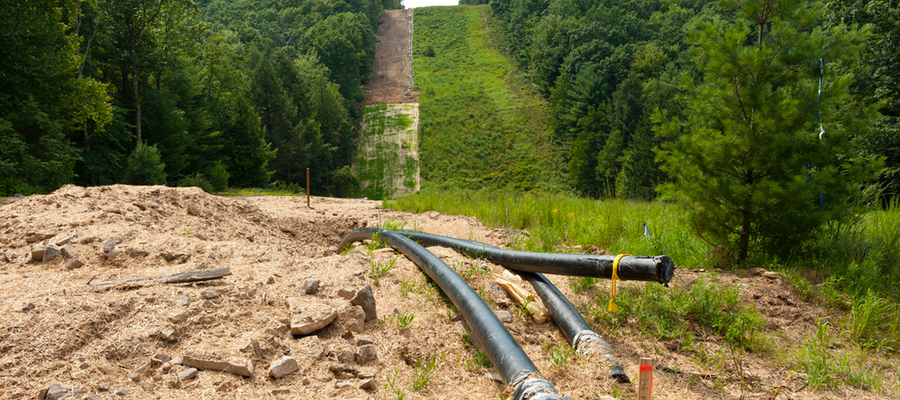
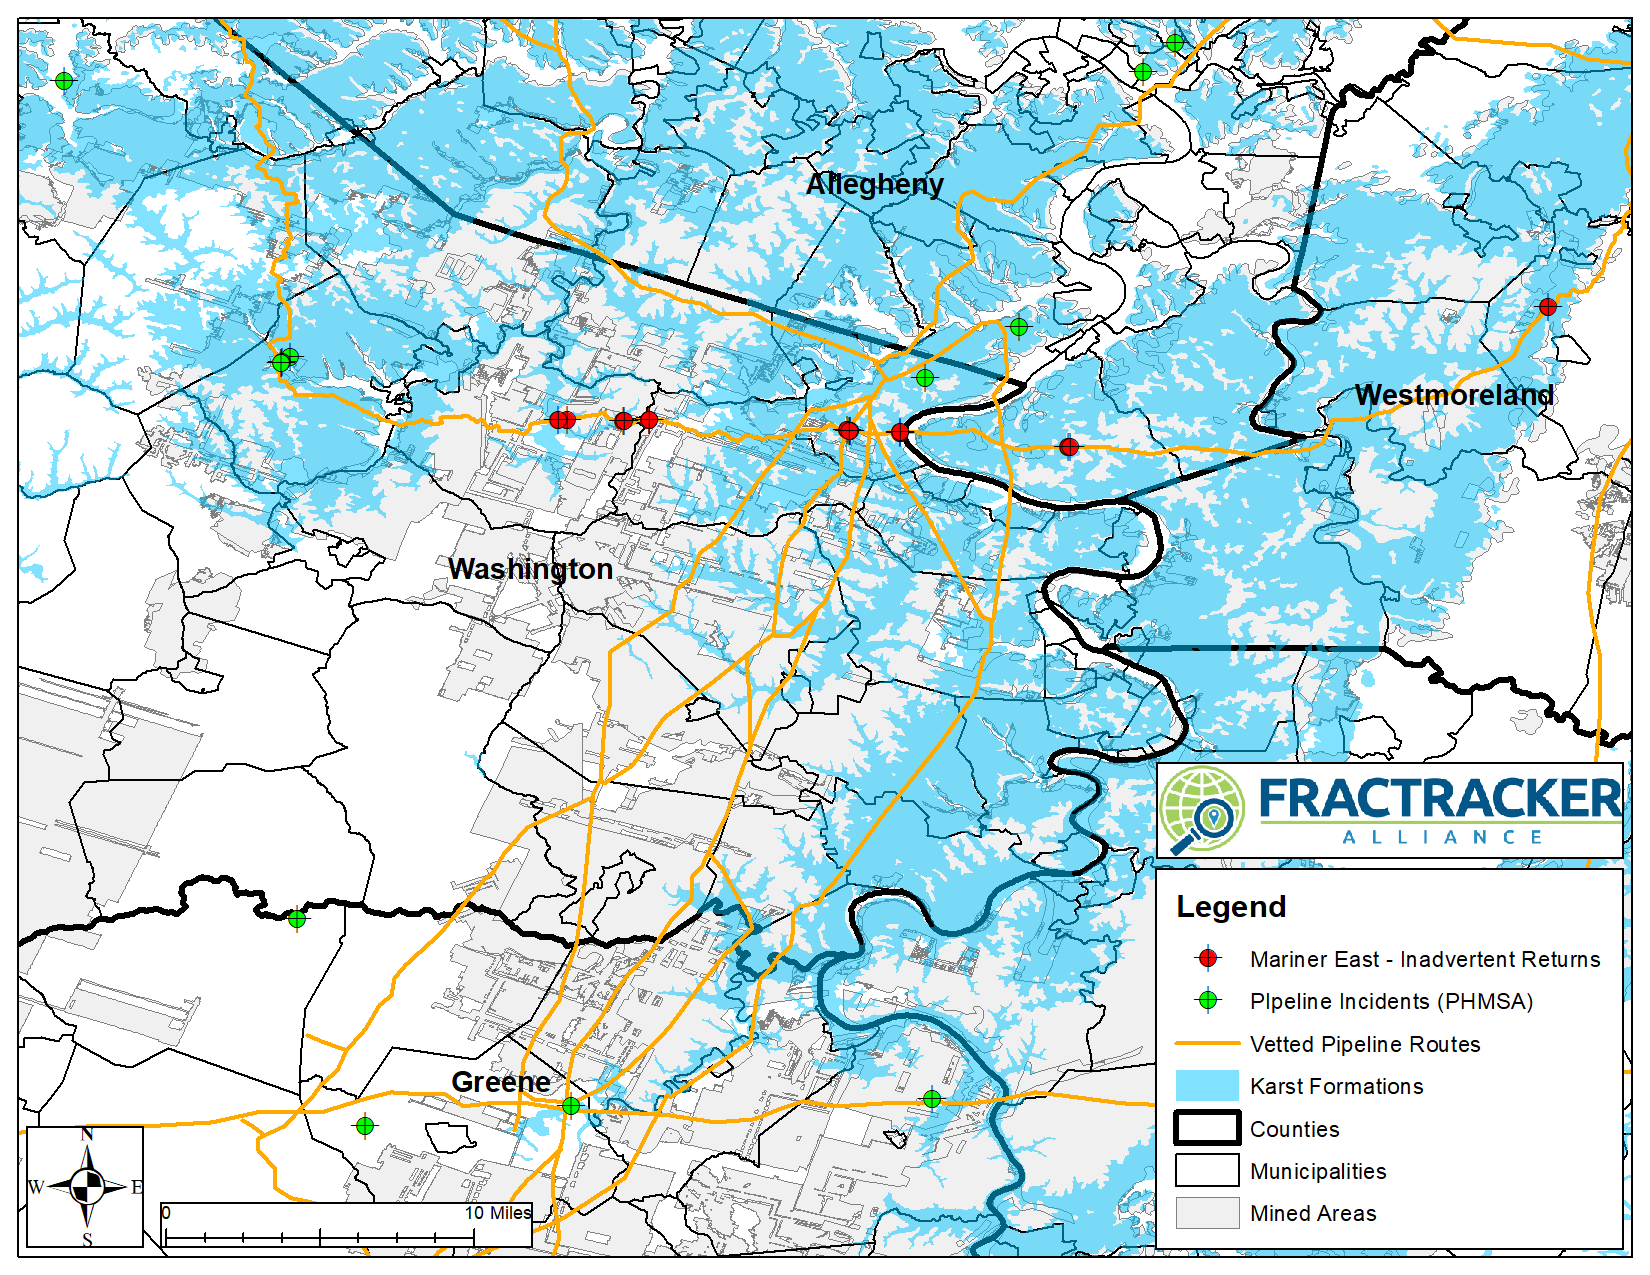


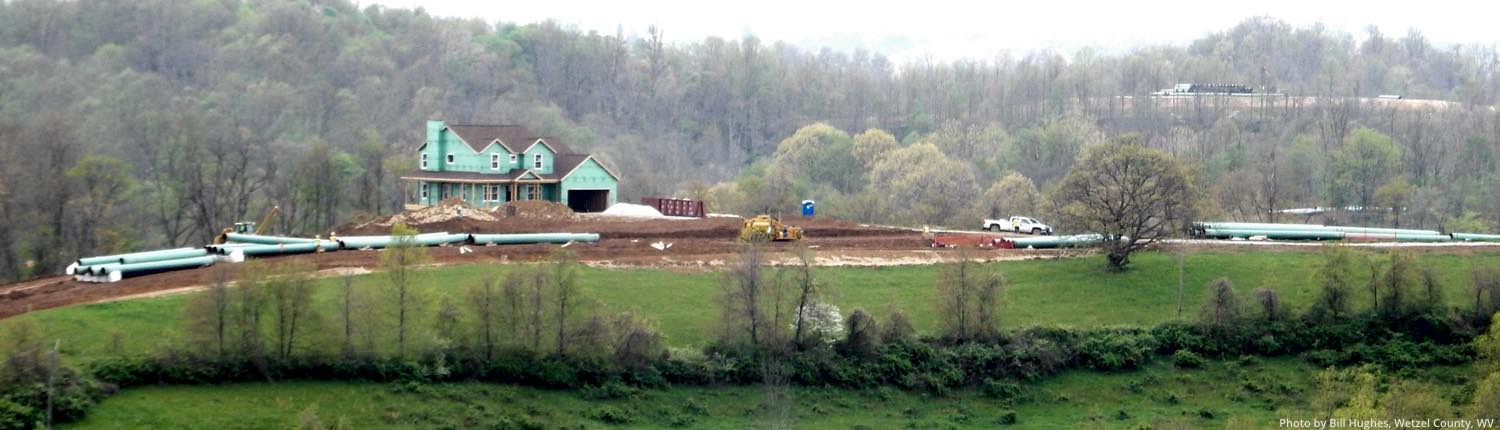
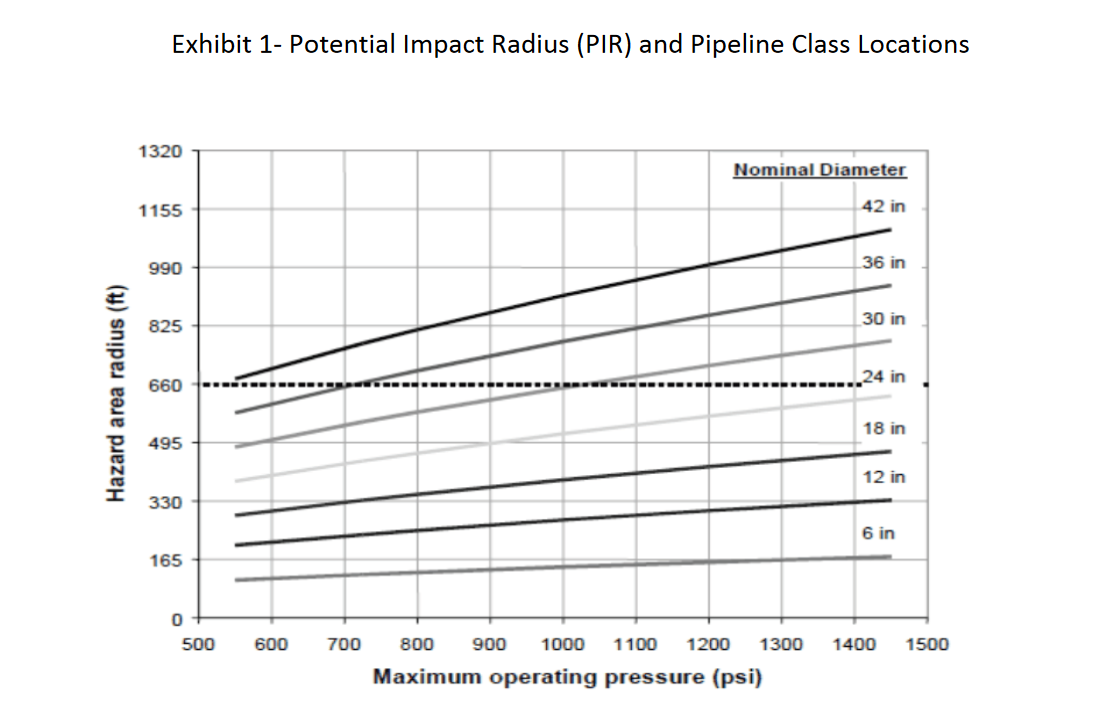
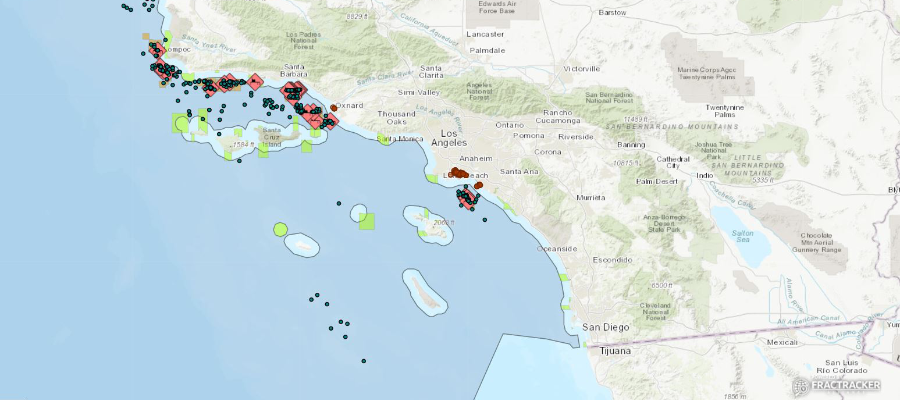
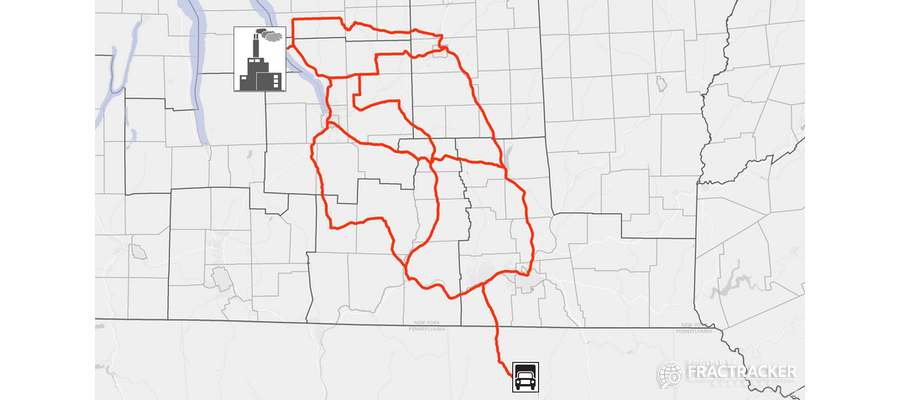
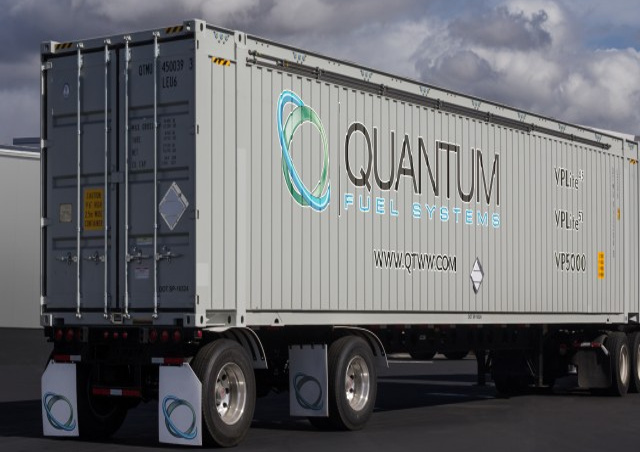
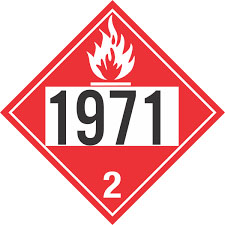
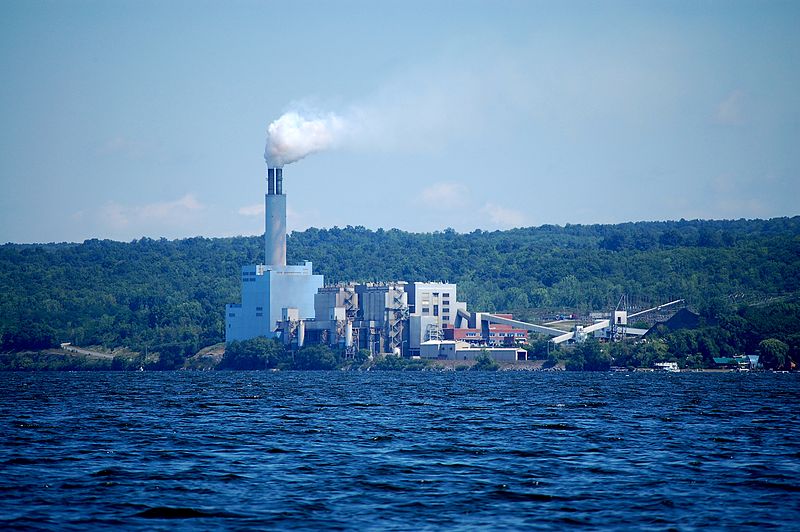
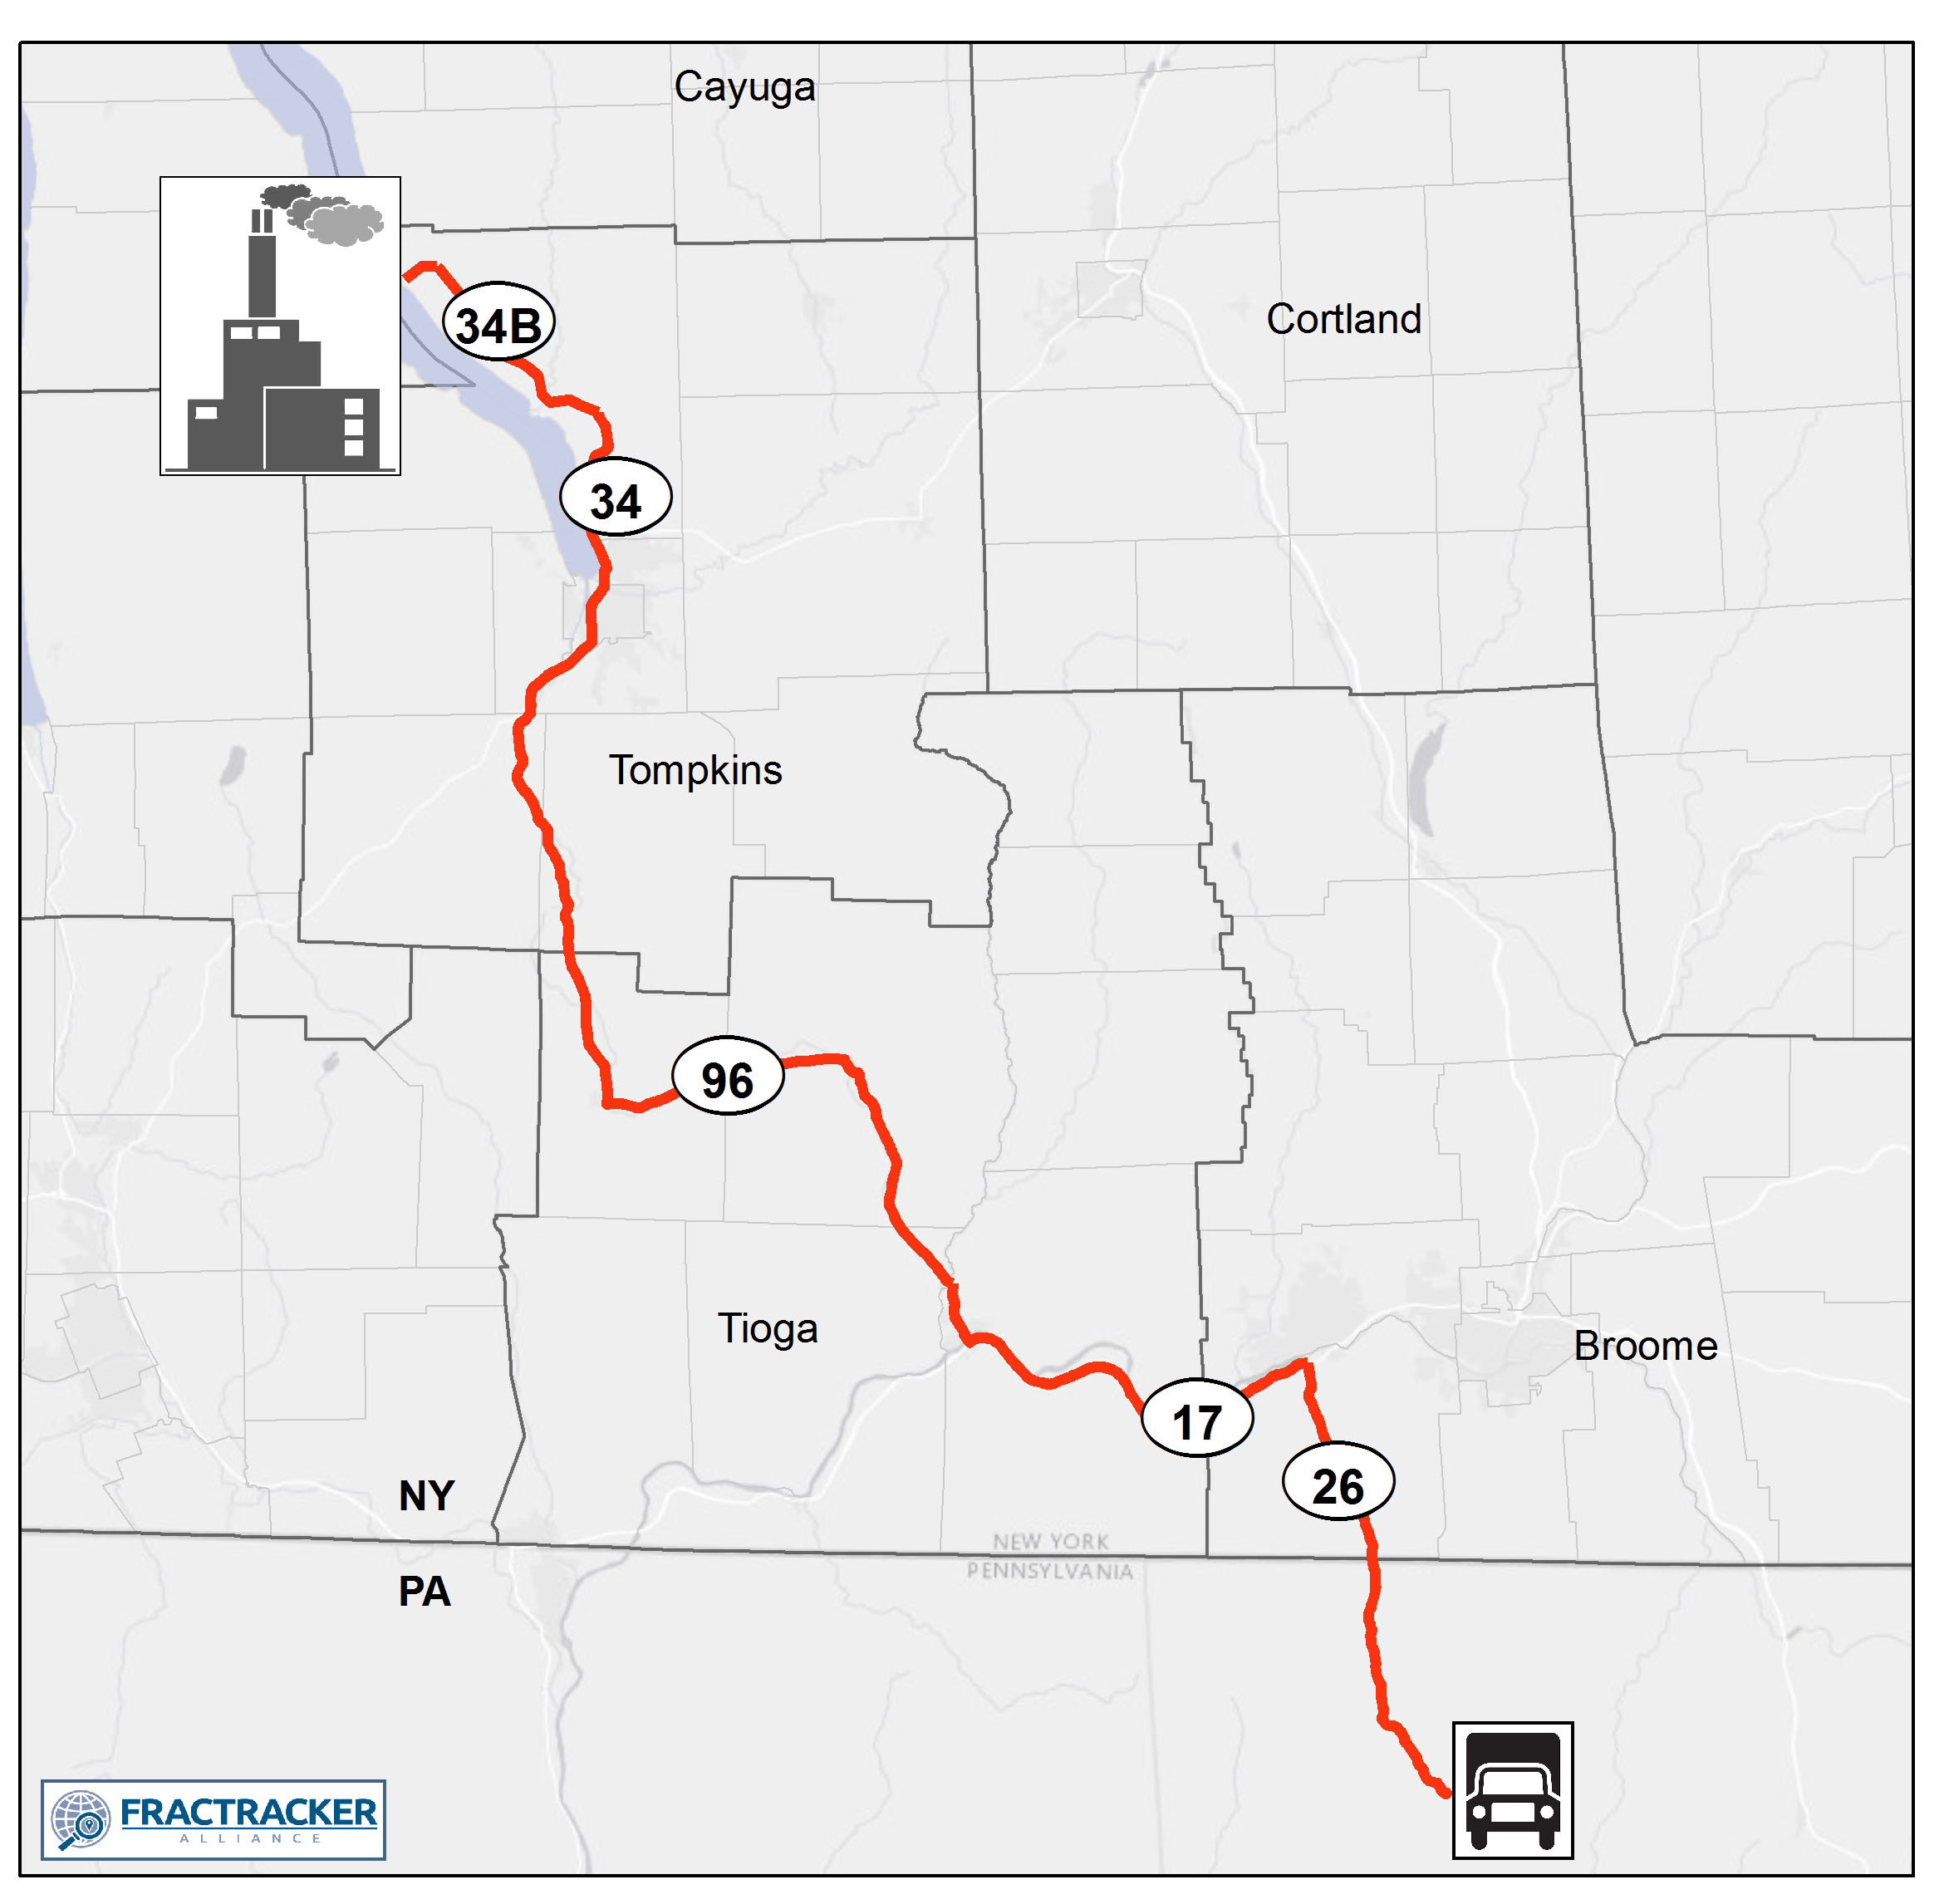
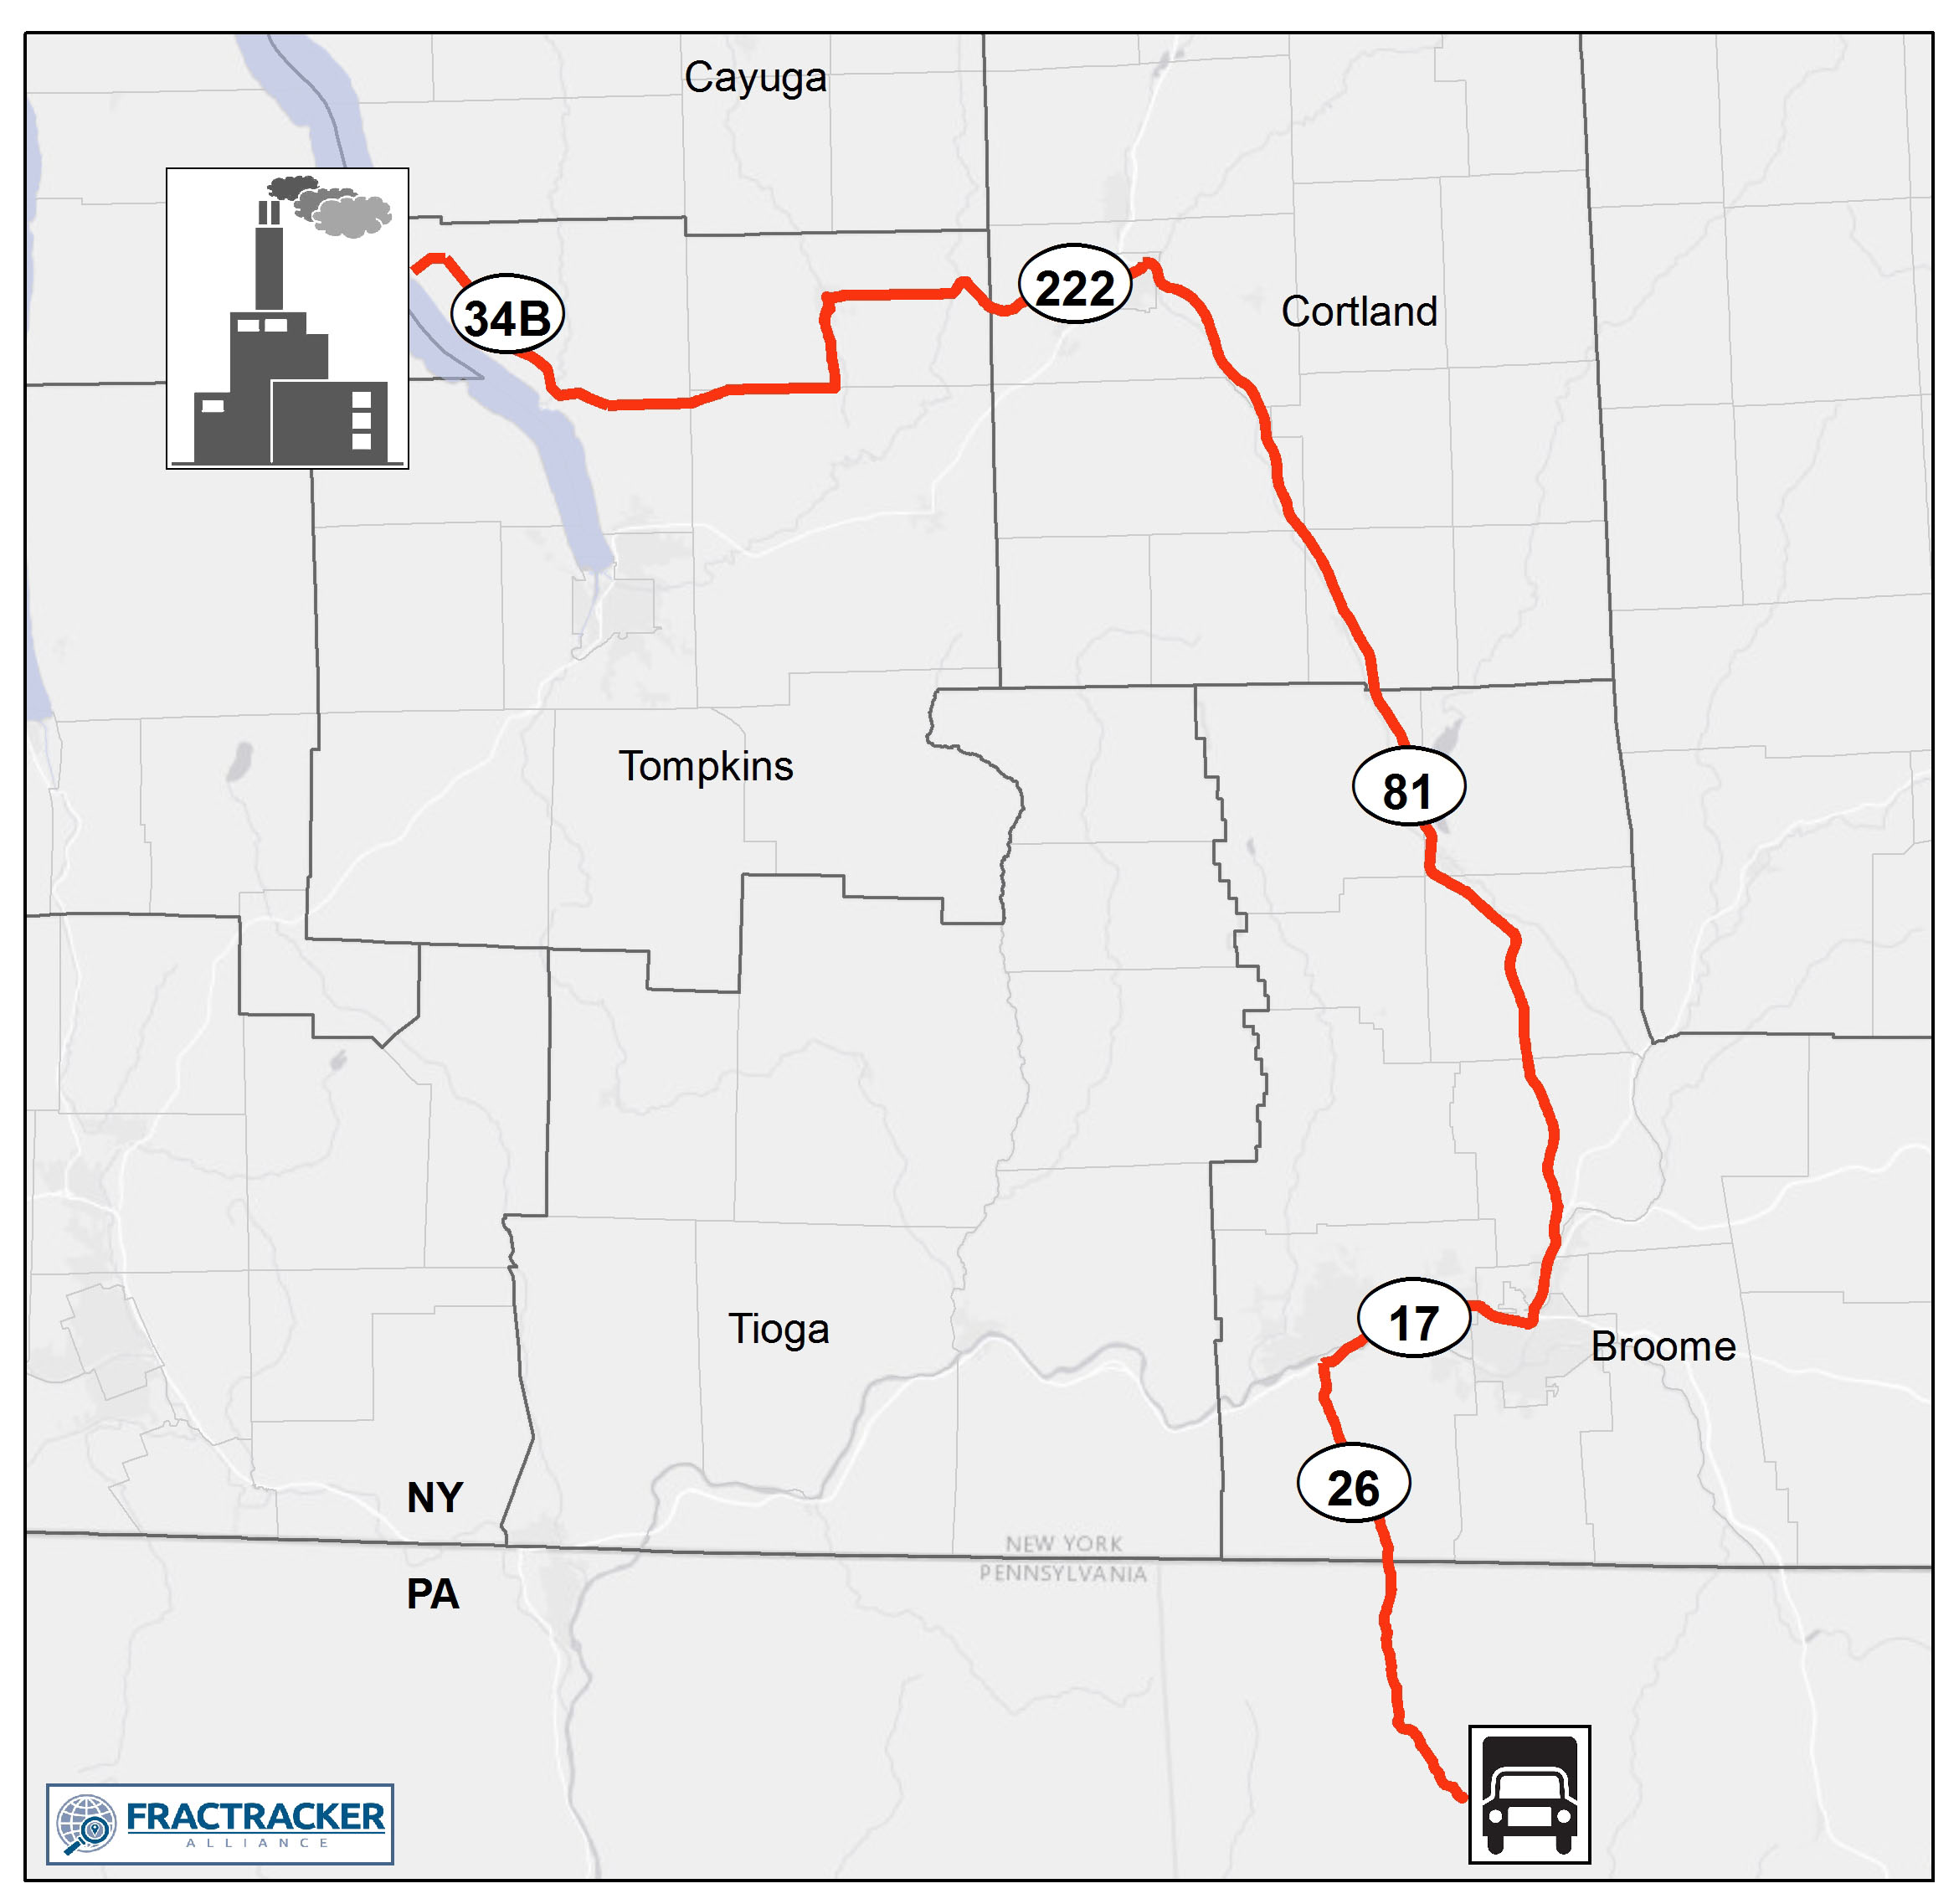
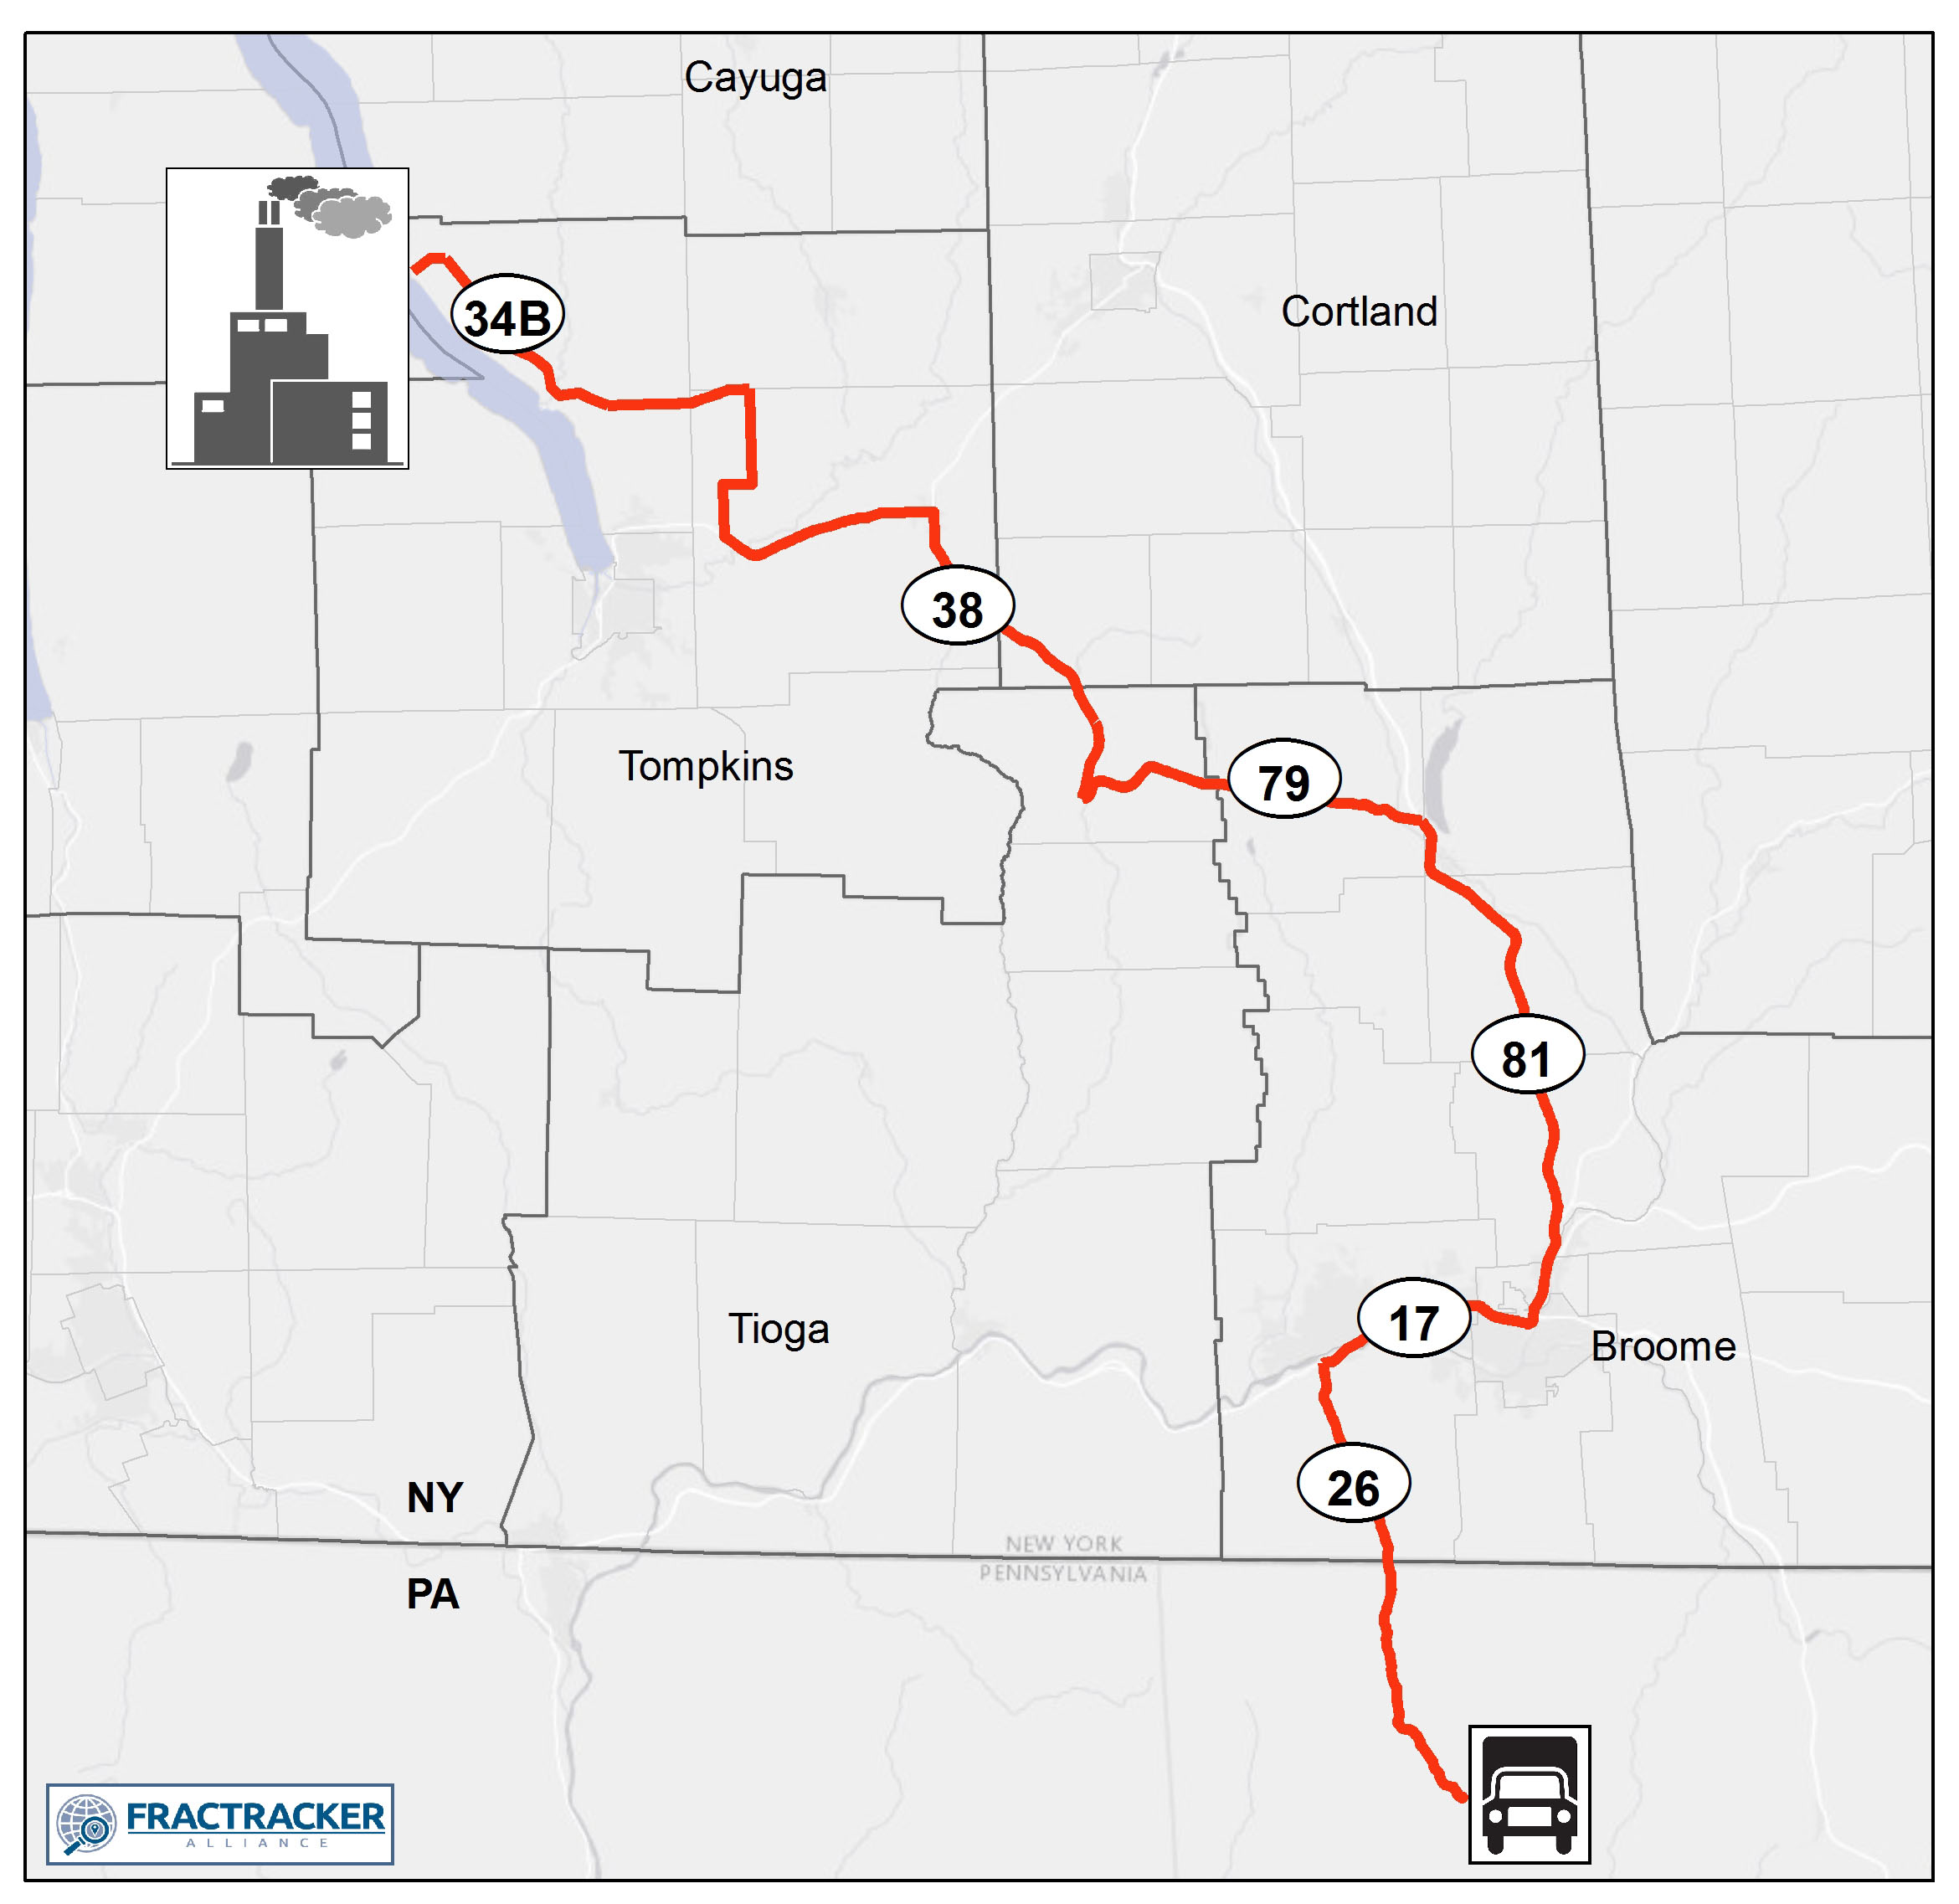
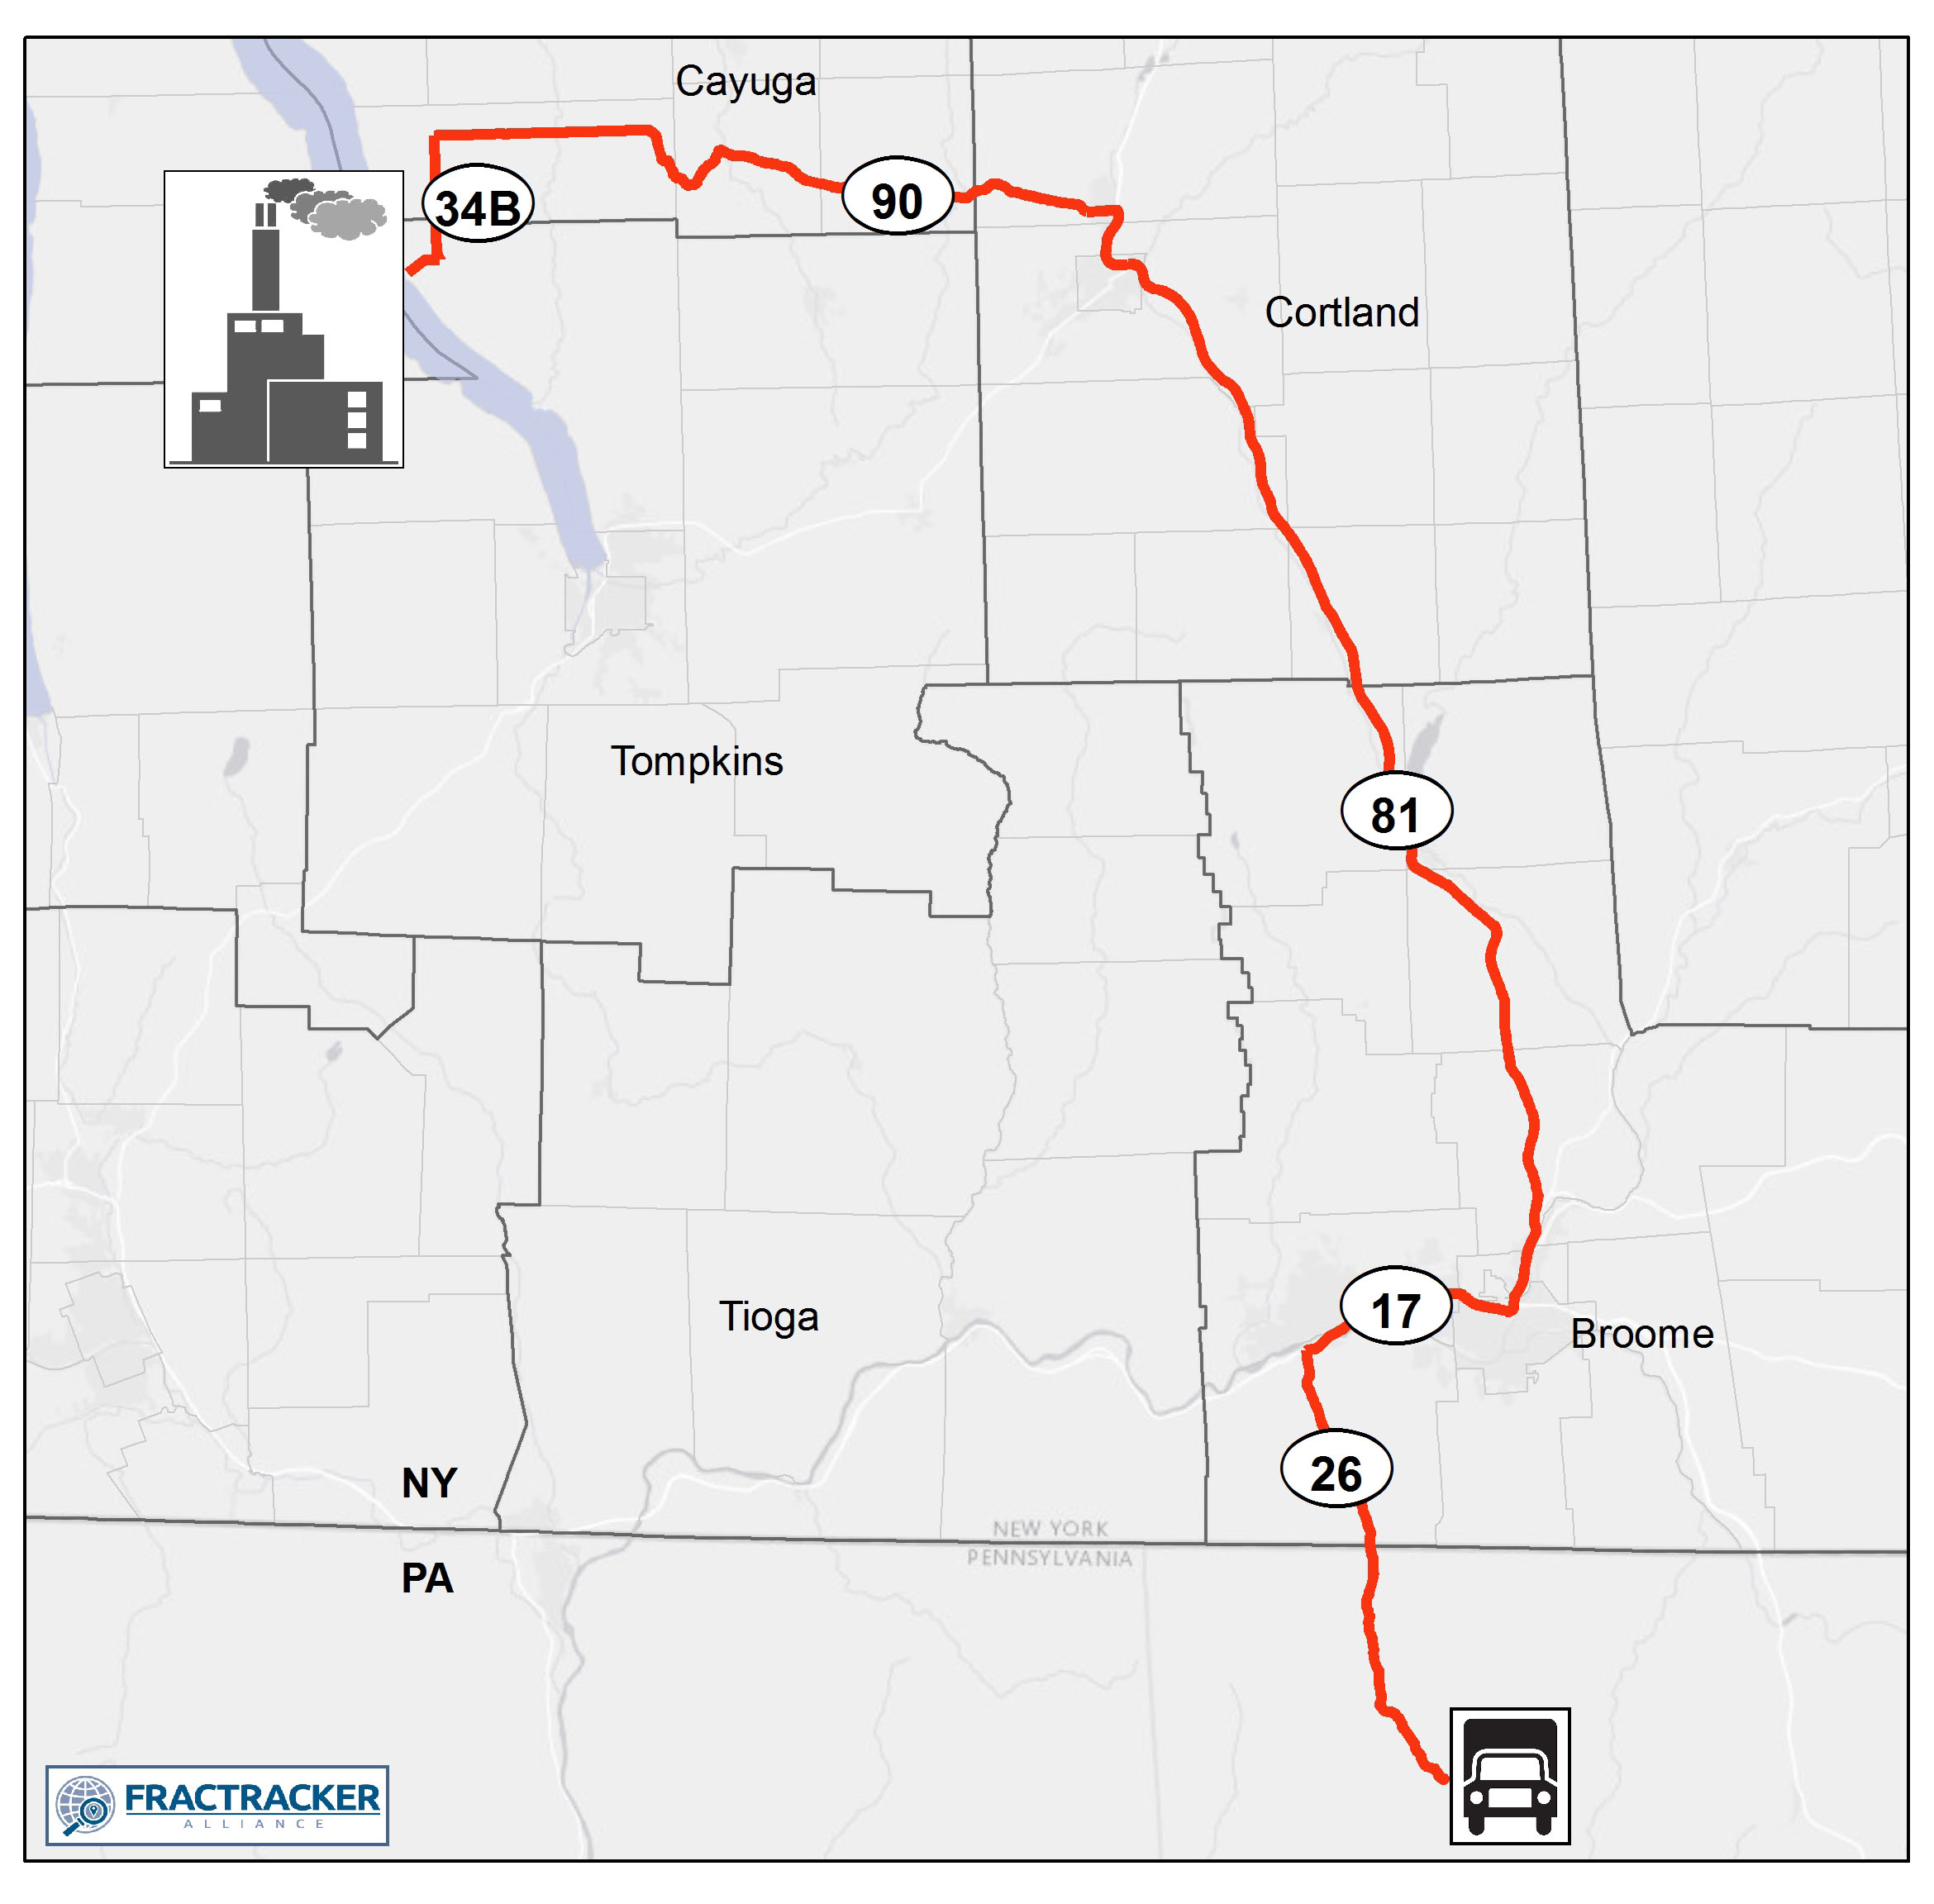
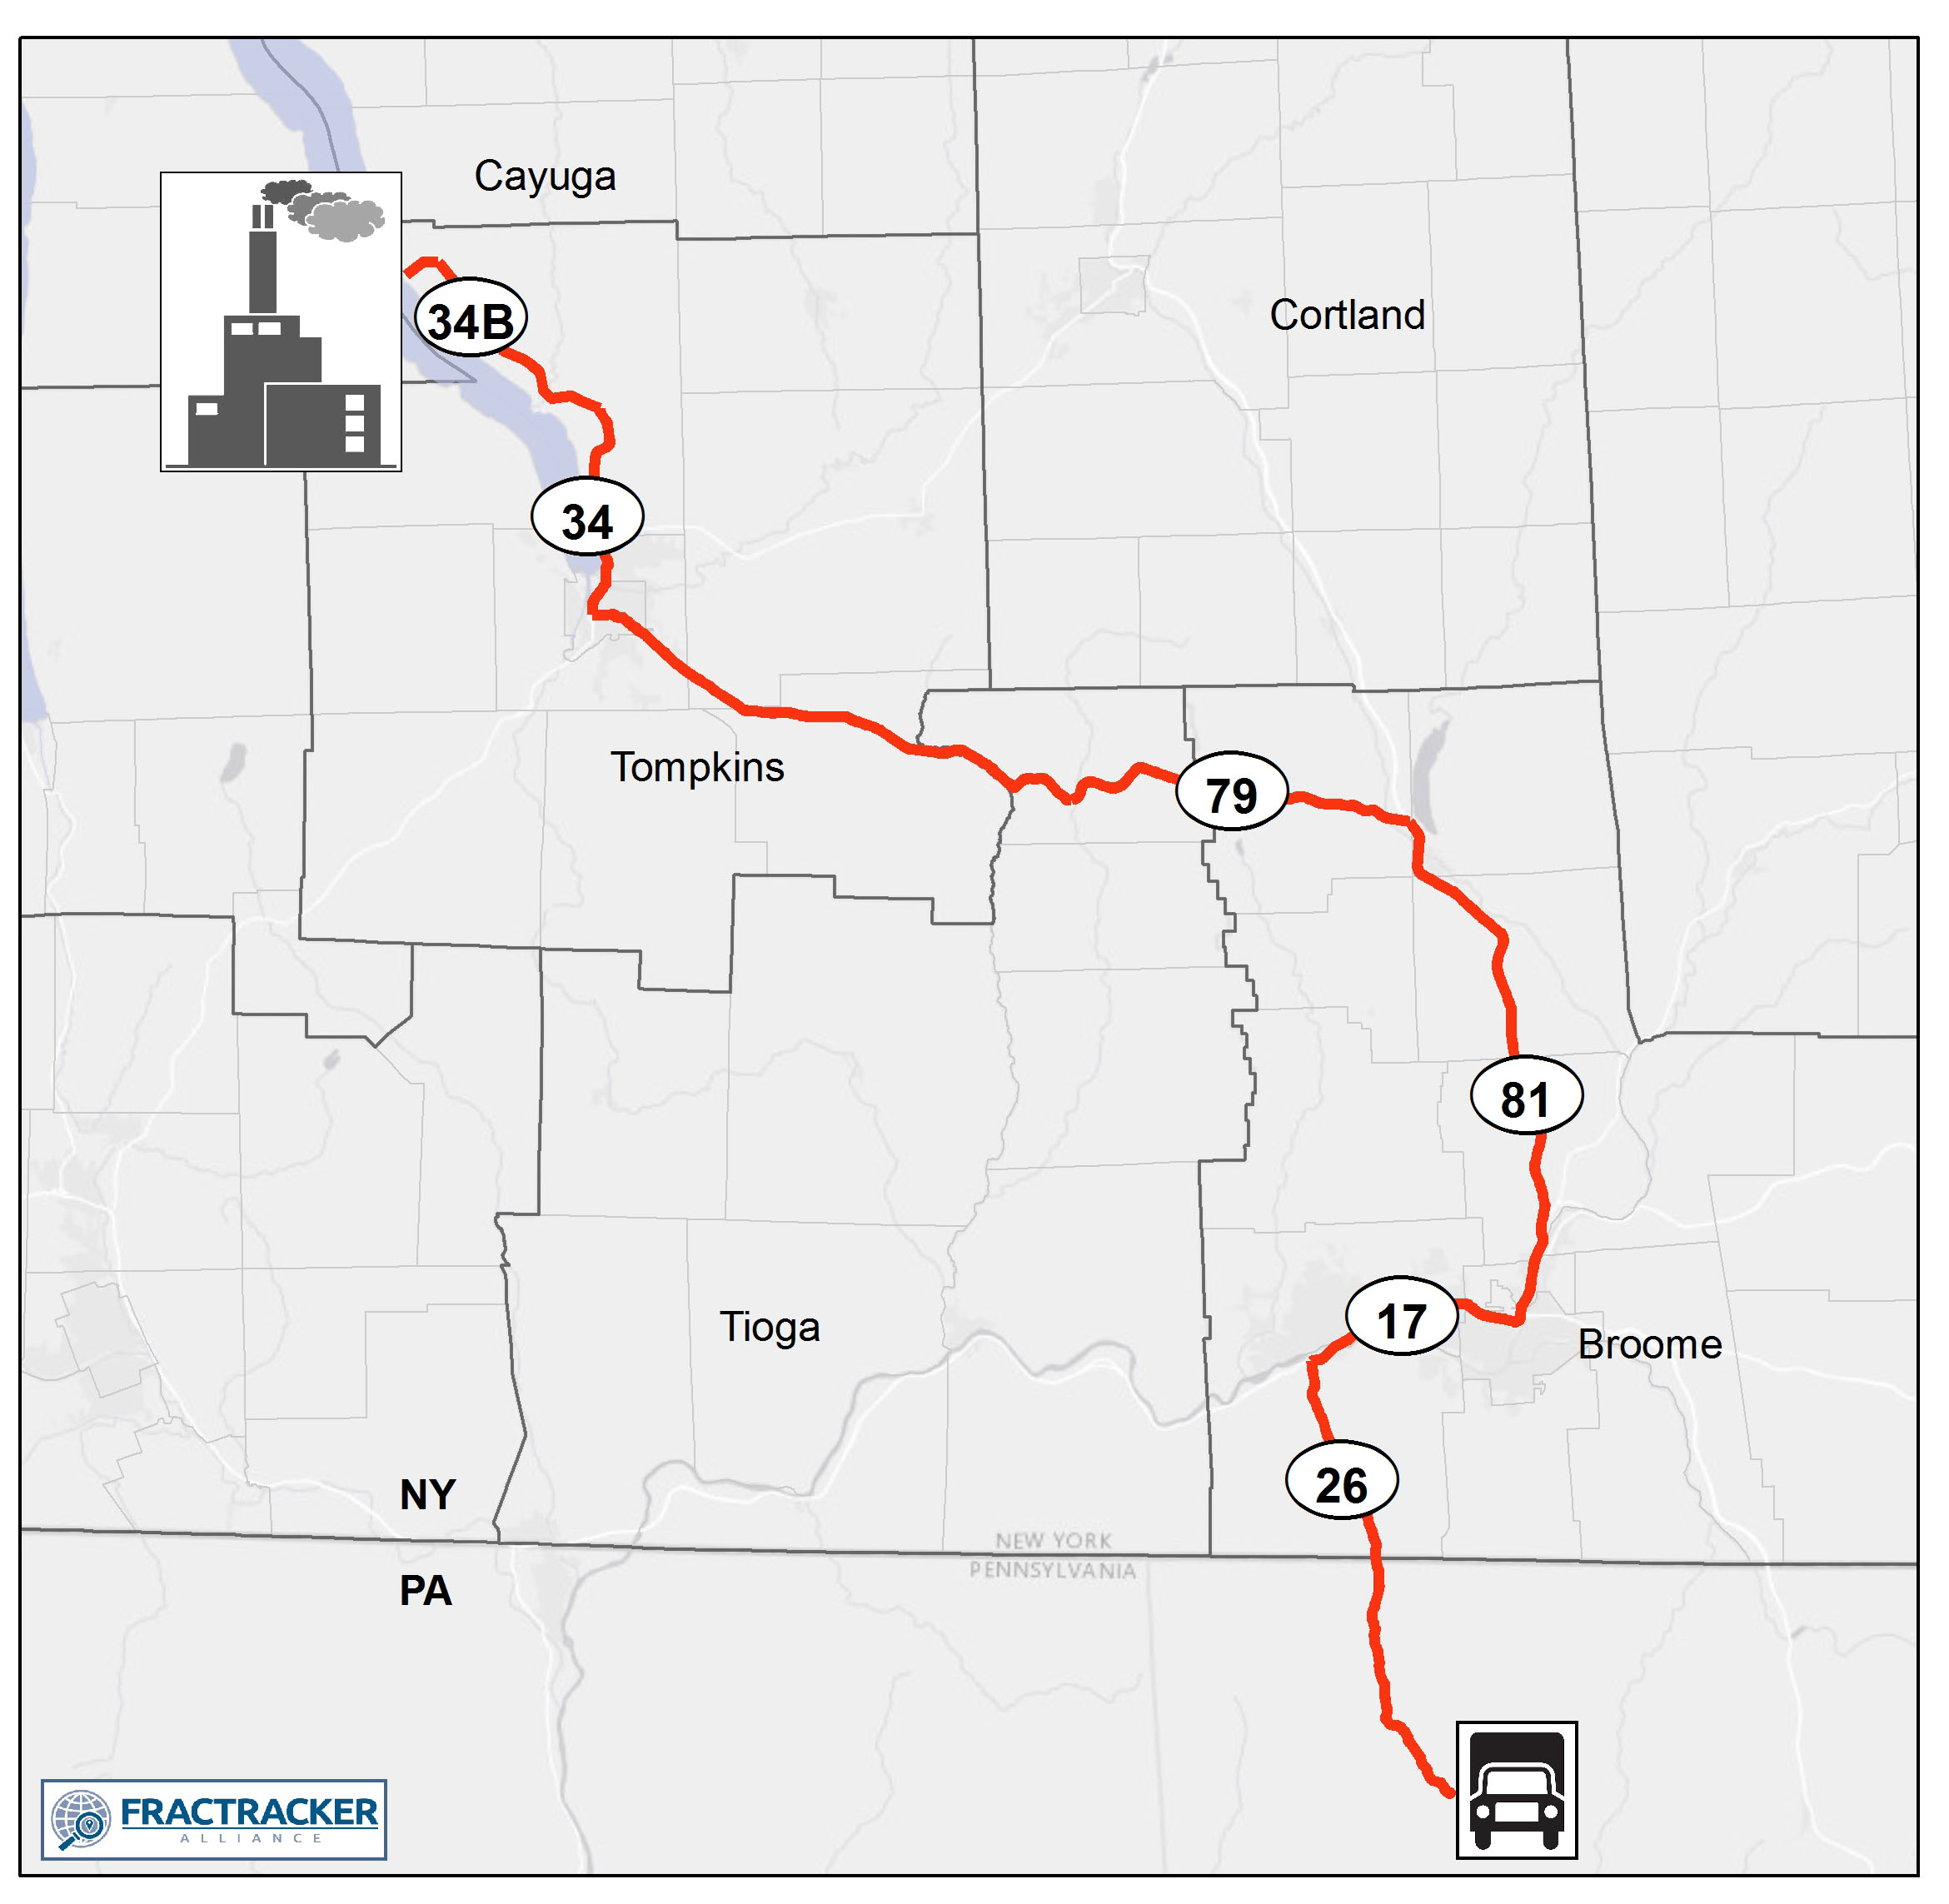
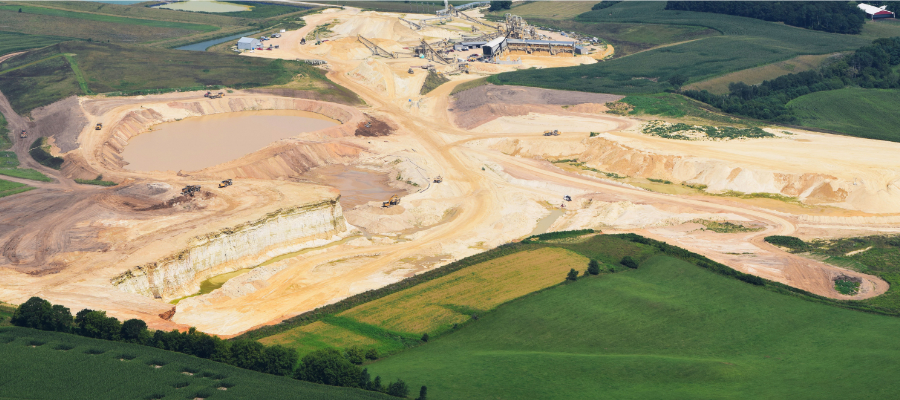
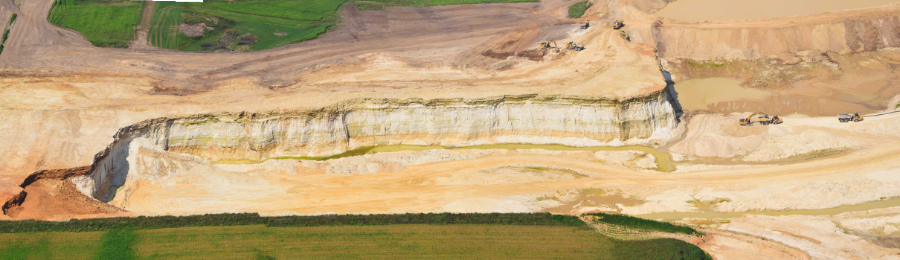


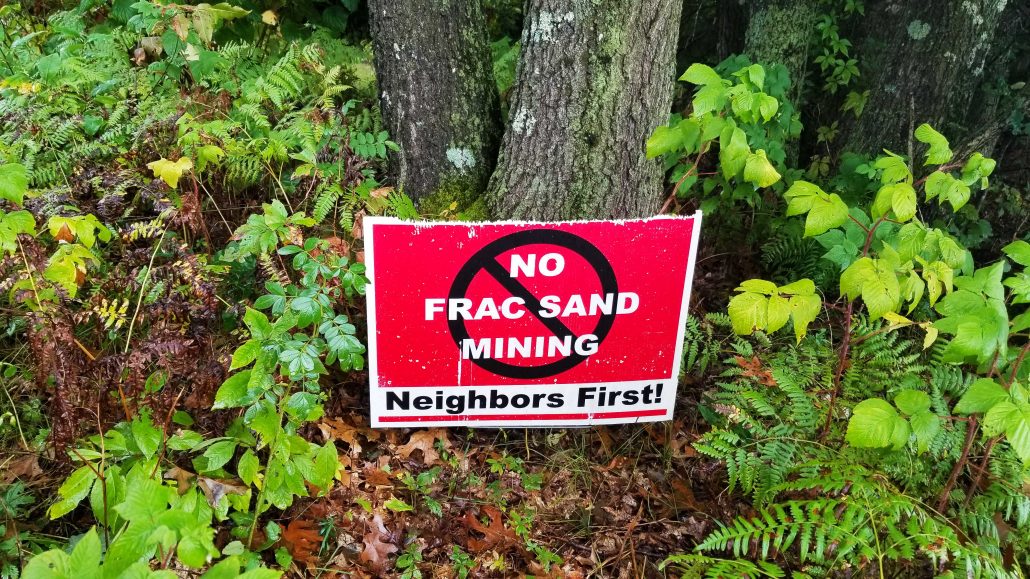


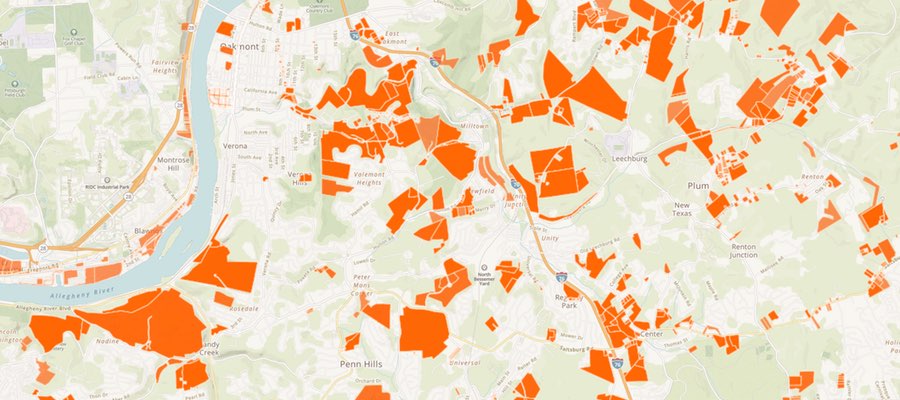
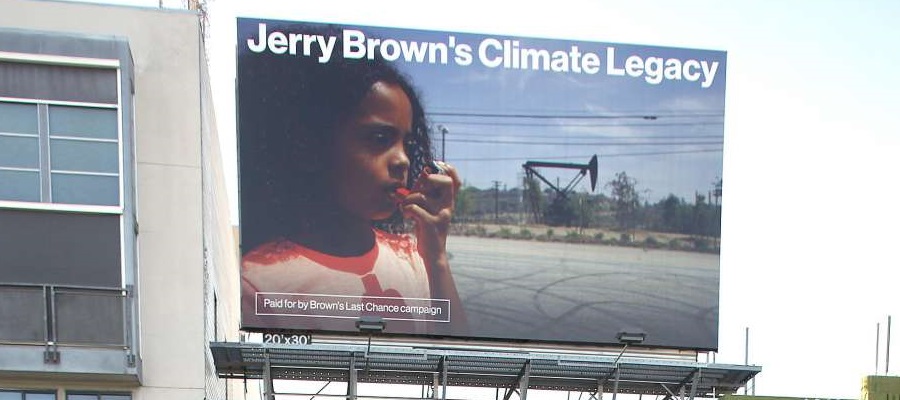
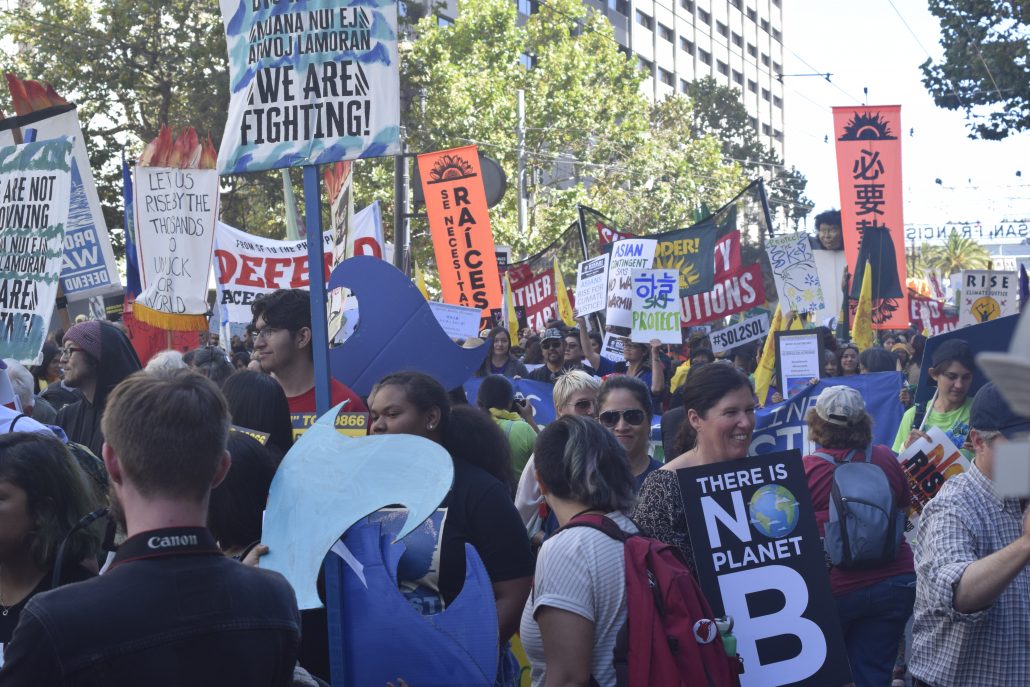
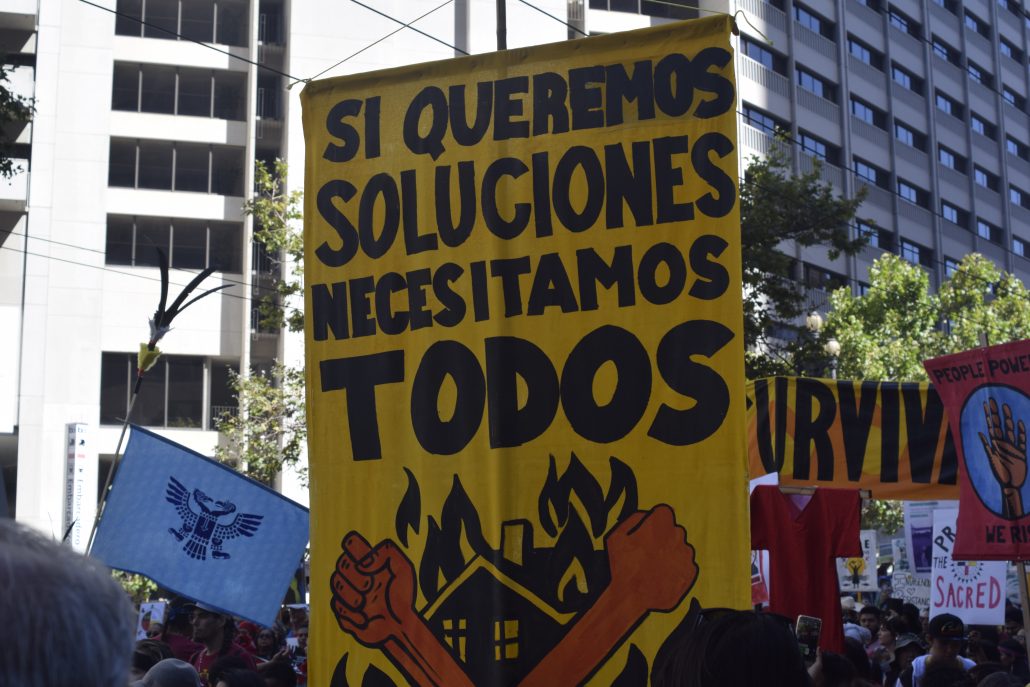
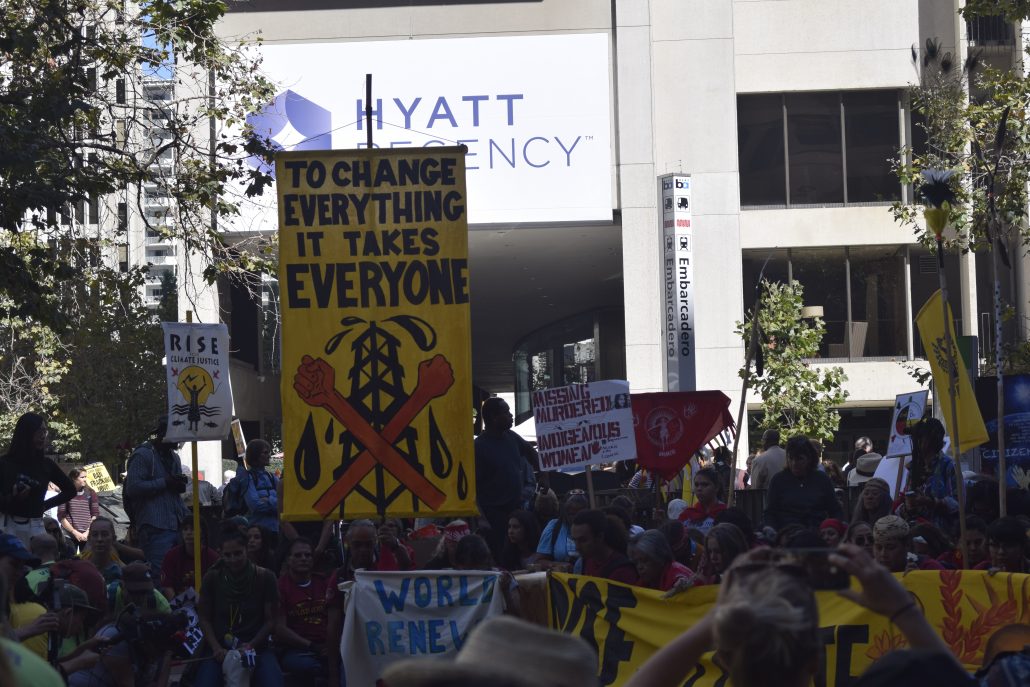
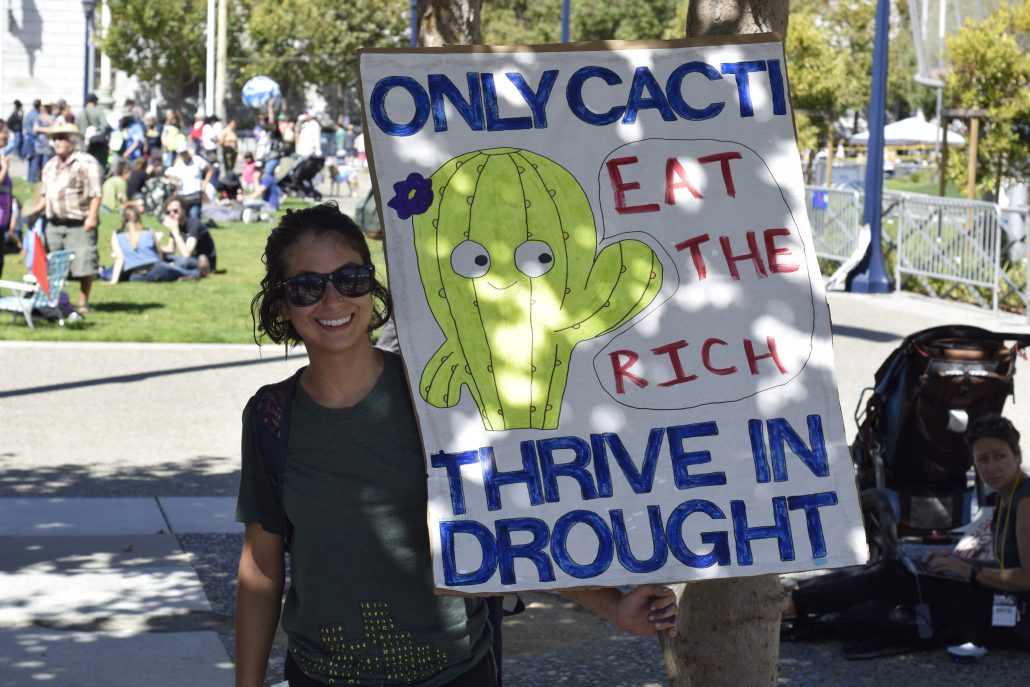
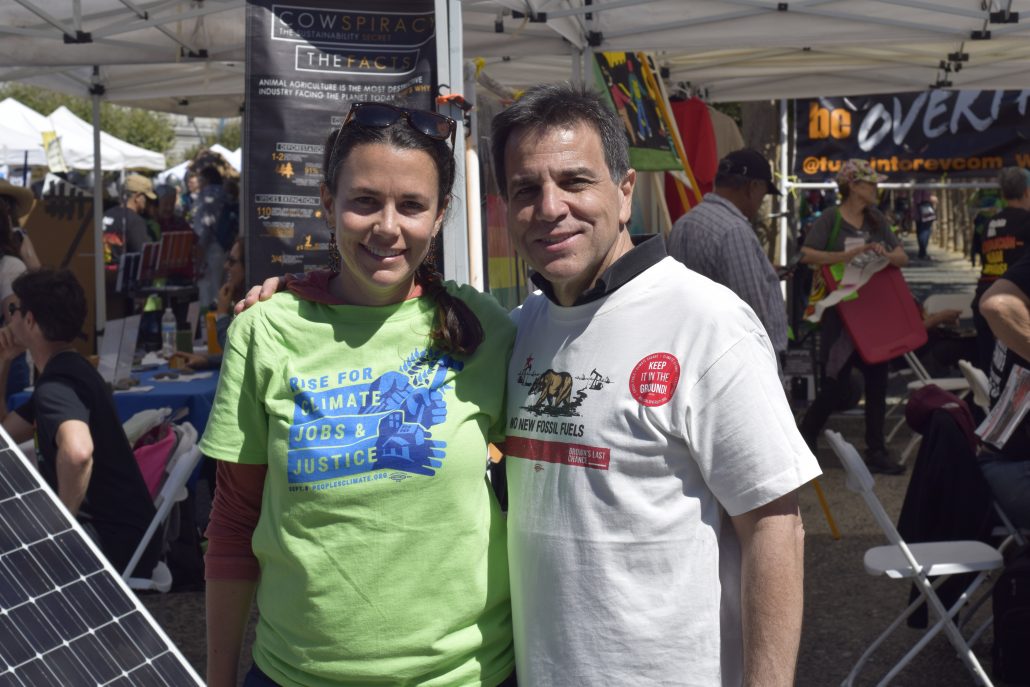
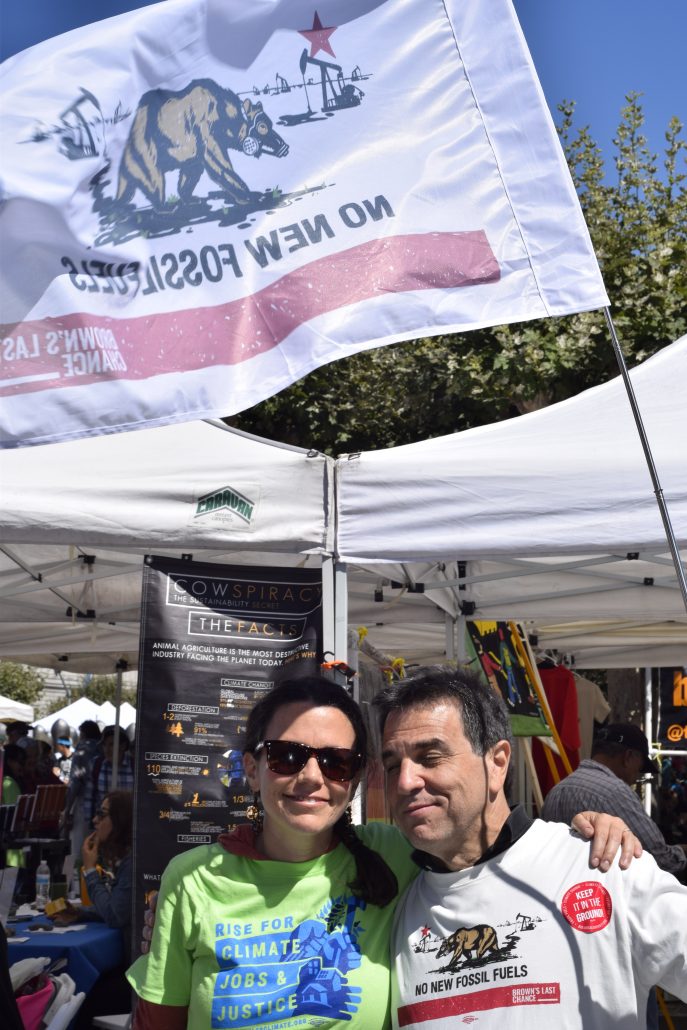
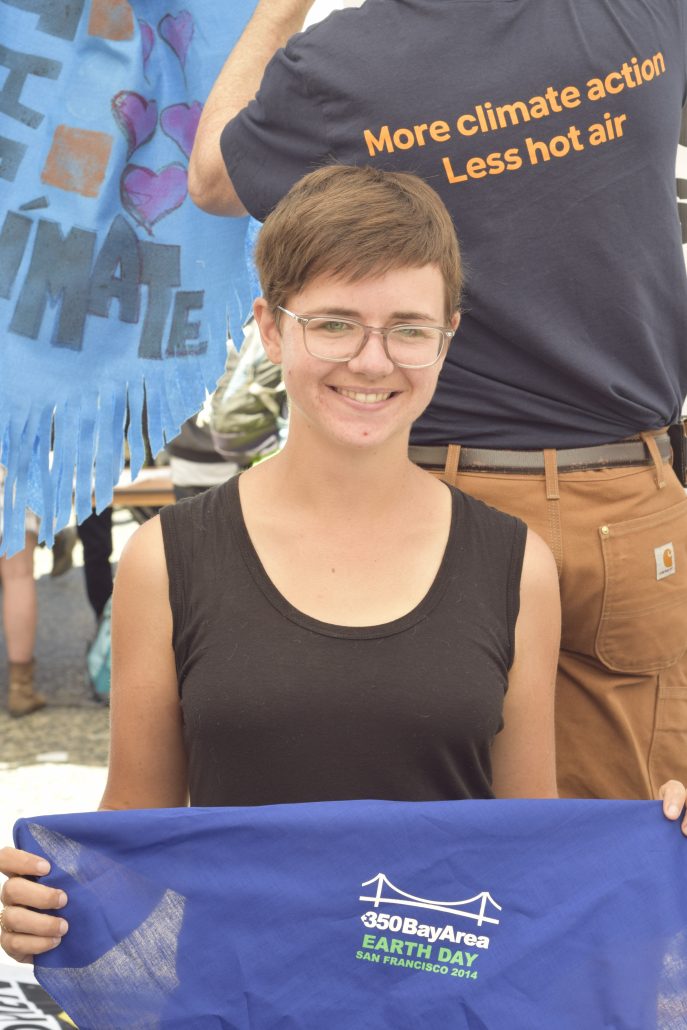
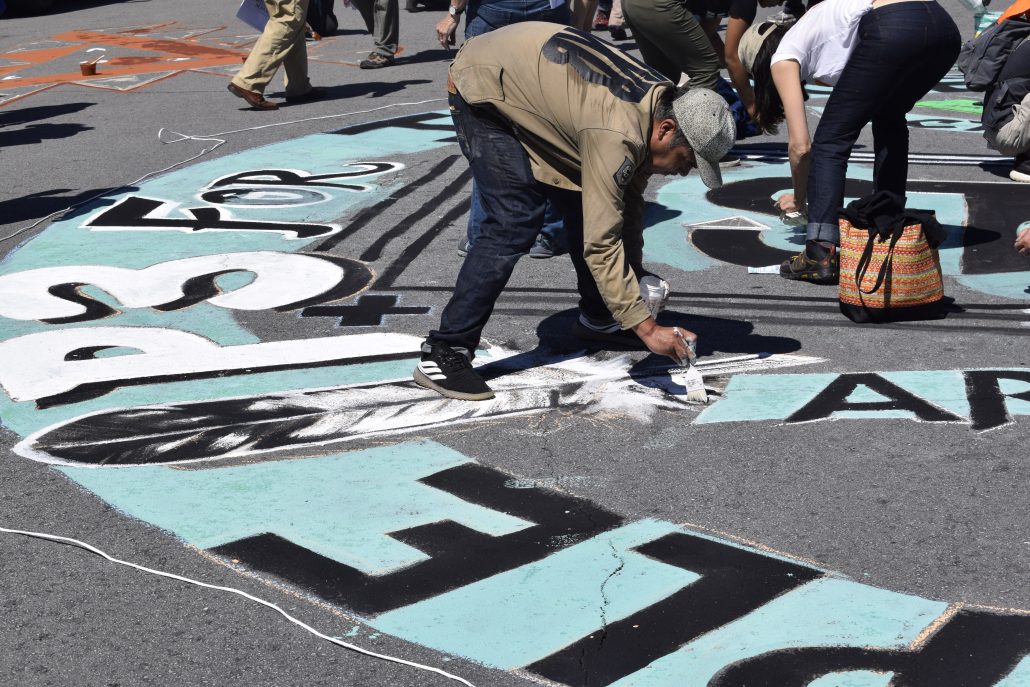
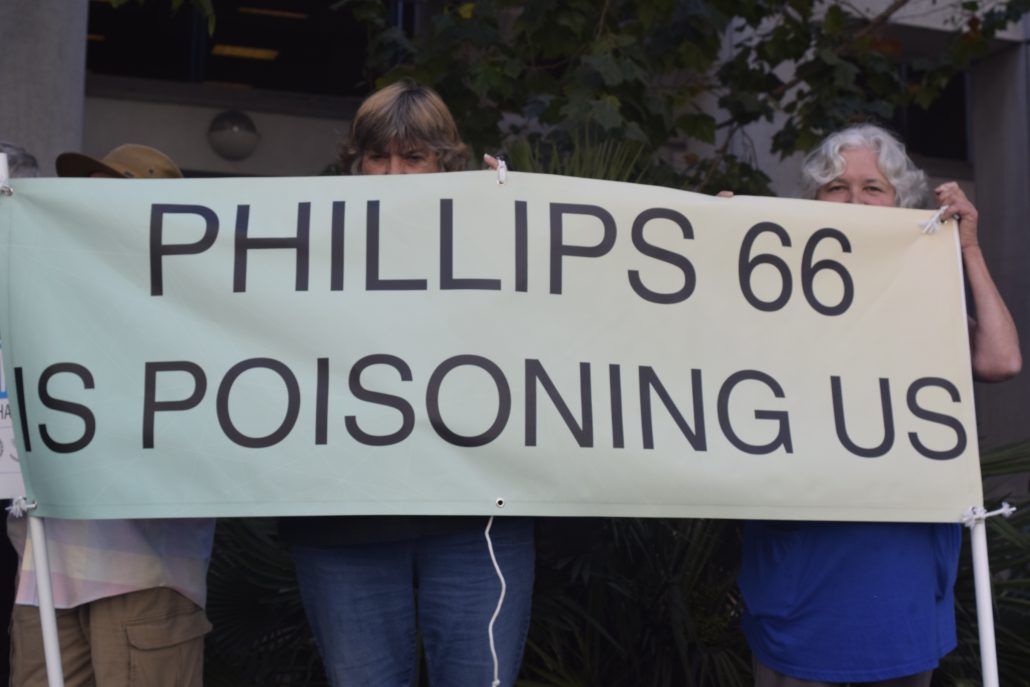
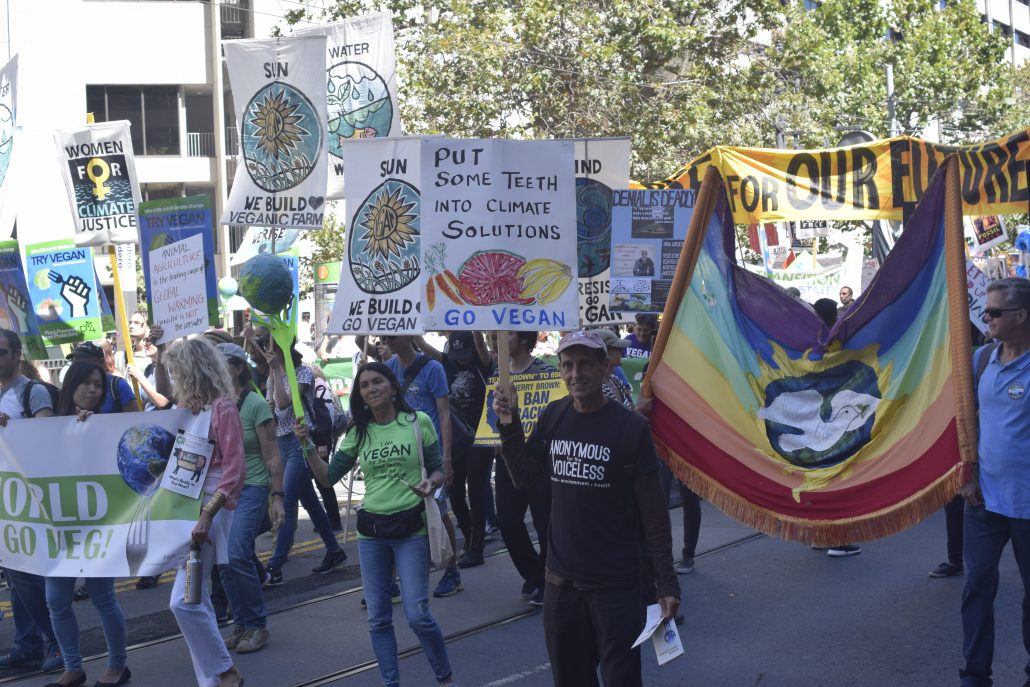
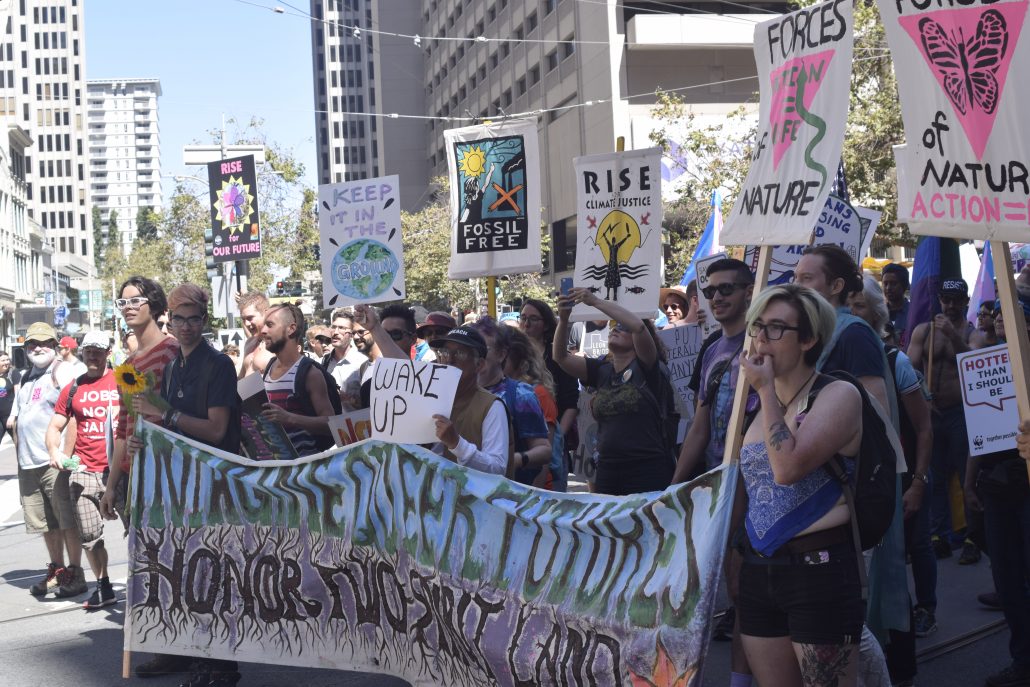
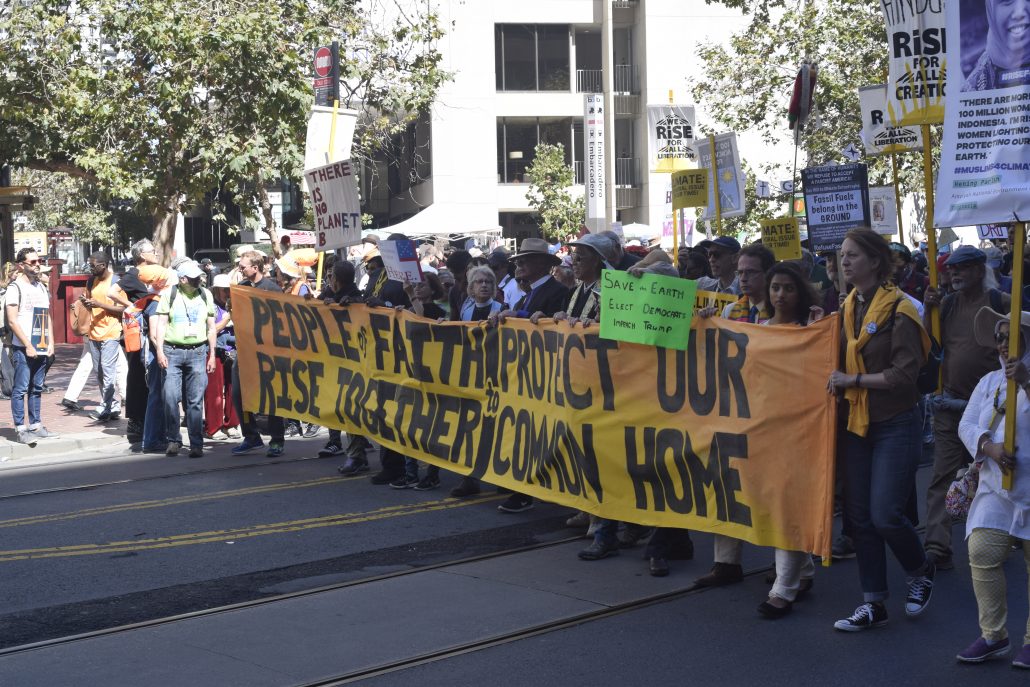
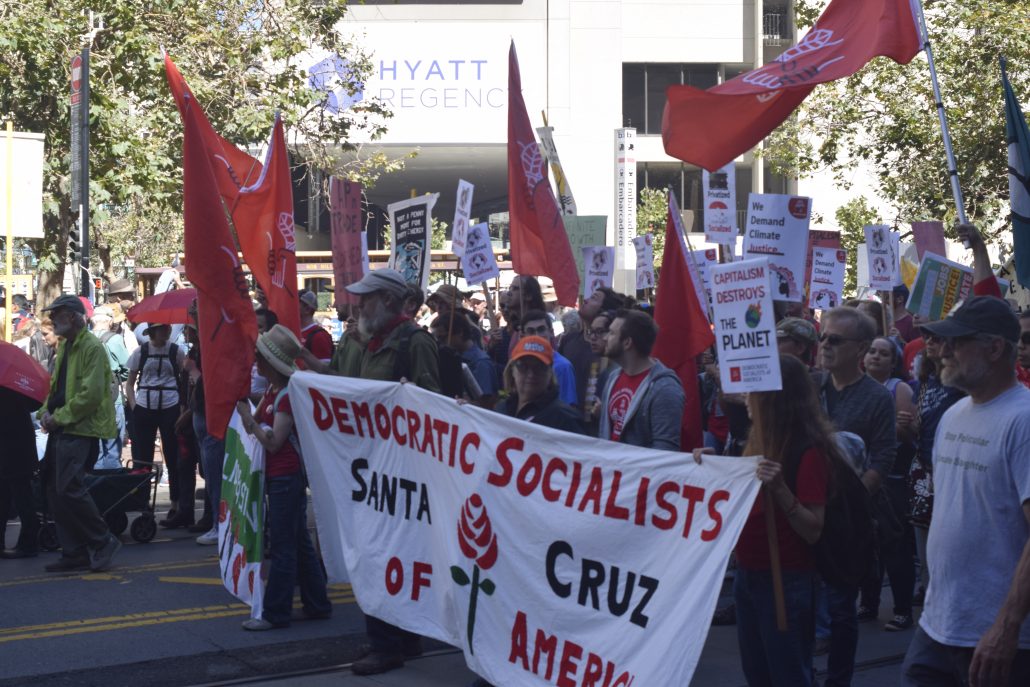
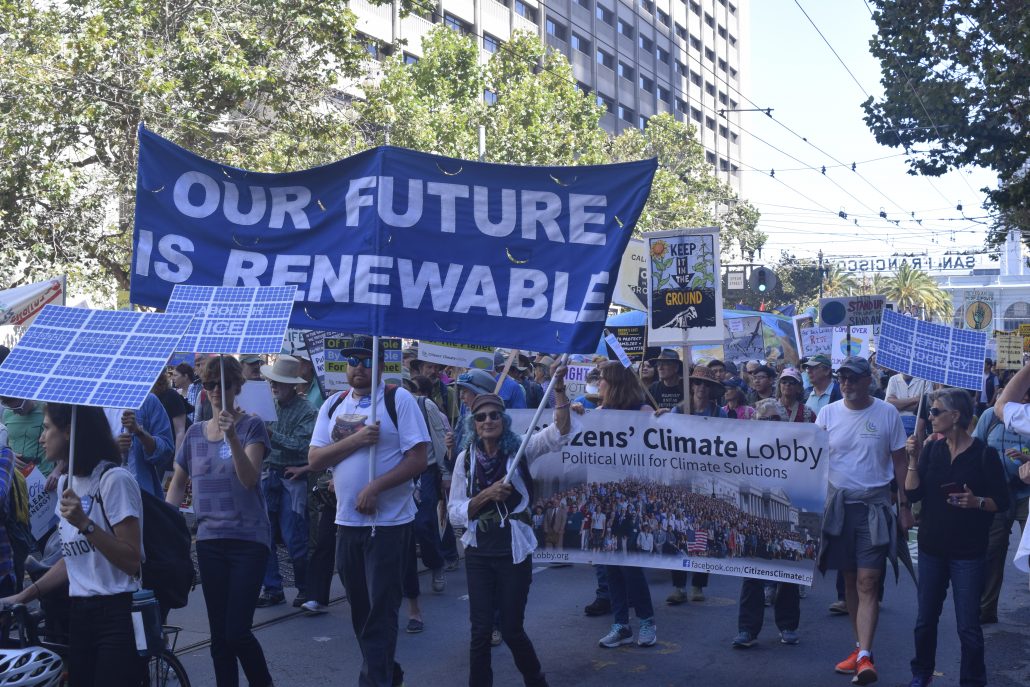
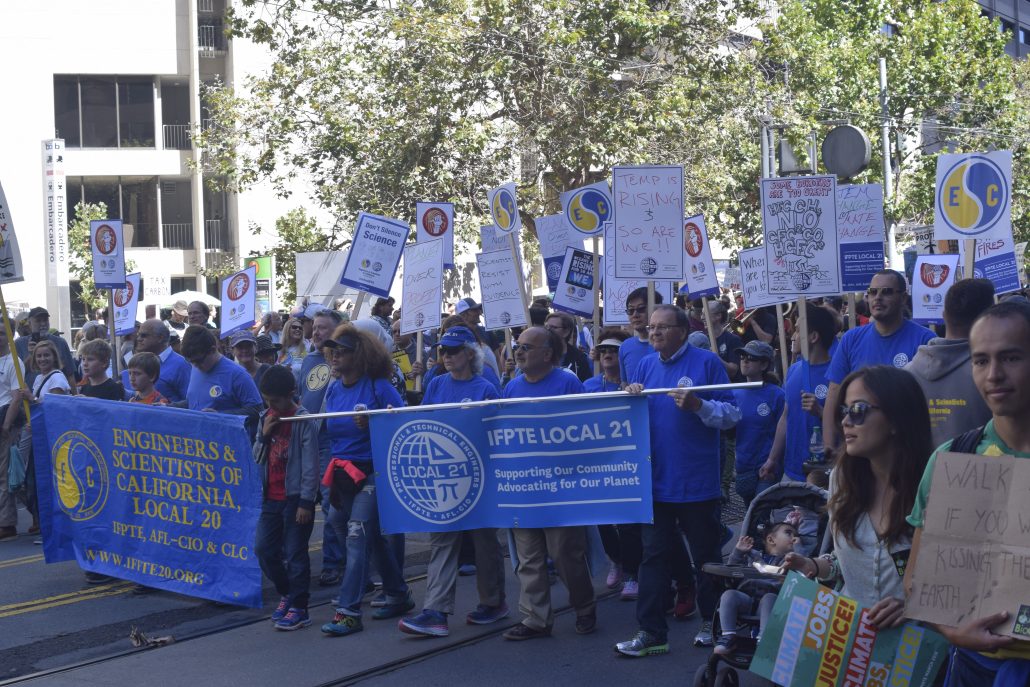
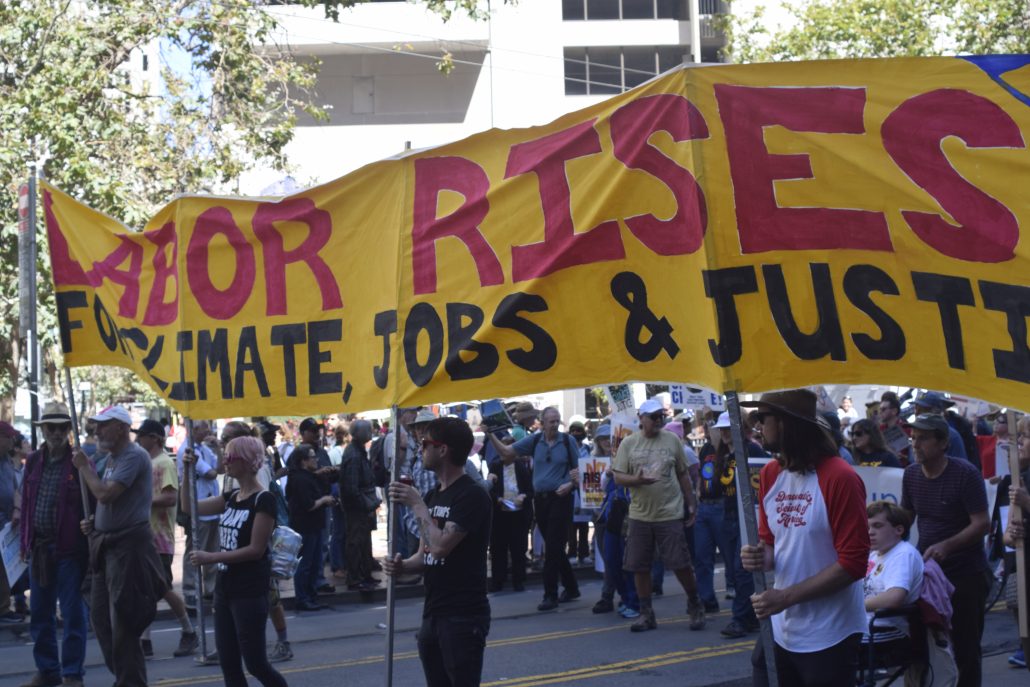
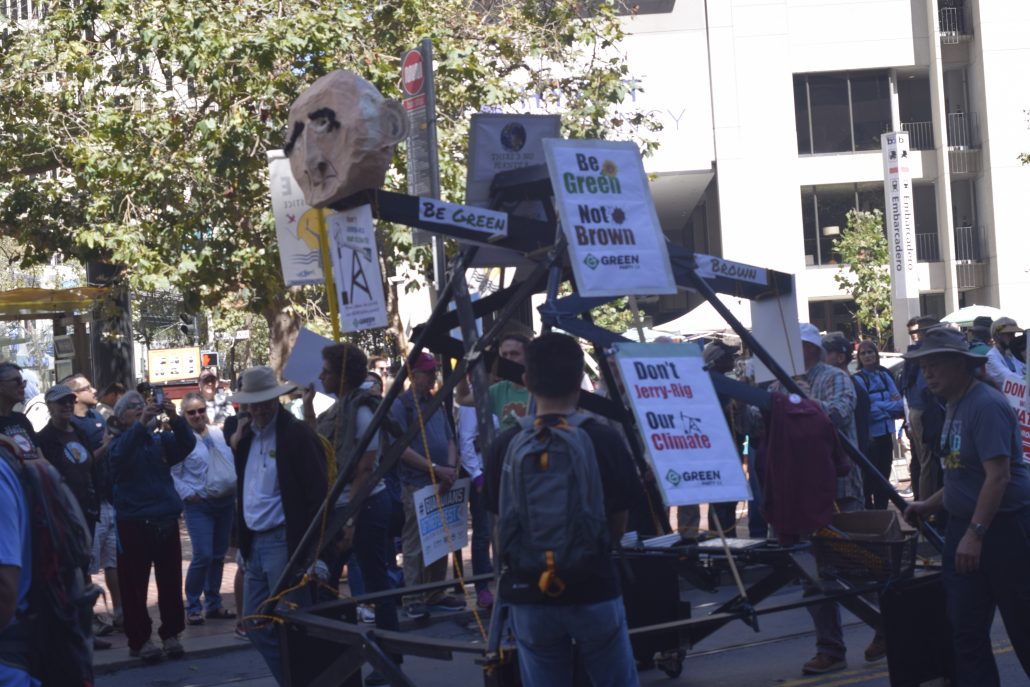
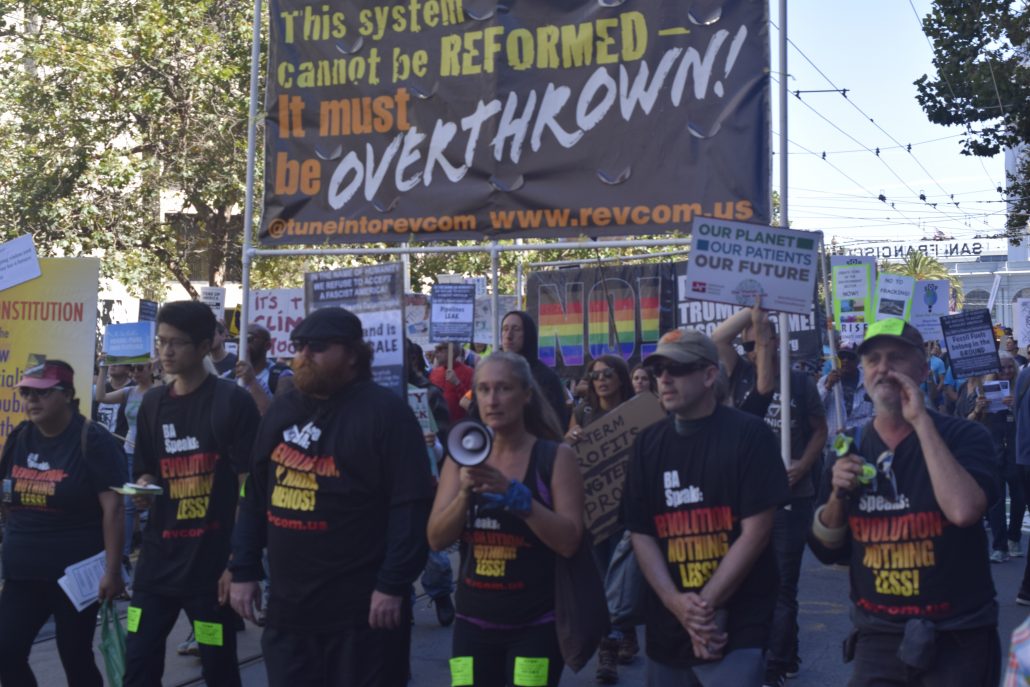
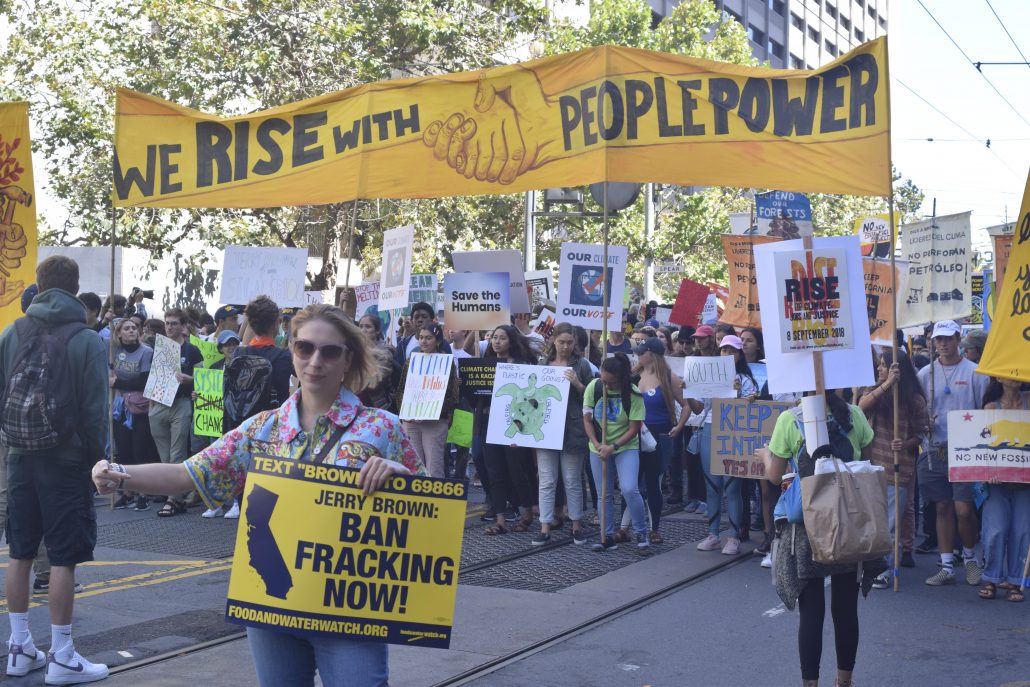
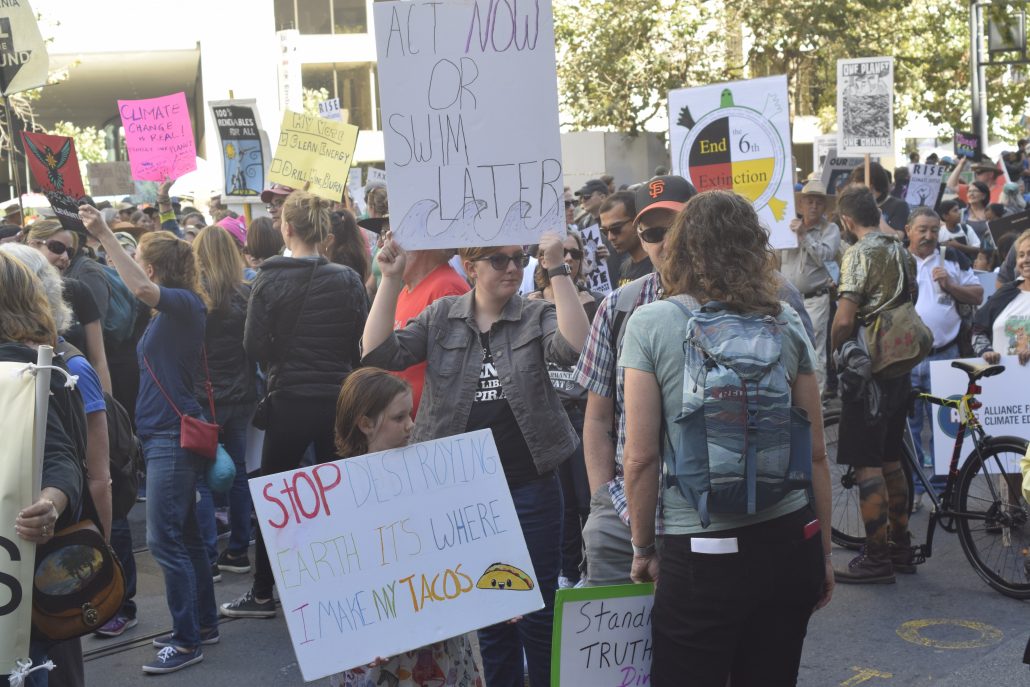
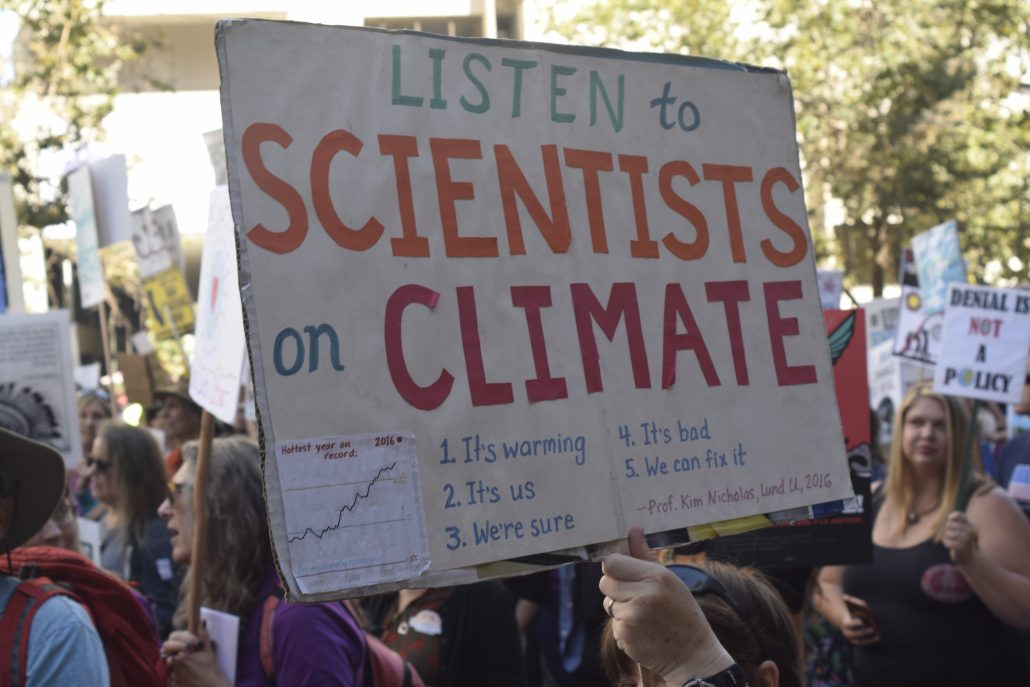
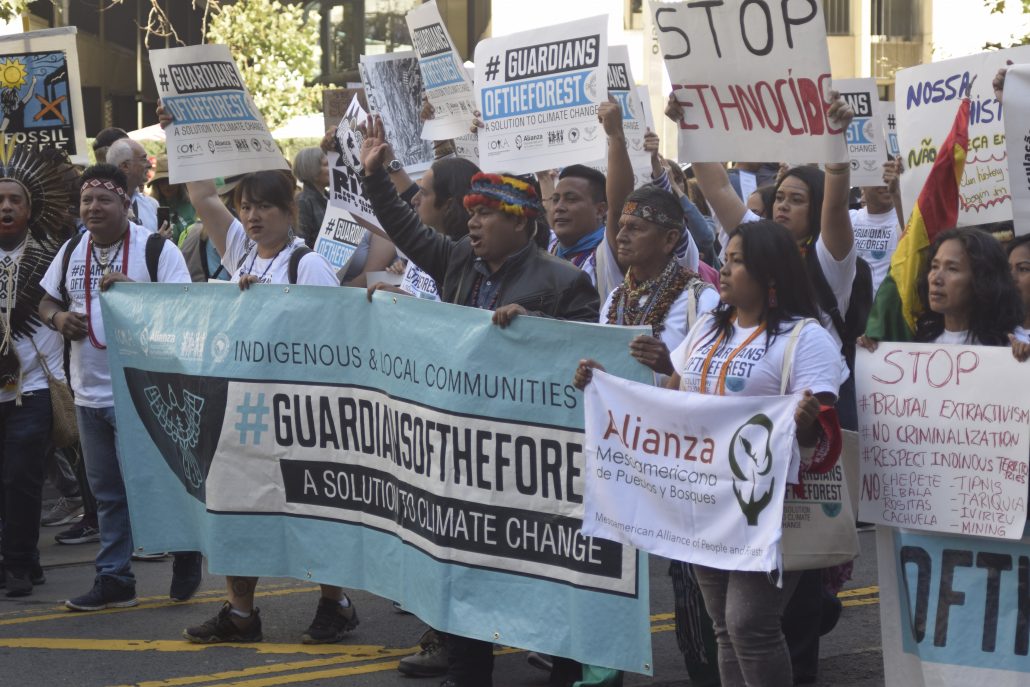
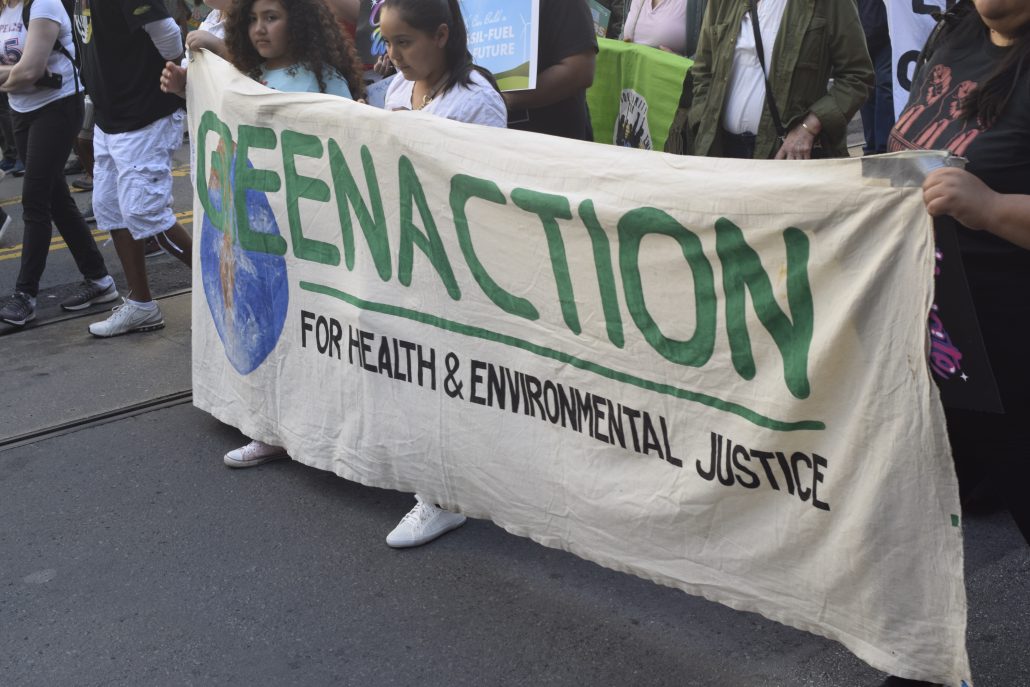