The majority of FracTracker’s posts are generally considered articles. These may include analysis around data, embedded maps, summaries of partner collaborations, highlights of a publication or project, guest posts, etc.
For many cities in the Eastern U.S., flash flood warnings and road closings characterized the summer of 2018. Now, hurricane season is upon us.
It’s been the wettest summer to date for Williamsport PA, Luray VA, and Baltimore MD. Several places set records for the wettest “year-through-August,” including Harrisburg PA and Wilmington NC. Washington D.C. and Pittsburgh are just two of many cities to reach their average yearly total rainfall with a third of the year left.
With the record-breaking rains come record-breaking floods, signaling devastation for local officials, residents, and… pipeline operators.
In June, construction on the Mountain Valley Pipeline in Virginia was suspended after heavy rainfall made it difficult for construction crews to control erosion. A landslide caused an explosion on the Leach Xpress Pipeline in West Virginia. The pipeline was built on a steep slope, and the weather made for challenging conditions to remediate the blast.
Then came the explosion of the Revolution Pipeline in Beaver County just this week on September 10th. Fire from the blast destroyed a house, a barn, two garages, several vehicles, six high tension electric towers, and shut down a section of a highway. Thankfully, residents were able evacuate their homes in time and no injuries were reported.
While the explosion is still under investigation, the cause of the explosion is believed to be a landslide, which occurred following days of heavy rain.
The burnt hillside near the site of the Revolution Pipeline explosion. Photo courtesy of Darrell Sapp, Post Gazette
How rain affects pipelines
Heavy rain can cause the ground to shift and swell, triggering devastating landslides, damaging pipelines, and creating leaks. Flooding can also make it difficult for crews to locate sites of leaks and repair pipelines.
Storms cause problems during pipeline construction, as well. Work areas and trenches can alter the flow of floodwaters and spill water onto farmland or backyards. At drilling sites, rain water can carry spills of bentonite, a drilling mud, into waterways.
Still, pipeline operators continue to plan and build along steep slopes, landslide prone areas, and through floodways and waterways. For instance, the route of Shell’s proposed Falcon Pipeline, in Pennsylvania, West Virginia, and Ohio, passes through many areas that are crucial for managing heavy rains.
Risks along the Falcon route
As highlighted by a recent Environmental Health News piece to which we contributed, Falcon’s route passes through 25 landslide prone areas, a few of which are in residential neighborhoods. In fact, one landslide-prone portion of the pipeline is just 345 feet from a home.
In Beaver County alone, the pipeline route passes through 21,910 square feetof streams, 455,519 square feetof floodway, and 60,398 square feetof wetland:
Map of the Falcon Pipeline’s route through Beaver County, with locations Shell has identified as prone to landslides.
Preventing disasters
What can be done to prevent pipeline leaks, explosions, and spills?
Along the Texas Gulf Coast, robust plans are in the works to protect oil and gas infrastructure. In August of 2017, Hurricane Harvey suspended a large portion of oil and gas operations in Texas. Now, the state has a $12 billion publicly-funded plan to build a barrier along the coast. The 60-mile-long structure would consist of seawalls, earthen barriers, floating gates, and steel levees. It will protect homes and ecosystems, as well as one of the world’s largest sites of petrochemical activity.
In July, the state fast-tracked $3.9 billion for three storm barriers around oil facilities. The industry is also moving inland to the Ohio River Valley, where it intends to build a petrochemical hub away from hurricane risk.
Herein lies the irony of the situation: The oil and gas industry is seeking refuge from the problems it is worsening.
Weather events are intensified by rising ocean and atmospheric temperatures. Scientists have reached a consensus on what’s causing these rises: increasing concentrations of greenhouse gasses (such as carbon dioxide and methane), released by burning fossil fuels. Protecting oil and gas infrastructure will allow the industry to continue polluting, thereby amplifying the problem.
In the short term, I suggest better protection of floodplains and waterways to keep residents and the environment safe. Accounting for frequent, heavy rains will help pipeline operators develop better erosion and sediment control plans. More protections for landslide prone areas near homes could save human and animal lives.
However, continuing to spend time, resources, and money to protect infrastructure from problems that the fossil fuel industry is exacerbating isn’t logical. Renewable energy will slow the effects of climate change that intensify weather events. Resources such as solar and wind also come with significantly less risk of explosion. Let’s be logical, now.
By Erica Jackson, Community Outreach & Communications Specialist
https://www.fractracker.org/a5ej20sjfwe/wp-content/uploads/2018/04/Shell-Pipeline-Violations-Feature.jpg400900Erica Jacksonhttps://www.fractracker.org/a5ej20sjfwe/wp-content/uploads/2025/09/2025-Wordmark-Logo.pngErica Jackson2018-09-13 16:22:392021-04-15 14:57:37Heavy Rains and Risks to Pipelines
Keystone Secrets: Records Show Widespread Use of Secret Fracking Chemicals is a Looming Risk for Delaware River Basin, Pennsylvania Communities
A report released today by the Partnership for Policy Integrity (PFPI) found that between 2013 and 2017, drilling companies injected at least one hydraulic fracturing (“fracking”) chemical with an identity kept hidden from the public into more than 2,500 unconventional natural gas wells drilled in Pennsylvania. The report, KeyStone Secrets, found companies injected secret fracking chemicals 13,632 times into 2,515 wells in total (explore map below).
Fracking in unconventional formations has significantly increased oil and gas extraction, making Pennsylvania the nation’s second-largest natural gas producer. The process has also sparked concerns about pollution and health effects, especially related to unidentified fracking chemicals. In response, Pennsylvania and 28 other states have enacted rules that require some public disclosure of these chemicals. However, most if not all of these rules have exceptions that allow companies to withhold chemical identities as trade secrets.
This report by Massachusetts-based Partnership for Policy Integrity (PFPI), with analysis of fracking chemical disclosure data by FracTracker Alliance, illustrates that drilling companies have used these exceptions extensively.
Records obtained by PFPI from the US Environmental Protection Agency (EPA) show that non-disclosure of fracking chemical identities may leave people unknowingly exposed to harmful substances. Between 2003 and 2014, the EPA identified health concerns for 109 of 126 new chemicals proposed for use in oil and gas drilling and fracking. The manufacturers submitted information about the chemicals for review under a program that requires EPA to screen and regulate new chemicals for health and environmental impacts before they are used commercially.
Despite concerns by EPA scientists about the chemicals’ health effects, EPA approved most of the 109 chemicals for use, and 62 were later used in or likely used in oil and gas wells. Manufacturers took advantage of trade secret protections that are permitted by federal law to conceal 41 of the 62 chemicals’ identities. It is possible that some of these chemicals declared secret at the federal level are some of the same chemicals being used under trade secret protection in Pennsylvania.
Mapping of secret fracking chemical injection sites (above) show that use is heaviest in southwest Pennsylvania near Pittsburgh and in northeast Pennsylvania near the Delaware River Basin, tracking areas of intensive drilling.
The use of secret chemicals in Pennsylvania’s oil and gas wells is likely even higher than detailed in this report because of exemptions in Pennsylvania law, including:
No disclosure requirements for the chemicals used in drilling oil and gas wells – the portion of the oil and gas extraction process that precedes fracking;
No requirement that fracking chemicals for so-called “conventional” oil and gas wells be reported to an easily searchable electronic database; and
A reporting exemption for chemical manufacturers who are not required to disclose trade secret chemical identities even to emergency responders cleaning up a leak or spill.
In the coming months, the Delaware River Basin Commission is expected to consider a ban on fracking in the basin – fracking that would be most likely to occur in unconventional gas wells in Pennsylvania’s portion of the four-state area. There is currently a de facto moratorium on fracking in the basin that provides drinking water for New York City and Philadelphia – among other cities. The commission is also expected to consider whether to allow related activities inside the basin, including the treatment and discharge into waterways of fracking wastewater from outside the basin. Any fracking or discharges of wastewater would be likely to include some of the secret fracking chemicals discussed in this report.
People have a right to know the identities of chemicals used in oil and gas operations so that citizens, first responders, regulators, and scientists can determine the chemicals’ risks and act to protect health and the environment. Learn more about the proprietary fracking chemicals used in PA by reading the full report:
Report Author: Dusty Horwitt, Partnership for Policy Integrity
https://www.fractracker.org/a5ej20sjfwe/wp-content/uploads/2018/09/SecretChemicalsReport-Rig-Feature.jpg400900FracTracker Alliancehttps://www.fractracker.org/a5ej20sjfwe/wp-content/uploads/2025/09/2025-Wordmark-Logo.pngFracTracker Alliance2018-09-11 06:00:092021-04-15 14:57:38New report finds widespread use of proprietary fracking chemicals in PA
A new plan is in the works to construct a natural gas pipeline that would run approximately 190 miles through Maryland. Lawmakers said in January they are anxious to see the Delmarva Pipeline built, but still want to exercise caution.
Starting in Cecil County, MD, and terminating in Accomack County, VA, the proposed Delmarva Pipeline is nearly the length of Maryland’s Eastern Shore. North Carolina-based Spectrum Energy wants to piggyback on this infrastructure and build a gas-powered power plant near Denton, MD, according to a report by WBOC 16 News. The combined price tag on the two projects is $1.25 billion, and is funded entirely by private interests based in Baltimore. The target start-up date for the two projects is 2021.
Local Support
Company officials promise the pipeline would bring down energy costs and bring jobs to the area. According to a 2016 Towson University study, the project would create about 100 jobs in Wicomico and Somerset Counties by 2026. In addition, the proposed power plant in Denton, MD would result in 350 construction jobs and 25-30 permanent jobs.
According to lawmaker Carl Anderton:
…it’s great. You know, anytime we can multiply our infrastructure for energy production, it’s something you really want.
Anderton, who claims to also support solar power and offshore wind, is skeptical about the sustainability of renewable energy to stand on its own if “the sun goes down or the wind’s not blowing.”
However, Senator Stephen Hershey emphasized the need to balance infrastructure build-out with costs to the environment. Said Hershey:
We have to make sure we’re taking all the possible steps to protect that.
Similarly, Democratic Delegate Sheree Sample-Hughes indicated the need to keep the well-being and concerns of citizens “at the forefront.”
Grassroots Opposition
The pipeline project has encountered considerable opposition from the grassroots group “No! Eastern Shore Pipeline.” The group has cited concerns about how all fossil fuels add to global warming, and asserted natural gas is not a cleaner alternative to propane or oil.
Jake Burdett, a supporter of No! Eastern Shore Pipeline, wants a complete transition to renewable fuels in Maryland by 2035, and argues that in the near-term, climate change impacts will be devastating and not reversible for residents of the Chesapeake Bay area, “the third most at-risk area in the entire country for sea level rise.”
In addition to driving climate change, hydraulic fracturing and the construction of the pipeline along the rural and historic Eastern Shore poses serious threats of fouling ground and surface water through sediment run-off and leaks. The possibility of pipeline explosions also puts nearby communities at risk.
Assessing Risks
H4 Capital Partners, the company contracted to build the pipeline, registered as a corporation in May of 2017, and this may be the first pipeline project it has undertaken. H4’s public relations spokesperson Jerry Sanders claimed that the environmental risks posed by the pipeline — which will drill under rivers and wetlands — will be nothing like those encountered by pipelines such as the Keystone XL. Said Sanders, “It is a gas, not a liquid…[so] you don’t have leak-type issues.”
The actual record about pipeline leaks and explosions suggests otherwise, notably summarized here by FracTracker Alliance in 2016, for combined oil and natural gas projects. That research indicates that since 2010, there have been 4,215 pipeline incidents resulting in 100 reported fatalities, 470 injuries, and property damage exceeding $3.4 billion. Additional records of natural gas transmission and distribution pipeline accidents, and hazardous liquid pipeline accidents collected by PHMSA (Pipeline and Hazardous Materials Safety Administration) have been summarized by the Pipeline Safety Trust.
It is unclear whether Maryland’s Department of the Environment (MDE) has completed an analysis of threats to wetlands and other water bodies, or is relying on industry and perhaps residents to do that work for them. Said MDE spokesperson Jay Apperson, “MDE would encourage the project proponents to come in early and often for discussions of routes so that we can… avoid and minimize impacts to these important natural resources.”
Delmarva Pipeline Map
Therefore, in the map below, we have done an analysis of the Delmarva Pipeline route – which we estimated from documents – and calculated the number of times the proposed pipeline crosses wetlands and streams along its route from northern Maryland to its terminus in Accomack County, VA.
In all, there were 172 stream crossings and 579 traverses of wetlands mapped by the US Fish and Wildlife Service’s National Wetland Inventory. Be sure to zoom in on the map above to view the detail. These wetland and stream crossings included:
in Virginia:
88 forested wetlands
13 emergent wetlands
27 riverine wetlands
9 ponds
And in Maryland:
276 forested wetlands
90 riverine wetlands
35 emergent wetlands
13 estuarine wetlands
11 ponds
5 lakes
Rather than focusing on threats to these natural resources or environmental justice issues associated with the nearly 200-mile pipeline, industry is utilizing a different tactic, preferring to view the project as an “economic justice issue [that] would allow the area to have access to low-cost fuels.”
For the Eastern Shore residents of Maryland and Virginia, it remains to be seen whether potential lower energy costs justify the risks of contaminated waterways, property damage, and a shifting shoreline associated with climate change driven by use of fossil fuels.
By Karen Edelstein, Eastern Program Coordinator, FracTracker Alliance
In the fleeting passage of days, FracTracker enjoyed a long history with Dr. Ben Stout. The infamous biology professor at Wheeling Jesuit University served on our board since the inception of the organization in 2012. While we didn’t get to spend as much time with him as we would have liked, each reunion was a pleasure, a reconnection with an old friend.
Ben was wily and wiry, casual and confident. He exuded a passion for protecting people and nature from industry run amok. As a scientist and educator, he was thorough and curious, yet always bold and engaged; he genuinely cared about the Appalachian communities he knew so well. The Intelligencer in Wheeling noted how he was viewed as an environmental hero. He was too humble to accept such a label, but his revelatory research and staunch advocacy warrant the honor.
On August 3rdat age 60, Ben died from recurring cancer. Even heroes can’t live forever, but this one’s legacy won’t soon fade away. Godspeed, Ben Stout – you did a whole lot of good in this world!
Talking about fracking all day, every day, can be a bit of a downer. Here at FracTracker, we find hope in the advances of clean energy across the country and around the world. This time around, let’s see how Missouri’s clean energy sector is fairing. Long story short – while it seems their clean energy is a bit behind in the game, at least they are trying.
In collaboration with our partners at Environmental Entrepreneurs (E2), FracTracker Alliance produced a series of maps investigating current clean energy businesses and sites where renewable energy is and can be generated. They aim to describe Missouri’s clean energy economy – and how much room it has to grow. Here is a sneak peak at some of these maps, below:
Map 1, above, shows clean renewable energy generation in Missouri. Solar and wind are the most dominant forms of renewable energy in Missouri. Missouri’s clean energy generating capacity is highest in the northwest corner of the state, where several large wind-energy projects are located. The state has 6 wind farms in this region including the newly-announced 100 MW Hawthorne Wind Farm and 49 MW High Prairie Wind Farm. In total, Missouri produces 1,000 MW of wind energy from about 500 turbines. Solar power is more dominant across the rest of the state, especially with schools’ solar energy generation around Kansas City and St. Louis and solar farms throughout the rest of the state, including Pulaski, Macon, and Bates counties. All in all, about 702 megawatts of wind and solar capacity are installed currently, with another 458 megawatts currently proposed to be built.
However, much more potential remains to be tapped as shown in Map 2, above. This holds true across solar, wind, and other renewable energy sources – particularly in the southwest corner of the state, where solar energy potential is the highest.
Missouri has up to 275,000 MW of wind potential energy, and these maps of energy potential show that overall, approximately 75% of the state has above-average potential for solar power. This is an important statistic since coal fueled 81% of Missouri’s electricity in 2017; only two other states burned more in 2017. Also, the new addition of bidirectional natural gas flow to the Rockies Express Pipeline means stiffer competition for renewables from the natural gas market.
It looks like the transition to clean energy in Missouri is happening, but there is always work to be done (nerdy “energy” joke). According to the E2 Missouri Clean Jobs Report, there is a lot of room for the clean energy sector to develop.
The potential does exist for the sector to drive economic growth in the state by being a major contributor to job growth. According the Environmental Entrepreneur’s Midwest Advocate Micaela Preskill, the industry in Missouri is slated to grow another 4.5% through 2019. Recent hires in the sector show that the workforce is very ethnically diverse, with the percentage of minority new hires doubling the average state demographics. Also 14% of new hires are veterans. Map 3, above, displays over 400 businesses, including energy efficiency contractors and renewable energy installers, which cover all 34 state senate districts. Surveys indicate that 80 percent of businesses working in clean energy in Missouri employ fewer than 25 individuals, illustrating the importance of small businesses in the clean-energy sector.
With the new state policies that support the transition from fossil fuels and the growing clean energy economy, Missouri is on a path to becoming more sustainably focused. This is particularly important because of the state’s past and present reliance on coal, and the availability of natural gas. More investment of state and federal resources in the clean energy sector could provide the boost that benefits state’s health, environment and economy through new jobs and manufacturing.
Behind in the Game Feature Image: Wind and farm. Creative Commons license.
https://www.fractracker.org/a5ej20sjfwe/wp-content/uploads/2018/08/FarmWind-Feature.jpg400900Kyle Ferrar, MPHhttps://www.fractracker.org/a5ej20sjfwe/wp-content/uploads/2025/09/2025-Wordmark-Logo.pngKyle Ferrar, MPH2018-08-22 11:30:442021-04-15 14:57:40Missouri’s clean energy is behind in the game, but at least they’re trying
The small city of Arvin, CA has succeeded in taking a brave step forward to protect the public health of its community.
On July 17, 2018 the Arvin City Council voted 3-0 (two members were absent) in support of a setback ordinance. This is the first California oil and gas ordinance that has an actual effect, as it is the first in a region where drilling and fracking are actively occurring. The Arvin, CA setback ordinance prevents wells from being drilled in residential or commercially-zoned spaces. Also, setback distances of 300 feet for new development and 600 feet for new drilling operations have been established for sensitive sites, such as parks, hospitals, and schools.
(To see where other local actions have been taken in California, check out our coverage of local actions and map, which was recently updated.)
More details and maps of the setback ordinance and its development can be found in the initial FracTracker coverage of the proposal, below:
The measure was supported by Arvin Mayor Jose Gurrola. He described the front-lines experience of Arvin citizens:
The road to the update has been difficult for this community. Eight Arvin families were evacuated after a toxic gas leak from an underground oilfield production pipeline located near their homes in 2014. Some have now been re-occupied by concerned residents with no other options; other homes still stand empty. Meanwhile, a short distance away an older pump jack labors day and night next to homes pumping oil mixed with water to a nearby tank. Despite multiple complaints to state agencies of odors and noise by the residents, they are told by the agencies that there is nothing that can be done under the current regulations. The pump jack continues to creak along as children walk nearby on their way to school, covering their faces as the smell occasionally drifts their direction. – Jose Gurrola, Mayor of the City of Arvin
Fugitive Emissions Monitoring
In anticipation of the city council’s vote, FracTracker collaborated with Earthworks and the grassroots organization Central California Environmental Justice Network to visit the urban well sites within the city limits. Using Infrared FLIR technology, the sites were assessed for fugitive emissions and leaks. Visualizing emissions of volatile organic compounds (VOCs) at these sites provides a glimpse to what the community living near these wells are continually exposed. The infrared cameras used in these videos are calibrated to the wavelengths of the infrared spectrum where VOC hydrocarbons of interest are visible.
The map below shows the locations that were visited, as indicated by the three stars. Videos of each site are shown below the map.
In this FLIR video of Sun Mountain Simpson-1, fugitive emissions are obvious. The emissions are coming from the PV vent at the top of the produced water tank. These emissions are a mixture of a variety of volatile organic compounds, such as BTEX compounds and methane. This well site is located between homes, a small apartment complex, and a playground. While on the ground operating the FLIR camera I felt light headed, dizzy, and developed a headache. The emissions were reported to the San Joaquin Valley Air District (SJVAD), who sampled and found VOC concentrations at dangerous levels. The well operator was notified but refused to respond. Unfortunately, because this particular well produces under 50 barrels of oil/day, the site is exempt from any health related emissions regulations.
Sun Mountain Jewett 1-23 Lease
This well site is located near a number of single family homes and next two a park. The well site is also on the future location of the Arvin Community College. The FLIR video below is particularly interesting because it shows fugitive emissions from four different locations. The leaks include one at the well head that is potentially underground, one on separator equipment, and leaks from each of the tank PV hatches. When regulators were notified, they visited the site and fixed two of the leaks immediately. Fugitive emissions from the PV hatches were not addressed because this site is also exempt from regulations.
ABA Energy Corporation Richards Facility Tank Farm
The Richards Facility Tank Farm is a well site located outside the city limits on farmland. The facility is regulated as a point source of air pollution, therefore enforcement action can require the operator to fix leaks even from PV hatches on tanks. This FLIR video shows leaks from PV hatches, and a major leak from a broken regulator valve. A complaint was submitted to the SJVAD, and the operator was required to replace the broken regulator valve.
“The aeroplane has unveiled for us the true face of the earth.” by French writer and aviator Antoine de Saint-Exupéry author of Le Petit Prince (The Little Prince)
I always tell people that you can’t really understand or appreciate the enormity, heterogeneity, and complexity of the unconventional oil and gas industry’s impact unless you look at the landscape from the cockpit of a Cessna 172. This bird’s-eye-view allows you to see the grandeur and nuance of all things beautiful and humbling. Conversely, and unfortunately more to the point of what I’ve seen in the last year, a Cessna allows one to really absorb the extent, degree, and intensity of all things destructive.
I’ve had the opportunity to hop on board the planes of some amazing pilots like Dave Warner, a forester formerly of Shanks, West Virginia (Note: More on our harrowing West Virginia flight with Dave later!!), Tim Jacobson Esq. out of La Crosse, Wisconsin, northern Illinois retired commodity and tree farmer Doug Harford, and Target corporate jet pilot Fred Muskol out of the Twin Cities area of Minnesota.
Since joining FracTracker I’ve been fortunate to have completed nearly a dozen of these “morning flights” as I like to call them, and five of those have taken place since August 2017. I’m going to take the next few paragraphs to share what I’ve found in my own words and by way of some of the photos I think really capture how hydraulic fracturing, and all of its tentacles, has impacted the landscape.
The following is by no means an empirical illustration. I’m increasingly aware, however, that often times tables, charts, and graphs fail to capture much of the scale and scope of fossil fuel’s impact. Photos, if properly georeferenced and curated, are as robust a source of data as a spreadsheet or shapefile, both of which are the traditional coins of the realm here at FracTracker.
West Central Wisconsin Frac Sand Mines
August 2, 2017
Figure 1. Wisconsin and Winona, Minnesota silica sand mines, processing facilities, and related operations
It was nearly a year ago today that I met Bloomer, Wisconsin dairy farmer Ken Schmitt at the Chippewa Valley Regional Airport (KEAU) and soon thereafter jumped into Tim Jacobson’s Cessna 172 to get a bird’s-eye-view of the region’s many frac sand mines and their impacts (Figure 1). These sites are spread out over a 12-county region known as West Central Wisconsin (WCW). Ken hadn’t been up to see these mines since October of 2016 and was eager to see how they had “progressed,” knowing what he did about their impact on his neck of the woods in northern Chippewa County.
Ken is one of the smartest guys I’ve ever met, and – befitting a dairy farmer – he is also one of the most conservative and analytical folks I’ve ever met. However, that morning it was clear that his patience with county administrators and the frac sand mining industry had long since run out. He was tired of broken promises, their clear and ubiquitous bullying tactics, and a general sense that his livelihood and the farm he was hoping to leave his kids were at risk due to sand mining’s complete capture of WCW’s residents and administrators.
Meanwhile Mr. Jacobson Esq. was intimately familiar with some of the legal tools residents were using to fight the spread of sand mining in the WCW. This is something he referred to as “anticipatory nuisance” lawsuits, which he and his colleagues were pursuing on behalf of several landowners against OmniTrax’s (f/k/a Terracor) “sand mine, wet and dry processing, a conveyor system to a rail load out with manifest yard” proposal in Jackson County, Wisconsin. I, too, have worked with Tim to inform some of his legal work with respect to the nuisance stories and incidents I’ve documented in my travels, as well as research into the effects of sand mining across Michigan, Illinois, Minnesota, and Wisconsin.
Explore details from our sand mining tour by clicking on the images below:
Our flight lasted nearly 2.5 hours and stretched out over 4,522 square miles. It included nearly 20 sand mines – and related infrastructure – in the counties of Jackson, Wood, Clark, Eau Claire, Monroe, Trempealeau, and Buffalo. What we saw was a sizeable expansion of the mining complex in the region since the last time I flew the area – nearly four years earlier on October 8, 2013. The number and size of mines that had popped up since that trip were far greater than any of us had expected.
This expansion paralleled the relative – and total –increase in demand for “proppant” from the High Volume Hydraulic Fracturing (HVHF) all across the country (Figure 2).
Figure 2. A map of the likely destination for Wisconsin’s frac sand mines silica sand based on an analysis of Superior Silica Sand’s 2015 SEC 10Ks.
West Virginia Panhandle & Southeastern Ohio
January 26, 2018
On the morning of January 26th, I woke up on the west side of Cleveland thinking there was very little chance we were going to get up in the air for our flight with SouthWings’ pilot Dave Warner due to inclement weather. There was a part of me that was optimistic, however, so I decided to make the three hour drive down to the Marshall County Airport (KMPG) in Moundsville, West Virginia from Cleveland in the hopes that the “cold rain and snow” we’d been receiving was purely lake effect stuff and the West Virginia panhandle had not been in the path of the same cold front.
Marshall County, West Virginia Airport (KMPG) staff clearing the runway for our flight with SouthWings pilot Dave Warner, 1/26/2018
Unfortunately, when I arrived at the Moundsville airport I was wrong, and the runway was pretty slick around 8:00 a.m. However, the airport’s staff worked diligently to de-ice and plow the runway and by the time Dave Warner arrived from southern West Virginia conditions were ideal. The goal of this flight was two-fold:
Photograph some of the large-scale high-volume hydraulic fracturing (HVHF) infrastructure in the West Virginia counties of Doddridge, Wetzel, and Marshall owned and operated by MarkWest, and
Allegheny Front’s Julie Grant was doing a story on natural gas gathering pipeline’s impact on waterways, and more specifically the Hellbender Salamander (Cryptobranchus alleganiensis). She was looking to see the impacted landscape from the air.
Both of these goals were achieved efficiently and safely, with the resulting Allegheny Front piece receiving significant interest across multiple public radio and television platforms including PRI’s Living On Earth.
Explore details from our WV / OH tour by clicking on the images below:
On my return drive home that afternoon the one new thing that really resonated with me was the fact that hydraulic fracturing or fracking has come to be defined by 4-5 acre well pads across Appalachian, Texas, Oklahoma, and North Dakota. This is a myth, however, expertly perpetuated by the oil and gas industry and their talking shops. Fracking’s extreme volatility and quick declines in rates of return necessitate that this latest fossil fuel iteration install large pieces of infrastructure like compressor stations and cracking facilities. This all is to ensure timely movement of product from supply to demand and to optimize the “value added” products the global markets demand and plastics industry uses as their primary feedstocks. This large infrastructure was never mentioned at the outset of the shale revolution, and I would imagine if it had been there would be far more resistance.
The one old thing the trip reinforced was the omnipresence and sinuosity of natural gas gathering lines across extremely steep and forested Appalachian geographies. How these pipelines will hold up and what their hasty construction is doing to terrestrial and aquatic wildlife, not to mention humanity, is anyone’s guess; the data is just so darn bad.
Southeastern Ohio
March 5, 2018 – aka, The XTO Powhatan Point Well Pad Explosion Flight
Around 9 a.m. on Thursday, February 15, 2018, an explosion occurred at XTO’s Schnegg frack pad “as the company worked to frack a fourth well” in Powhatan Point, Belmont County, Ohio. Shortly thereafter, a two-mile Temporary Flight Restriction (TFR) was enacted by the Federal Aviation Administration (FAA) around the incident’s location. The TFR was supposed to lapse during the afternoon of March 5, however, due to complications at the site the TFR was extended to the evening of March 8.
We were antsy to see what we could see, so we caught an emergency flight with Dave Warner, only this time under the LightHawk umbrella. We left on the morning of March 5th out of the all too familiar[1]Carroll County-Tolson Airport (KTSO). Although we couldn’t get close to the site, there was a holler valley to the northwest of the pad that allowed us to capture a photo of the ongoing releases. Additionally, within several weeks we obtained by FOIA the raw Ohio State Trooper monitoring footage from their helicopter and posted this footage to our YouTube channel, where it has received 4,787 views since March 19, 2018. This type of web traffic is atypical for anything that doesn’t include kittens, the Kardashians, or the Kardashians’ kittens.
Explore details from our Southeastern Ohio tour by clicking on the images below:
Much like our flight in January the most salient points I got out of Dave’s plane thinking about were:
Astonishment regarding the number of gas gathering lines and the fact that they seem to have been installed with very little-to-no reclamation forethought. They are also installed during a time of year when – even if hydroseed is applied – it won’t grow, leaving plenty of chances for predictable spring rains to cause major problems for streams and creeks, and
It is a big plant, a very big plant and far bigger than other plants around here… What’s really amazing that we got it up and running in six months. No one believed that we could do that. – Momentum Midstream spokesman Eric Mize discussing their natural gas liquids-separating complex in Scio, Ohio.
LaSalle County, Illinois
May 24 & 26, 2018
Frac Sand Mines and The Nature Conservancy’s Nachusa Grasslands Buffalo Herd, Franklin Grove, Illinois
Fast forward to the week of May 21st of this year, and I was back in the frac sand capital to interview several folks that live near these mines or have been advocating for a more responsible industry. I conducted a “morning flight” with several journalists and county officials from neighboring Ottawa County.
LaSalle County is an extremely interesting case study for anyone even remotely interested in the food, energy, and water (FEW) conversation that has begun to receive significant attention in the age of the “Shale Revolution.” (Such focus is largely thanks to the extreme amounts of water required during the fracking process.) While LaSalle County has never experienced even a single HVHF permit, it is home to much of the prized silica or “proppant” the HVHF industry prizes. La Salle receives this recognition due to its location above one of the finest sources of silica sand: the St. Peter Sandstone formation. This situation has prompted a significant expansion in the permitting of new silica sand mines and expansion of existing mines throughout the county – from small townships like North Utica and Oglesby to Troy Grove 7 miles north on East 8th Road.
Meanwhile, LaSalle County is home to some of the most productive soils in the United States, due largely to the carbon sequestration capabilities of the tallgrass prairies that once dominated the region. In any given year, the county ranks in the top 5 nationally based on the amount of soybean and corn produced on a per-acre basis. According to an analysis of the most recent USDA agricultural census, total agricultural value in LaSalle County exceeds $175 million or seven times the national average by county of roughly $23 million.
Needless to say, the short-term extraction of silica sands in the name of “energy independence” stands to have a profound impact on long-term “food security” in the U.S. and worldwide. Sadly, this conflict is similar to the one facing the aforementioned West Central Wisconsin, home to similarly productive soils. The cows that feed on the forage those soils produce some of the highest quality dairy anywhere. (As an aside: both regions are facing the realities of their disproportionate support for Donald Trump and the effects his trade war will have on their economies.)
… vertical walls of moss-covered stone formed by glacial meltwater that slice dramatically through tree-covered sandstone bluffs. More than 13 miles of trails allow access to waterfalls, fed season runoff or natural springs, sandstone overhangs, and spectacular overlooks. Lush vegetation supports abundant wildlife, while oak, cedar and pine grow on drier, sandy bluff tops. – IL DNR
Starved Rock receives more than 2.5 million visitors annually, which is the most of any Illinois state park. However, it is completely surrounded by existing or proposed frac sand mines, including US Silica’s Covel Creek mine. US Silica even recently pitched an expansion to the doorstep of Starved Rock and future plans to nearly engulf the park’s perimeter. What such an expansion would do to the attractiveness of the park and its trickle down economic impact is debatable, but LaSalle County residents Paul Wheeler and photographer Michelle McCray took a stab at illustrating the value of the state park to residents for our audience back in August, 2016:
Our flight with LightHawk pilot and neighboring Mazon, Illinois retired farmer Doug Harford lifted off from Illinois Valley Regional Airport (KVYS) at around 9:00 a.m. local time on the morning of May 24th. We had perfect conditions for taking photos, with no clouds and a comfortable 70-75°F for the duration of a two-hour flight. We covered nearly 200 square miles and ten existing, abandoned, or permitted frac sand mines.
Explore details from our Illinois tour by clicking on the images below:
All passengers were struck by how large these mines were and how much several of the mines had expanded since the last time we all flew over them in June of 2016. The mines that had experienced the greatest rates of expansion were US Silica’s LaSalle Voss mine along Interstate 80 and the aforementioned Illinois River mine along with Fairmount Mineral’s major expansion, both in terms of infrastructure and actual mine footprint, in Wedron along the Fox River.
Figure 3. A map of the LaSalle County frac sand mines and associated St. Peter sandstone formation, along with the city of Chicago for some geographic perspective.
Most of this expansion is due to three critical distinguishing characteristics about the industry in LaSalle County:
The processing and export infrastructure (i.e., east-west rail) is in place and allows for mining to take place at times when other sand mining regions are mothballed,
Due to the large aggregation of parcels for farming purposes, companies can lease or outright purchase large amounts of land from relatively few landowners, and
Only the largest firms are active in the region, and with economies of scale they are not subject to the same types of shocks that smaller firms are when the price of oil collapses (like it did between June 2015 and February 2016). This means that the conflict will only be amplified in the coming months and years as the frac sand mining industry looks to supersede agriculture as LaSalle County’s primary economic driver.
However, all is not lost in North Central Illinois. This hope was stoked during our sojourn – and my subsequent trip in person – up to see The Nature Conservancy’s 3,600 acre preserve in Franklin Grove on the border of Lee and Ogle counties. As someone who is working hard to establish a small plot of prairie grasses and associated wildflowers at my home outside Cleveland, I was hoping to see what an established prairie looks like from the air. My primary goal, however, was to see what a healthy herd of native bison looks like.[2] The Nachusa bison are unique in that they came:
… from Wind Cave National Park in South Dakota and…Unlike most other American bison, animals from the Wind Cave herd have no history of cross-breeding with cattle. Bison from Wind Cave are the species’ most genetically pure and diverse specimens.
We were fortunate during our flight to have spotted the heard at the western edge of the preserve in what volunteer naturalist, Betty Higby, later told me the staff calls Oak Island. While I am not a person of faith, seeing these behemoths roaming freely and doing what 20-30 million of their ancestors used to do across much of North America moved me in a way I was not prepared for. I was immediately overwhelmed with a sense of awe and humility. How was I going to explain this beast’s former ubiquity and current novelty to my 5-year-old son, who shares a love of the North American Bison with me and would most certainly ask me what happened to this majestic creature?
Medina & Stark counties, Ohio NEXUS Pipeline flight
June 25, 2018
Ohio is currently home to 2,840 fracking permits, with 2,370 of these laterals having been drilled since September 2010. The growing concern around the fracking and petrochemicals conversation across much of the Midwest is the increasing number of FERC-permitted natural gas pipeline “proposals”[3] the industry is demanding it needs to maximize potential. Most residents in the path of these pipelines have strong objections to such development, citing the fact that imminent domain should not be invoked for corporate gain.
Much like all of the other patterns and processes we’ve documented and/or photographed at FracTracker, we felt that a flight over the latest FERC-approved pipeline – The NEXUS pipeline – would give us a better understanding of how this critical piece of infrastructure has altered the landscapes of Medina and Stark counties. Given the population density of these two northeastern Ohio counties, we also wanted to document the pipeline’s pathway with respect to urban and suburban centers.
Our flight on June 25th was delayed due to low clouds and last minute changes to the flight plan, but once we took off from Wadsworth Municipal Airport (3G3) with a local flight instructor it was clear that NEXUS is a pipeline that navigates a sinuous path in cities and townships like Green, Medina, Rittman, and Seville – coming dangerously close to thousands of homes and farms, as well as many schools and medical facilities.
Explore details from our NEXUS Pipeline tour by clicking on the images below:
Will this be the last FERC-approved pipeline to transverse Ohio in the name of “energy independence”? Will this pipeline and its brethren with names like the Utopia and ET Rover be monitored in real-time? If not, why? It is unfortunate, to say the least, that we so flippantly assume these pipelines are innocuous given their proximity to so many Ohioans. And, as if to add insult to injury, imminent domain is invoked. All this for a piece of oil and gas infrastructure that will profit companies on the global market, with only a fraction of the revenue returning to affected communities.
What’s Next?
I don’t know of a better way to understand the magnitude of these pipelines than flying over them at 1,000-1,500 feet, and I will continue to monitor and photograph oil and gas developments from the air with the assistance of amazing pilots like those affiliated with LightHawk and SouthWings.
To this end, I will be returning to West Central Wisconsin for yet another “morning flight” with the aforementioned La Crosse-area pilot and lawyer Tim Jacobson and frequent collaborator University of Wisconsin-Stout professor Tom Pearson.[4] Our flight plan will return us to the northern Wisconsin frac sand counties of Chippewa, Barron, Dunn, Eau Claire, and if we have time we’ll revisit the mines we photographed in August of last year. We’ve been told by Susan Bence, an environmental reporter out of Milwaukee Public Radio, that she is trying to convince the powers that be at NPR in Washington, DC that this is a story the entire country should hear about. Wish us luck!
Flyover Partners
By Ted Auch, Great Lakes Program Coordinator
Bird’s-Eye-View Endnotes
The first of my morning fracking flights was out of this airport back in June, 2012 along with the other passenger on this flight Paul Feezel of Carroll Concerned Citizens and David Beach of the Cleveland Museum of Natural History’s Green City Blue Lakes program.
The Conservancy initially brought at least 30 bison of different ages and genders to Nachusa. The bison graze on approximately 1,500 acres of the prairie and the site currently supports more than 120 bison according to site volunteer naturalist Betty Higby.
I put quotes around this word because in my travels across Ohio interviewing those in the path of these transmission pipelines it is clear that this is not the correct word because ‘proposals’ implies that these pipelines might not happen or are up for debate. Yet, neither could be further from the truth with most folks indicating that it was very clear very early in their interactions with FERC and the pipeline companies that there was never a chance that these pipelines were not going to happen with “imminent domain for private gain” being the common thread throughout my conversations.
Tom is the author of a recently published book on the topic “When the Hills Are Gone.”
https://www.fractracker.org/a5ej20sjfwe/wp-content/uploads/2018/07/Sand-Flyover-Feature.jpg400900Ted Auch, PhDhttps://www.fractracker.org/a5ej20sjfwe/wp-content/uploads/2025/09/2025-Wordmark-Logo.pngTed Auch, PhD2018-08-08 10:31:522021-04-15 14:57:41Documenting Fracking Impacts: A Yearlong Tour from a Bird’s-Eye-View
When people think about oil and gas extraction in Pennsylvania, they think about the tens of thousands of oil and gas wells in the state. It makes sense, because that’s where the process starts. However, while oil and other liquids can be shipped in tanker trucks, all of the producing gas wells in the state – whether they are small conventional wells or the giants of the Marcellus and Utica – must be connected by a network of pipelines.
Moving hydrocarbons from the well to processing facilities to power plants and residential customers all occurs within this giant midstream system, and the cumulative impact that pipelines have on the state is formidable. Let’s take a closer look at where the oil and gas pipelines are located in PA, their safety records, and major data gaps. Additionally, we’ve made available a detailed, interactive map of Pennsylvania pipelines and other important features such as water crossings.
Pipeline routes are everywhere in Pennsylvania
According to the Pipeline and Hazardous Materials Safety Administration (PHMSA), there were 92,407 miles of pipelines carrying natural gas and liquid petroleum products in Pennsylvania in 2017. That distance is equivalent to 151 round trips between Philadelphia and Pittsburgh on the Pennsylvania Turnpike, or more than three trips around the globe at the equator. This figure includes 78,022 miles of distribution lines (which takes gas from public utilities to consumers), 10,168 miles of transmission lines (which move gas between various processing facilities), 3,111 miles of petroleum liquid routes, and 1,105 miles of natural gas gathering lines (which take the gas from wells to midstream processing facilities).
Of note – The last category’s estimate is almost certainly a drastic underestimation. As of June 7th, there were 3,781 unconventional well pads in Pennsylvania, according the Pennsylvania Department of Environmental Protection (DEP), and all of the pads need to be connected to gathering lines. A 2014 report by the Nature Conservancy estimates that 19 acres of land are cleared for each well pad, which would work out to 3.1 miles of gathering lines for a typical 50-foot right-of-way. Multiplied out, 3,781 wells pads would require a total of 11,721 miles of gathering lines – well over PHMSA’s estimate of a 1,105 miles (See Table 1 for estimate comparisons).
Table 1. Varying estimates of gathering lines in Pennsylvania.*
Source
Unconventional Well Pads
Average Gathering Line Length (Miles)
Statewide Total Estimated Miles
Nature Conservancy
3,781
3.1
11,721
Bradford County
3,781
3.5
13,234
PHMSA
3,781
0.3
1,105
*Estimates based on Nature Conservancy and Bradford County data are based on calculating the average length of segments, then multiplying by the number of well pads in the state to find the statewide total. The PHMSA estimate was calculated in reverse, by dividing the purported total of gathering lines by the number of well pads to find the average mileage.
Figure 1: Location of gathering lines (2014) and oil and gas wells (2018) in Bradford County, Pennsylvania. Note the pockets of newer wells that are not connected to the older gathering line network.
In 2014, the FracTracker Alliance digitized a published map of gathering lines in Bradford County, allowing us to analyze the data spatially (Figure 2). These efforts yield similar results, with gathering lines averaging 3.5 miles in length. Not counting segments of transmission lines included in the data, such as Stagecoach, Sunoco, and Kinder Morgan’s Tennessee Gas Pipeline, there were 1,003 miles of gas gathering lines just in Bradford County in 2014.
Almost all of this data is based only on unconventional oil and gas activity, and therefore ignores the more than 96,000 conventional oil and gas (O&G) wells active in the state. We do not have a reasonable estimate on the average length of gathering line segments are for this network. It is reasonable to assume that they tend to be shorter, as conventional wells are often closer together than unconventional well pads, but they must still network across vast portions of the state.
Table 2. Estimated length of gathering lines for conventional wells in Pennsylvania by variable average lengths
Average Length (Miles)
Conventional Wells
Total Miles
0.5
96,143
48,072
1.0
96,143
96,143
1.5
96,143
144,215
2.0
96,143
192,286
2.5
96,143
240,358
3.0
96,143
288,429
If the average gathering line for conventional wells in Pennsylvania is at least 1 mile in length, then the total mileage of gathering lines would exceed all other types of gas and petroleum pipelines in the state. Conversely, for the PHMSA figure of 1,105 miles to be accurate, the average gathering line for all conventional wells and unconventional well pads in Pennsylvania would be 0.011 miles, or only about 58 feet long.
Pipelines are dangerous
As pipelines impact residents in many ways, there are numerous reason why communities should try to understand their impacts – including basic planning, property rights, sediment runoff into streams, to name a few. Perhaps the most significant reason, however, is the potential for harmful incidents to occur, which are more common than anyone would like to think (See Table 3). Some of these incidents are quite serious, too.
Table 3. Nationwide pipeline incidents statistics from PHMSA from January 1, 2010 through July 13, 2018
Report
Events
Fatalities
Injuries
Explosions
Evacuees
Total Damages
Gas Distribution
909
92
432
220
16,949
$348,511,528
Gas Transmission / Gathering
1,031
23
94
49
8,557
$1,085,396,867
Hazardous Liquids
3,368
10
24
14
2,467
$2,531,839,207
Grand Total
5,308
125
550
283
27,973
$3,965,747,602
As of the July 13, 2018 download date, the PHMSA report covers 3,116 days.
Incidents Per Day
This means that nationally per day there are 1.7 pipeline incidents, almost 9 people evacuated, and $1,272,704 in damages, including the loss of released hydrocarbons.
On average, there is a fatality every 25 days, an injury every six days, and an explosion every 11 days. The location of those explosions obviously has a lot to do with the casualty count and aggregate property damage.
How do Pennsylvania pipelines hold up? As one might expect from a state with so many pipelines, Pennsylvania’s share of these incidents are significant (See Table 4).
Table 4. Pennsylvania pipeline incidents statistics from PHMSA from January 1, 2010 through July 13, 2018
Report
Events
Fatalities
Injuries
Explosions
Evacuees
Total Damages
Gas Distribution
29
8
19
12
778
$6,769,061
Gas Transmission / Gathering
30
0
2
2
292
$51,048,027
Hazardous Liquids
49
0
0
1
48
$9,115,036
Grand Total
108
8
21
15
1,118
$66,932,124
Within Pennsylvania, an incident is reported to PHMSA every 29 days, an injury or fatality can be expected every 107 days, and the daily average of property damage is $21,480.
The issue with under-reported gathering lines notwithstanding, PHMSA lists Pennsylvania with 92,407 miles of combined gas and hazardous liquid pipelines, which is roughly 3.3% of the nationwide total, and there is no reason to believe that PHMSA’s issue with accounting for gathering lines is unique to the Keystone State.
Just 2% of the total number of incidents are in Pennsylvania. In terms of impacts, however, the state has seen more than its fair share – with 6.4% of fatalities, 3.8% of injuries, 5.3% of explosions, and 3.9% of evacuations. Property damage in Pennsylvania accounts for just 1.7% of the national total, making it the only category examined above for which its share of impacts is less than expected, based on total pipeline miles.
Pipeline location data not widely available
Pipeline data is published from a variety of public agencies, although almost none of it is really accessible or accurate.
For example the Department of Homeland Security (DHS) publishes a number of energy-related datasets. While they do not publish gas pipelines, they do have a 2012 dataset of natural gas liquid routes, which is a significant portion of the hazardous liquid inventory. From an analytical point of view, however, this dataset is essentially worthless. Many of these pipelines are so generalized that they don’t make a single bend for multiple counties, and the actual location of the routes can be miles from where the data are represented. Communities cannot use this as a tool to better understand how pipelines interact with places that are important to them, like schools, hospitals, and residential neighborhoods. The dataset is also incomplete – the original Mariner East natural gas pipeline, which has been around for decades, isn’t even included in the dataset.
Figure 2: This text appears to viewers of PHMSA’s public pipeline viewer.
Another data source is PHMSA’s National Pipeline Mapping System Public Viewer. While this source is rich in content, it has several intentional limitations that thwart the ability of the public to accurately analyze the pipeline network and understand potential impacts:
Data can only be accessed one county at a time, which is impractical for long interstate transmission routes,
Data can not be be downloaded, and
The on-screen representation of the routes disappears when users zoom in too far.
Within Pennsylvania, the Department of Environmental Protection (DEP) maintains the Pennsylvania Pipeline Portal, which contains a lot of information about various recent pipeline projects. However, with the sole exception of the Mariner East II project, the agency does not provide any geospatial data for the routes. The reason for this is explained on the Mariner East II page:
These shapefiles are the GIS data layers associated with the permits that have been submitted for the proposed pipeline project. These shapefiles are not required as part of a permit application and are not commonly submitted but were provided to the Department by Sunoco Pipeline, L.P.
The files were accepted by the Department to aid in the review of the application material given the large scale of the project. The shapefiles ease the review by displaying some information contained in the hardcopy of the plans and application in a different format.
The Department of Conservation and Natural Resources (DCNR) does make oil and gas infrastructure data available, including pipelines, where it occurs on state forest land.
Pennsylvania Pipelines Map
Considering the risks posed by pipelines, their proliferation in Pennsylvania, and this critical juncture in their development with an implicit opportunity to document impacts, FracTracker believes it is important now to develop an accurate interactive statewide map of these projects, fortify it with essential data layers, and facilitate citizen reporting of the problems that are occurring.
Other than the Mariner East II route and the state forest data available from DCNR, all of the pipeline routes on our Pennsylvania Pipeline Map, below, have been painstakingly digitized – either from paper maps, PDFs, or other digital media – to make geospatial data that can analyzed by interacting with other datasets. These layers are only as good as their sources, and may not be exact in some cases, but they are orders of magnitude better than data produced by public agencies such as DHS.
Figure 3: FracTracker’s Pennsylvania Pipeline Map. View fulll screen to explore map further, view water crossings, and other details not visible at the statewide map view.
Data Layers on Pennsylvania Pipelines Map
Incidents
PHMSA incidents (7-13-2018). Pipeline incidents that were reported to the Pipeline and Hazardous Material Safety Administration. These reports contain significant information about the incidents, including location coordinates, and are shown on the map with white circles.
Note that a few of the location coordinates appear to be erroneous, as two reports appear outside of the state boundary.
Spills
Mariner East II – Inadvertent Returns (6-1-2018). This data layer shows inadvertent returns – or spills – related to the construction of the Mariner East II pipeline. This is a combination of two reports, including one where the spills that impacted waterways, and those categorized as upland spills. These are represented on the map by orange dots that vary in size depending on the amount of fluid that spilled. Some of the locations were provided as latitude / longitude coordinates, while others are estimates based on the description. In a few cases, the latitude value was adjusted to intersect the pipeline route. In each case, the adjusted location was in the correct county and municipality.
Water Crossings
Known Stream & Wetland Crossings (2018). This shows the locations where the known pipeline routes intersect with streams and other wetlands on the National Wetland Inventory. These are organized by our four pipeline layers that follow, including FracTracker Vetted Pipelines (1,397 crossings), DCNR Pipelines (184 crossings), PHMSA Gas Pipelines (6,767 crossings), and Bradford County Gathering Lines (867 crossings). These crossings are shown as diamonds that match the colors of the four listed pipeline layers.
Vetted Pipelines
FracTracker Vetted Pipelines (2018). This pipeline layer is an aggregation of pipeline routes that have been digitized in recent years. Much of this digitization was performed by the FracTracker Alliance, and it is an available layer on our mobile app. These are largely newer projects, and contain some routes, such as the Falcon Ethane Pipeline System, that have not been built yet. In some cases, multiple versions of the pipeline routes are printed, and we may not have the final version of the route in all circumstances. FracTracker Vetted Pipelines are represented with a red line.
DCNR Pipelines
DCNR Pipelines (2018). This includes pipeline routes on state forest lands, and is shown as green lines on the map.
PHMSA Pipelines
PHMSA Gas Pipelines (2018). This includes data digitized from the PHMSA Public Pipeline Viewer. This source contains gas and liquid pipelines, but only gas pipelines are included in this analysis. These routes are shown in a bright purplish pink color.
Bradford Lines
Bradford County Gathering Lines (2014). This layer was digitized by the FracTracker Alliance after Bradford County published a printed map of gathering lines within the county in 2014. It is the only county in Pennsylvania that we have gathering line data for, and it is shown on the map as a yellow line.
Nearby Waterways
Streams & Wetlands with 1/2 Mile of Pipelines (2018). This clipped layer of the National Wetlands Inventory is provided for visual reference of the wetlands near known pipeline routes. Due to the large amount of data, this layer is only visible when users zoom in to a scale of 1:500,000, or about the size of a large county.
By Matt Kelso, Manager of Data and Technology
This article is the first in a two-part series on Pennsylvania pipelines. Stay tuned!
FracTracker Alliance recently created a set of maps showing population variation along the route of the Mariner East 2 Pipeline, which I refer to as the “Dragonpipe.” FracTracker’s maps dramatically reveal a route that runs through many centers of dense population, and seems to avoid relatively nearby areas with far lower population density. The maps are based on US Census 2010 block-level data.
The take-away lesson from these maps is this: Sunoco has put the Dragonpipe in a very bad location.
As an example, here is a map of the pipeline route as it passes through Berks, Chester, and Delaware counties in Pennsylvania:
Figure 1. Population density in southeastern Pennsylvania. Map courtesy of FracTracker Alliance. Location annotations added by G. Alexander.
The dark brown areas in the map above denote the most densely populated locations, displayed as the number of people per square mile. The lighter the color, the lower the population density. The black line is the pipeline route.
In the upper left-hand part of the map, note that the route passes through the suburbs of Reading, in Berks County. Further south in the same map, notice how it passes directly through population centers in Chester and Delaware counties.
Let’s examine this pattern more closely.
Why was this route chosen in the first place?
For Sunoco’s convenience
In many areas, from a standpoint of impacts on local communities, the pipeline route is actually the worst possible track that Sunoco could have chosen; it puts more people at risk than any other path, given the same starting- and endpoints. Why in the world did they choose this route?
The answer is this: for Sunoco’s corporate convenience. The Dragonpipe, for most of its length, runs side-by-side Mariner East 1 (ME1), an existing 80+ year-old pipeline designed to carry gasoline and heating oil to customers in the central and western parts of Pennsylvania. From this standpoint, the location of the old pipeline makes sense; it had to be sited near populated areas. That’s where the customers for gasoline and heating oil were located back in the 1930s.
However, the flip-side of Sunoco’s corporate convenience may also mean unnecessary risks to tens of thousands of Pennsylvania residents.
The old pipeline connected the centers of population in the 1930s, areas that are now much more populous when they were nearly ninety years ago. In the southeastern part of Pennsylvania, the character of the area has also changed dramatically. When the original pipeline was built, the landscape along ME1’s route through Delaware and Chester counties was predominantly farmland. Today, that area has changed to densely-settled suburbs, with homes, schools, businesses, hospitals, and shopping centers directly adjacent to the pipeline’s right-of-way.
The Exton area provides a prime example of how this transition to suburbia has set the stage for potential disaster along the pipeline route. The following image shows a detailed view of the population density near Exton. As you can see, the pipeline route sticks to high-density areas (shown in dark brown) the entire way, even though lower-density options (shown in orange and yellow) exist nearby.
Figure 2. Population density in Exton area. Map courtesy of FracTracker Alliance. Location annotations added by G. Alexander.
Sunoco — like any corporation — has a moral obligation to conduct its business in a safe manner. This includes choosing a safe route for a pipeline that has inherent dangers and risks. However, Sunoco apparently did not choose to do so. Moreover, by law, Sunoco has an obligation to make human safety paramount. In the settlement Sunoco reached last August with Clean Air Council, Delaware Riverkeeper Network, and Mountain Watershed Association, Sunoco agreed to consider alternative routing for the pipeline in this area. Then, despite their promises, Sunoco simply bypassed that part of the agreement. Rather than explore alternatives to the proposed route, Sunoco dismissed the alternatives as “not practicable” because they did not involve the right-of-way that was already in use for Mariner East 1.
Sunoco seemed to have made their sole priority in considering a pipeline route whether the company has an existing pipeline there already. A better route would reduce by hundreds the number of people who could be killed or injured if there were a leak and explosion.
Pipelines leak
Pipelines can and do leak. Mariner East 1, in its short career as a pipeline carrying NGLs, has already leaked several times. It is just good luck that the leaks were stopped before any product ignited. (See most recent report of ME1 and ME2 issues.) The Atex pipeline, a pipeline of similar size and content that runs down to the Gulf Coast, ruptured and exploded near Follansbee, WV, in just its second year of operation. And there’s no reason to believe such an incident would never happen with the Dragonpipe.
Sunoco has an obligation to do what it can to minimize the injuries, death, and destruction caused by an event like the Follansbee explosion. The Follansbee incident occurred in a forested area. The explosion destroyed several acres of trees, but no-one was killed. The result would have been far different if had the explosion been in a densely populated area.
Just as the maps above show how the Philadelphia suburbs and those of Reading are threatened, other FracTracker maps show the threats to suburbs of Pittsburgh and Harrisburg, below. Click to expand.
A call for change
Indeed, across the state, the Dragonpipe route gets dangerously and notably close to population centers. Such a path may be a convenient and financially beneficial option for Sunoco, but it is an unacceptable risk for Pennsylvania’s citizens to bear.
About the Author: George Alexander publishes the Dragonpipe Diary (www.dragonpipediary.com), covering all aspects the Mariner East pipeline project, including technology, risks, legal issues, economics, and the people and groups involved. He recently retired from a career in journalism and marketing.
An earlier version of this essay was published in Mr. Alexander’s blog, Dragonpipe Diary, on June 29, 2018.
https://www.fractracker.org/a5ej20sjfwe/wp-content/uploads/2018/07/ME2-Dragonpipe-Map-Feature.jpg400900Guest Authorhttps://www.fractracker.org/a5ej20sjfwe/wp-content/uploads/2025/09/2025-Wordmark-Logo.pngGuest Author2018-07-20 13:32:312021-04-15 15:01:14Population density maps: Lessons on where NOT to put a pipeline
Energy use — whether for heating, cooking, transportation, or manufacturing — is a fact of life for humans on our planet. From the most subsistence-level village life, to the largest metropolises in the world, energy is consumed. But fossil fuels are not a sustainable source of energy. Fossil fuels, by their very nature, are finite in quantity, and increasingly more expensive to extract as the most accessible stores are tapped.
Fossil fuel consumption by-products are driving CO2 and methane to accumulate in the atmosphere, leading towards what most scientists think will be a tipping point to irreversible climate chaos (see image below).
Alternatives to fossil fuels not only exist, but in many cases, are becoming more affordable (see additional information on solar afforability here) than the environmentally-destructive oil, gas, and coal-burning options. Technological advances are changing the way people around the world can live, with cleaner, greener, and more equitable energy sources, as well as more conservation-focused consumption patterns.
Recognizing the benefits to transitioning away from fossil fuels, communities across the US and world-wide, are saying NO to fossil fuel extraction and YES to renewable energy: solar, wind, geothermal, and hydro power, as well as electric vehicles when the electricity that supplies them is renewably generated. Below, and in the following map, we are tracking this movement to a clean energy future.
At least 35 communities in California and WashingtonState have passed resolutions against off-shore drilling. On the East Coast, from Florida to New York State, 44 municipalities have passed resolutions opposing seismic blasting, a form of exploration for oil and gas that has disastrous impacts on marine life, including threatened and endangered marine mammals. What’s further, 105 communities have come out against a combination of offshore drilling and seismic blasting, and at least 26 have taken a stand against offshore drilling.
In Florida, where several bills that would prohibit fracking statewide have been in play for the past few years, individual municipalities have registered their opposition. 43 have signed resolutions opposing fracking, and 7 communities, including Zephyr Hills, Cape Coral, Bonita Springs, Coconut Creek, Dade City, Estero, and St. Petersburg, have passed full ordinances against fracking within their boundaries. In addition to resolutions against drilling in 25 Florida counties, 13 counties in Florida have passed legislation fully banning fracking. These counties are Alachua, Bay, Brevard, Citrus, Indian River, Madison, Osceola, Pinellas, Seminole, St. Lucie, Volusia, Wakulla, and Walton.
In Connecticut, where the geology is not suitable for oil and gas extraction, communities are still proactively protecting themselves against one byproduct of extreme oil and gas extraction: fracking waste disposal. While historically, there are no known instances of fracking waste being exported to Connecticut for disposal, as of March 2018, 46 municipalities are considering rules to ban future disposal of oil and gas wastes within their boundaries, while another 45 have already outlawed the practice, as of late May 2018.
New York State has had a state-wide ban against high-volume hydraulic fracturing since December of 2014. New York led the way in home-rule backed municipal bans and moratoria (temporary prohibitions). Since 2011, 92 NYS municipalities have instituted bans against fracking, and 96 towns, cities, and village have passed moratoria — most of which have now expired. At least another 88 municipalities have also considered banning the practice, prior to the more comprehensive state-wide ban.
The state of Vermont has also banned fracking, and Maryland has instituted a long-term moratorium. Outside of New York State, another 51 municipalities — from Australia to Italy, and New Jersey to California — have passed local ordinances banning fracking. Five countries — Bulgaria, France, Ireland, Germany, and Scotland — have banned the practice altogether. The countries of Wales, The Netherlands, and Uruguay have active moratoria. Moratoria are also currently in place in Cantabria, Spain; Victoria, Australia; Newfoundland, Canada; Paraná, Brazil; Entre Rios, Argentina; and the Eastern Band of Cherokee Indians, as well as the Turtle Mountain Band of Chippewa Indians.
Crossing Boundaries
Coordinated efforts are happening — across state lines, linking urban and rural communities — to fight new fossil fuel infrastructure on local and regional levels. On both sides of the New York / Connecticut border, communities are uniting against the Cricket Valley Energy Center, an 1,100 MW fracked gas-powered plant that opponents say presents environmental and human health risks and diverts NYS’s renewable energy focus back to fossil fuels.
More than 30 communities in Pennsylvania along the route of the proposed PennEast pipeline have passed resolutions opposing that pipeline. Nearly 80 communities in New York and New Jersey have come out against the proposed Pilgrim Pipeline, designed to carry light crude from the Port of Albany to the Atlantic Coast refineries. And a plan by Crestwood/ Stagecoach Energy to store hydrocarbons in abandoned salt caverns along the shores of Seneca Lake in the scenic Finger Lakes Region of central New York met unprecedented sharp opposition. As of early 2018, over 32 towns and counties, and close to 400 local businesses had signed resolutions opposing the gas storage plans. Pressure from business and government interests likely contributed to scaling down of the storage plans from butane, ethane, and natural gas, to only LNG.
Unconventional Bans
A 2013 ban on fracking in Hawai’i was met initially with some puzzlement, since there are no oil and gas deposits within the lava-created rock that makes up the Big Island. However, this ban was not against fracking for gas; rather, it dealt with fracking to harness geothermal energy. The Puna Geothermal Venture Plant, located on Hawaii’s highly geologically active East Rift Zone, was controversial when it was built twenty-five years ago. Now, with lava already on the property and poised to potentially inundate the facility, opponents are pushing for its complete closure — if the plant survives the massive flow from Kilauea, now devastating Lower Puna, that started in early May 2018.
Transportation Concerns
Fossil fuels are transported through a variety of mechanisms. Pipelines are the most common means of conveyance; the US Energy Information Administration (EIA) estimates that 3 million miles of oil and gas transmission and delivery pipelines crisscross the US. The Bureau of Transportation Statistics estimated in 2014 that there were nearly 1.6 million miles of gas transmission pipelines in the US, and another 160,521 miles of oil pipelines. Pipeline safety has been a concern for years, and as pipeline build-out continues, so does the litany of accidents due to failures.
A widely used alternative to moving light crude via pipelines is to transport it by rail, from oil fields in Canada and the Dakotas to coastal refineries. In 2014, crude oil production from North Dakota was nearly 1 million barrels per day. The same year, Texas was producing 2.9 million barrels per day. Statistics from the Association of American Railroads (NY Times, 4/12/2014) indicate that in 2013, 407,642 carloads (700 barrels = 1 carload) of crude oil were shipped across the US. That’s more than 285 million barrels, or about 80% of the crude oil shipped to port, that were transported via rail.
Accidents resulting from the derailment of freight cars carrying crude oil can be disastrous to both human communities, and to the environment. The Lac-Mégantic derailment in July, 2013 resulted in a death toll of 47, and the near complete devastation of the downtown of this small Quebec town. Benzene contamination at the site was heavy, and the Chaudière River was contaminated with 26,000 gallons of the light crude, which impacted towns 50 miles downstream.
The disaster at Lac-Mégantic led to a rallying cry among policy-makers, regulators, and environmentalists, who continued to raise awareness of the risks of “crude by rail”, or, as the freight cars are often known, “bomb trains”. Within 2 years after the disaster, over 180 communities from Washington State, to California, to New York, and New Jersey, passed local resolutions demanding better safety regulations, and exhorting officials to stop shipping crude through their communities.
Earlier research by FracTracker Alliance on “bomb train” routes through major New York urban centers like Buffalo and Rochester showed dozens of K-12 public and private schools are within the ½-mile blast zones. Without adequate evacuation plans, the injury or loss of life — were a derailment to happen within the cities — could be extensive. The importance of public critique about the transportation of light crude by rail cannot be overstated.
Transitions to renewable energy
communities making it happen
The answer to a clean and renewable energy future, while rooted in the resistance to fossil fuel build out, consists of much more than protesting, and saying “NO”. A clean energy future requires goal-setting, and a vision to commit to change. It takes communities investing in a healthy future for all community members—today, tomorrow, and into the next century.
To that end, nearly 350 communities worldwide (so far) have set tangible goals to transition off fossil fuels – see map above. These communities are our beacons for a sustainable planet. They take seriously the dangerous ecological cascades posed by climate change and have made creative and conscious commitments to future generations of Earth’s biota.
350
Communities Worldwide
As of early 2018, at least 62 cities in the US have set goals for being powered by renewable energy before the middle of the 21st century according to Sierra Club’s tally of municipalities striving for clean energy power. Five of these communities — Kodiak Island, AK; Rock Port, MO; Greensburg, KS, Burlington, VT; and Aspen, CO, have already met their goals. EcoWatch collected information on over 100 cities around the world that are now powered by at least 70% renewables, and the organization CDP noted close to 200 cities and towns with ambitious targets for renewable power within the next two decades.
Across the US, over 27,300 MW of commercial solar has been installed as of April, 2018. And currently, wind turbines provide close to 59,000 MW of clean energy, nationwide. As of June, 2018, there were more than 18,000 electric vehicle charging stations across the country. While many municipalities are committed to replacing fossil fuels with renewable energy sources, we have a long way to go. Change must happen exponentially in order to meet ambitious goals of even 50% renewable energy in the next decade. For example, in 2011, New York State was meeting approximately 19% of its energy needs from renewable energy—largely from hydropower. Governor Cuomo’s “50 by 30” plan—mandating a clean energy standard of 50% renewables by 2030—sets forth goals that will require aggressive advocacy, the will of decision-makers, economic funding and incentives, education, and the steadfast insistence of the citizenry if we are to have a chance at slowing climate change and curbing greenhouse gas emissions.
Other resources on resistance
On every continent of the planet, there are citizen-based movements to address the impacts of coal on the environment. CoalSwarm has compiled a dynamic listing on a country-by-country basis. Similarly, a sister project, FrackSwarm, is a clearinghouse for citizen’s movements around the world that are addressing the impacts of fracking. Both CoalSwarm and FrackSwarm advocate strongly for a movement to clean energy everywhere. Both sites feature detailed background information on movements around the world and are partner projects to SourceWatch and the Center for Media and Democracy.
Halt the Harm Network, another organization closely allied with FracTracker Alliance, has developed a robust network of groups leading the fights against the oil and gas industry. Their database is searchable by skills, geography, and interests. Many of the organizations included in their database are also included in this map of resistance advocacy and activism groups fighting for a clean energy future.
Last, but not least, in 2017, FracTracker Alliance partnered with E2 to create a resource called “Mapping Clean Energy: New York”. You can view the maps that show clean energy jobs, solar, wind, and electric vehicle resources here. FracTracker also developed clean energy interactive maps for Pennsylvania, Ohio, Illinois, Michigan, and Missouri.
Next steps
FracTracker will continue to update our Clean Energy Action Maps project, and actively solicit input and feedback from the public. If your advocacy group is not listed on our maps above, please complete the form at the bottom of the project page. We’ll compile public input, and regularly add new organizations to this resource.
Of note: We will soon be retiring our Alliance Map in favor of these maps, as we believe it is extremely important to capture the depth and breadth of the movements against fossil fuels and in support of renewables. This project is our effort to make connections across the globe, whether or not we are in direct communication with the groups on the maps.
https://www.fractracker.org/a5ej20sjfwe/wp-content/uploads/2018/06/The-Resistance-Feature.jpg400900Karen Edelsteinhttps://www.fractracker.org/a5ej20sjfwe/wp-content/uploads/2025/09/2025-Wordmark-Logo.pngKaren Edelstein2018-06-28 10:04:362021-04-15 15:01:15Tracking the Movement Against Fossil Fuels
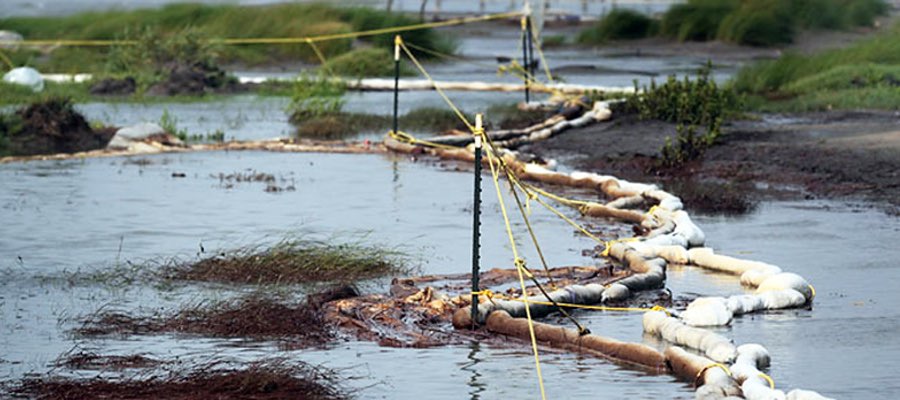
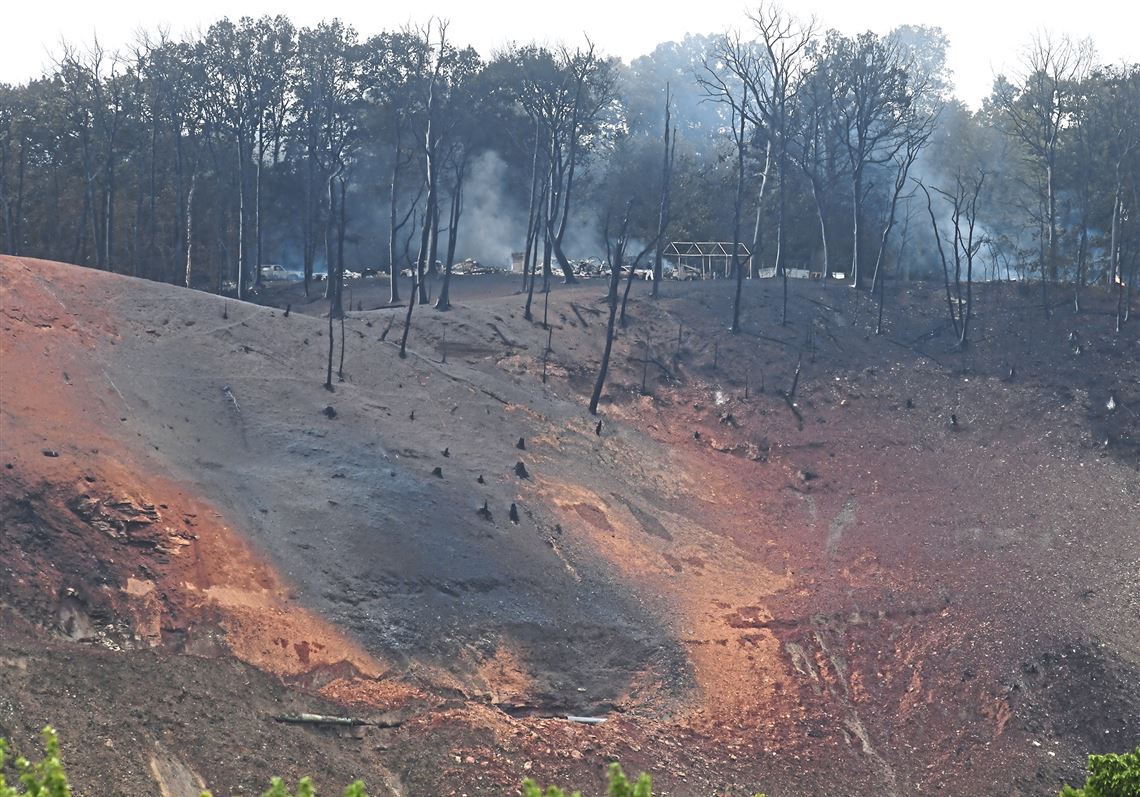
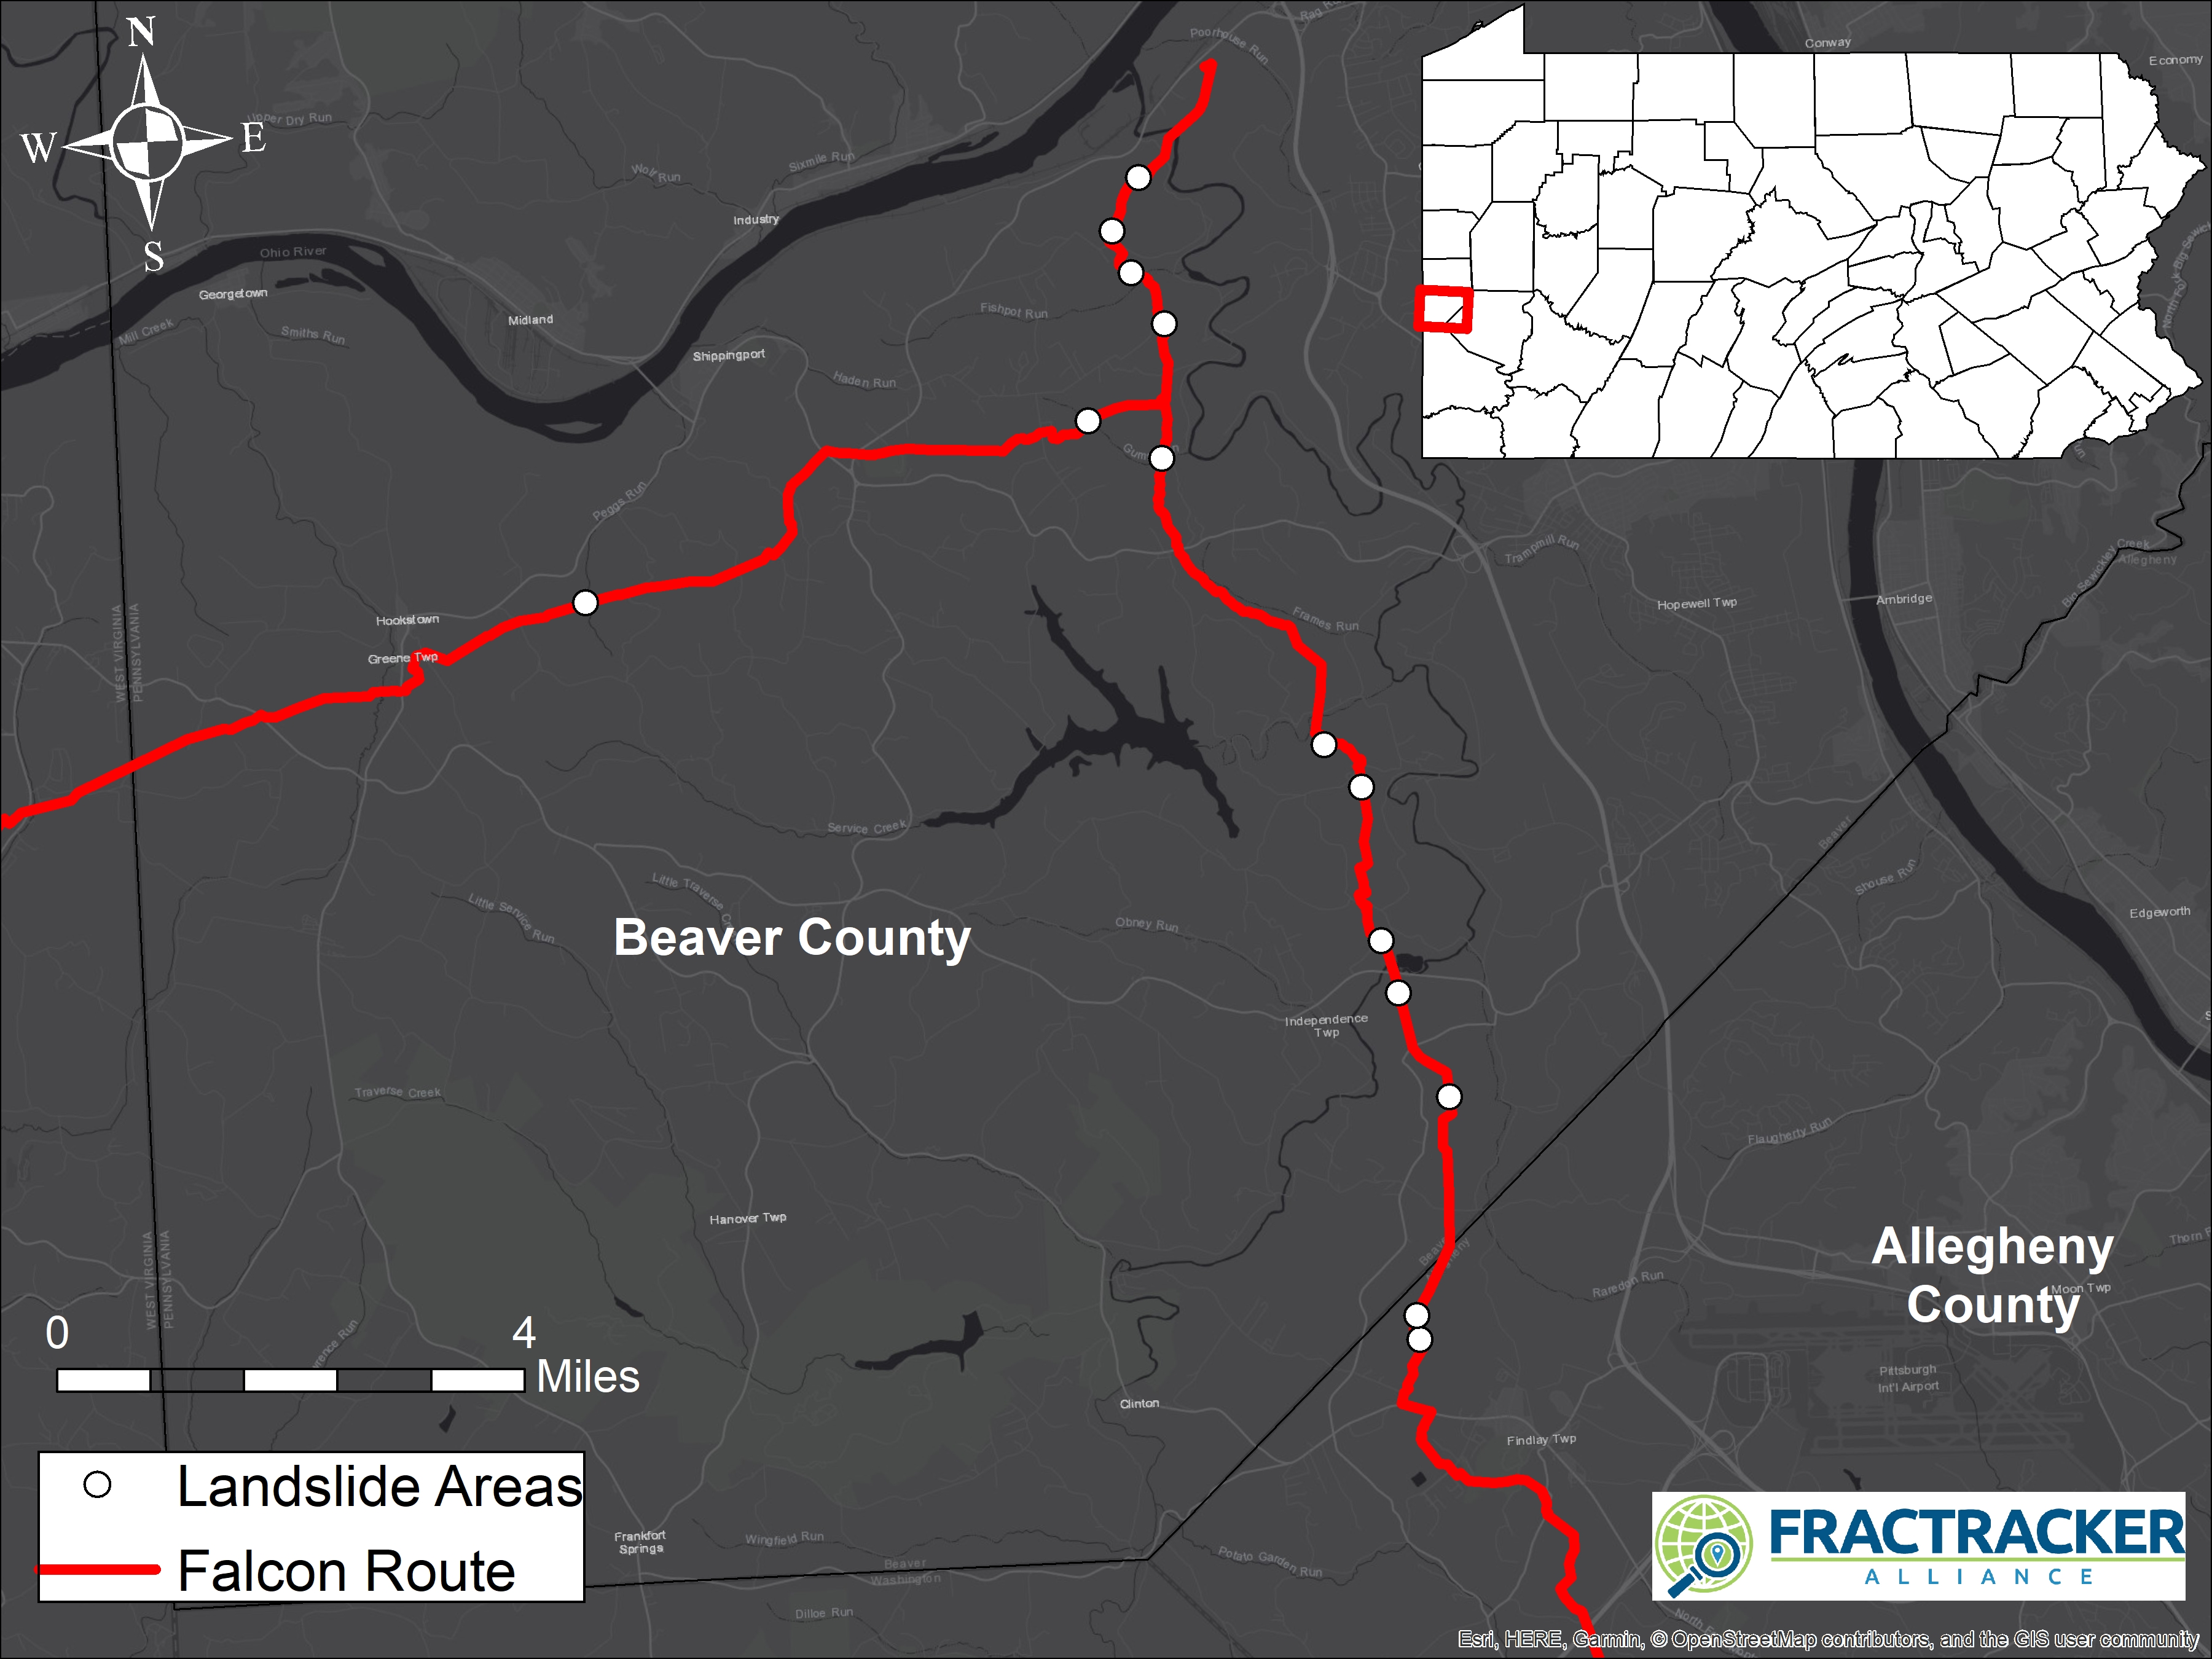

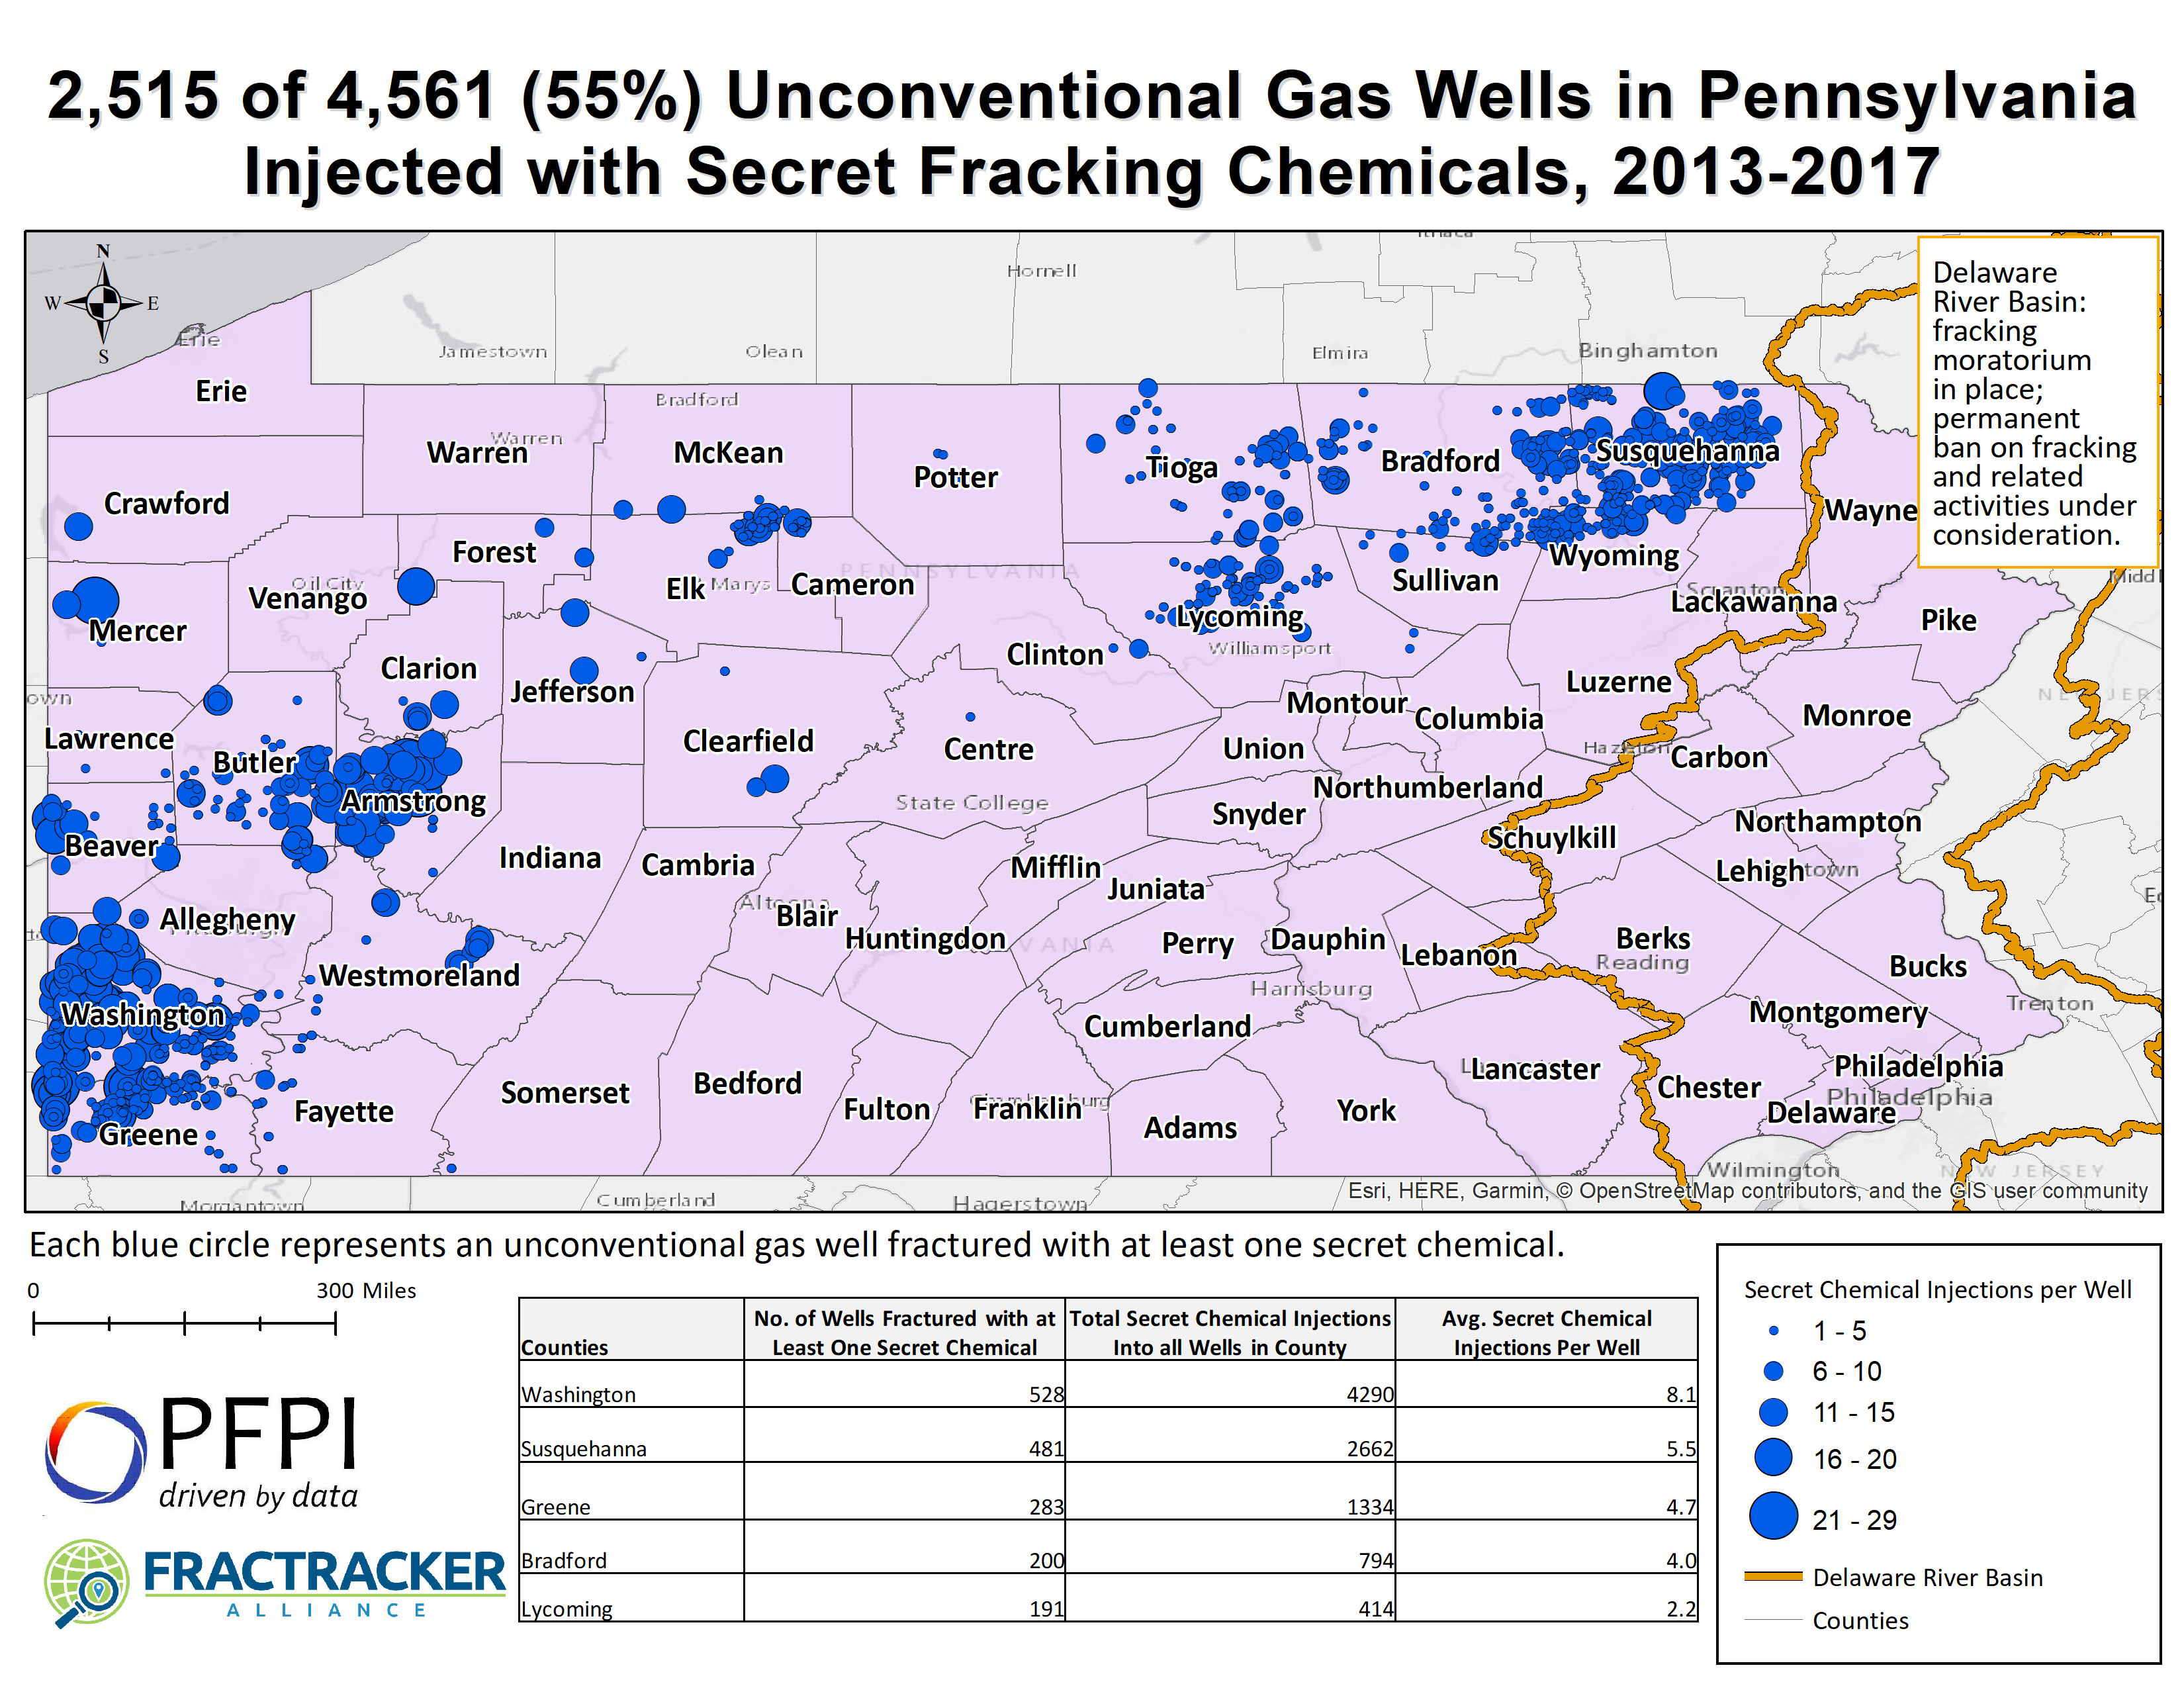

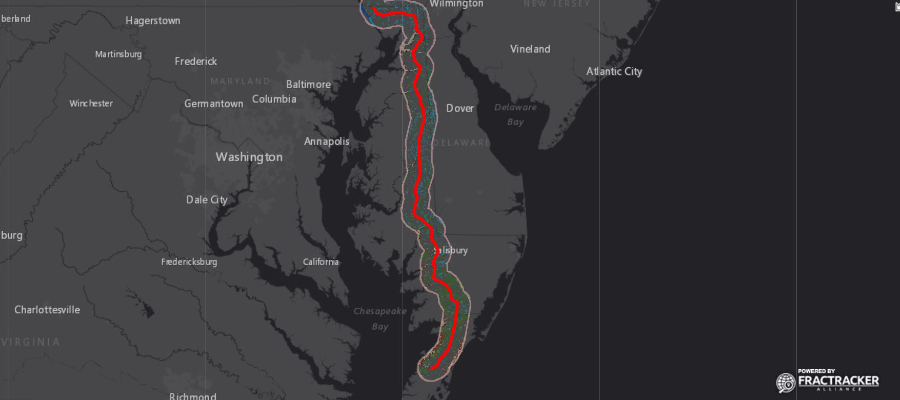
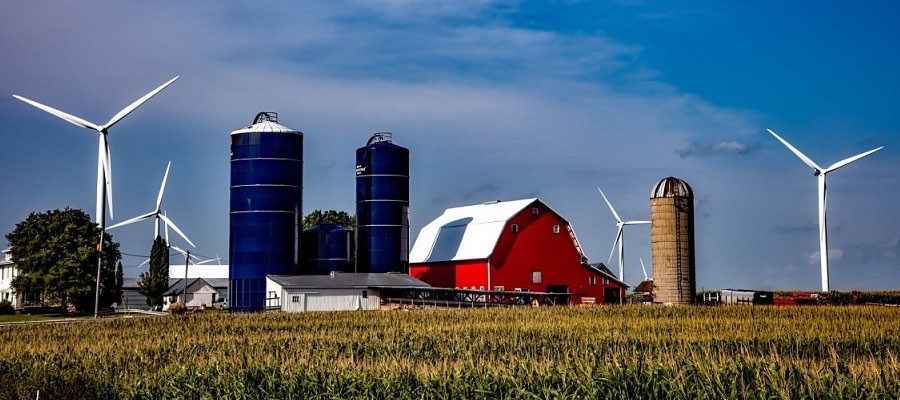
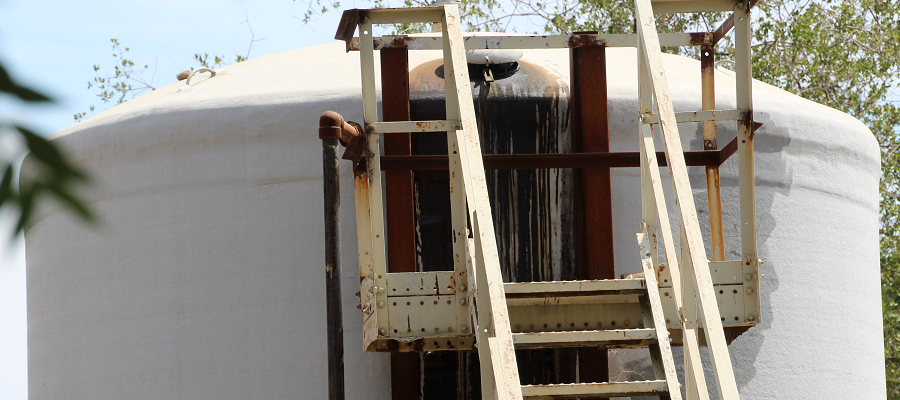
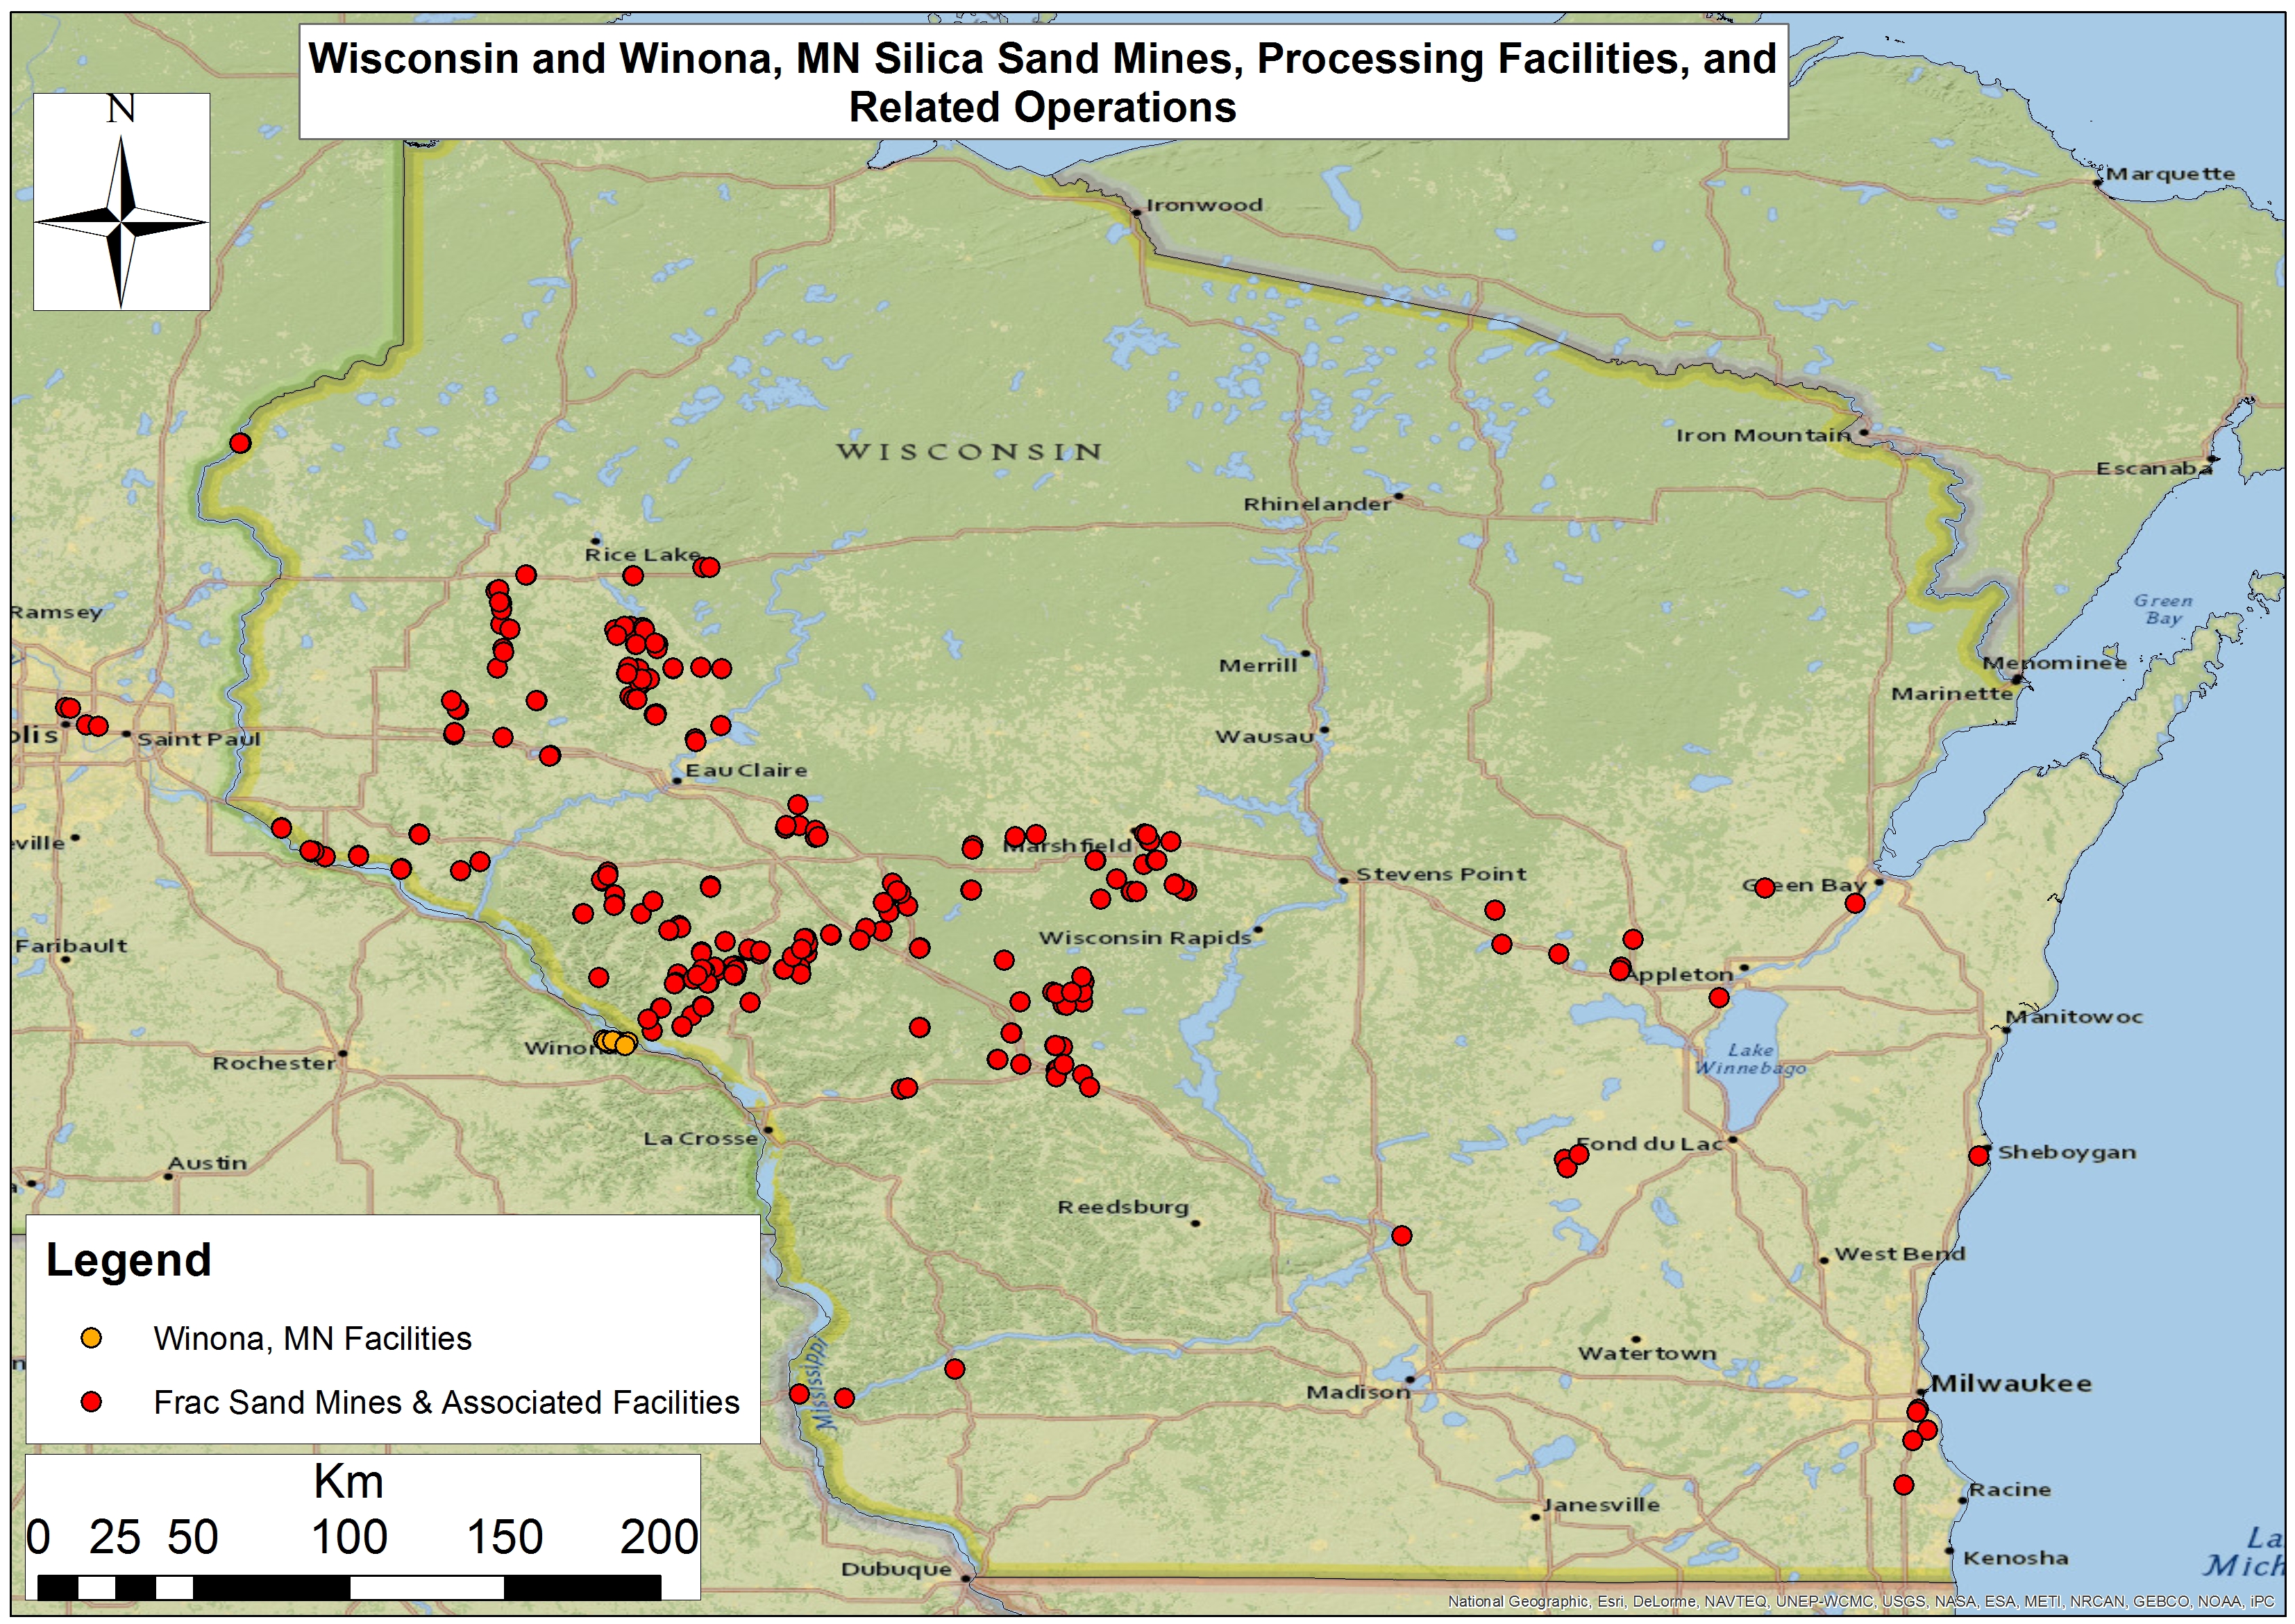
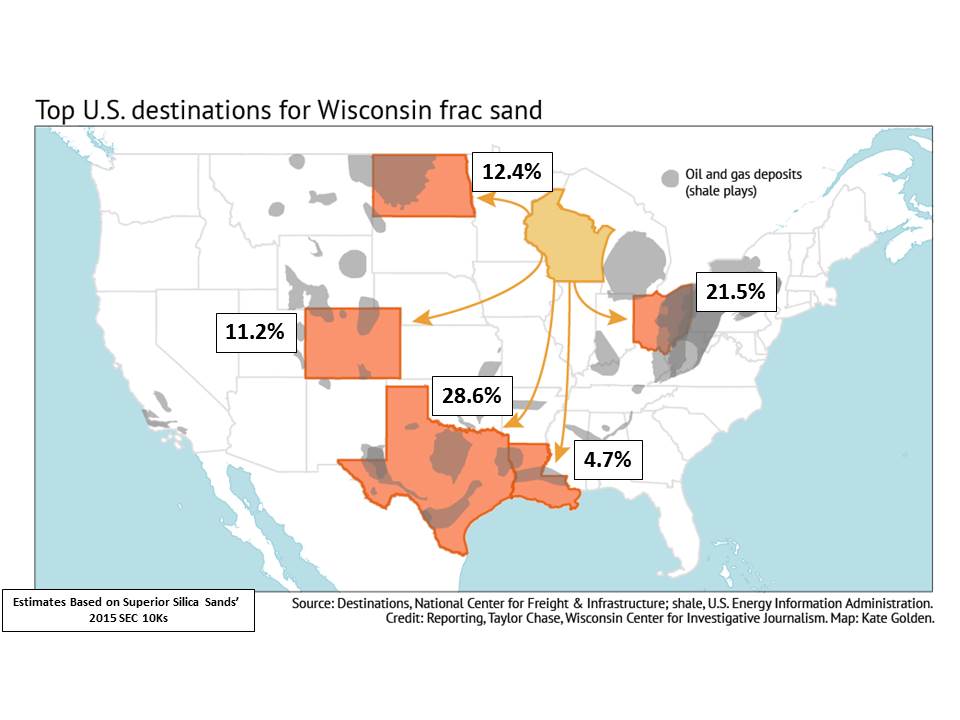
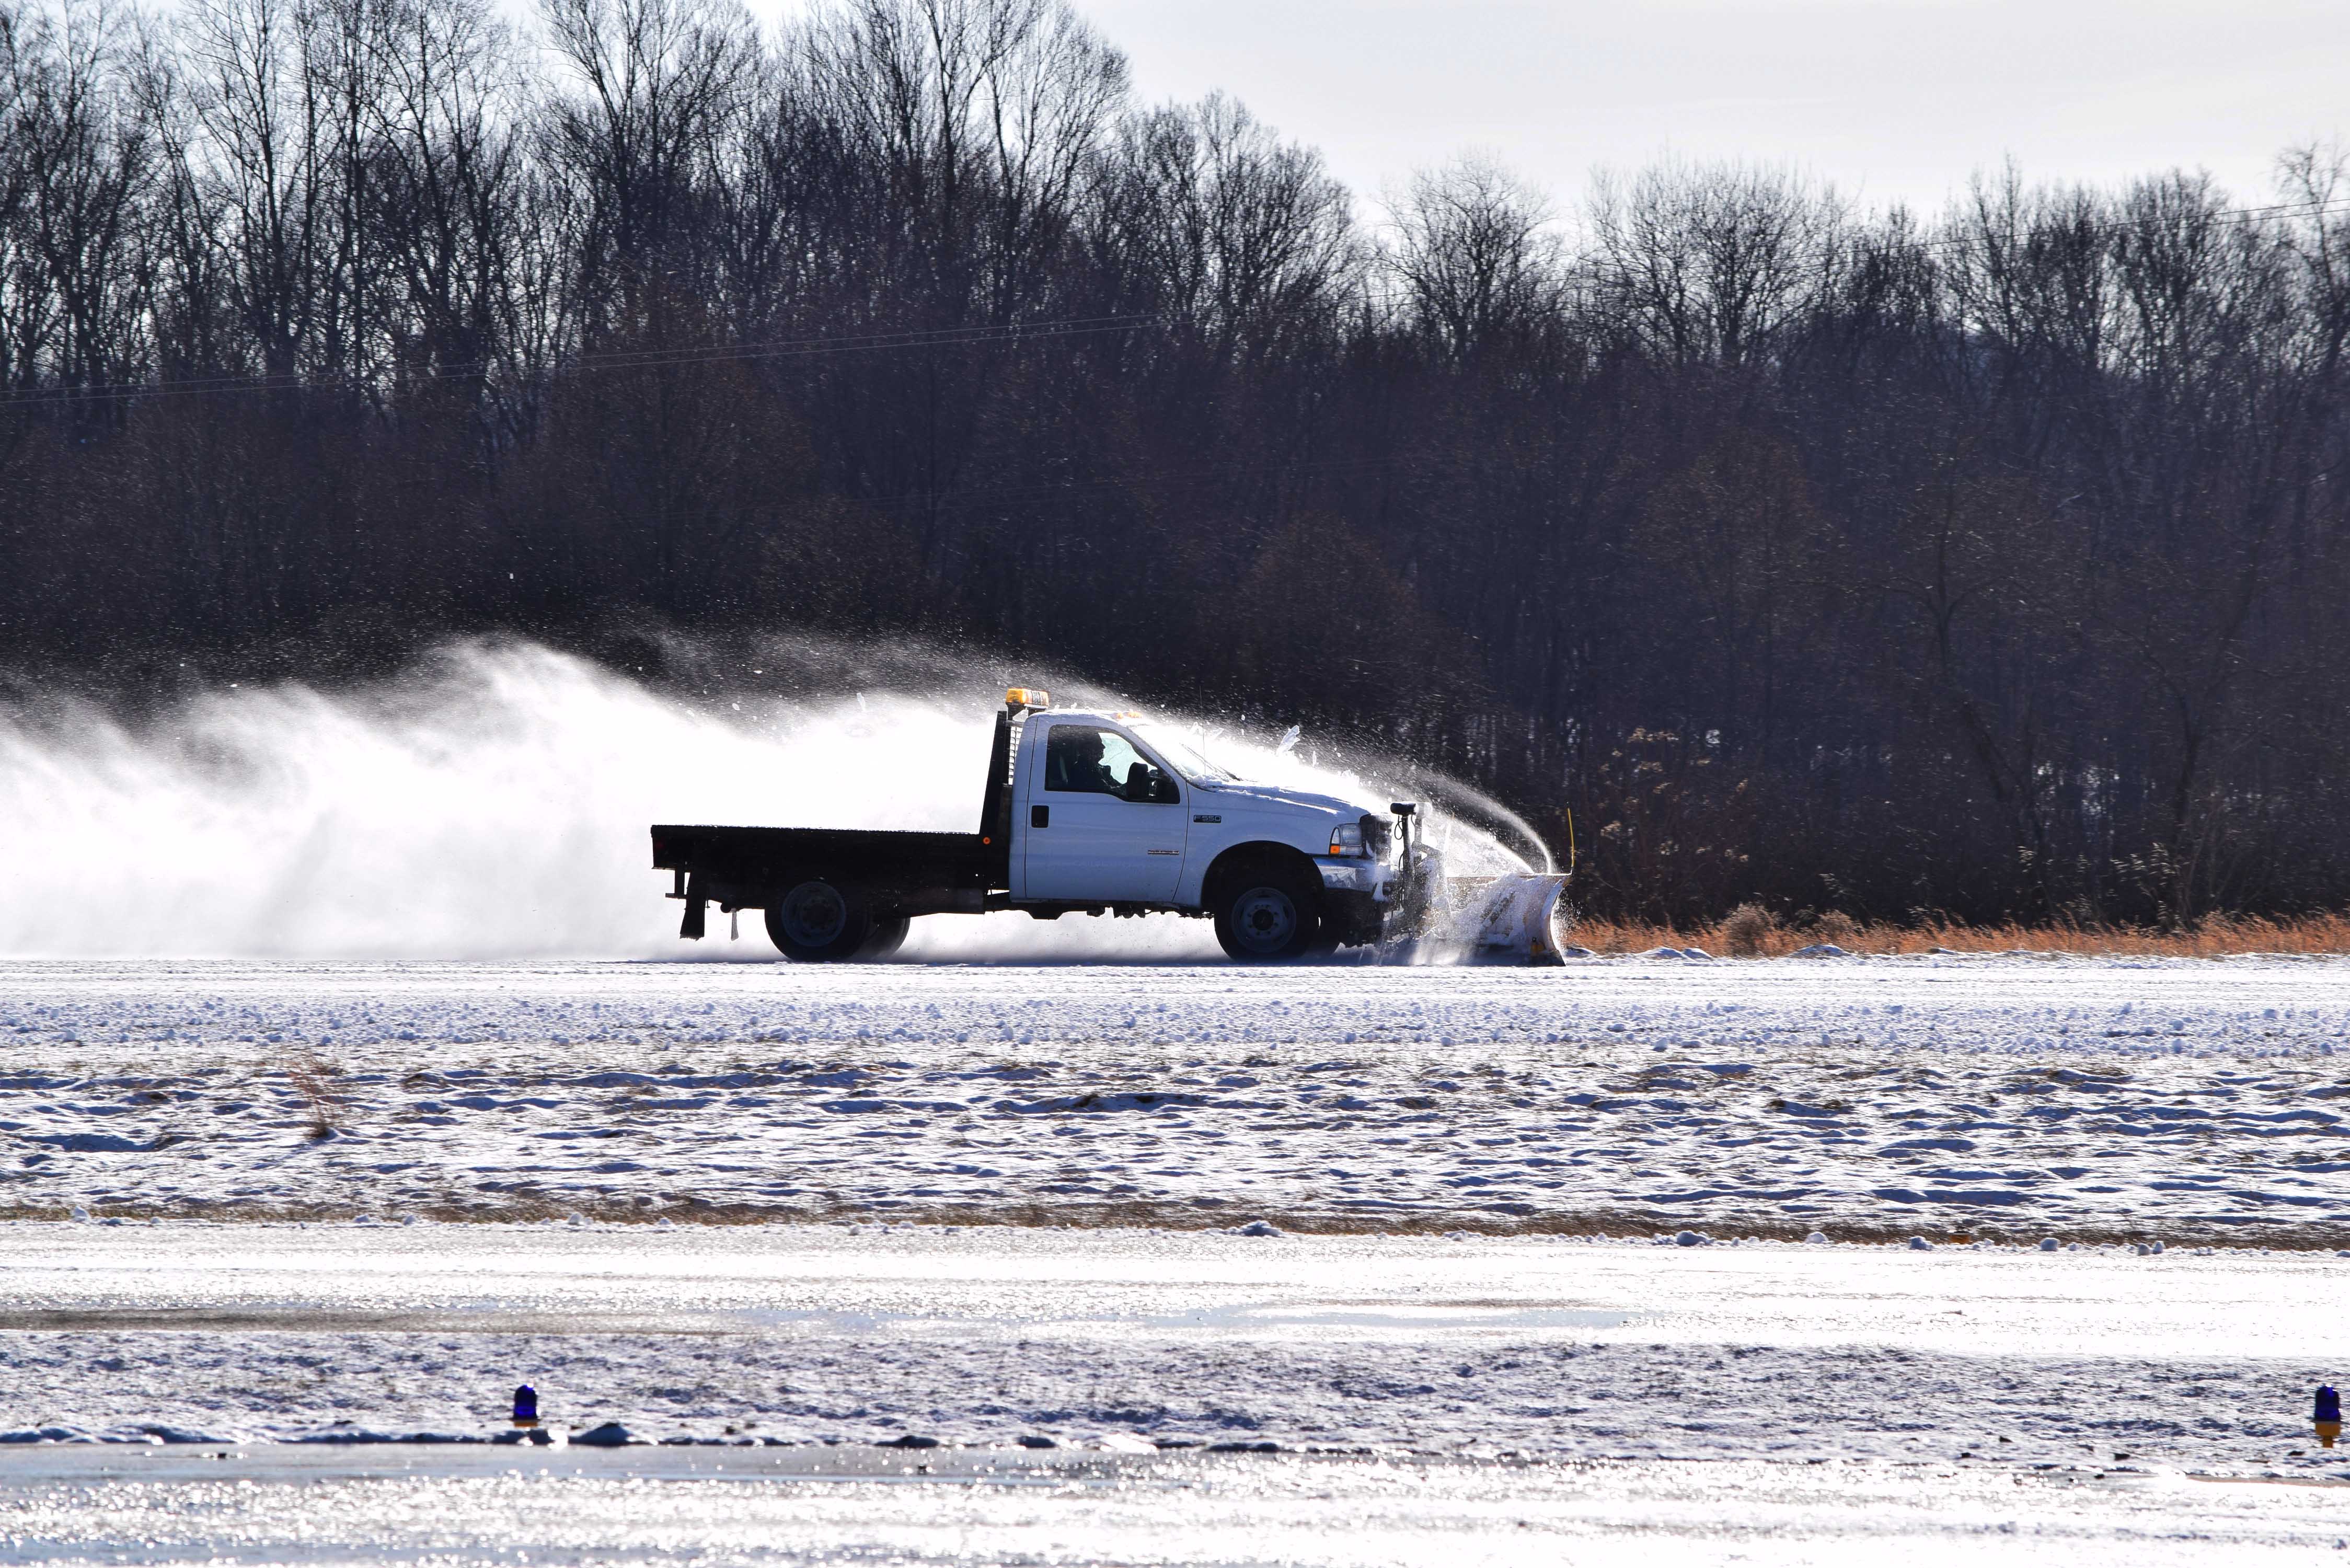
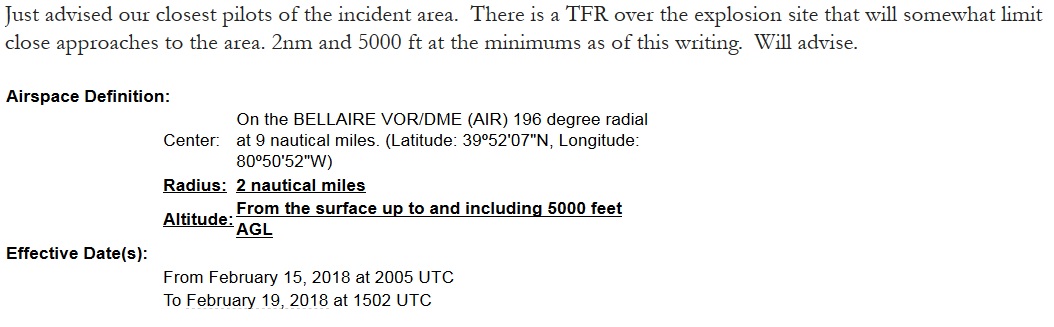

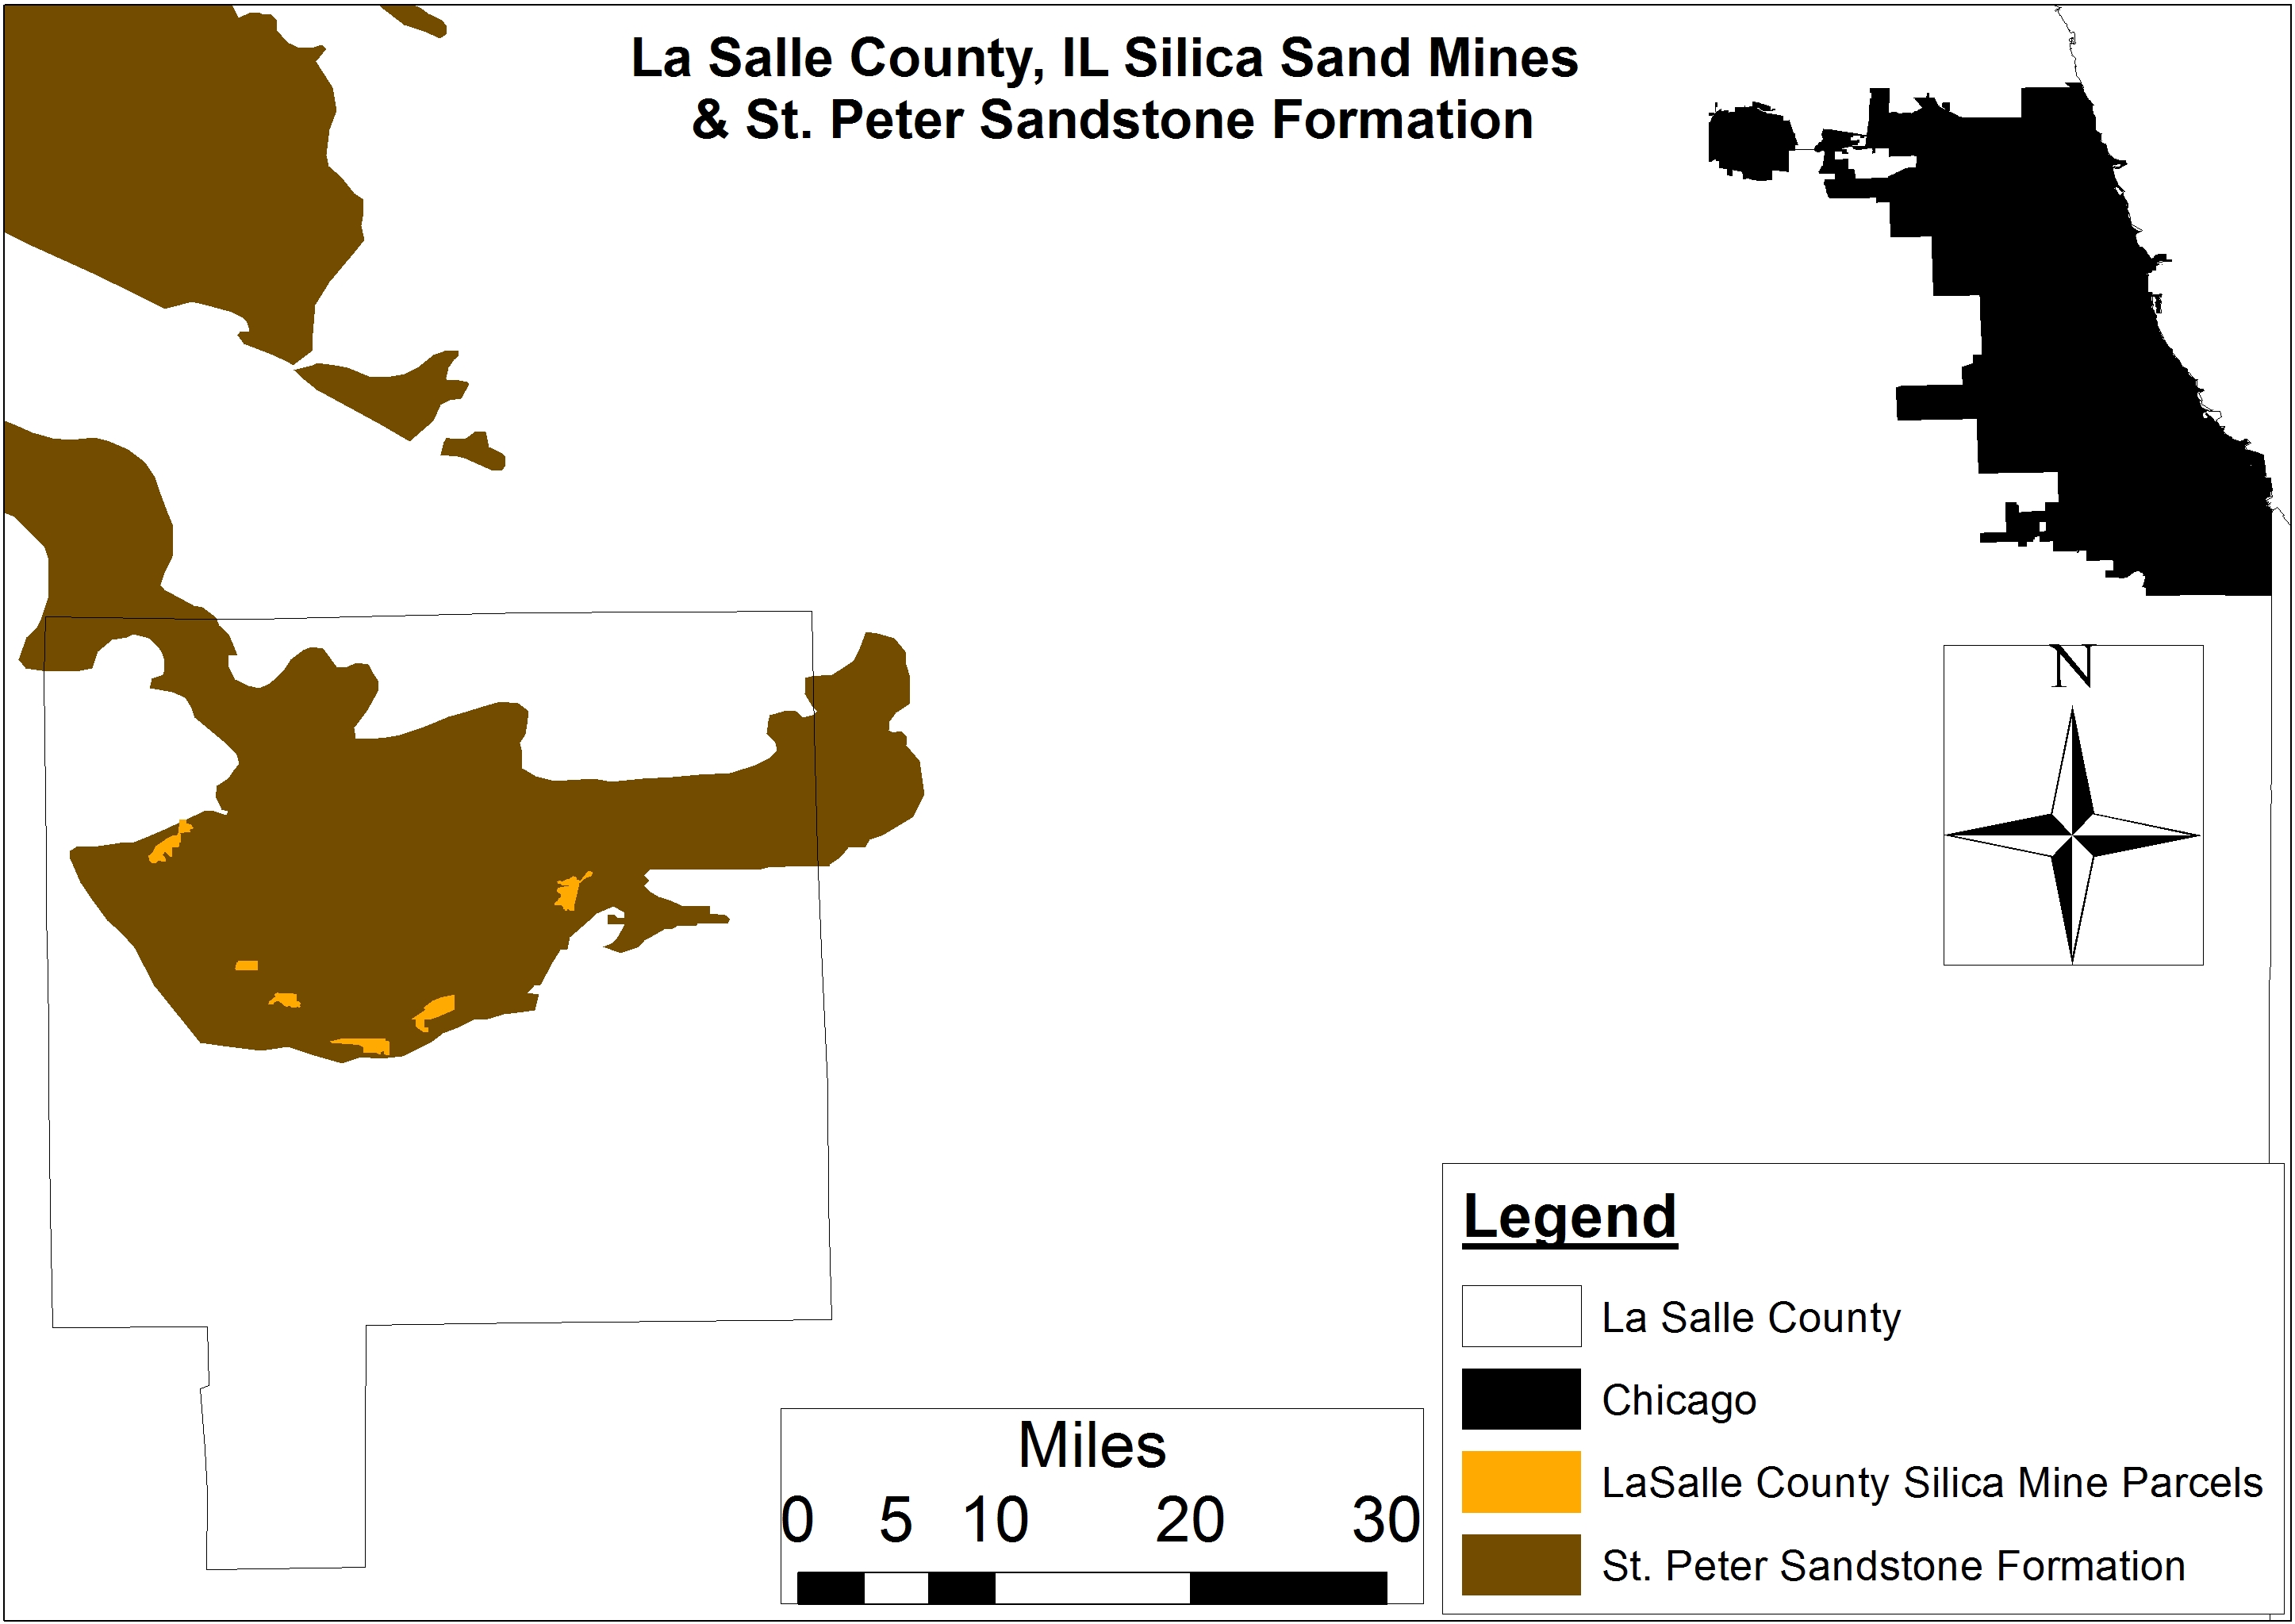


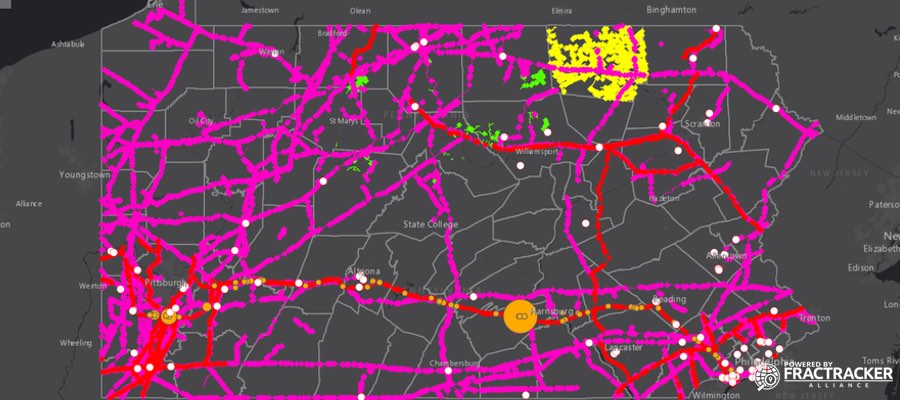
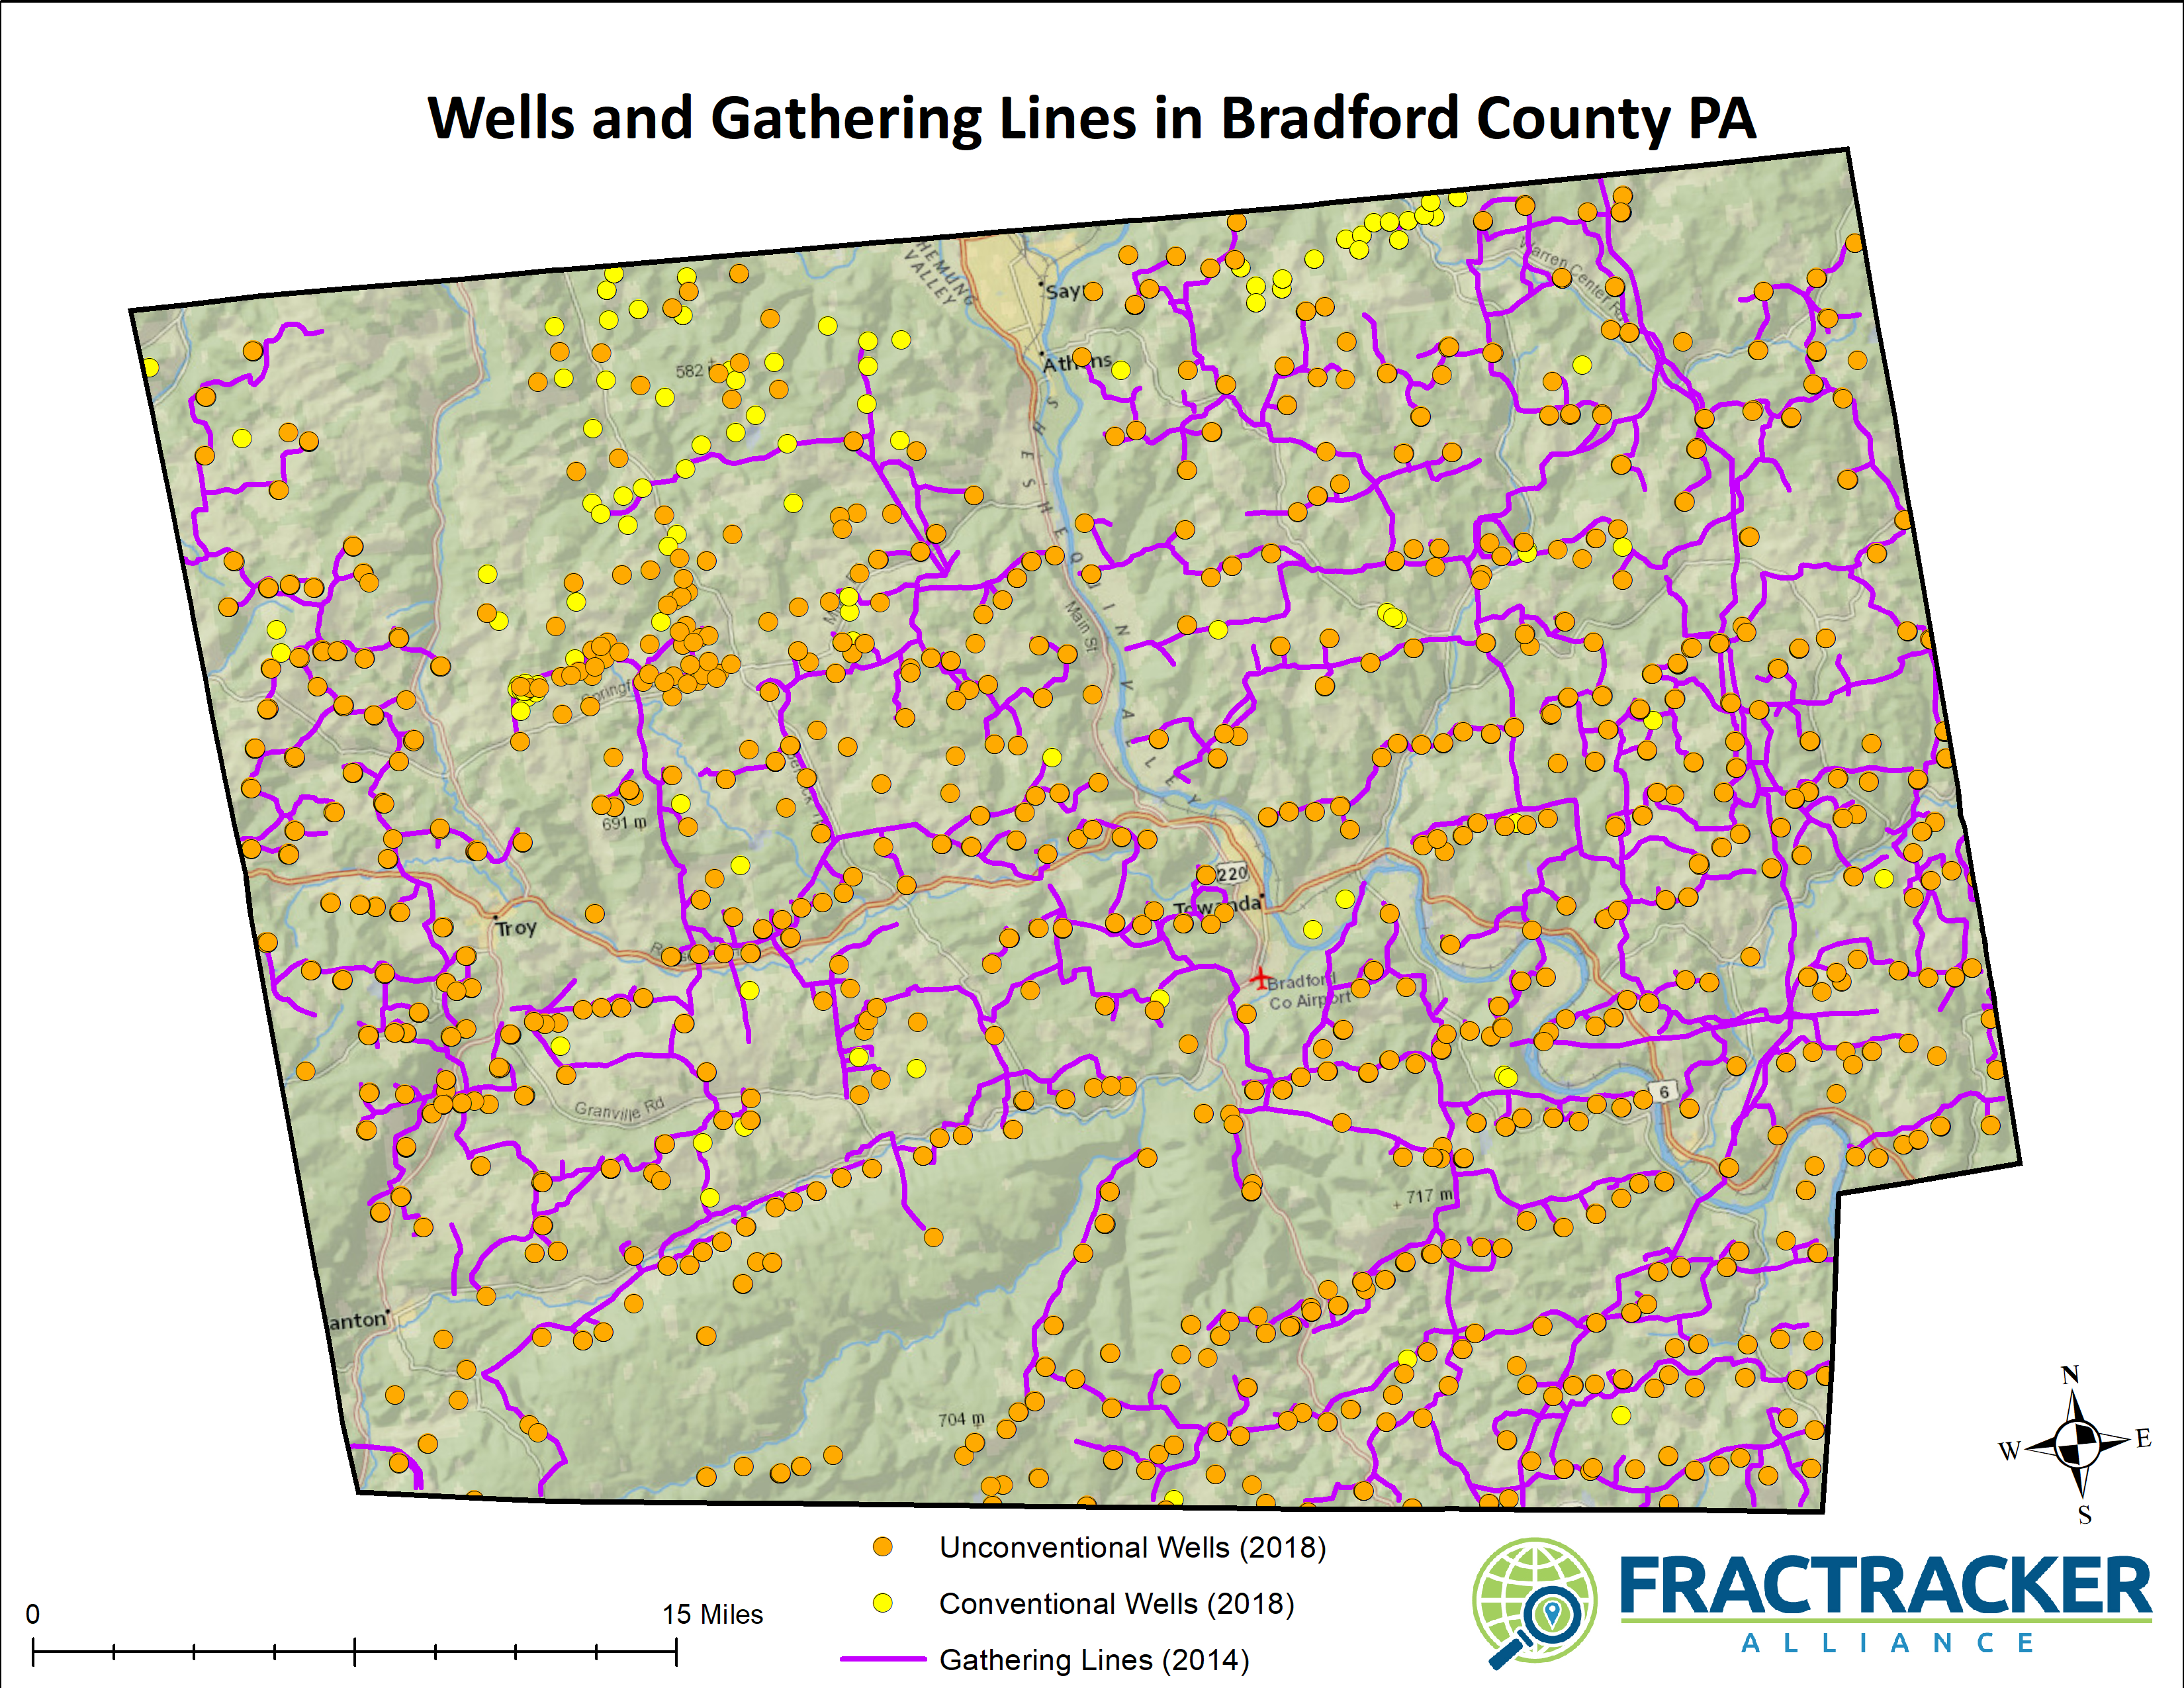
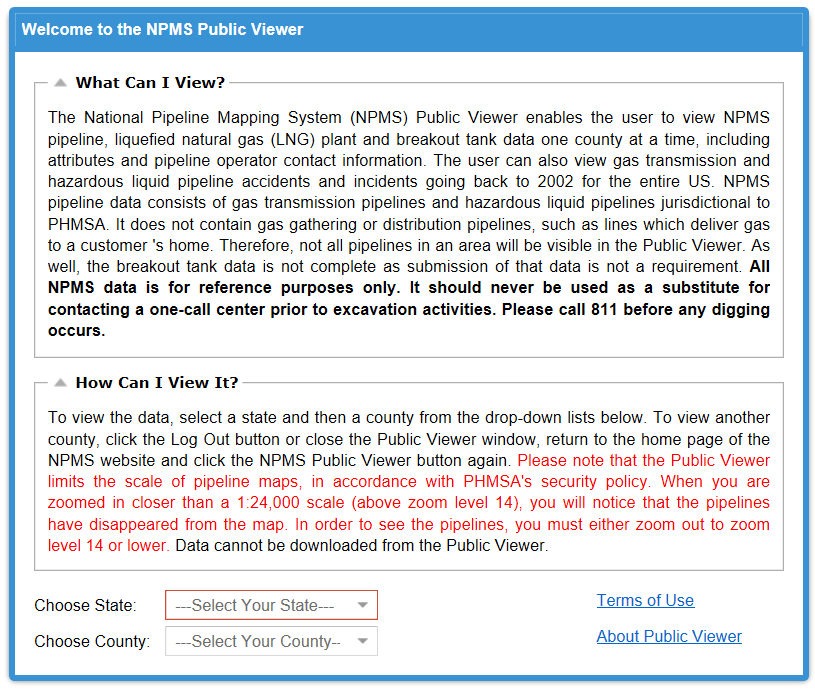
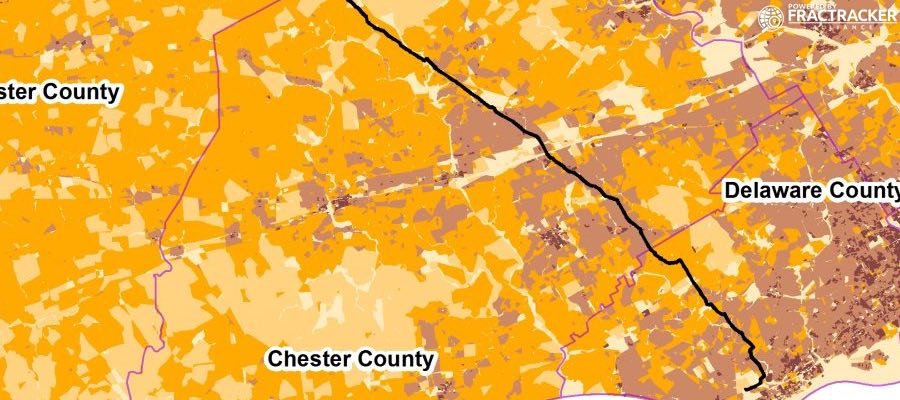
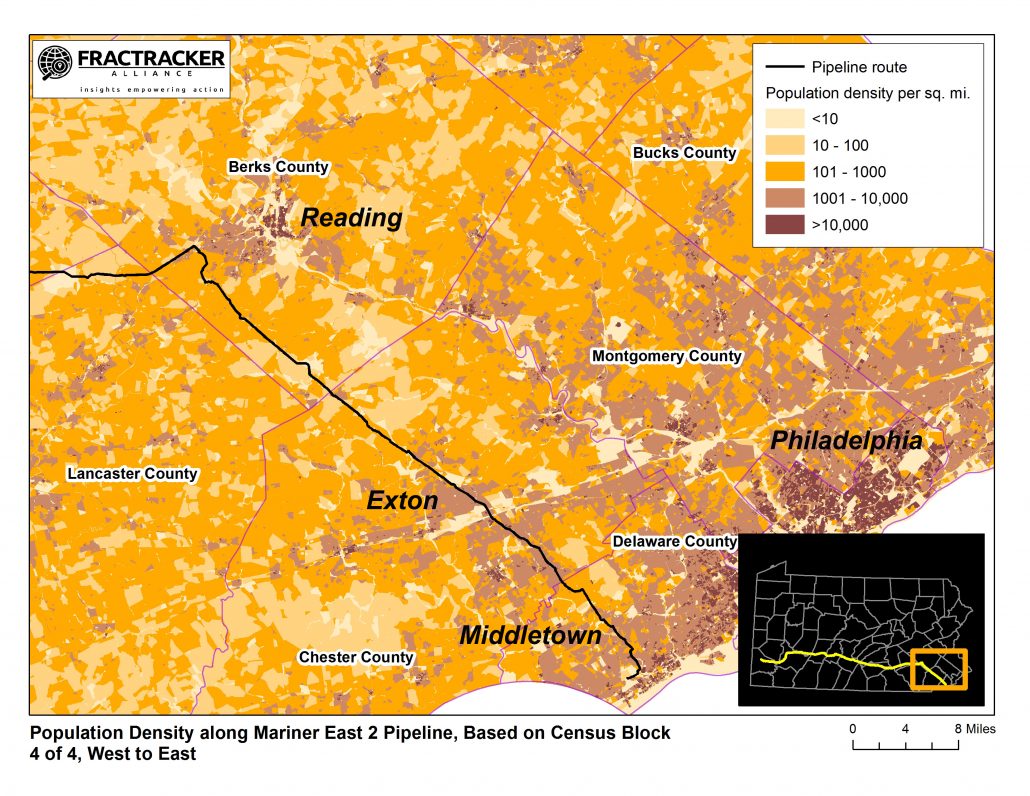
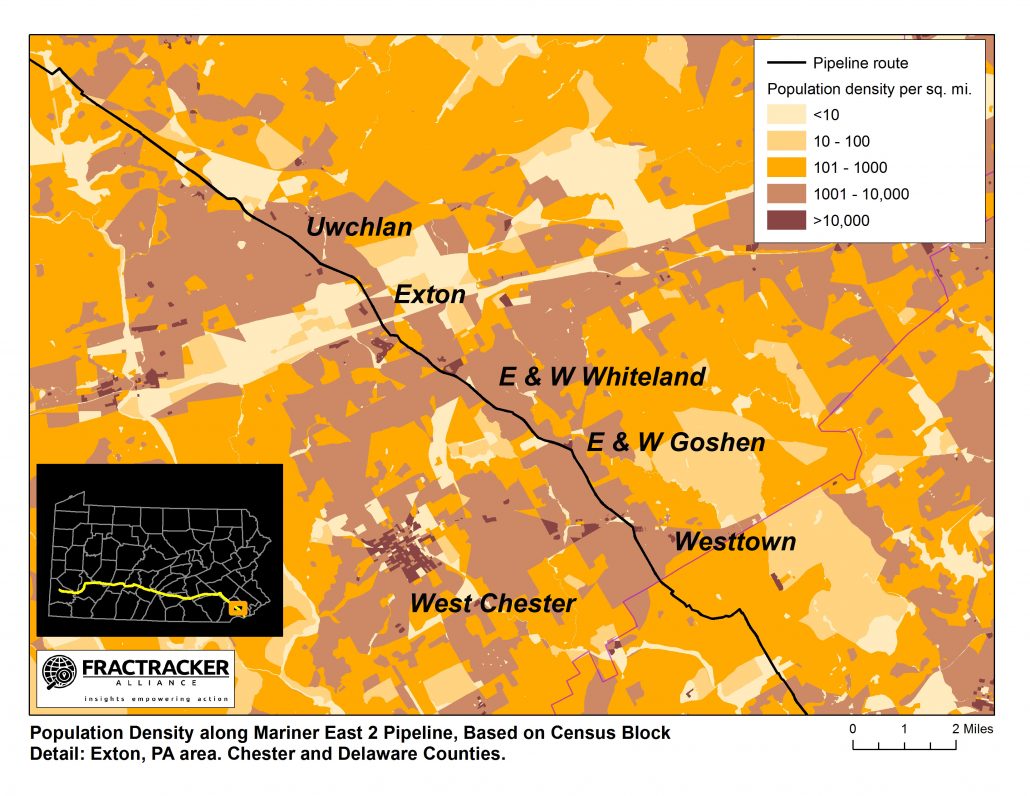


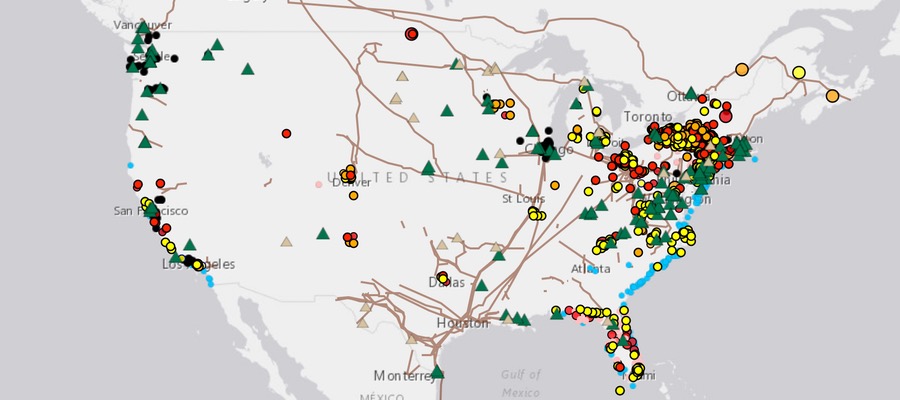
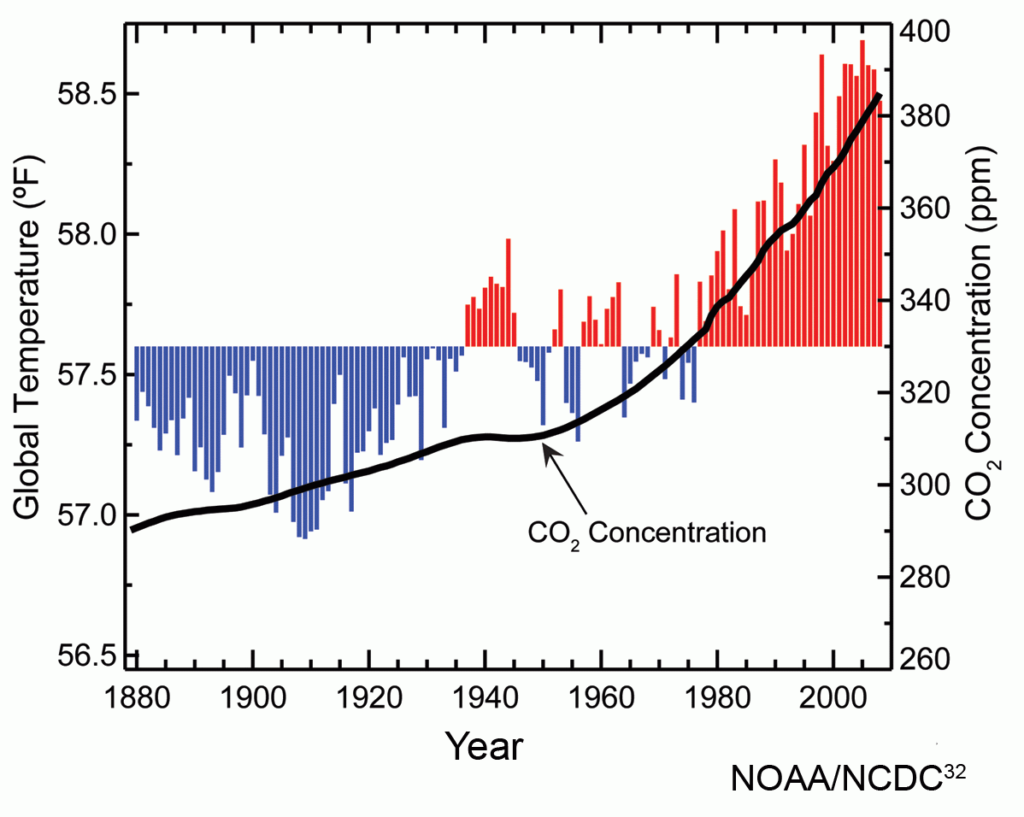
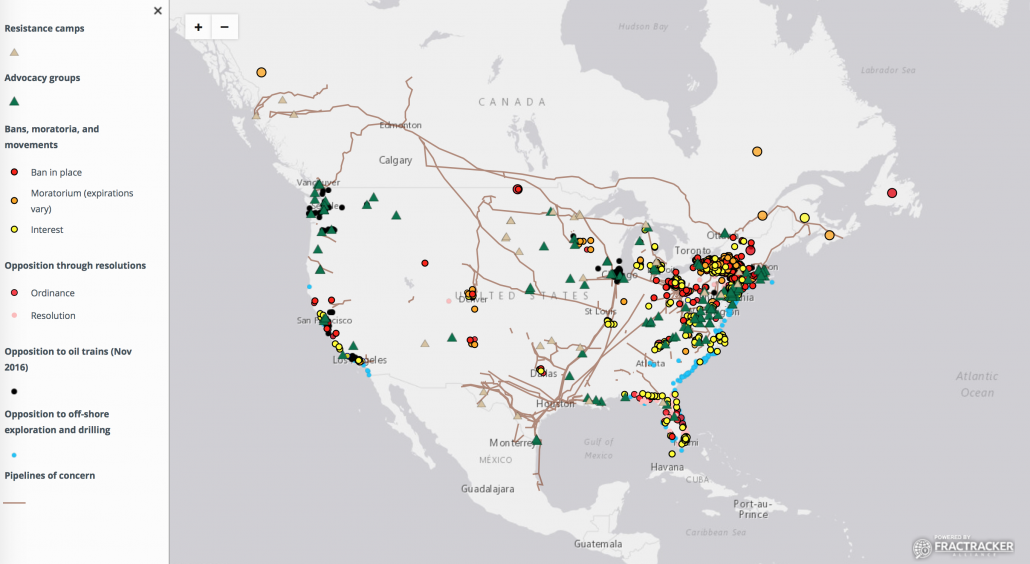
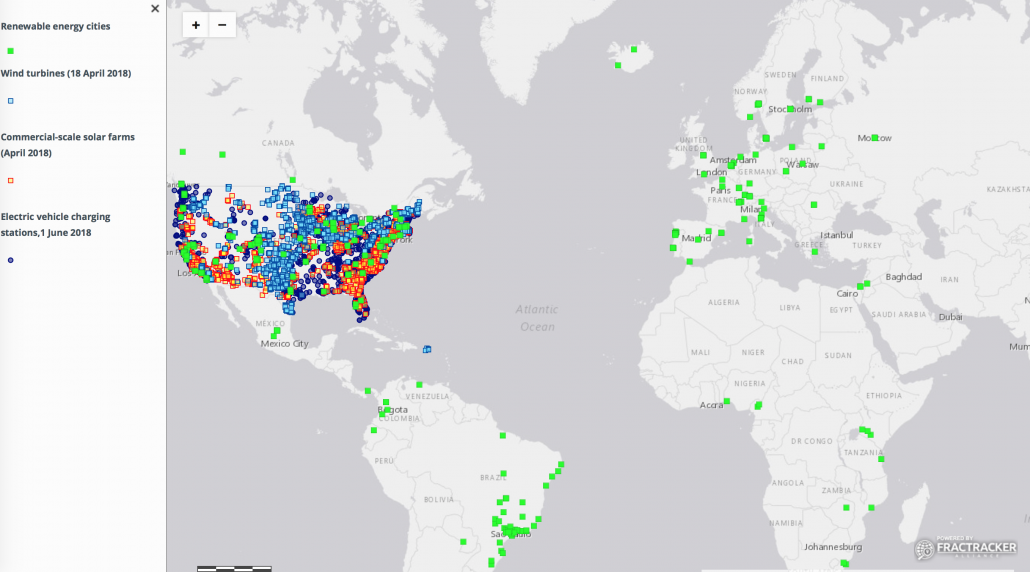
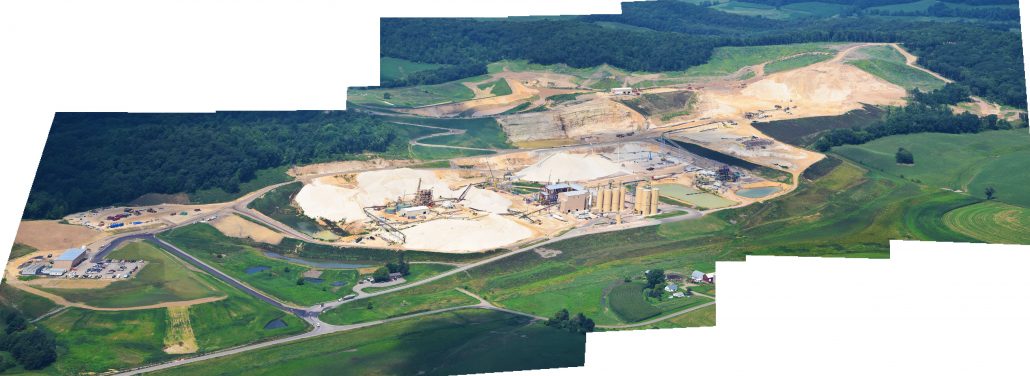
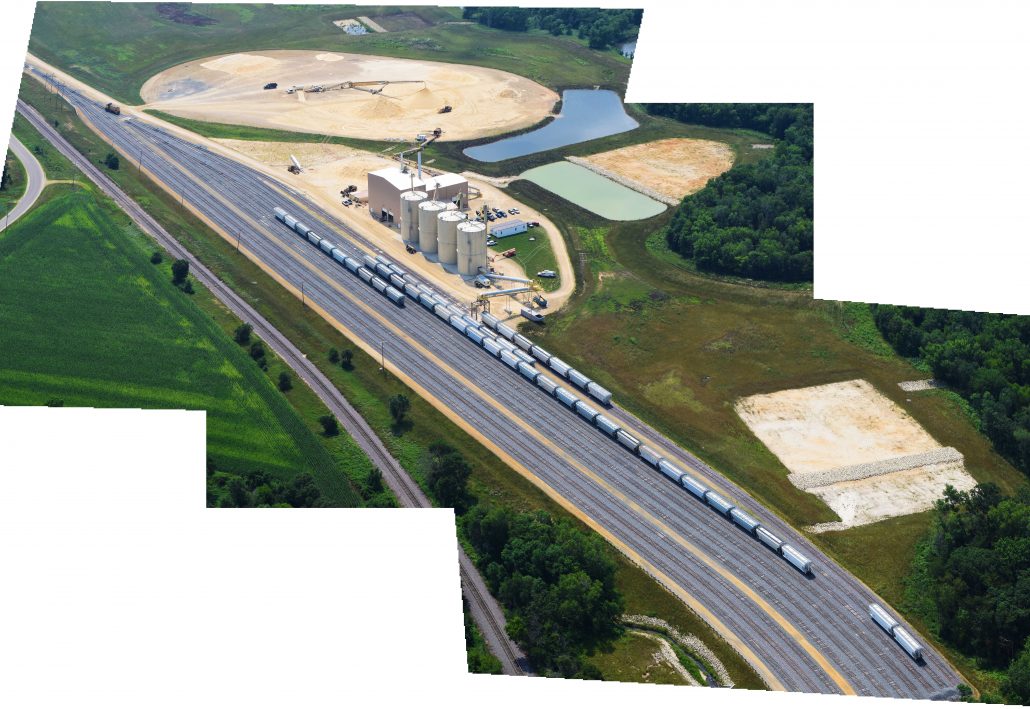
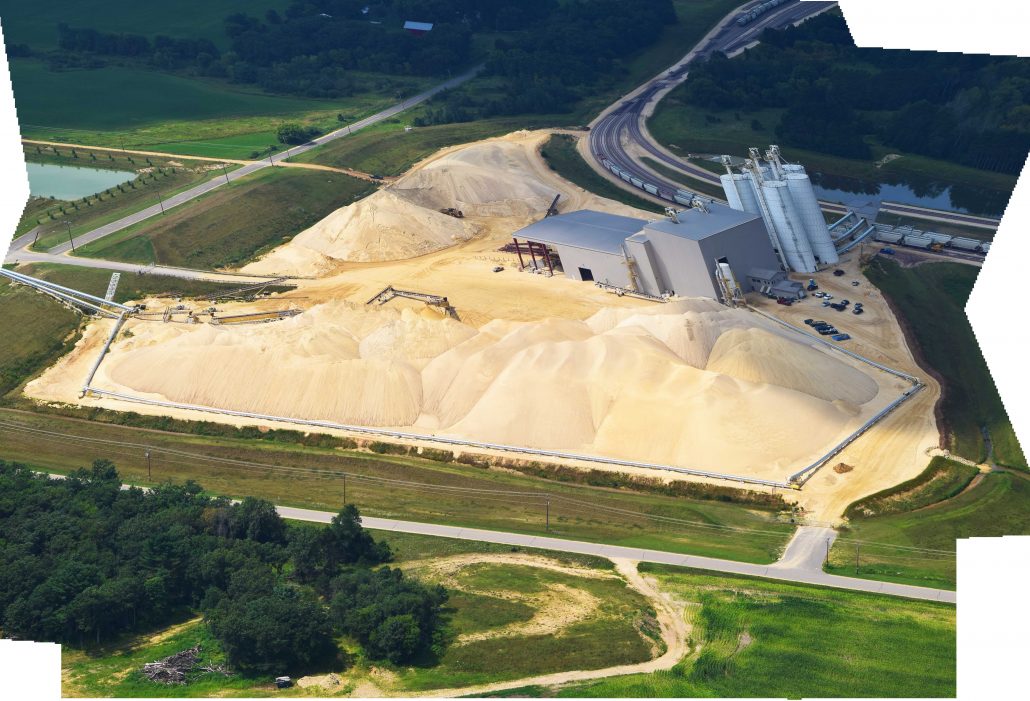
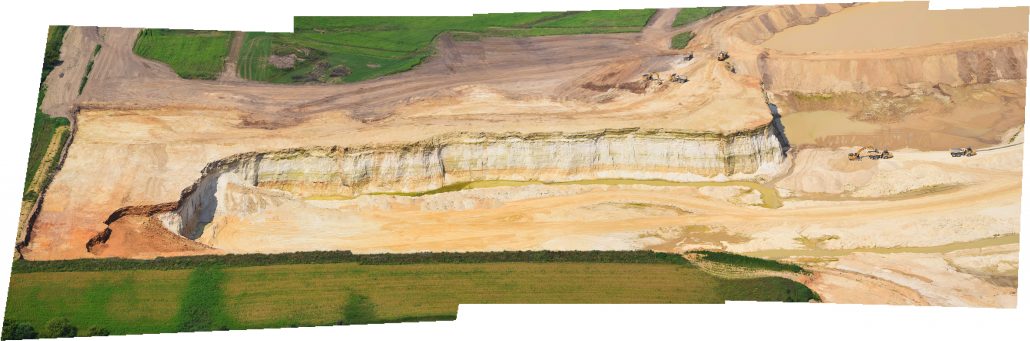
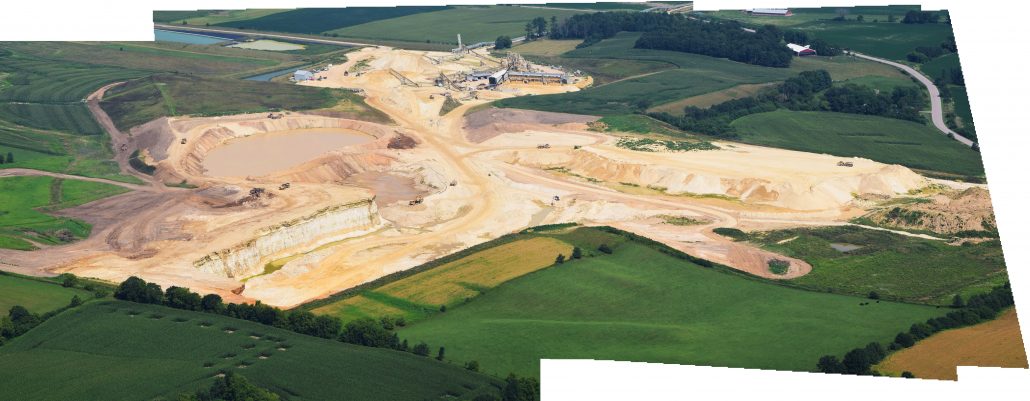
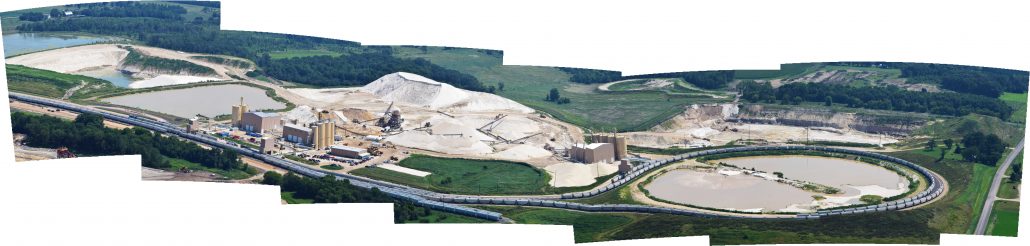
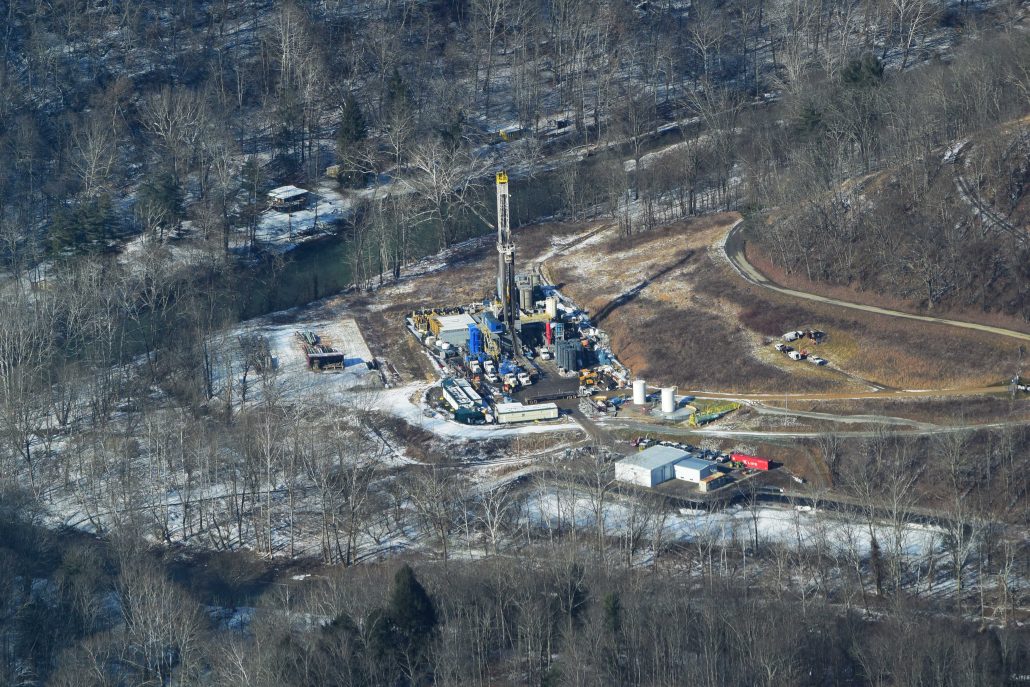
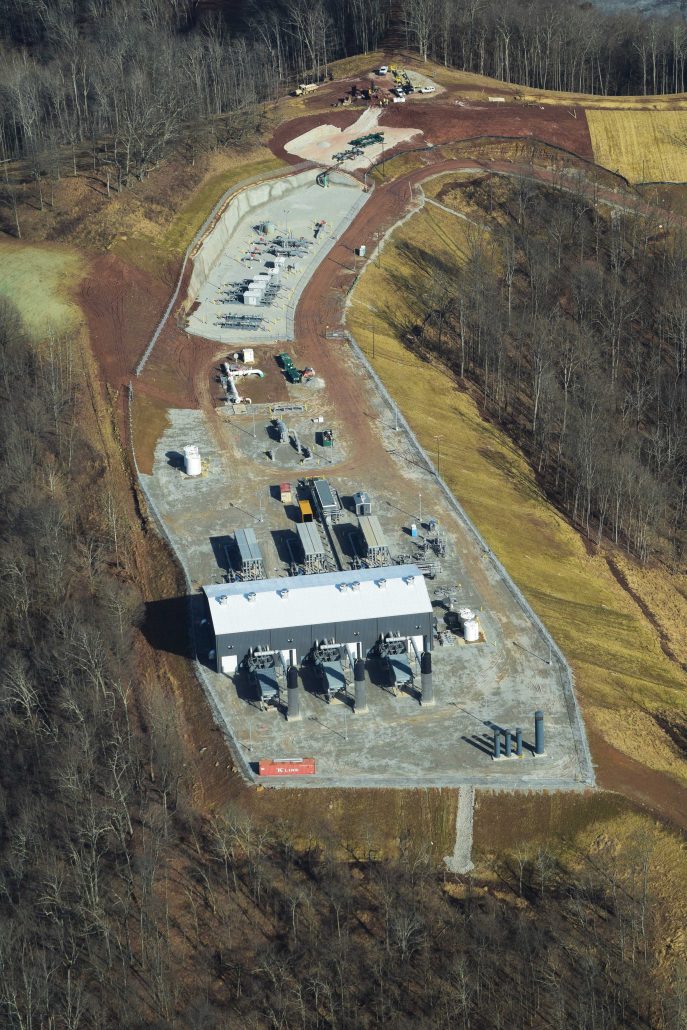
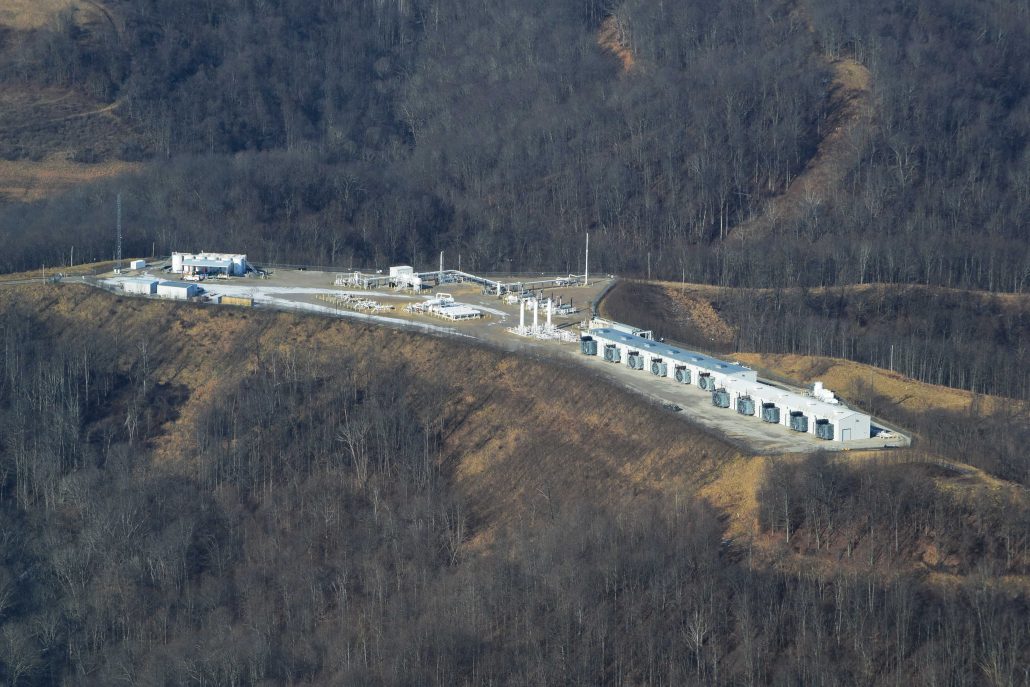
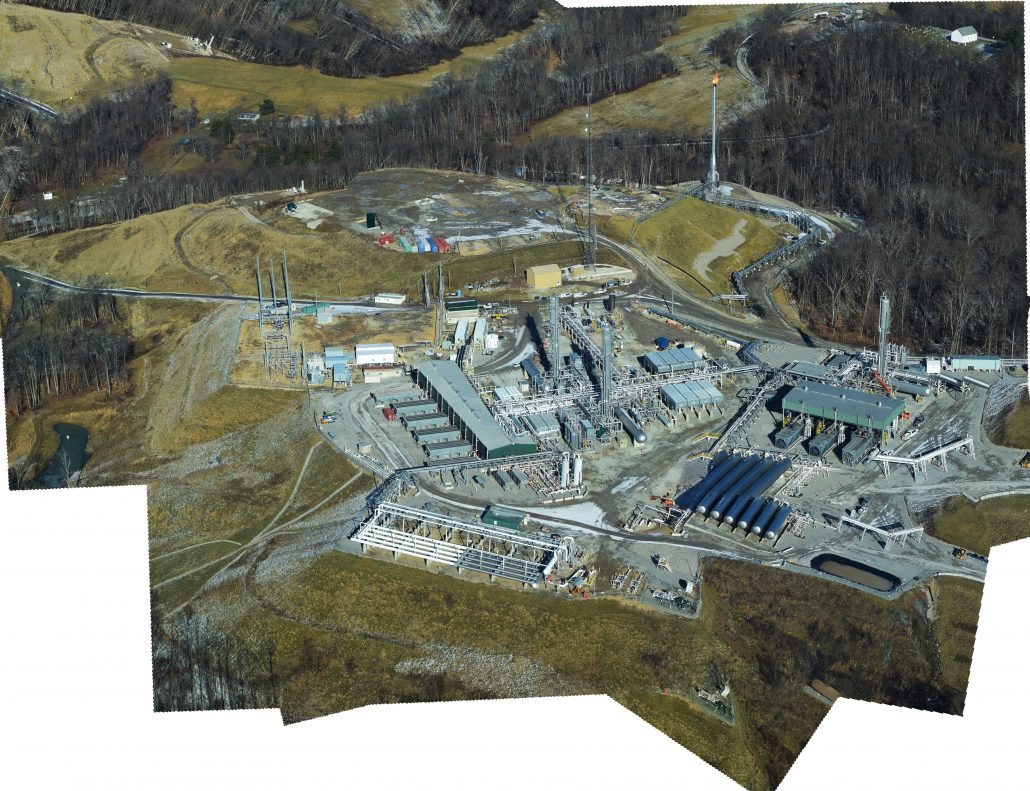
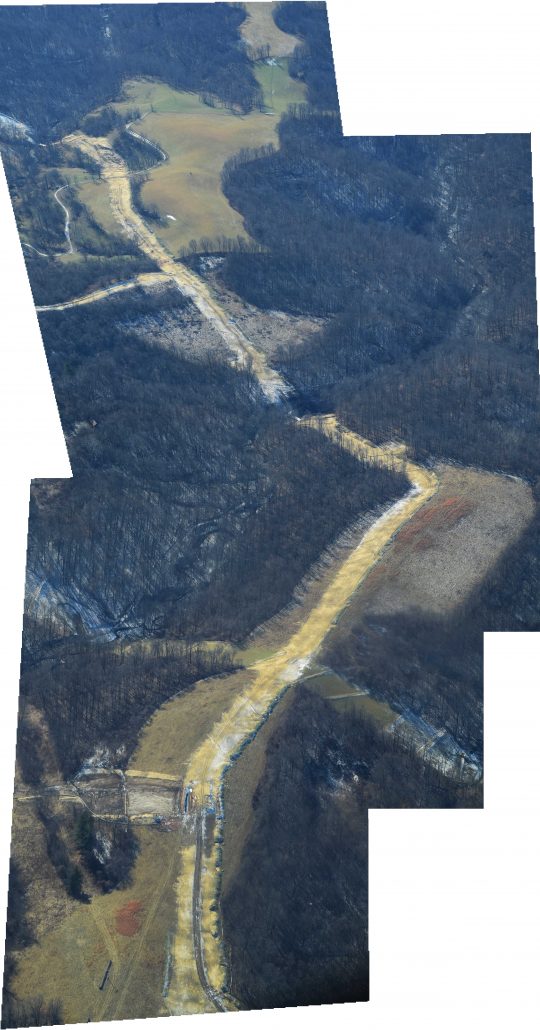
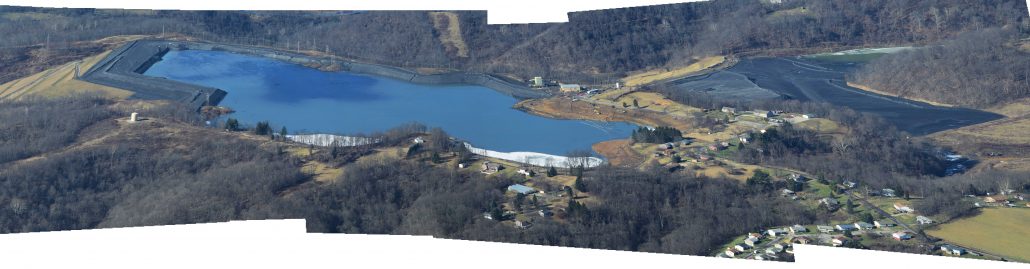