Understanding in Order to Prepare: Ethane Cracker Risk and Disclosure
By Leann Leiter and Lisa Graves Marcucci
Maps and data analysis by Kirk Jalbert
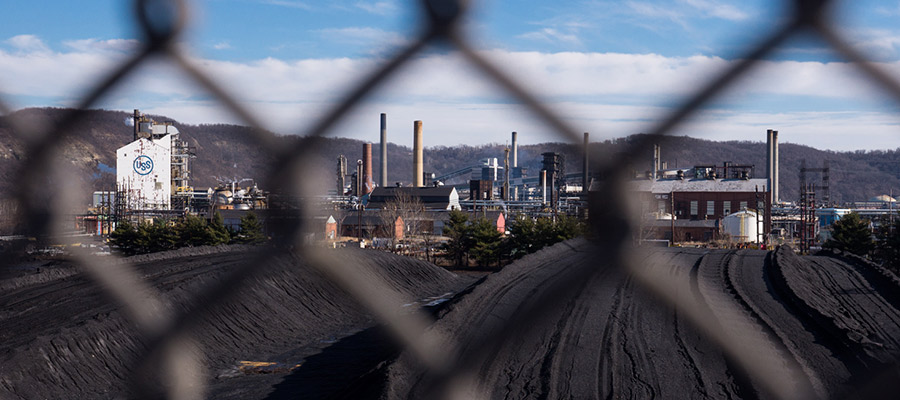
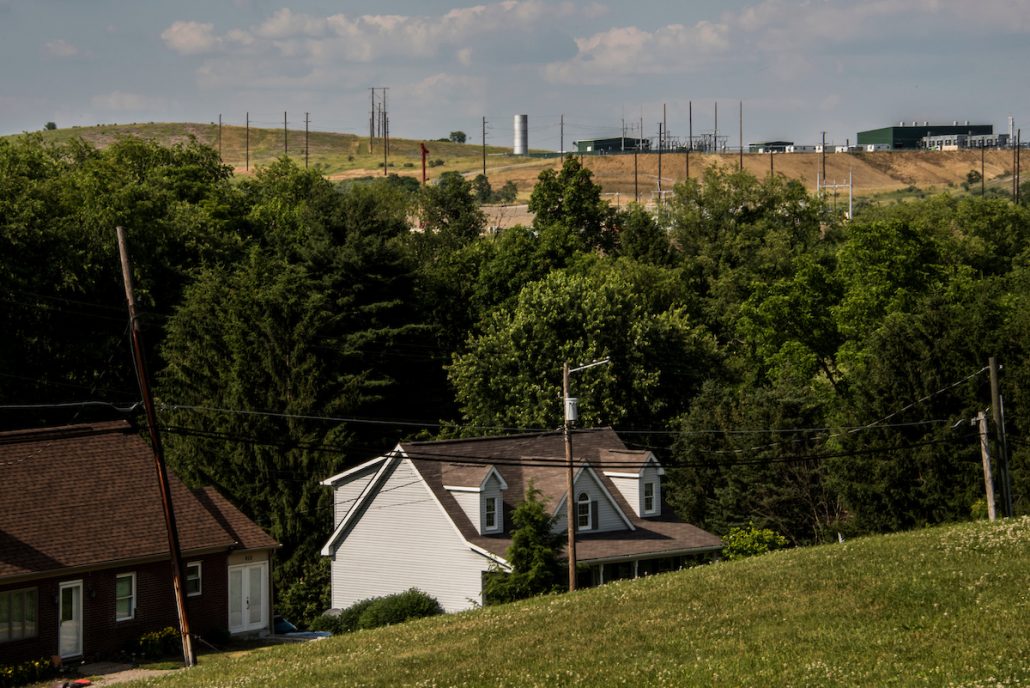
Highly industrialized operations like petrochemical plants inherently carry risks, including the possibility of large-scale disasters. In an effort to prepare, it is incumbent upon all stakeholders to fully understand the risk potential. Yet, the planned Shell ethane cracker and additional petrochemical operations being proposed for Western Pennsylvania are the first of their kind in our region. This means that residents and elected officials are without a frame of reference as they consider approving these operations. Officials find themselves tasked with reviewing and approving highly complicated permit applications, and the public remains uncertain of what questions to ask and scenarios to consider. Often overlooked in the decision-making process is valuable expertise from local first responders like police, fire and emergency crew members, HAZMAT teams, and those who protect vulnerable populations, like emergency room personnel, nursing home staff, and school officials.
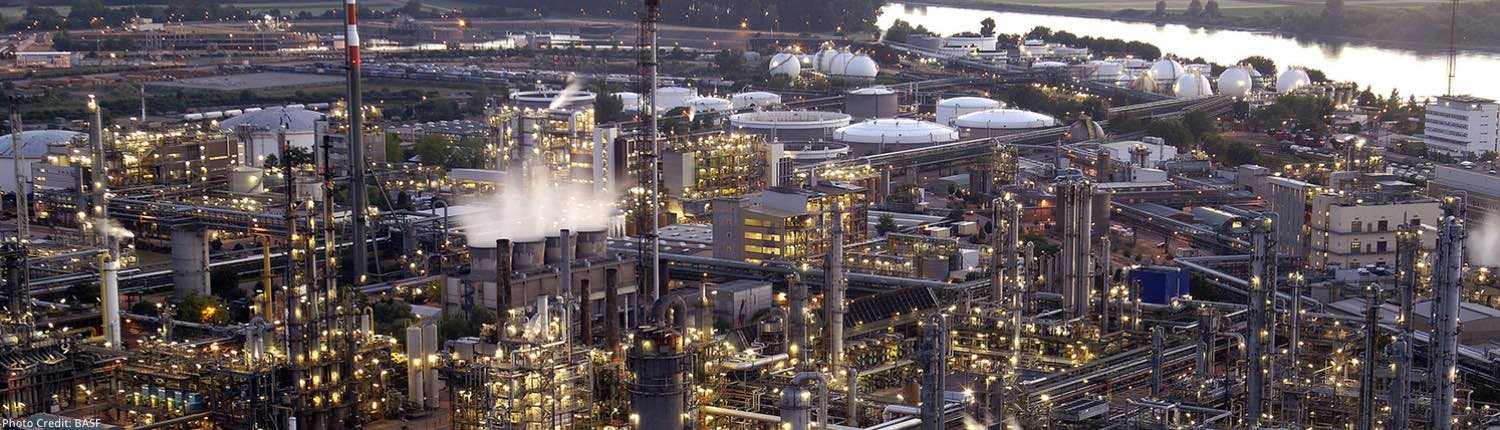
Example of cracker producing ethylene, located at BASF’s Ludwigshafen site. Photo credit: BASF
In the first article in this series , we tried to identify the known hazards associated with ethane crackers. In this article, we look more closely at how that risk could play out in Beaver County, PA and strive to initiate an important dialogue that invites valuable, local expertise.
In keeping with the first article in this series, we use the terms vulnerability and capacity. Vulnerability refers to the conditions and factors that increase the disaster impact that a community might experience, and capacity consists of the strengths that mitigate those impacts. Importantly, vulnerability and capacity frequently intertwine and overlap. We might, for example, consider a fire station to be a site of “capacity,” but if it lies within an Emergency Planning Zone (discussed more below), an explosion at the plant could render it a vulnerability. Likewise, “vulnerable” populations such as the elderly may have special skills and local knowledge, making them a source of capacity.
Emergency Planning: Learning from Louisiana
FracTracker got in touch with the Emergency Operations Center (EOC) in St. Charles Parish, Louisiana, to learn how a community already living with Shell-owned and other petrochemical facilities manages risk and disclosure. The Emergency Manager we spoke with explained that they designate a two- and a five-mile area around each new facility in their jurisdiction, like ethane crackers, during their emergency planning process. They call these areas “ emergency planning zones ” or EPZs, and they maintain records of the vulnerabilities and sites of capacity within each zone. In case of a fire, explosion, or other unplanned event at any facility, having the EPZs designated in advance allows them to mobilize first responders, and notify and evacuate everyone living, working, and attending school within the zone. Whether they activate a two- or a five-mile EPZ depends on the type of incident, and factors like wind speed and direction.
Based on those procedures, the map below shows similar likely zones for the proposed plant in Beaver County, along with sites of vulnerability and capacity.
Ethane Cracker Hazard Map
View Map Fullscreen | How FracTracker Maps Work
The map helps us visualize the vulnerability and capacity of this area, relative to the proposed ethane cracker. It includes three main elements: the Shell site and parcels likely to be targeted for buildout of related facilities, two Emergency Planning Zones (EPZs) around the Shell facility, and infrastructure and facilities of the area that represent vulnerability and capacity.
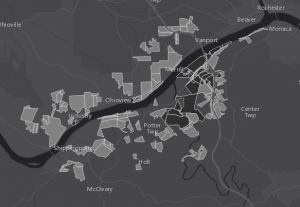
Vacant parcels near the site
It is important to note that the proposed ethane cracker in Beaver County is merely the first of an influx of petrochemical spin-off facilities promised for the area, potentially occupying the various empty parcels indicated on the map above as “vacant properties” and presented in light gray in the screenshot left.
Each new facility would add its own risks and cumulative impacts to the equation. It would be impossible to project these additional risks without knowing what facilities will be built here, so in this article, we stick to what we do know – the risks already articulated by Shell, lessons learned from other communities hosting petrochemical industry in other parts of the country, and past disasters at similar facilities.
Vulnerability and Capacity in Beaver County
Red, blue, and green points on the map above and in the screenshot below stand in for hospitals like Heritage Valley Beaver; fire and emergency medical services like Vanport Volunteer Fire Company; police stations like the Beaver County Sheriff’s office; and daycares and schools like Center Grange Primary School.
Transportation routes, if impacted, could challenge evacuation. Potter Township Fire Chief Vicki Carlton pointed out that evacuations due to an event at this facility could also be complicated by the need to stay upwind, when evacuations would likely move in a downwind direction. This map lacks drinking water intakes and other essential features upon which lives depend, but which nonetheless also sit within this zone of vulnerability.
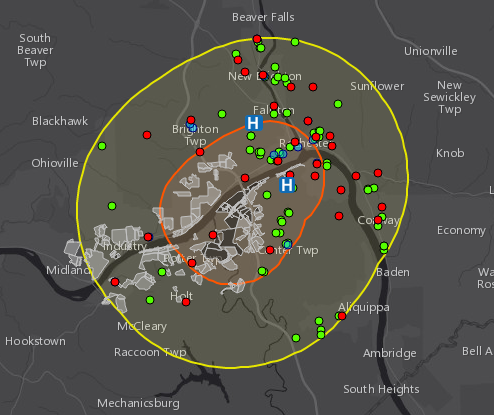
Points within EPZS
Vulnerability/capacity within 2-mile zone:
- 1 hospital
- 5 police stations
- 10 fire/EMS stations
- 23 schools/daycare facilities
- 47,717 residents*
When expanded to 5-mile zone:
- 2 hospitals
- 9 police stations
- 23 fire/EMS stations
- 40 schools/daycare facilities
- 120,849 residents*
*Note: For census tracts that are partly within a zone, a ratio is determined based on the percentage of land area in the tract within the zone. This ratio is then used to estimate the fraction of the population likely within the zone.
Stakeholders’ Right to Know
No person or community should be subjected to risk without the opportunity to be fully informed and to give meaningful input. Likewise, no group of people should have to bear a disproportionate share of environmental risks, particularly stakeholders who are already frequently disenfranchised in environmental decision-making. “Environmental justice” (EJ) refers to those simple principles, and DEP designates environmental justice areas based on communities of color and poverty indicators.
Presented as blue fields on the map and shown in the screenshot below, several state-designated EJ areas fall partially or entirely within the 2- and 5-mile EPZs (a portion of two EJ areas home to 2,851 people, and when expanded to five miles, two entire EJ areas and a portion of seven more, home to 18,679 people, respectively).
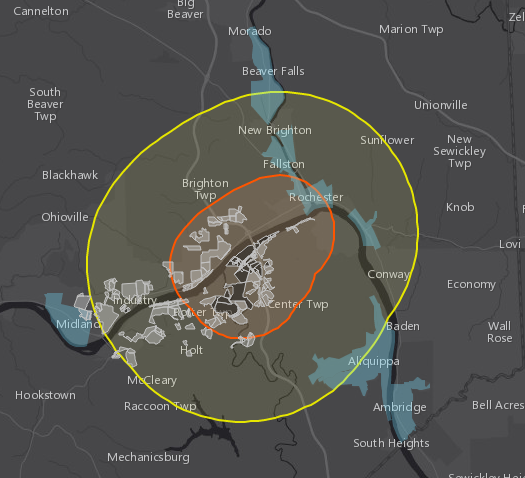
EJ Areas and Emergency Planning Zones around the Site
The basic ideas behind environmental justice have major bearing in emergency scenarios. For example, those living below the poverty line tend to have less access to information and news sources, meaning they might not learn of dangerous unexpected emissions plumes coming their way. They also may not have access to a personal vehicle, rendering them dependent upon a functioning public transportation system to evacuate in an emergency. Living below poverty level may also mean fewer resources at home for sheltering-in-place during a disaster, and having less financial resources, like personal savings, may lead to more difficult post-disaster recovery.
Local expertise
FracTracker recently consulted with the Emergency Management Director for Beaver County, Eric Brewer, and with Potter Township Fire Chief Vicki Carlton. Both indicated that their staff have already begun training exercises with Shell -including a live drill on site that simulated a fire in a work trailer. But when asked, neither reported that they had been consulted in the permit approval process. Neither had been informed of the chemicals to be held on site, and both referred to emergency planning considerations as something to come in the future, after the plant was built.
Unfortunately, the lack of input from public safety professionals during the permit approval stage isn’t unique to Beaver County. Our emergency management contact in Louisiana pointed to the same disturbing reality: Those who best understand the disaster implications of these dangerous developments and who would be mobilized to respond in the case of a disaster are not given a say in their approval or denial. This valuable local expertise – in Louisiana and in Beaver County – is being overlooked.
All Beaver County first responders who spoke with FracTracker clearly showed their willingness to perform their duties in any way that Shell’s new facility might demand, hopefulness about its safety, and a generally positive relationship with the company so far. Chief Carlton believes that the ethane cracker will be an improvement over the previous facility on the same site, the Horsehead zinc smelter, though a regional air pollution report characterizes this as a trade off of one type of dangerous pollution for another. Director Brewer pointed to the existing emergency plans for the county’s nuclear facility as giving Beaver County an important leg-up on preparedness.
But the conversations also raised concern about what the future relationship between the community and the industry will look like. Will funds be allocated to these first responders for the additional burdens brought on by new, unprecedented facilities, in what amount, and for how long into the future? Chief Carlton pointed out that until Shell’s on-site fire brigade is in place two or three years from now, her all-volunteer department would be the first line of defense in case of a fire or other incident. In the meantime, her fire company has ordered a much-needed equipment upgrade to replace a 30-year old, outdated tanker at a cost of $400,000. They are formally requesting all corporate businesses in the township, including Shell, to share the cost. Hopefully, the fire company will see this cost covered by their corporate neighbors who use their services. But further down the road? Once all is said and done, and Shell has what they need to operate unfettered, Chief Carlton wonders, “where do we stand with them?”
Waiting for disclosure of the risks
Emergency preparedness and planning should be a process characterized by transparency and inclusion of all stakeholders. However, when it comes to the Shell ethane cracker, those who will share a fence line with such operations have not yet been granted access to the full picture. Currently, the DEP allows industrial operations like the proposed ethane cracker to wait until immediately before operations begin to disclose emergency planning information, in the form of Preparedness, Prevention, and Contingency (PPC) plans. In other words, when permits are up for approval or denial prior to construction, permit applicants are not currently required to provide PPC plans, and the public and emergency managers cannot weigh the risks or provide crucial input.
|
Shell’s Acknowledged Risks |
Sampling of Shell’s Disastrous Petrochemical Precedents |
|
Fire and Explosions |
Shell’s Deer Park, Texas, 1997: |
|
Leaks |
Shell’s Deer Park, Texas refinery and chemical plant, 2013: |
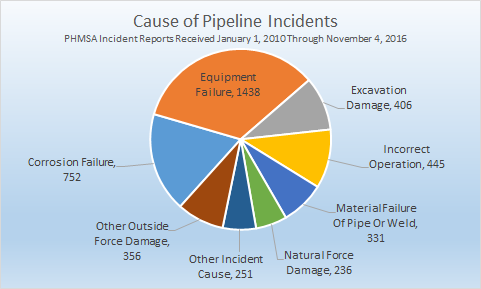
| Equipment Failures |
Shell’s Martinez Refinery in California, 2016: |
According to Shell, possible risks of the proposed Beaver County petrochemical facility include fire, explosion, leaks, and equipment failures. More than mere potentialities, examples of each are already on the books. The above table presents a sampling. Shell also points out the increased risk of traffic accidents, not explored in this chart. It is worth noting, however, that the proposed facility, and likely spin-off facilities, would greatly increase vehicular and rail traffic.
The ethane cracker in Beaver County plant has not yet been constructed. However, Shell operates similar operations with documented risks and their own histories of emergency events. Going forward, the various governmental agencies tasked with reviewing permit applications should require industrial operations like Shell, to make this information public as part of the review and planning process. Currently they can relegate safety information to a few vague references and get a free pass to mark it as “confidential” in permit applications. Strengthening risk disclosure requirements would be a logical and basic step toward ensuring that all stakeholders – including those with special emergency planning expertise – can have input on whether those risks are acceptable before permits are approved and site prep begins.
Until regulations are tightened, we invite Shell to fulfill its own stated objective of being a “good neighbor” by being forthcoming about what risks will be moving in next door. Shell can and should take the initiative to share information about its existing facilities, as well as lessons learned from past emergencies at those sites. Instead of waiting for the post-construction, or the “implementation” stage, all stakeholders deserve disclosure of Shell’s plans to prevent and respond to emergencies now.
In our next article, we will explore the infrastructure for the proposed Shell facility, which spans multiple states, and sort out the piecemeal approval processes of building an ethane cracker in Pennsylvania.
Sincere Appreciation
Emergency Managers and First Responders in St. Charles Parish, Louisiana and Potter Township and Center Township, PA.
Lisa Hallowell, Senior Attorney at the Environmental Integrity Project, for her review of this article series and contributions to our understanding of relevant regulations.
Kirk Jalbert, in addition to maps and analysis, for contributing key points of consideration for and expertise on environmental justice.
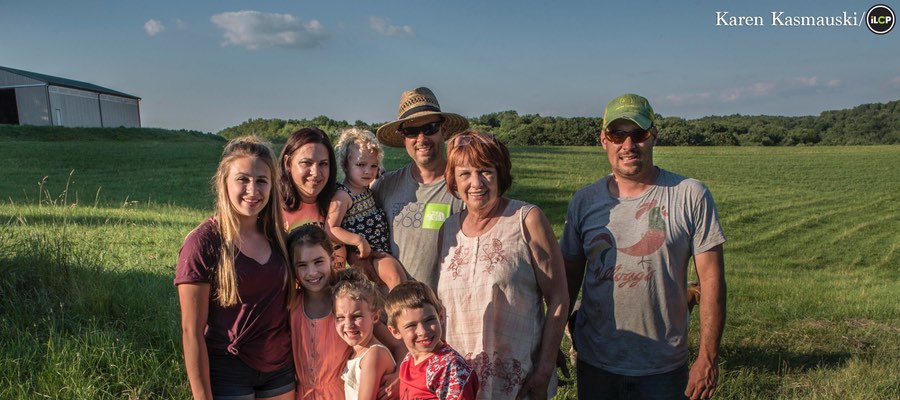
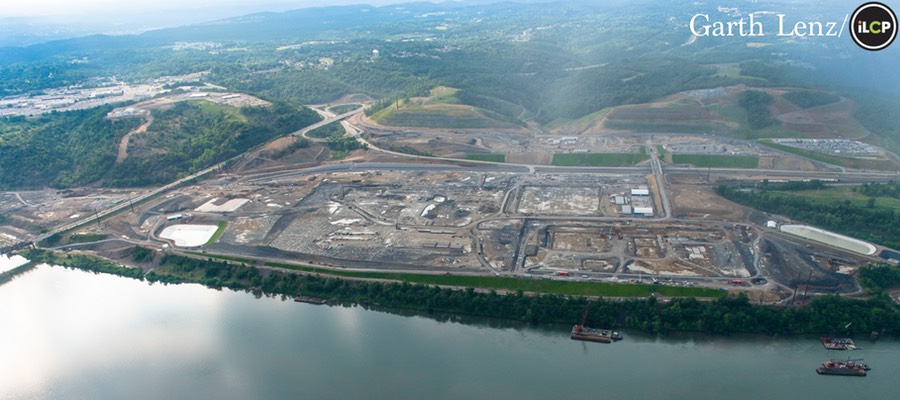
The International League of Conservation Photographers for sharing the feature image used in this article.
The image used on our homepage of the steam cracker at BASF’s Ludwigshafen site was taken by BASF.
By Leann Leiter, Environmental Health Fellow for FracTracker Alliance and the Southwest PA Environmental Health Project and Lisa Graves Marcucci, PA Coordinator, Community Outreach of Environmental Integrity Project
With maps and analysis by Kirk Jalbert, Manager of Community-Based Research & Engagement, FracTracker Alliance