Keeping Track of Hydraulic Fracturing in California
By Kyle Ferrar, CA Program Coordinator, FracTracker Alliance
Environmental regulations in California are considered conservative by most state standards. To name a few practices, the state has developed an air quality review board that conducts independent toxicological assessments on a level competitive with the U.S. EPA, and the state instituted the U.S.’s first green house gas cap and trade program. But most recently the California Department of Conservation’s Division of Oil, Gas and Geothermal Resources (DOGGR) has been criticized in the media for its lack of monitoring of hydraulic fracturing activity. DOGGR has been responsive to criticism and preemptive of legislative action and has begun a full review of all well-sites in California to identify which wells have been hydraulically fractured and plan to monitor future hydraulic fracturing. Additionally they have maintained historical records of all wells drilled, plugged, and abandoned in the state in web-accessible databases, which include data for oil and gas, geothermal, and injection wells, as well as other types of support wells such as pressure maintenance, steam flood etc.. The data is also viewable in map format on the DOGGR’s online mapping system (DOMS).
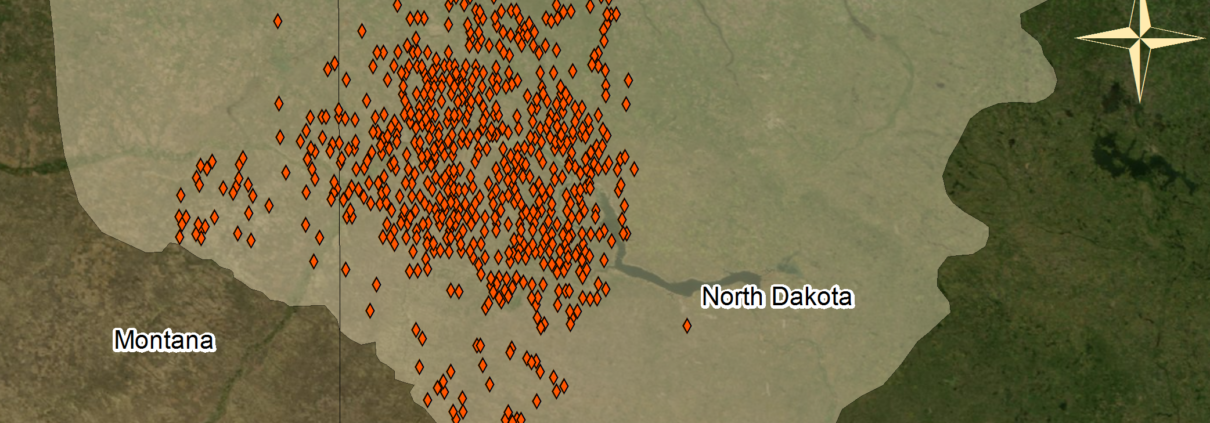
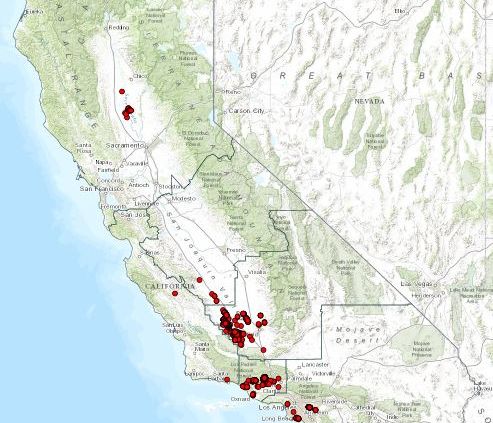
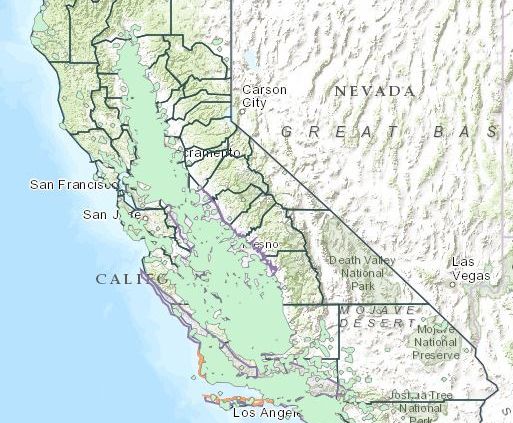
To understand what is missing from the DOGGR dataset, it was compared to the dataset extracted from FracFocus.org by SkyTruth. The map “Hydraulic Fracturing in California” compares these two datasets, which can be viewed individually or together as one dataset with duplicates removed. It is interesting to note the SkyTruth dataset categorizes 237 wells as hydraulically fractured that DOGGR does not, and identifies three wells (API #’s 11112215, 23727206, and 10120788) not identified in the DOGGR database. For the some of these 237 wells, DOGGR identifies them as new, which means they were recently drilled and hydraulically fractured and DOGGR will be updating their database. Many are identified as active oil and gas wells., while the rest are identified as well types other than oil and gas. Also the SkyTruth dataset from FracFocus data contains additional information about each well-site, which DOGGR does not provide. This includes volumes of water used for hydraulic fracturing and the fracture date, both of which are vital pieces of monitoring information.
The California State Legislature is currently reviewing California Senate Bill 4 (CA SB 4) written by Sen. Fran Pavley (D-Agoura Hills), which would put in place a regulatory structure for permitting and monitoring hydraulic fracturing and other activity. A caveat for acidification is also included that would require companies to obtain a specific permit from the state before acidizing a well. The bill has received criticism from both industry and environmentalists. While it does not call for a moratorium or regulate what chemicals are used, it is the first legislation that requires a full disclosure of all hydraulic fracturing fluid additives, including those considered proprietary. This is the last of at least seven bills on the issue, the majority of which have been turned down by lawmakers. The most conservative bills (Assemblywoman Mitchell; D-Culver City) proposed moratoriums on hydraulic fracturing in the state. Earlier this year lawmakers approved a bill (Sen. Pavley; D-Agoura Hills) that would direct the state to complete and independent scientific risk assessment of hydraulic fracturing. The bill directs permitters to deny permits if the study is not finished by January 1, 2015, and also requires public notice before drilling as well as disclosure of chemicals (besides those considered proprietary). In May, a bill (Sen. Wold; D-Davis) was passed requiring drillers to file a $100,000 indemnity bond for each well, with an optional blanket indemnity bond of $5 million for operators with over 20 wells. Another bill (Jackson; D-Santa Barbara) that would require monitoring of both transportation and disposal of wastewater was tabled until next year.
Although hydraulic fracturing has been conducted in California for over a decade, it was not monitored or regulated, and the majority of Californians were not aware of it. Industry groups have portrayed the lack of attention as a testament to its environmental neutrality, but Californians living smack dab in the middle of the drilling tend to tell a different story. The issue is now receiving attention because hydraulic fracturing is such a hotbed topic of contention, along with the potential future of the billions of barrels of oil in the Monterey Shale. The unconventional extraction technology necessary to recover the oil from these deep shale formations is state of the art, which means it is not tried and true. The methods include a combination of high tech approaches, such as horizontal drilling, high volume hydraulic fracturing, and acidification to name a few. Realize: if this technology existed for the last 60 years, the Monterey Shale would already have been developed long ago, along with the rest of the U.S. deep shale formations.

 By Samantha Malone, MPH, CPH – Manager of Science and Communications, FracTracker Alliance