The majority of FracTracker’s posts are generally considered articles. These may include analysis around data, embedded maps, summaries of partner collaborations, highlights of a publication or project, guest posts, etc.
This post has been archived. It is provided here for informational purposes only.
By Samantha Malone, MPH, CPH – Manager of Science and Communications, FracTracker Alliance
We are often asked why there is no “k” after “frac” in our name, FracTracker. This makes for lively conversations at parties, I assure you. Quite frankly, the etymology of the term “fracking” would make for its own interesting study, especially if you include fans of Battlestar Galactica in your research.
Truth-be-told, our name stemmed from an intense academic vs communications debate. FracTracker originally started as a project within the University of Pittsburgh. As many people in the field of know, academics are not known for brevity in the naming of projects or publications. We wanted a name that embodied both the research and community aspects of our work but was short enough to say all in one breadth. Calling such a new initiative “The Mapping of Unconventional Oil and Gas Extraction Data at the University of Pittsburgh’s Center for Healthy Environments and Communities,” while accurate, just doesn’t flow off the tongue nicely.
At the time “fracking” was a term used in some circles to refer to the entire process of extracting natural gas and oil using non-traditional methods – even though it technically only refers to the hydraulic fracturing of a well to stimulate hydrocarbon retrieval. A project partner of ours suggested the name “FrackTracker,” since we planned to track all activity related to unconventional oil and gas drilling. According to people who work in industry, however, including a “k” in the word fracking just doesn’t make sense… And rightly so; there is no “k” in the phrase hydraulic fracturing, so why should there be one in fracking? Even though fracking is now a term commonly used to discuss the industry as a whole, we still decided to omit the awkward “k” just in case.
#didntneedtoknow but #thanks
FracTracker became an independent non-profit in 2012 called FracTracker Alliance. Learn more about us >
https://www.fractracker.org/a5ej20sjfwe/wp-content/uploads/2013/07/Media-2.png115115FracTracker Alliancehttps://www.fractracker.org/a5ej20sjfwe/wp-content/uploads/2025/09/2025-Wordmark-Logo.pngFracTracker Alliance2013-11-08 10:00:342020-07-21 10:41:37The awkward “k” in “fracking”
This post has been archived. It is provided here for informational purposes only.
By Samantha Malone, MPH, CPH – Manager of Science and Communications
We got called on it; we have no articles about waterless fracturing on FracTracker.org – yet.
Fracturing deep geologic formations to access oil and gas without the use of water offers some financial benefits; it minimizes the water-in and waste-out costs, even though the upfront costs are higher for the driller. Environmentally, this is a plus since the sites would theoretically use much less water than they currently do (~5 million gallons per well depending on who you ask). The omission of an article on FracTracker about waterless fracturing, while not intentional, does reflect the nature of our work. As data enthusiasts, we try to focus on information that can be obtained from available data. We’ve looked into but found there to be limited data regarding the actual use and productivity of waterless fracturing. As such, we have not written anything specifically about the technique to-date.
Having said that, if you, the public, know where we could access data of this nature, please let us know. We would be more than happy to analyze and discuss waterless fracturing on our site in the future.
Hydraulic fracturing for oil and natural gas can use millions of gallons of water per well. Waterless frac technology could change that.
You can learn more about waterless frac technology in an article on RigZone.com.
This post has been archived. It is provided here for informational purposes only.
By Brook Lenker and Ted Auch, FracTracker Alliance
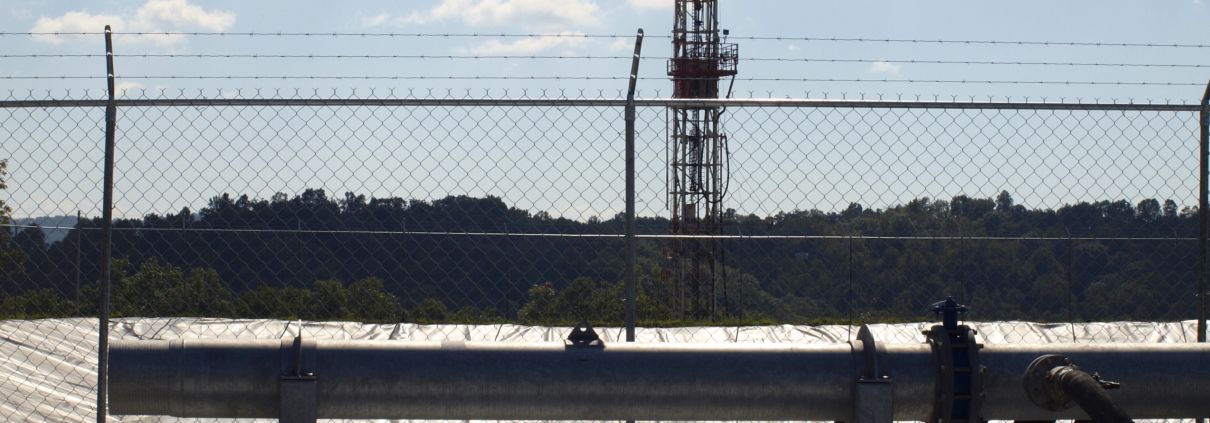
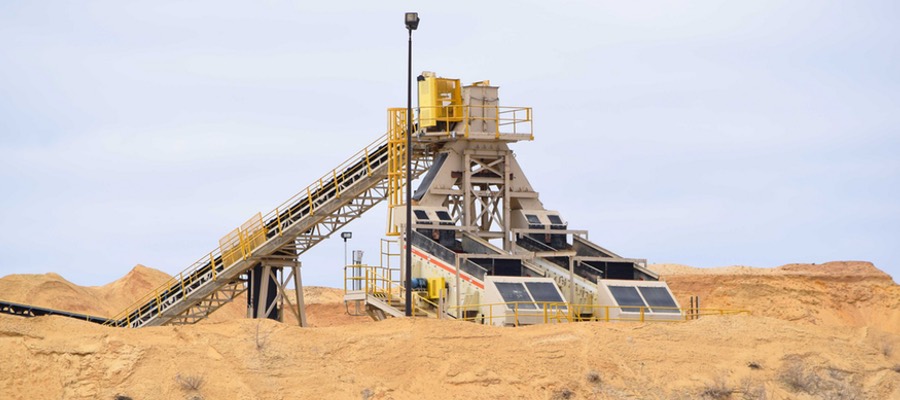
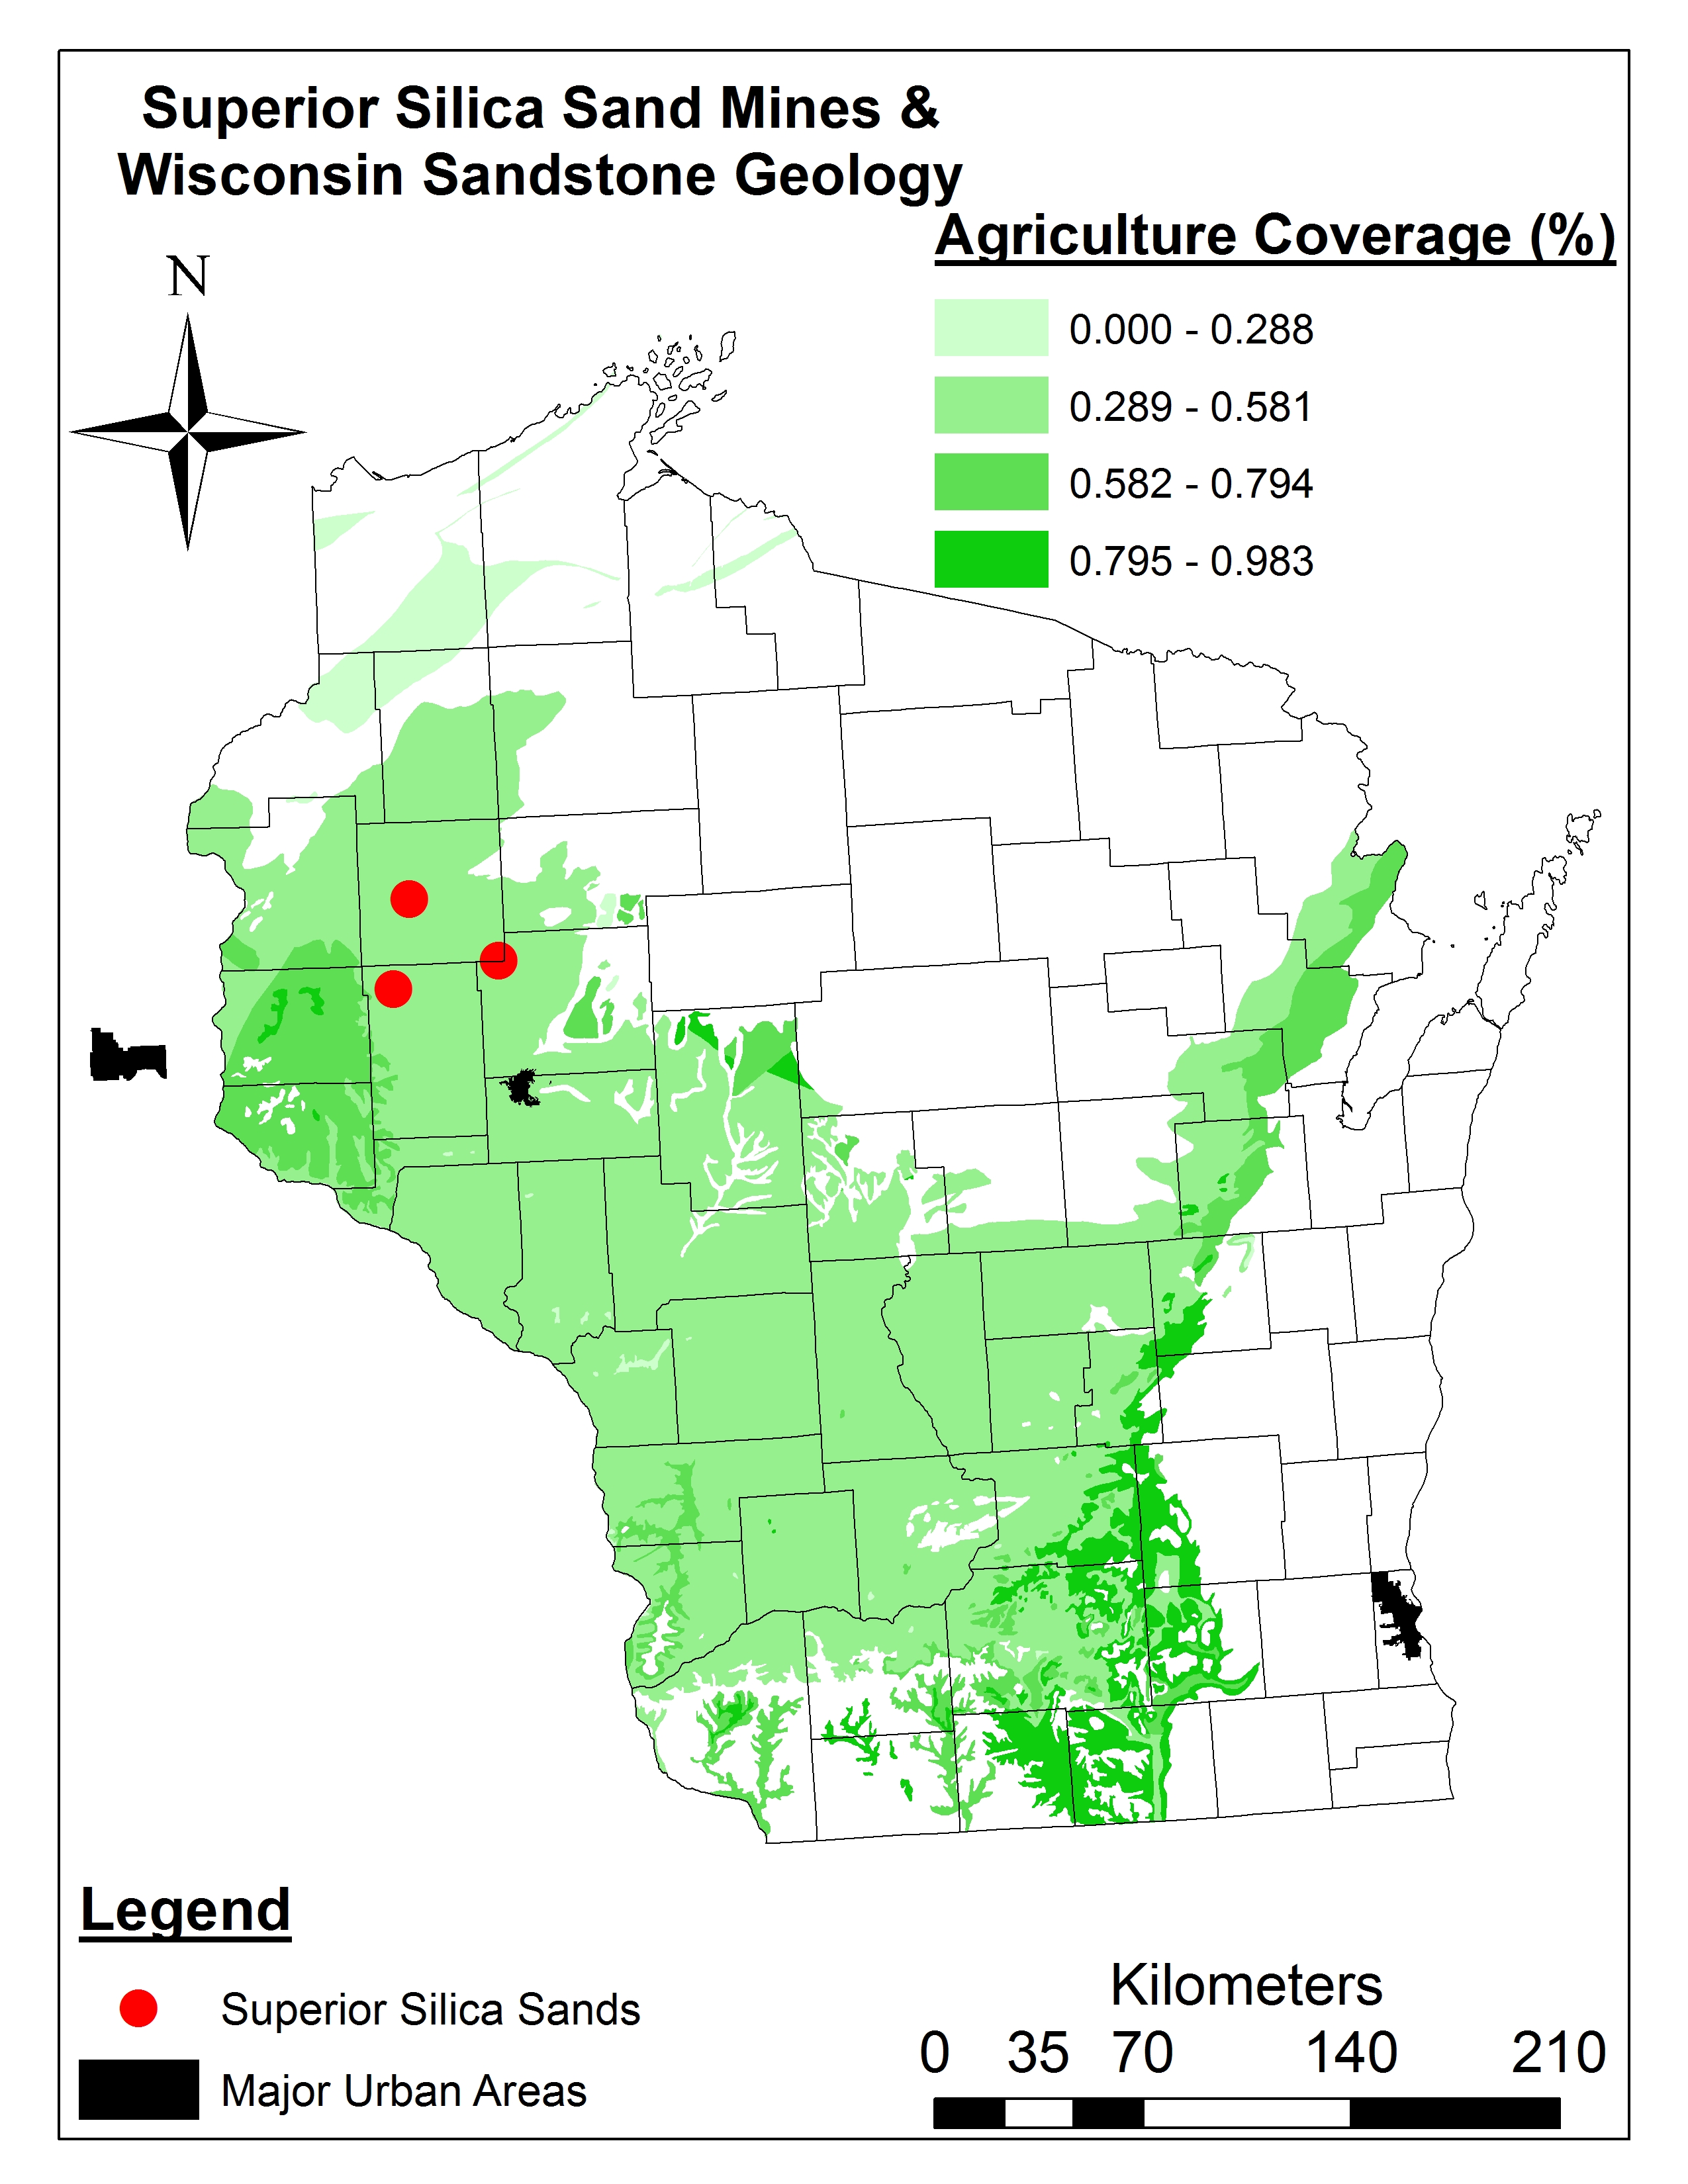
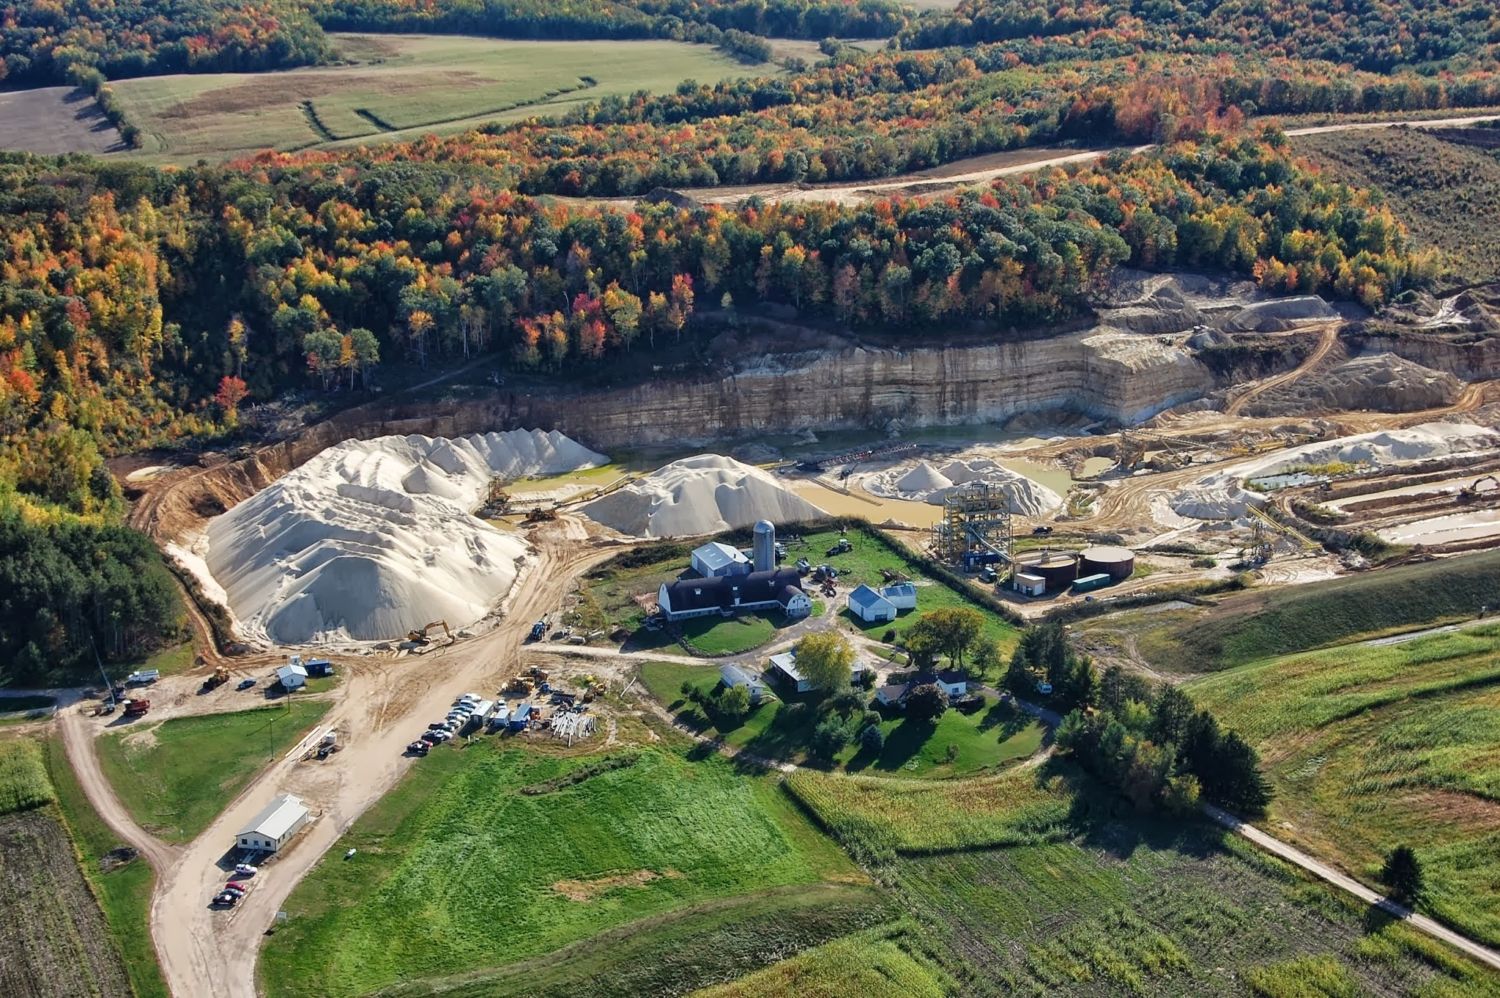
Thirty miles northwest of Eau Claire, Wisconsin the land rolls gently. Wooded hills back orderly farms straight from the world of Norman Rockwell but painted red and gold by October’s cool brush. It seems like agrarian perfection, but the harmony is interrupted by the pits and mounds of a newcomer to America’s Dairyland – sand extraction to support hydraulic fracturing for the oil and natural gas industry.
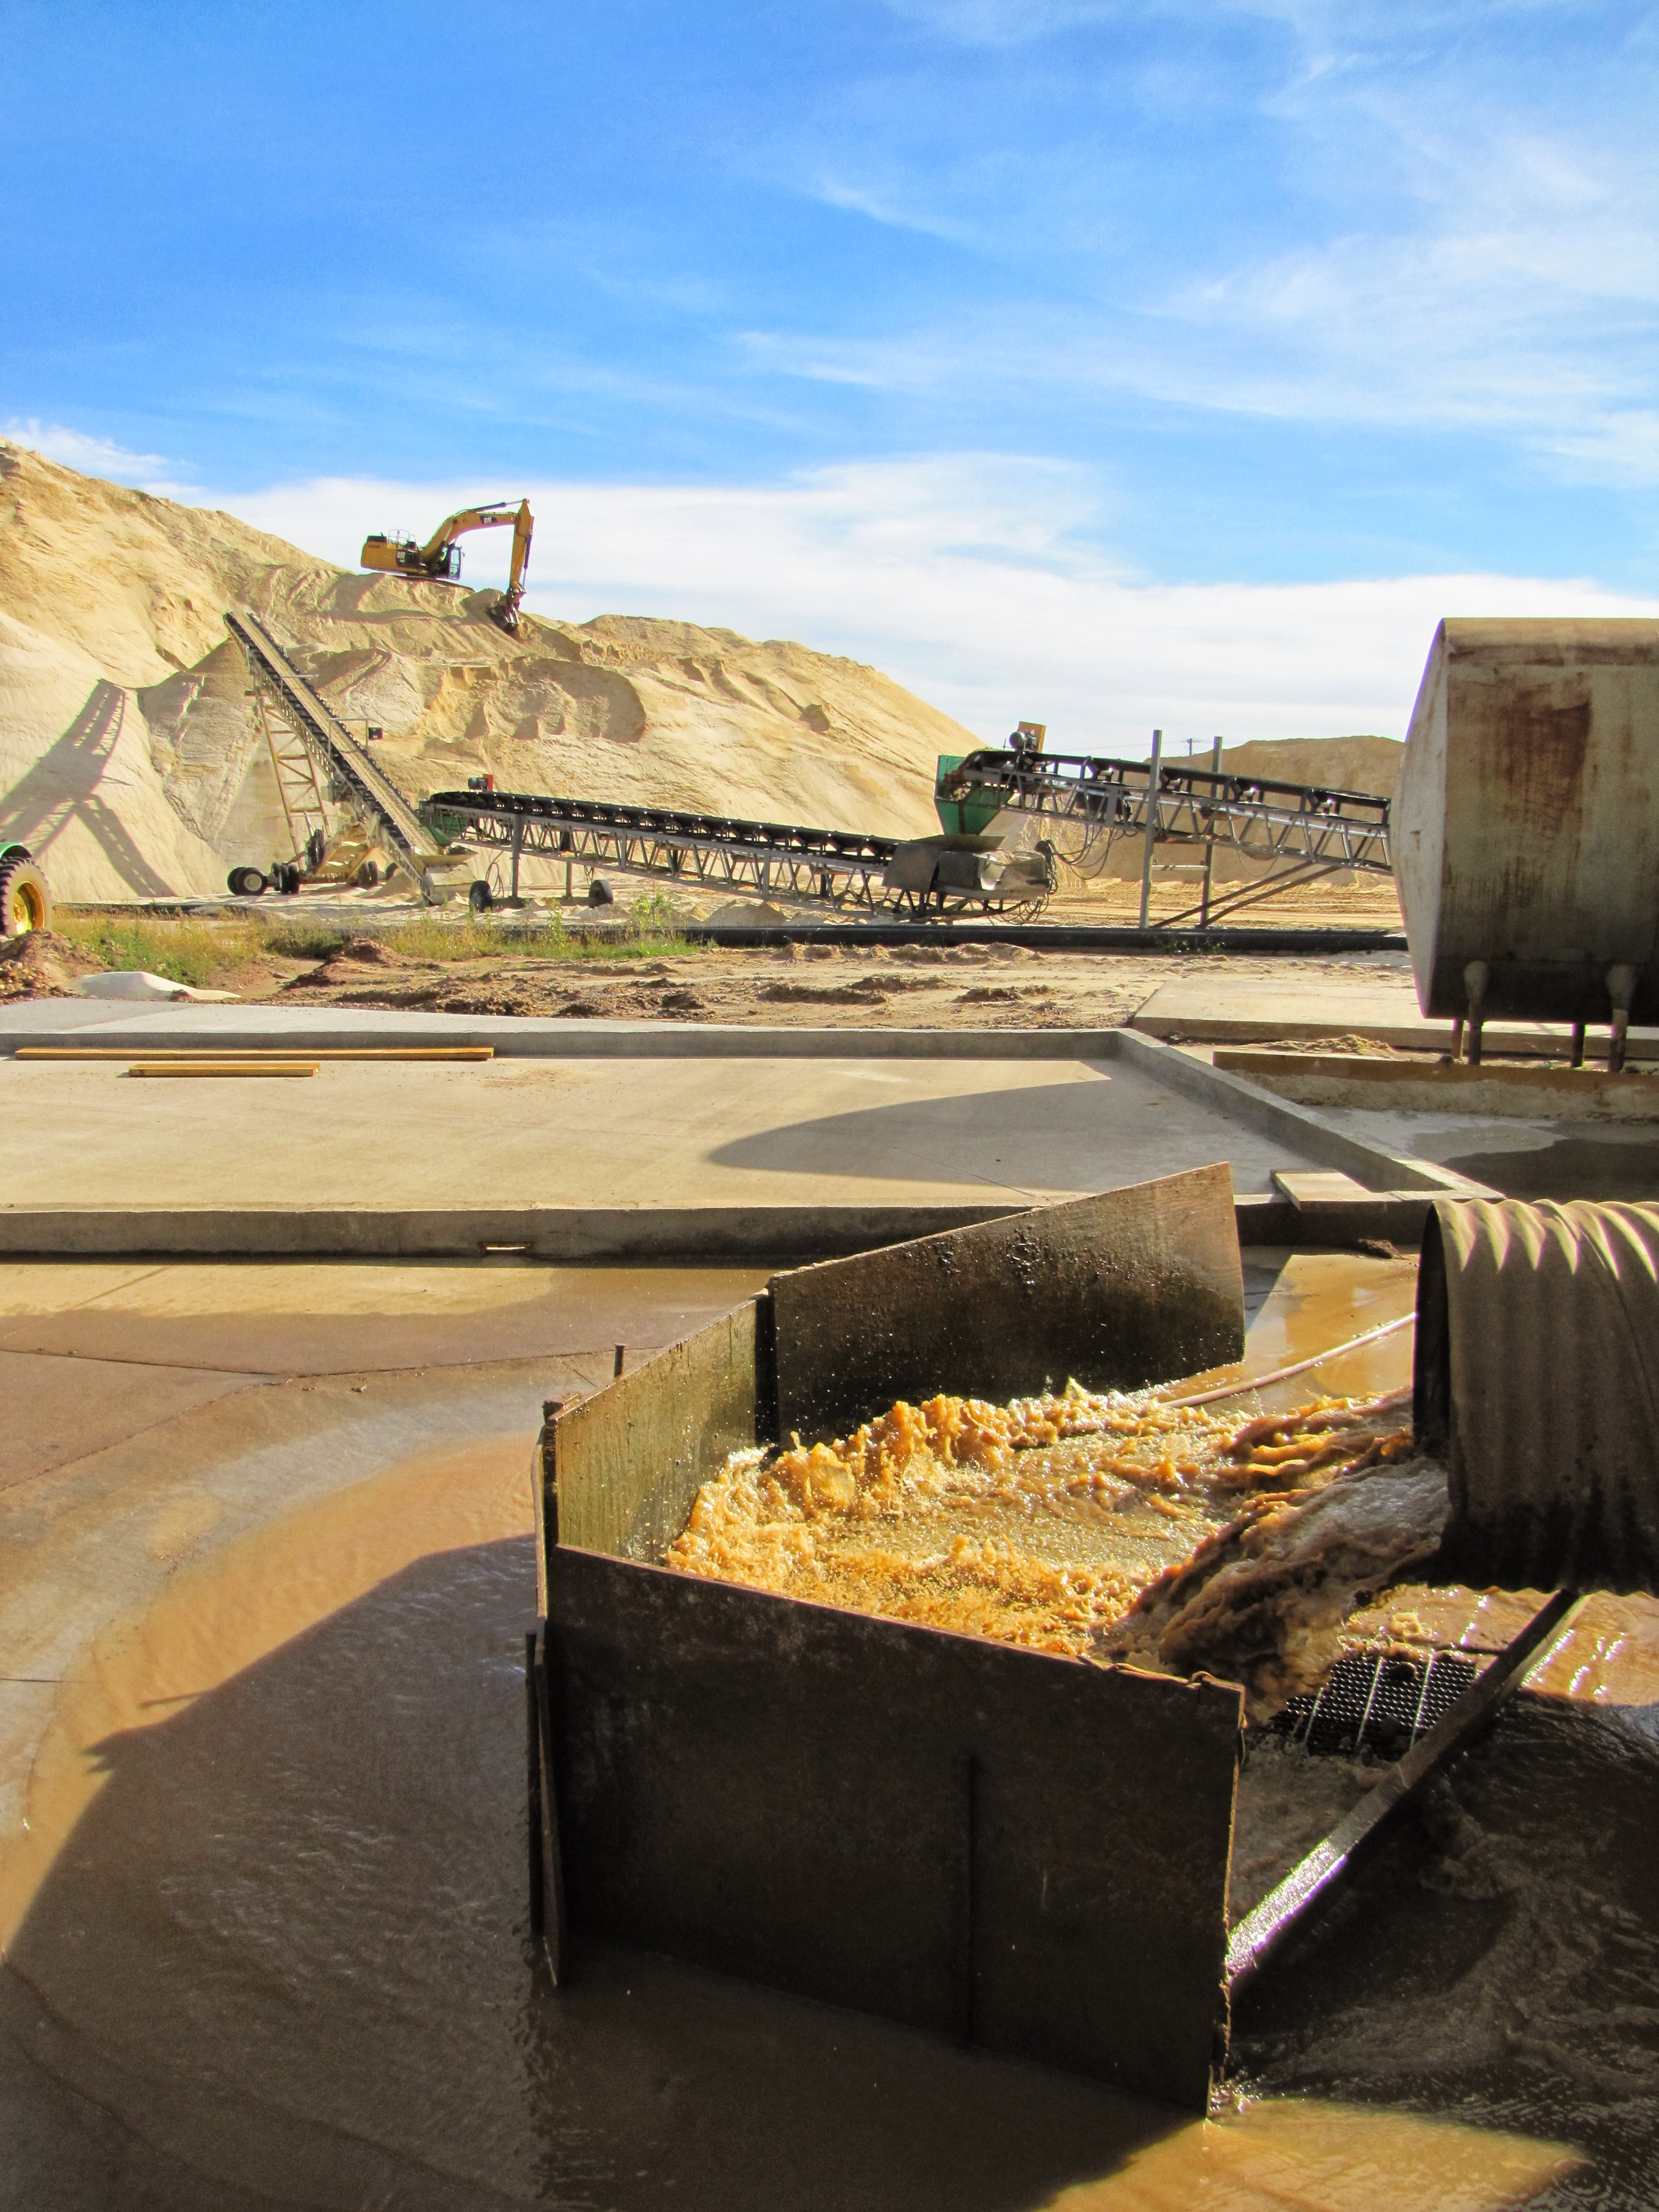
“Mine, Baby, Mine” reads a bumper sticker on a pickup outside the Baron drying plant of Superior Silica Sands – a frac sand company headquartered in Fort Worth, Texas but with significant activities located in Wisconsin. Ted Auch, Ohio Program Coordinator for FracTracker, and I are on a daylong sand mining tour organized by the West Central Wisconsin Regional Planning Commission (WCWRPC). This, the second Superior drying plant we visited, processes up to 2.4 million tons of sand per year (enough sand to complete 800 typical horizontal gas or oil wells). This is among the largest facilities of its kind in the world.
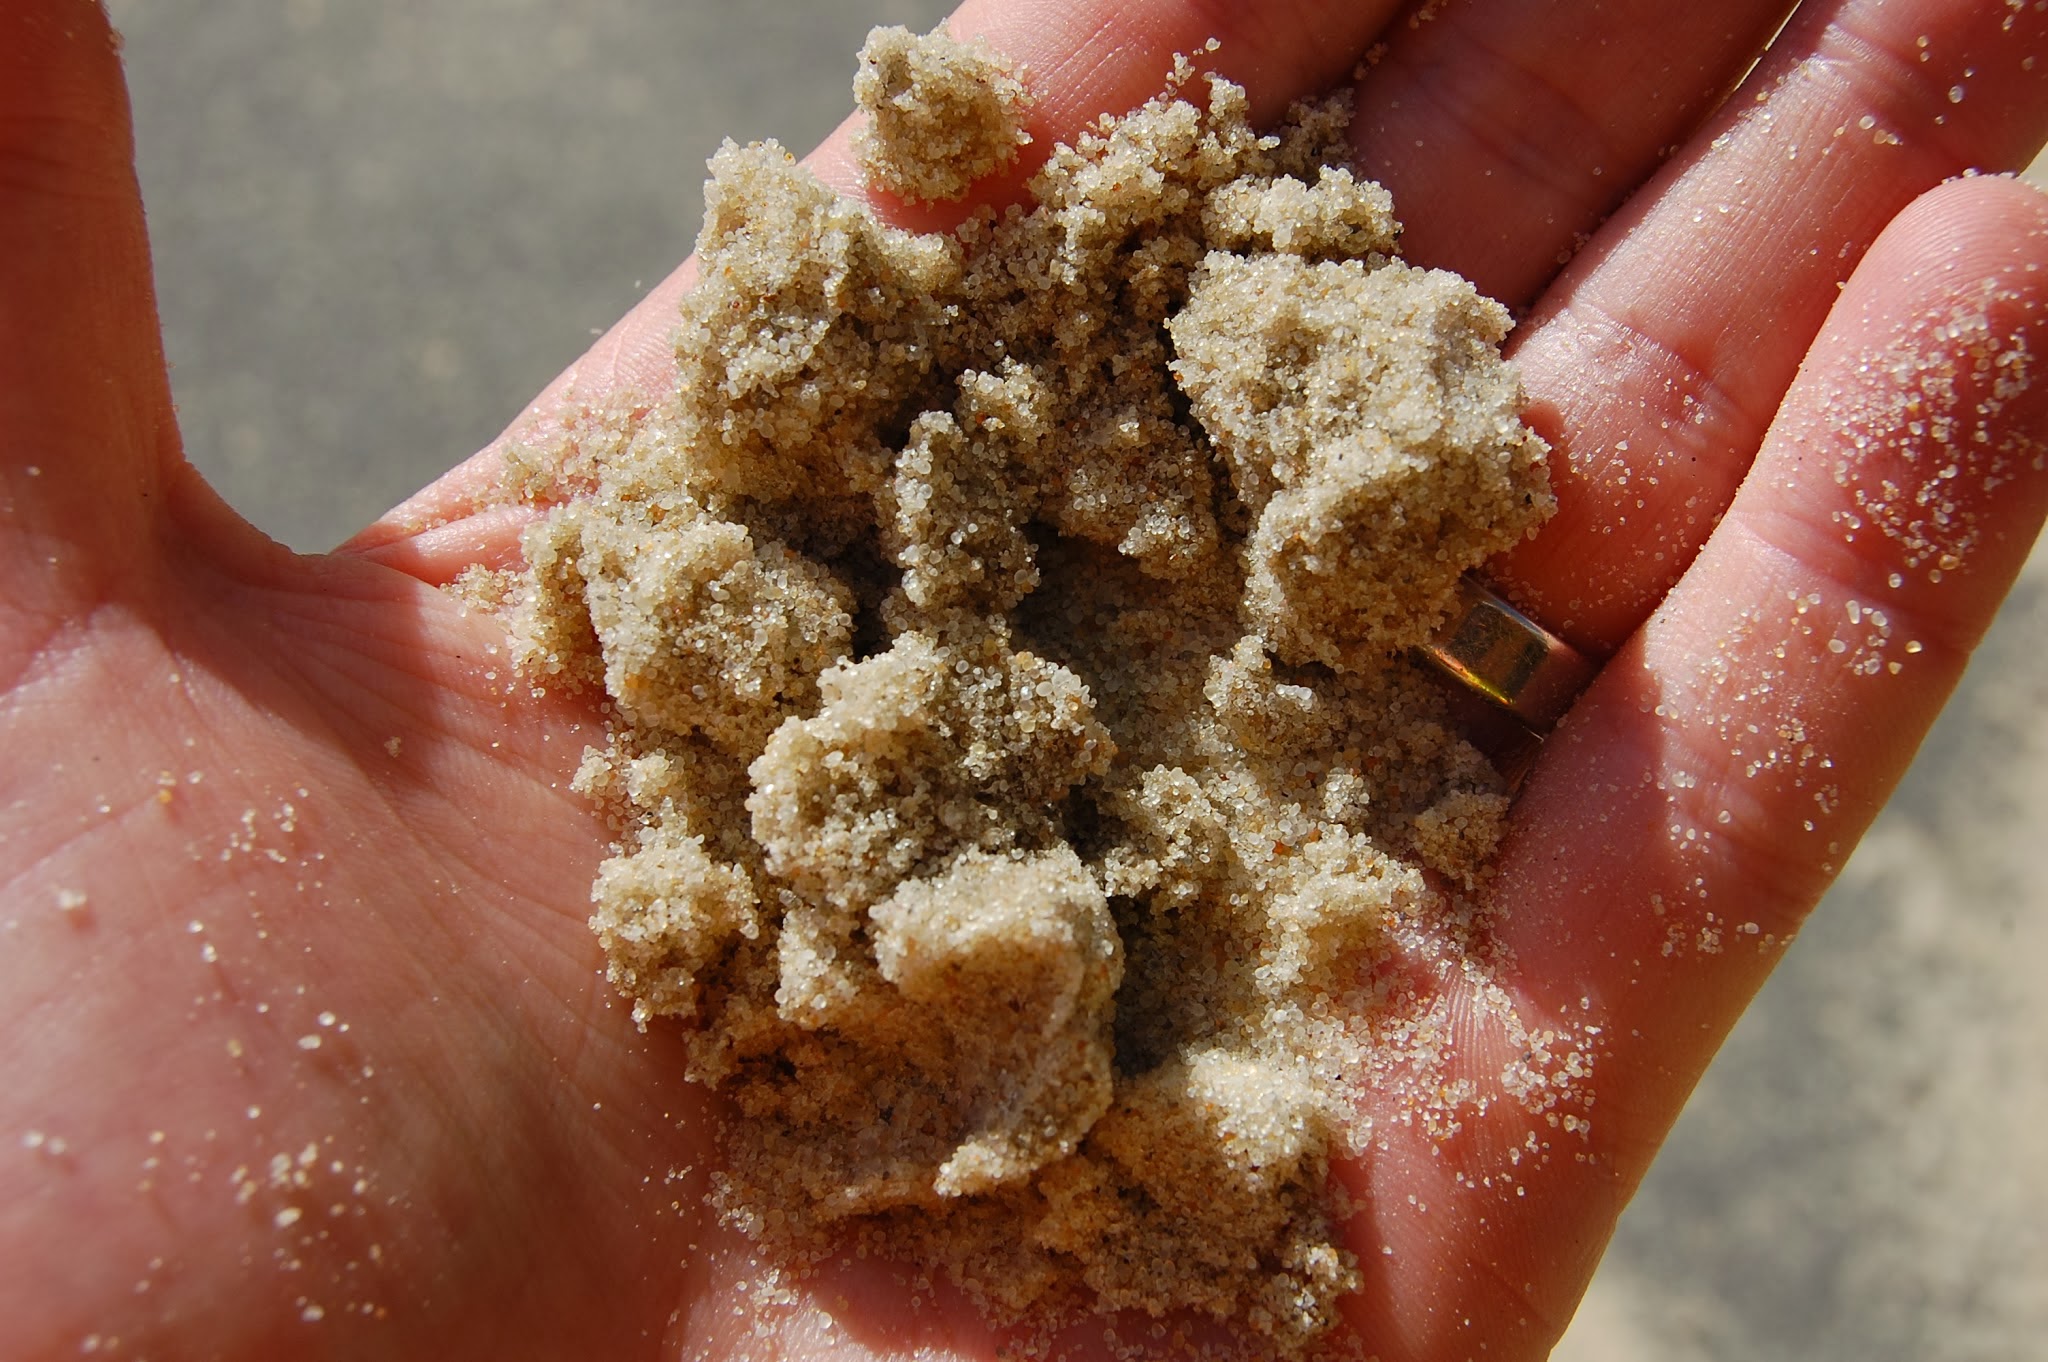
What is frac sand?
Frac sands (99% silicon dioxide – SiO2) are meant to “prop” open the rock after fracturing is complete, termed “proppants.” Aside from water, these sands represent the second largest constituent pumped into a typical well to hydraulically fracture the shale. Usage of frac sand as a proppant is increasing due to the rising costs associated with synthetic substitutes like ceramic and related resin-coated materials. Ideally, such sand must be uniformly fine and spherical, crush-resistant, acid soluble, mature, and clay/silt-free. The northern Great Lakes Basin represents the primary stock for high quality frac sand in the world – causing many industry analysts to label the region Sand Arabia.
And where does it come from?
Most of Superior’s total production (4.2 million tons per year) comes from mines in New Auburn and Clinton, Wisconsin – in the middle of the St. Peter (Ottawa) Sandstone. This formation underlies parts of Iowa, Wisconsin, Minnesota, Illinois and Missouri. Known for its uniform and rounded grains – the region has recently surpassed the Hickory (Brady) formation in Texas, which contains sands that are far more angular, blocky and coarse.
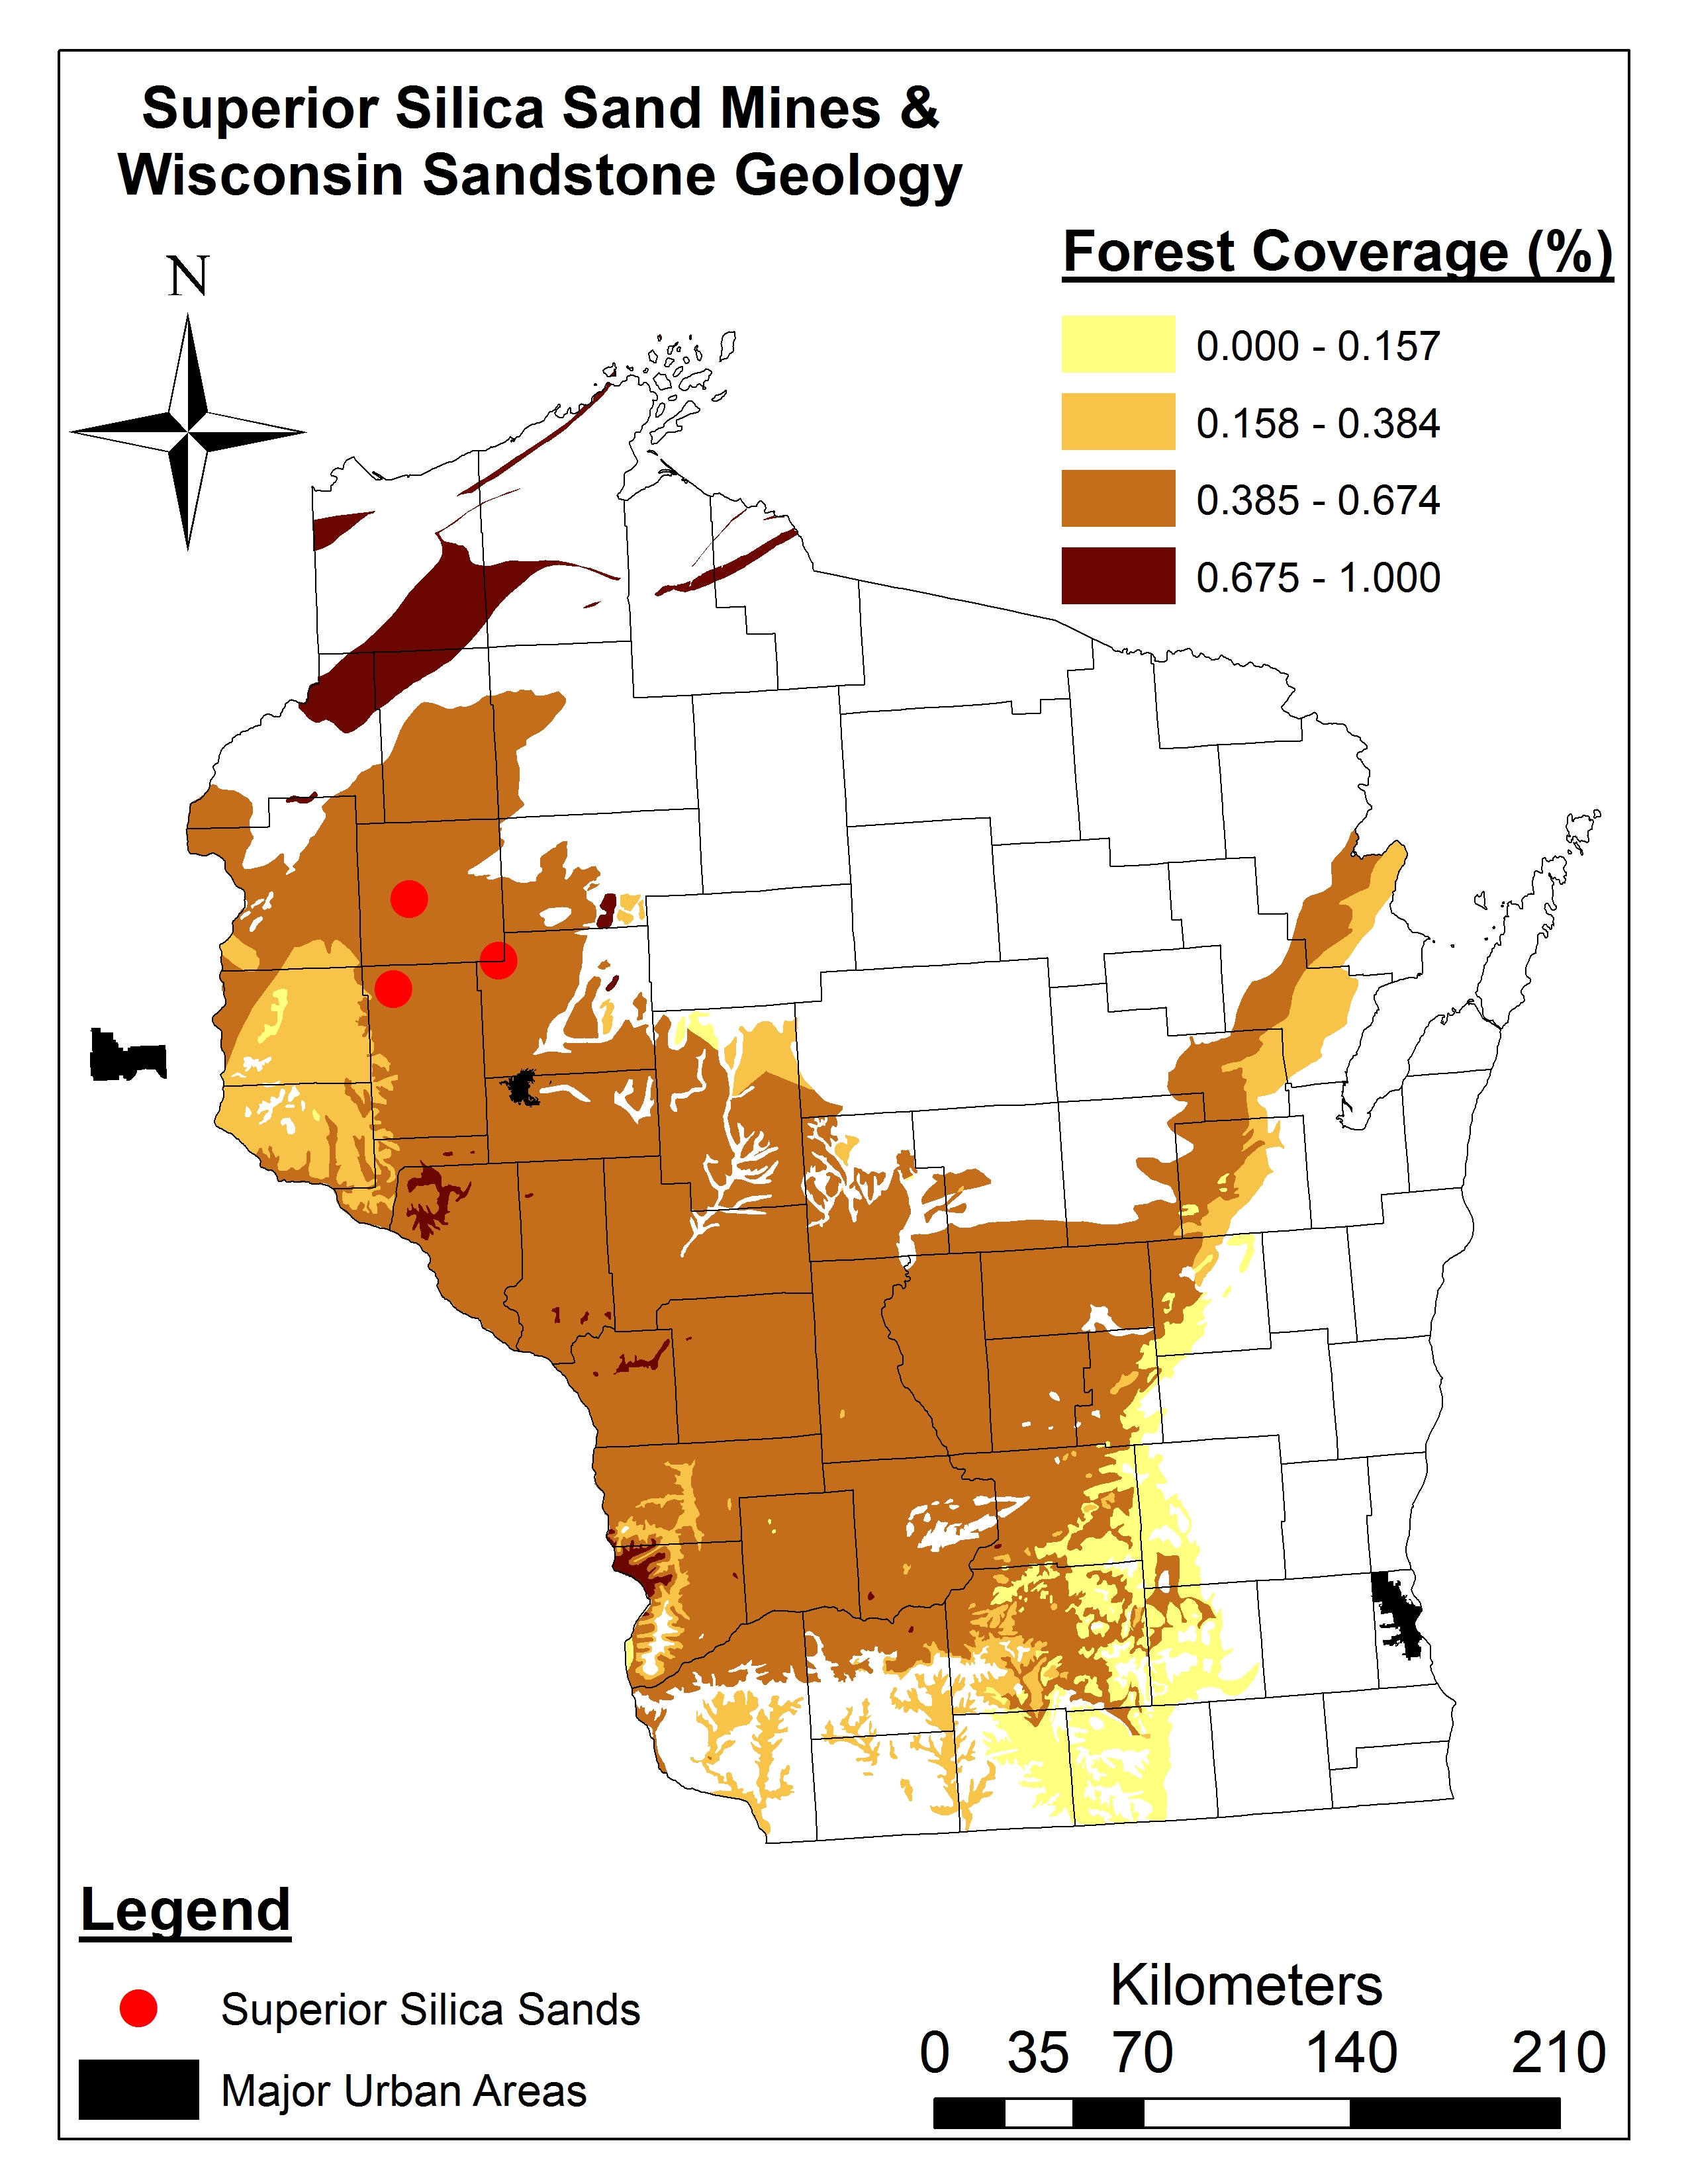
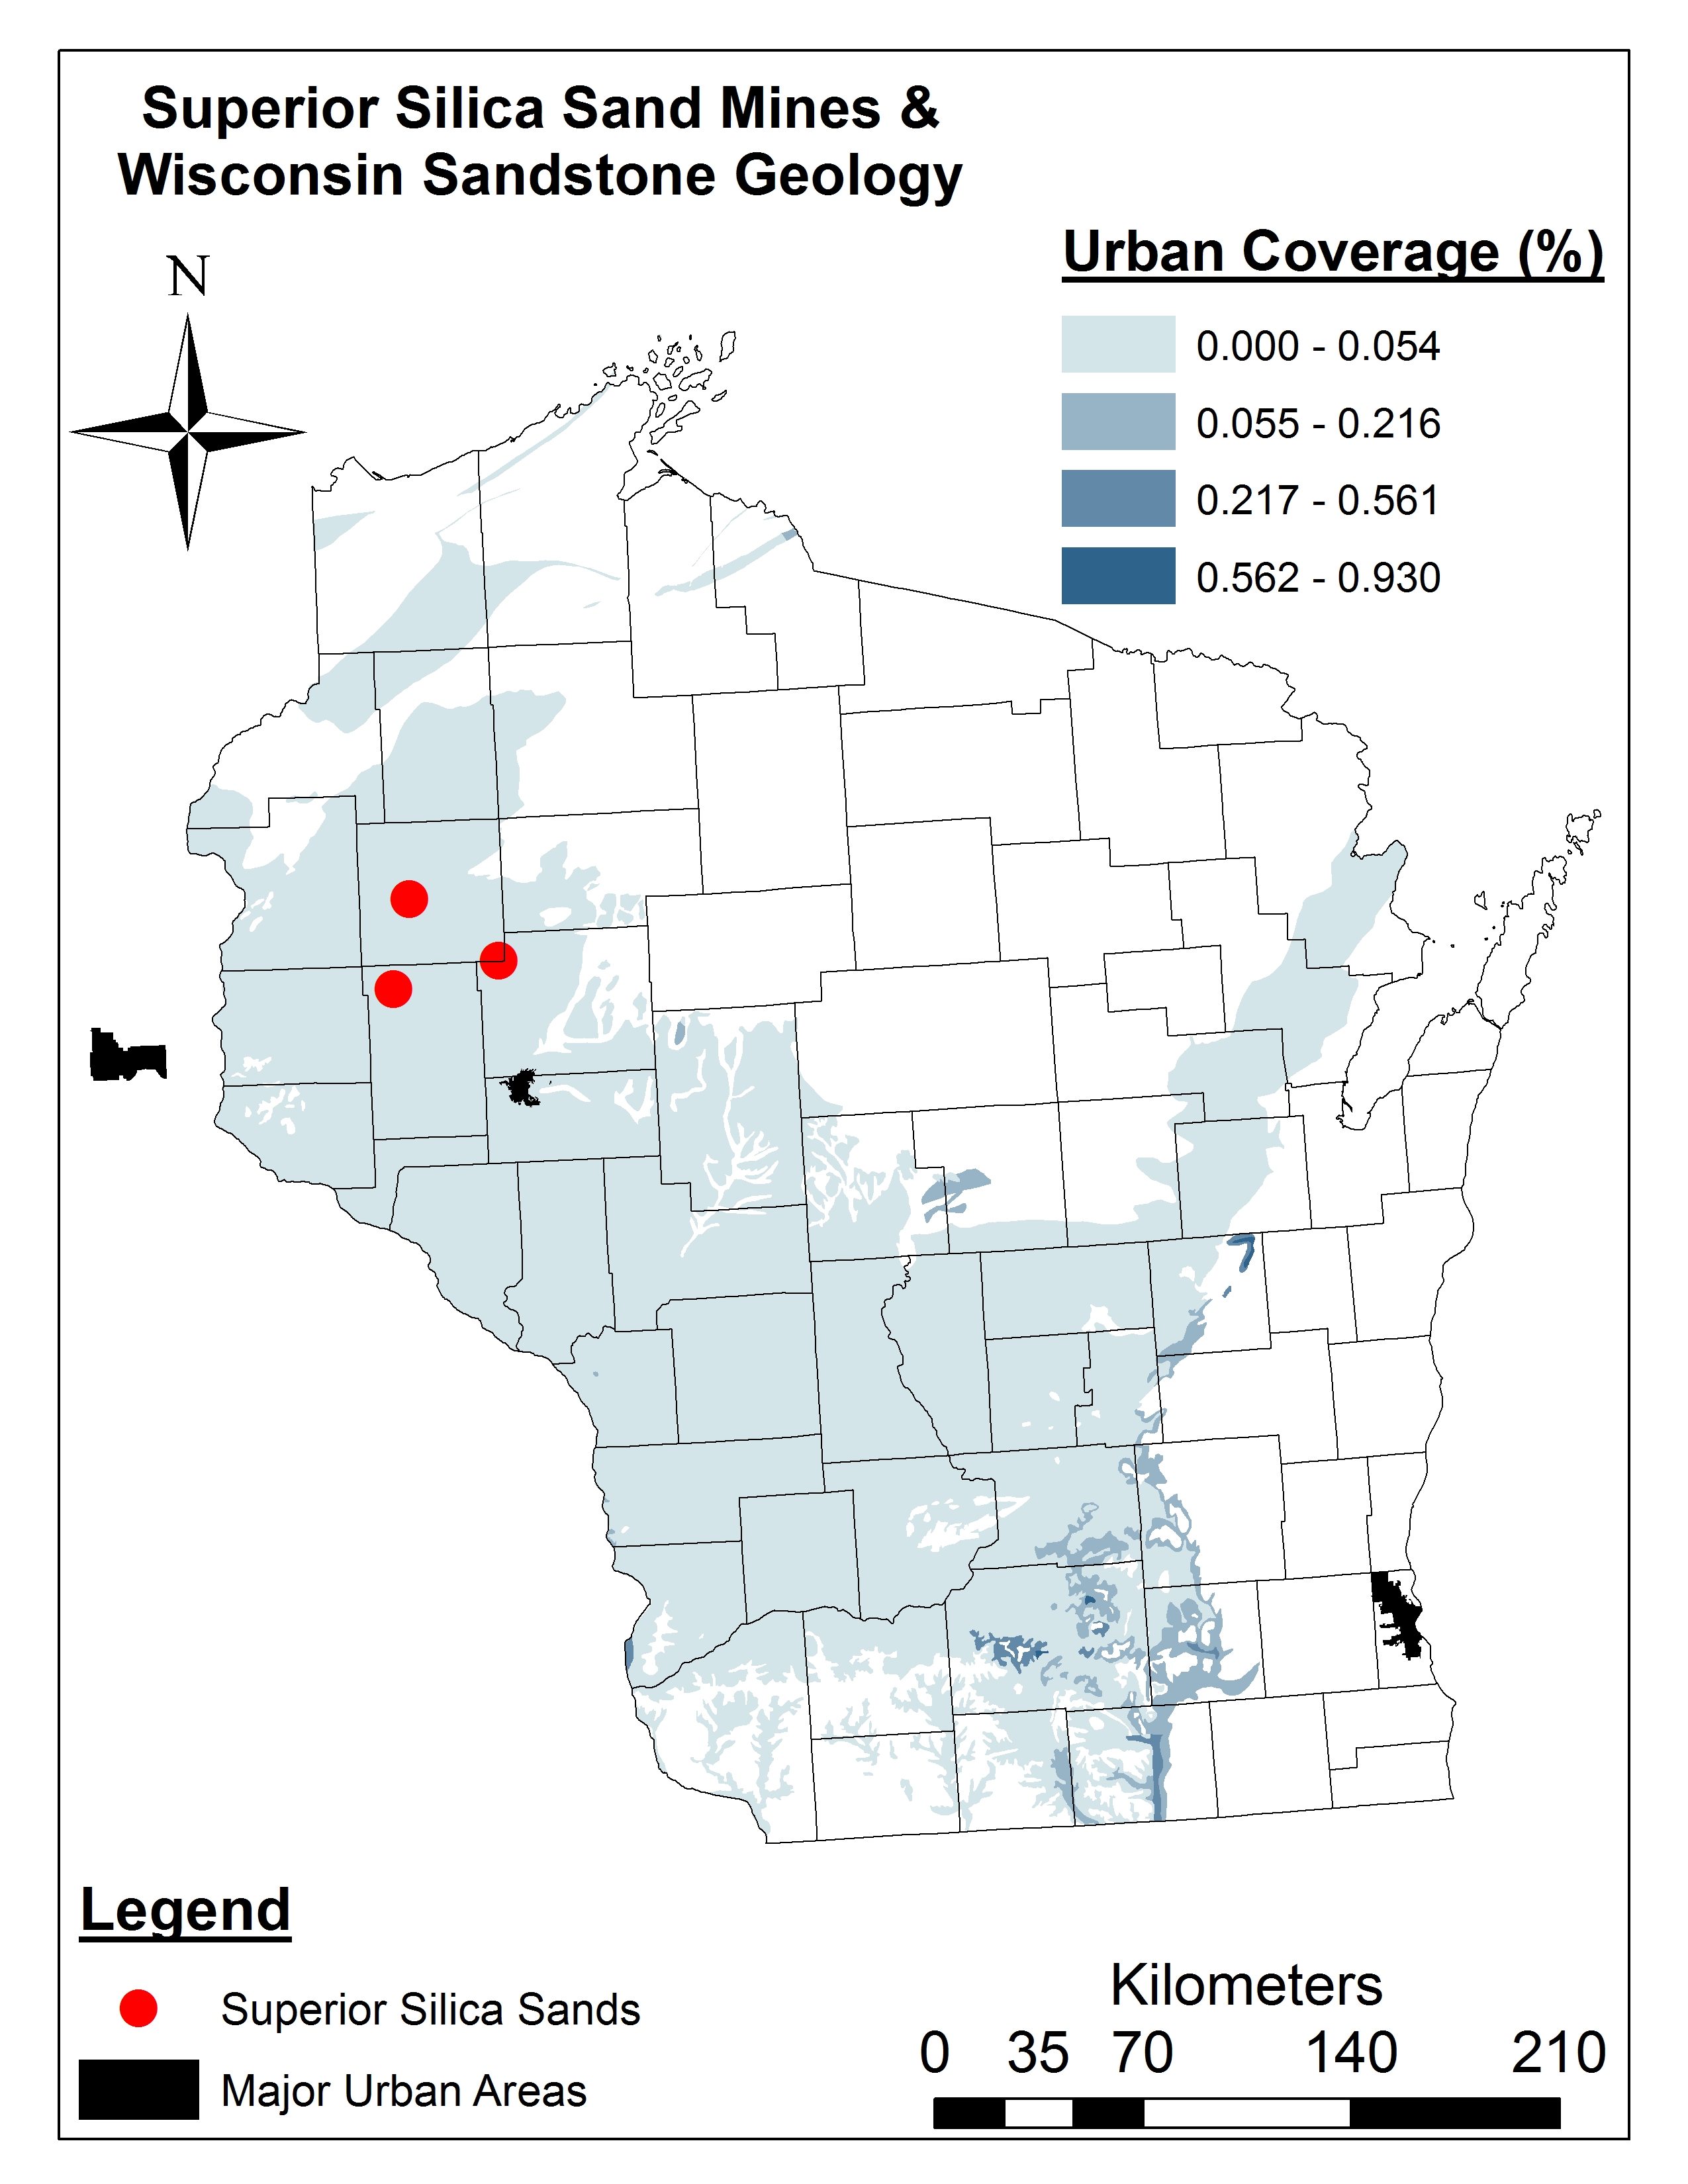
To get an idea of the landscape where these sand mining operations are occurring in Wisconsin, see Figure 1 below.
Wisconsin Sandstone Geology Forest
Coverage (%)
Wisconsin Sandstone Geology Urban Area Coverage (%)
Figure 1. Land cover types (%) and the location of the mines we visited during our recent frac sands tour of West Central Wisconsin (Note: 1.0 = 100%)
“Thank God for Superior Silica Sands,” said Jim Walker, Director of Operations. He wasn’t directly touting his employer’s virtues, but rather sharing a quote from a landowner pleased with the income derived from leasing their farm for the sand beneath. According to Walker, Superior has over 100,000 acres of mining leases in Wisconsin – enough to support their company’s anticipated needs for the next 30 years. Based on frac sand mine permitting data provided to us by the planning commission, this 100,000 acreage translates to 939,700,000 tons of frac sand (enough for 313,233 horizontal wells). Overall, Wisconsin’s frac sand mines are currently producing 185-211 million tons of frac sand from 128 facilities.
Superior is one of more than six sand companies working in the area. One state resident recently emailed me complaining that “we are being inundated with industrial sand mining.” Her perspective is one of concern, but we are told of farmers who are eager to lease their land for potentially hundreds of thousands of dollars in annual payments. Superior prides itself on hiring from the community. The jobs pay well, nearly twice the regional average, according to the planning commission. Healthcare benefits and a 401k are included. At quick glance, it is an economic boom to a rural region, but will it last? Superior has a 10-year contract to supply sand to Schlumberger, a giant in hydraulic fracturing services. Sand prices – affected by competition and overproduction – are dropping, however.
Sand Mining Risks
Environmental impacts may be the biggest cause for worry. Some mining operations can cover more than 450 acres and often involve the destruction of forests. This may happen piecemeal, perhaps 20 acres at a time, but forest habitat and the associated functions (e.g. carbon storage and accrual) are nevertheless diminished. The land is remediated1, but the landowner makes the decisions as to how this occurs. They might choose to plant prairie grasses or trees, but a common preference is more cropland – the latter option enabled by a post-mining reduction in topography. Adaptable wildlife like deer may take the changes in stride, but forest-dependent species and vulnerable plant communities will likely suffer. Water quality and quantity issues have also been highlighted by Wisconsin Watch, Minneapolis Star Tribune, and Minnesota Public Radio.
Public health impacts are perhaps less clear. Superior officials explain that only the finest sand sizes are a legitimate inhalation hazard, and those are atypical to the frac sand industry. A 2012 OSHA hazard alert, however, listed respirable crystalline silica as a significant workplace hazard on unconventional oil and gas well pads, just behind the risk for physical injuries and hydrogen sulfide exposure. At least at Superior, they rigorously monitor the air quality onsite and outside their boundaries. Employees are even monitored for what they breathe. Superior shows data underscoring its outstanding safety and regulatory compliance record. I observe no noticeable blowing of sand or dust on site. While I am on the ground touring, however, Ted enjoys a bird’s eye view courtesy of LightHawk. From the plane, he witnesses aerial movement of material off of other sand mines.
Emissions from increased truck traffic may also present an air quality concern. Dump trucks ply the back roads like worker ants delivering load after heavy load from the mines to the drying plants. The general increase in activity in these forgotten areas may be a lifesaver for some, and a worry for others. Trains with scores of covered, sand-packed cars rumble down the tracks bound for distant shale basins. Texas awaits the trains departing Superior’s Baron plant. Meanwhile, communities express concern about increasing speeds and the safety of crossings.
A Complicated Perspective
For me, the day’s enlightening dialogue and experiences underscore the rough, expanding tendrils of unconventional oil and gas development. They reach far and have complex, often abrasive effects. Here, in the land of Leopold, the father of the Land Ethic, I can’t help but wonder: What would Aldo say about the transformation of his beloved countryside?
[1] Reclamation success, permitting, bond release, inspection and enforcement, and land restrictions were put into law by the Carter administration and introduced by Arizona Republican Morris Udall as defined by the Surface Mining Control and Reclamation Act of 1977, which also created the Office of Surface Mining.
https://www.fractracker.org/a5ej20sjfwe/wp-content/uploads/2016/09/SandMining-Feature.jpg400900FracTracker Alliancehttps://www.fractracker.org/a5ej20sjfwe/wp-content/uploads/2025/09/2025-Wordmark-Logo.pngFracTracker Alliance2013-11-01 11:37:172020-07-21 10:41:36Sifting Through Sand Mining
This post has been archived. It is provided here for informational purposes only.
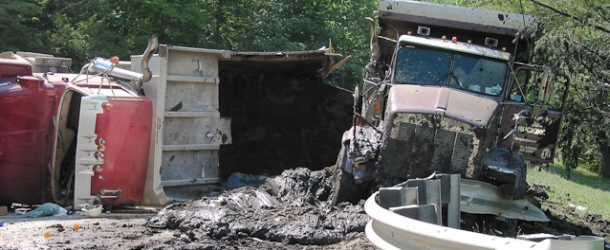
People often want to know which operators perform the best (or worst) among their peers in terms of adhering to the laws set forth in a given state. In principle, the easiest metric for determining this is to look at the ratio of violations issued per well, or VpW.
However, in order to make that analysis, we would obviously need to have violations data. Unfortunately, out of the twenty states that we have shale viewers for on FracMapper, we only have violations data for Arkansas, Colorado, and Pennsylvania, with the latter being far and away more robust and complete when compared to the other two. We have been told that the data is also available for North Dakota as well, if we are willing to pay for it, so we might be able to perform a VpW analysis for the Peace Garden State in the near future.
Then, of course, there is the realization that, “What is a violation?” is actually somewhat of a philosophical question in Pennsylvania. In the past, I’ve determined that the Pennsylvania Department of Environmental Protection (PADEP) uses the number of unique violation ID numbers issued to calculate their totals. However, historically, the department would often lump several issues that showed up on the Compliance Report together under the same violation ID. Others have taken to looking at Notices of Violations (NOV’s), which are more limited in number. Still others exclude any violations marked as being administrative in nature, an idea that makes sense superficially, but a closer look at the data shows that the label is extremely misleading. For example, “Pits and tanks not constructed with sufficient capacity to contain pollutional substances” is an administrative violation, as is, “Improper casing to protect fresh groundwater”.
In addition to all of that, the cast of operators is constantly shifting as new operators come on board, old ones get bought out by rivals, joint ventures are formed between them, and the like. Sometimes a parent company will shift the active operator status to one of its subsidiaries, so wells that were originally Consol will then be listed under CNX, for example.
In terms of violations per well, there is a further complication, in that all of the drilled wells data reflect the current custodians of the wells, whereas the violations data reflect those that received the violations. The result is that there are records issued for Turm Oil (really!) for wells where Chesapeake is now listed as the operator. In some respects, this makes sense: why should Chesapeake carry the burden of the legacy mistakes of Turm in their compliance record?
But it does make analysis somewhat tricky. My approach has been to combine operators that are obviously the same parent company, and to do the analysis in several different ways, and over different time frames. Who’s ready for some numbers?
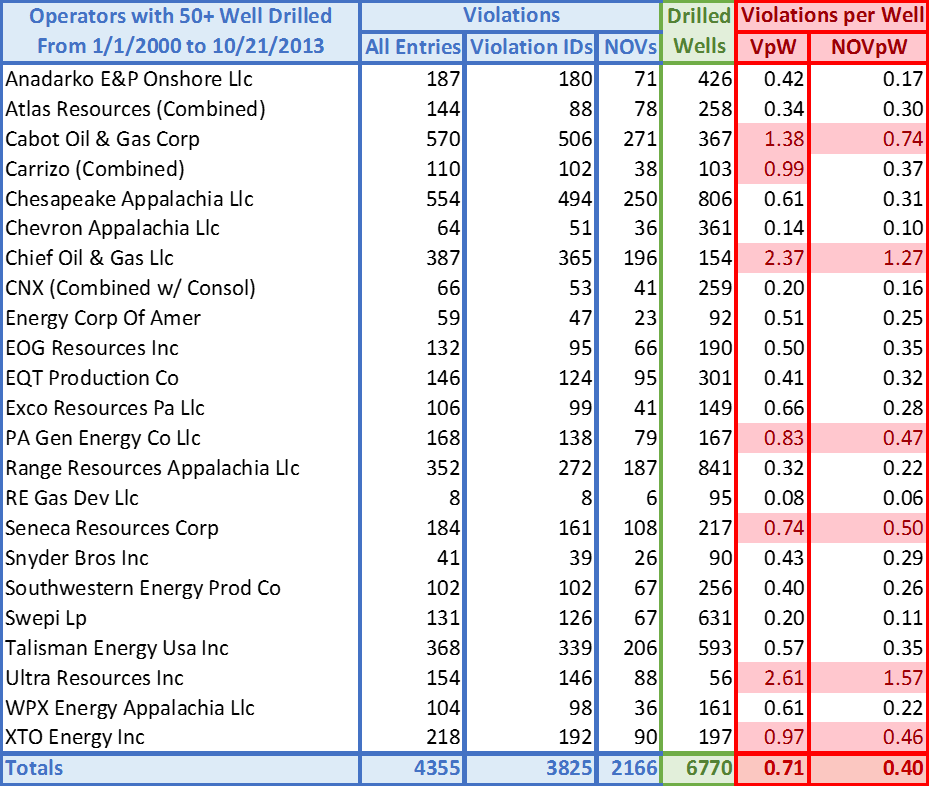
Violations per Well (VpW) for operators of unconventional wells in Pennsylvania with 50 or more wells. Those operators with scores higher than the average of their peers are highlighted in pink.
Here, violations per well are based on the number of violation ID’s issued, where as NOVpW is based on the number of Notices of Violations. The date range for this table is from January 1, 2000 through October 21, 2013, and please note that the totals represent those that are included on the chart, not statewide totals. A lot of violations are lost of the shuffle when we look at only the largest current operators, but it also helps eliminate some of the noise that can be generated with small sample sizes, as well as with the inconsistencies described above. Here’s a look at data from this year:
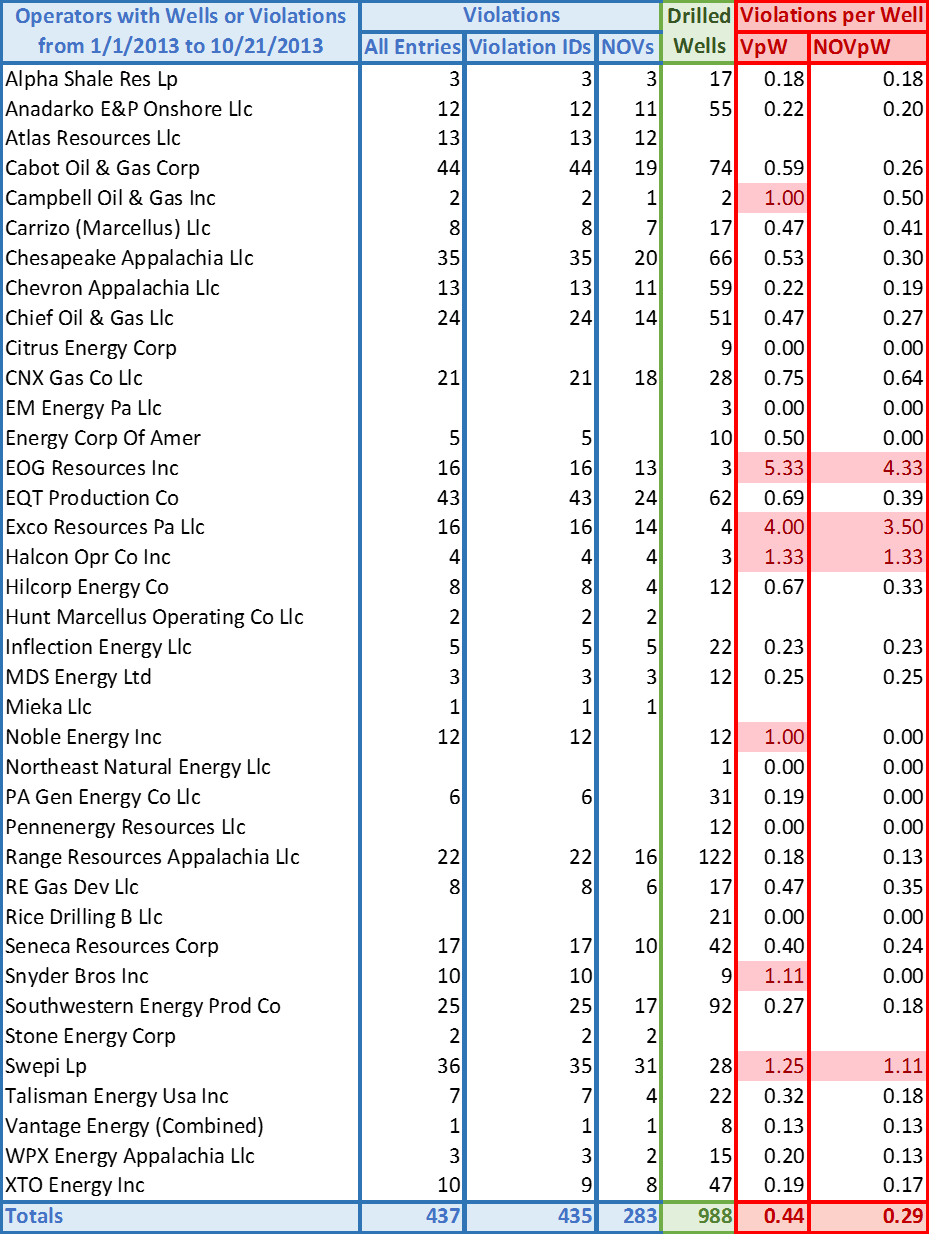
Violations per Well (VpW) for operators with unconventional wells in Pennsylvania in 2013, through October 21. Those operators with scores higher than on violation per well or NOV per well are highlighted in pink.
Notice that the highest violations per well and notices of violations per well scores are much higher than the data aggregated since 2000, whereas the statewide averages of the two scores are actually much lower. The former is almost certainly attributable to having a smaller sample size, but there is something else at play with the latter:
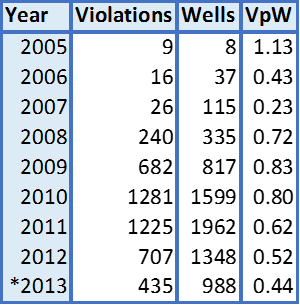
Violations per well of Pennsylvania’s unconventional wells. 2013 data through 10/21/2013.
The number of violations per well drilled has been steadily decreasing since 2009, and it is now down to an average of less than one violation issued per every two wells. There is nothing in the data that indicates why this is the case, however.
Note: This post was edited on 12/18/2013. The table showing operators violations per well and NOV’s per well in 2013 originally stated that that values higher than the average of their peers are highlighted in pink. In fact, only those with values of 1.00 or higher are highlighted in that fashion.
https://www.fractracker.org/a5ej20sjfwe/wp-content/uploads/2013/10/WetzelCo_truck.jpg250610Matt Kelso, BAhttps://www.fractracker.org/a5ej20sjfwe/wp-content/uploads/2025/09/2025-Wordmark-Logo.pngMatt Kelso, BA2013-10-29 11:12:202020-07-21 10:41:36Violations per Well Among PA Operators
When I met with John Dawes and Brook Lenker to discuss the possibilities of applying my aerial photography to environmental issues in Pennsylvania, I knew that my aerial photography career, which is really more a hobby, a passion and an avocation, was about to change. For years I’ve been taking aerial photographs, mainly focusing on the Pennsylvania Coal Region – purely as art – showing my work in galleries and universities, and self-publishing books. I refrained from expressing an opinion about PA coal mining, leaving it to the viewer to inform the images with their own knowledge of the environmental effects of mining.
As a guest speaker at the 2013 EPCAMR Conference at State College, I learned a great deal about the problem of mine water treatment, and soon had the opportunity to photograph a mine water treatment facility in the Panther Valley for Schuylkill County Headwaters. A friend had asked me for years why I don’t photograph the fracking activities in Pennsylvania, and my answer was that the fracking operations don’t lend themselves to the kind of artistic interpretation from the air as does the Coal Region. But when John mentioned photographing the Loyalsock State Forest fracking activity, I saw that I could use my aerial photography for a higher purpose.
I quickly began studying maps of the Clarence Moore Lands, in which Loyalsock is situated. I looked at images of Rock Run and many other places in the Forest, and then visited and hiked in the Forest. I saw that this was a place of great natural beauty and an ecological treasure. I learned that this precious forest is being threatened by fracking activity that is growing at an astounding rate throughout the forest. I knew I wanted to help document this environmental assault with my photography, and the question became how to most effectively and safely do this.
I have almost always taken my aerial photographs from my own small airplane, which is essentially an advanced ultralight. Flying and photographing at the same time has been the nexus of my art. Loyalsock is a large, rugged and remote area, however, with few airports or emergency landing fields nearby. After much consideration, I decided to hire a pilot to fly me to Loyalsock so that I could concentrate solely on taking photographs. I found a retired Air Force Colonel in Selinsgrove, now a flight instructor, who was eager to assist me in this project. He had been a B52 pilot in Vietnam and had participated in Operation Linebacker 2. It seemed to me that, perhaps, this mission was similar to what he may have done in his combat years, but now, for the good of saving the environment, rather than dropping bombs on it.
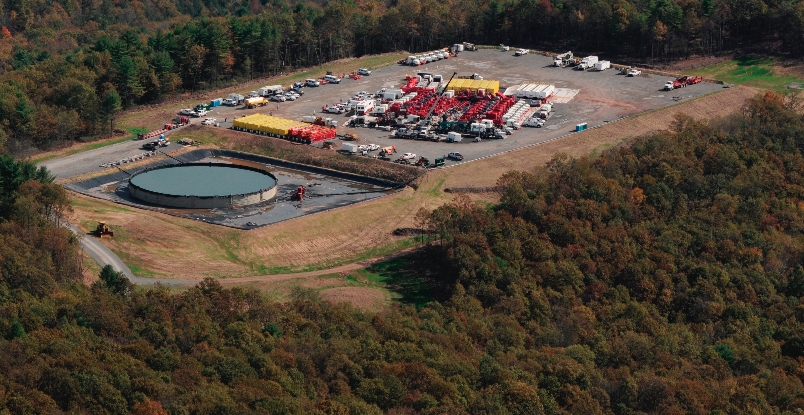
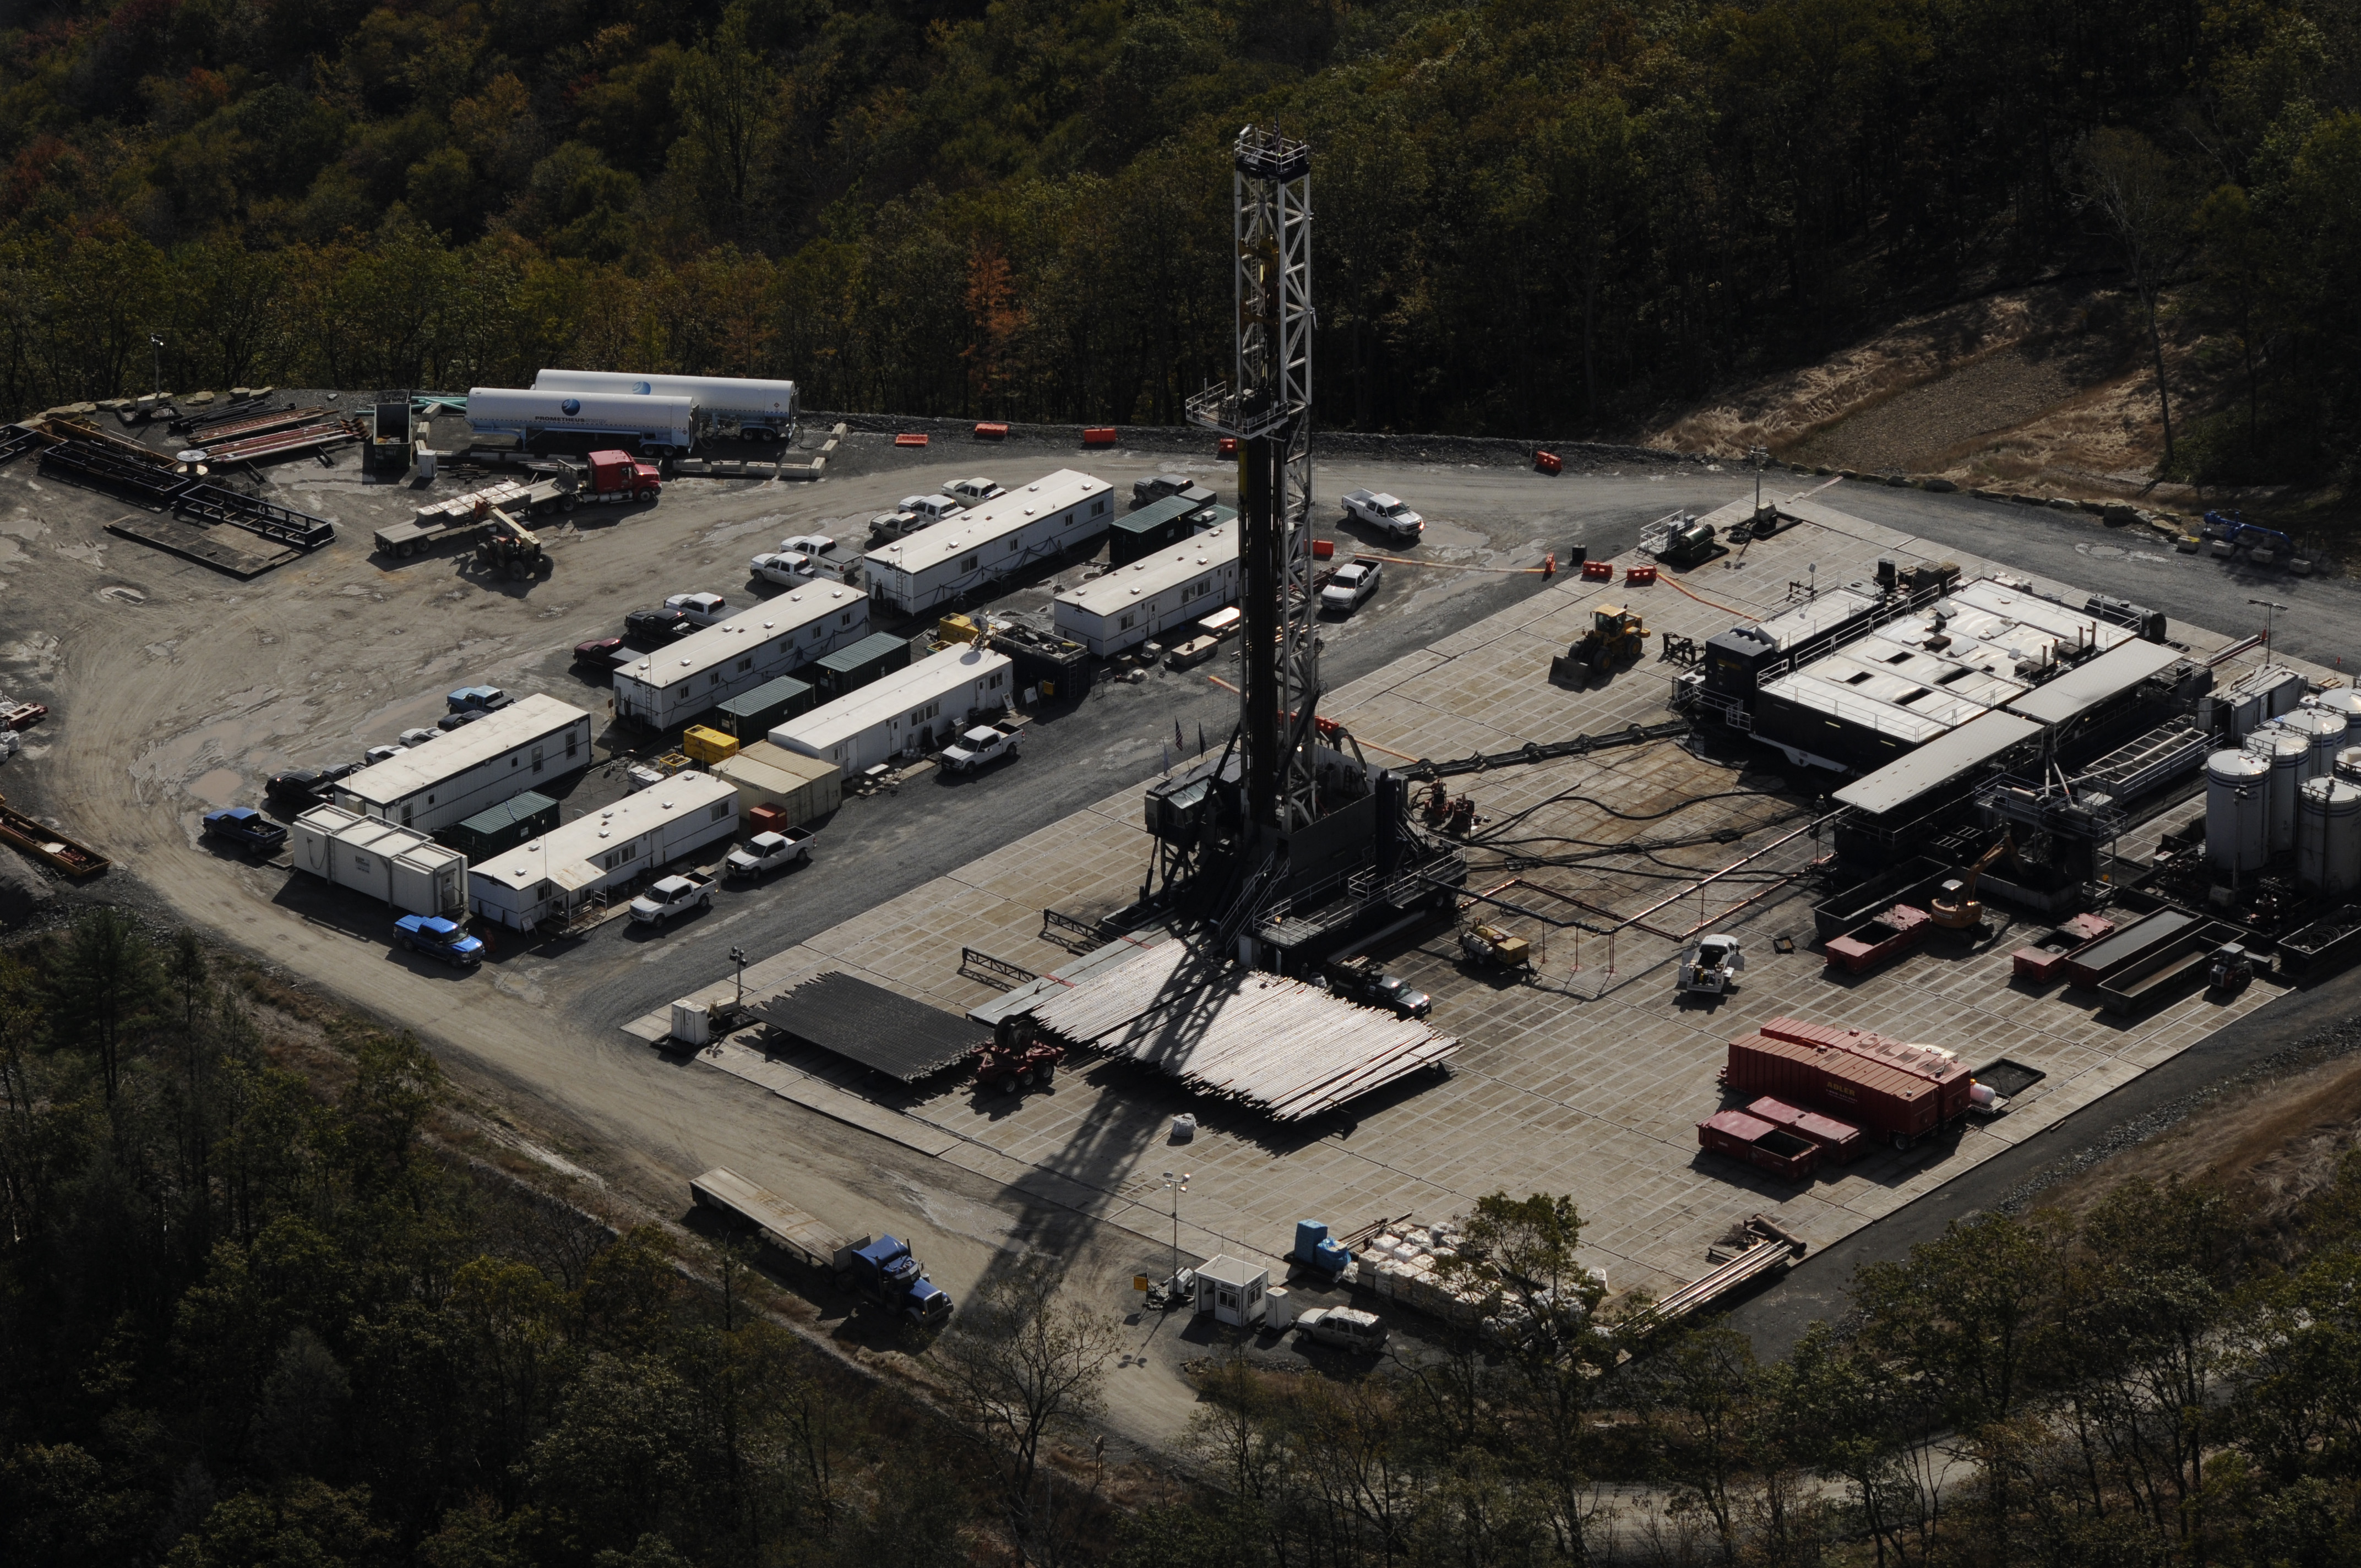
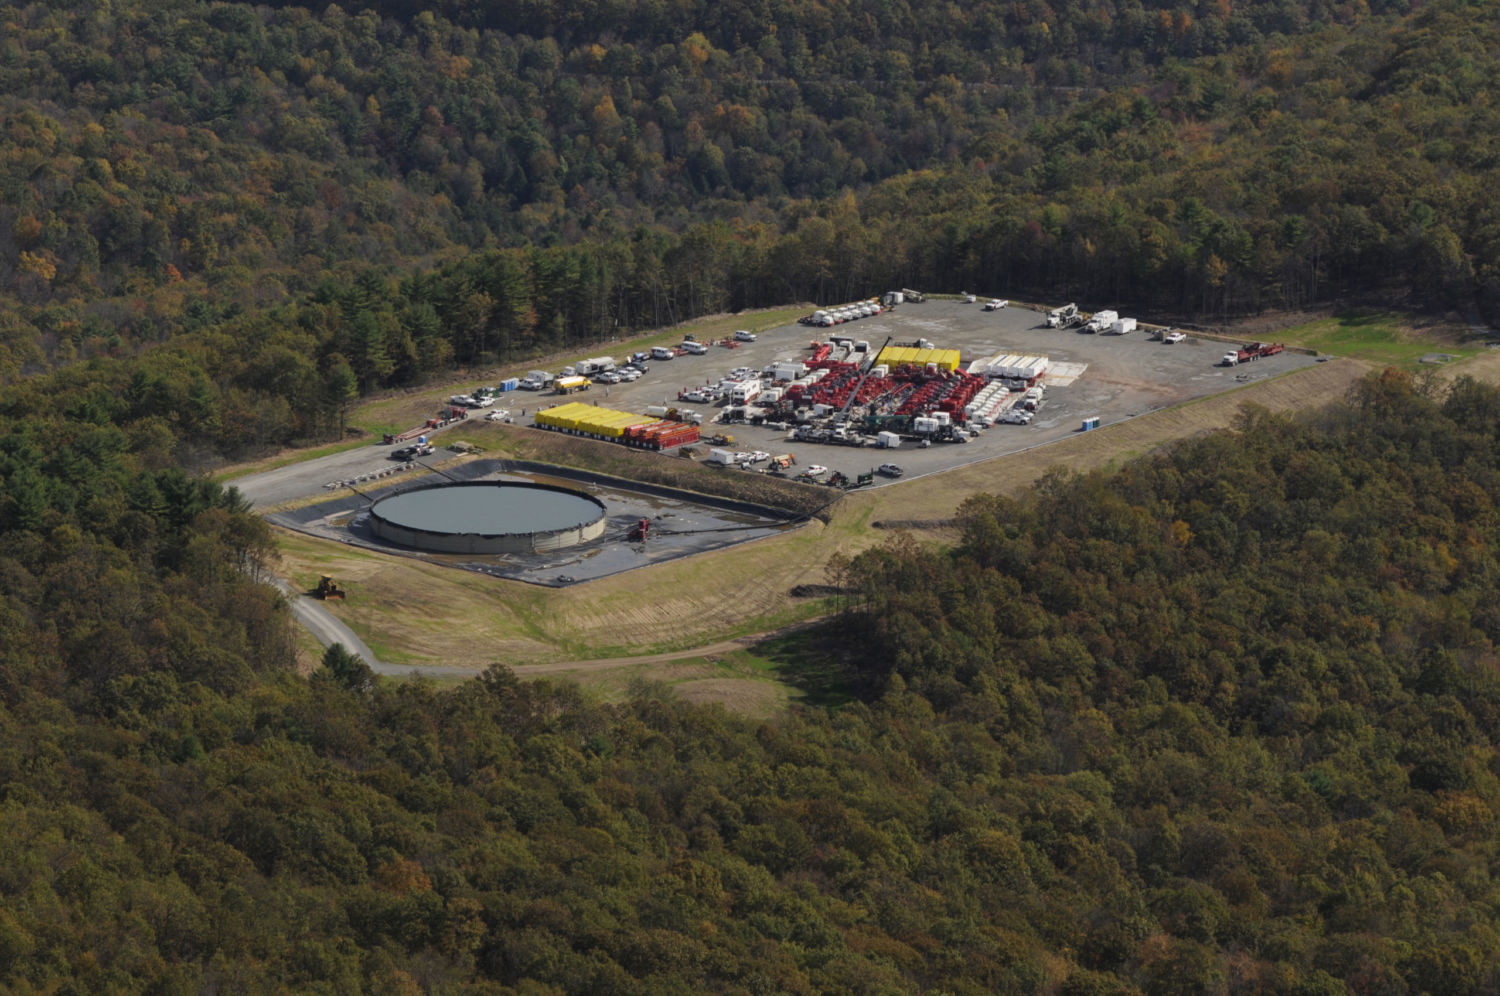
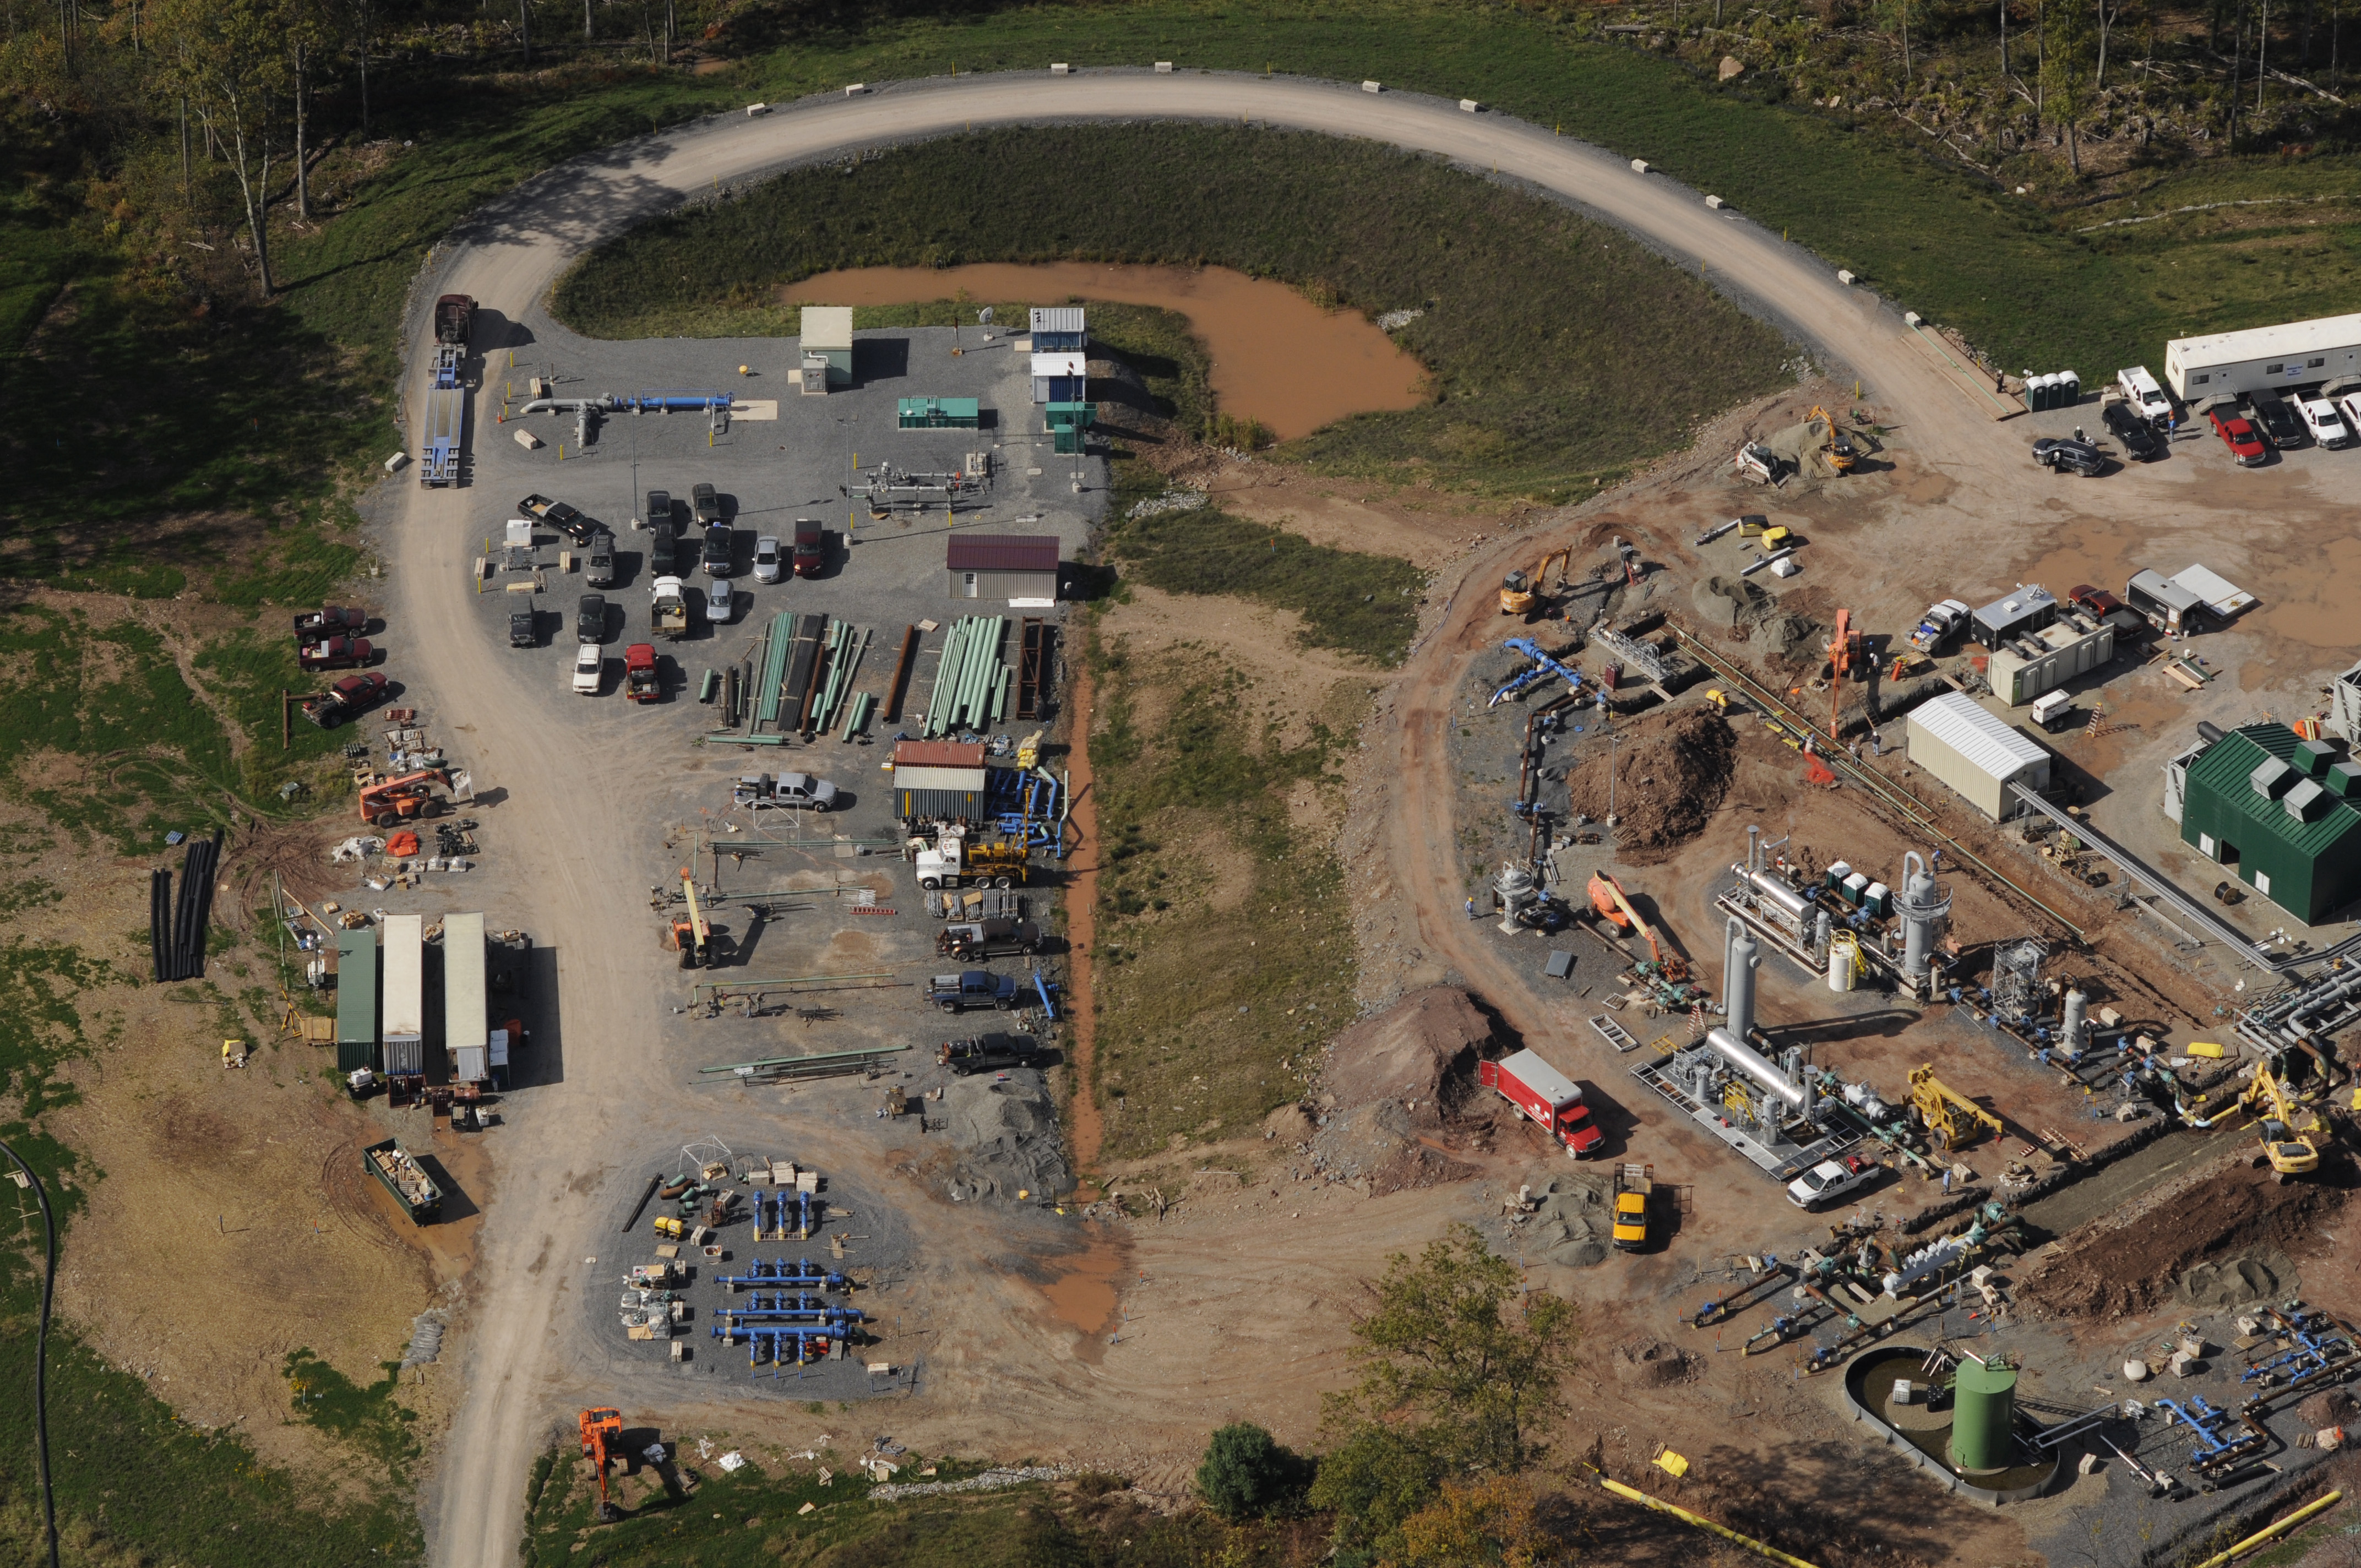
With the FracTracker Loyalsock map (below) and some coordinates in hand, we departed Selinsgrove in a Cessna 172 on October 9th. Starting with Bodine Mountain Northwest of Trout Run, we could see fracking operations covering nearly every hilltop. I opened the window of the 172 and started photographing, and as we flew Northeast over Loyalsock, we could see fracking operations everywhere. It was difficult to make out the exact boundaries of the Loyalsock State Forest from the air, and it appeared that the heart of the Forest is, for now, being spared from direct drilling. But I knew that it was just a matter of time before the Forest itself became the victim of unchecked exploitation, threatening the pristine native trout streams, polluting the air, and potentially driving endangered bird species from the area.
Drilled unconventional wells in Pennsylvania and control of mineral rights on state forest land. To access full controls, such as legends, layer controls, and layer descriptions, please click the expanding arrows in the top-right corner of the map.
Flying over the forest, I was very glad that I opted to hire a pilot for this work. It was tricky flying low over ridges and valleys trying to photograph every site. The gusty winds were knocking around the 172, which is much heavier than my aircraft. It was a very productive and successful flight, but also disheartening. Flying allows us views of the Earth that are unavailable from the ground. It has always seemed to me that, especially in Pennsylvania, if there is an unspoiled place of natural value, someone will find a way to destroy it. Loyalsock is a natural treasure which must be protected, but from the growing abundance of fracking operations that can be witnessed from the air, it appears that saving this Forest is an enormous challenge. Thanks to resources like groups like the Save the Loyalsock Coalition, at least the best effort is being made.
Pete Stern is an aerial photographer and artist. His work is featured on his website: www.psartwork.net.
https://www.fractracker.org/a5ej20sjfwe/wp-content/uploads/2013/10/Screen-Shot-2013-10-23-at-1.31.51-PM.png415804Guest Authorhttps://www.fractracker.org/a5ej20sjfwe/wp-content/uploads/2025/09/2025-Wordmark-Logo.pngGuest Author2013-10-23 10:25:542020-07-21 10:41:36Loyalsock from the Sky
Weld County, CO – 9-14-13: A floating tank leaks an unknown fluid on flooded farm (Photo By Andy Cross/The Denver Post)
By Karen Edelstein, NY Program Coordinator, FracTracker Alliance
We’re now in the aftermath of September’s catastrophic floods in Colorado that hit Boulder and Weld counties notably hard, damaging or destroying 18,000 homes and killing at least 10 people. The gas industry has asserted that relatively little damage occurred; only 37,000 gallons of fluid escaped into the rural landscape, including over 5,200 gallons of crude oil that seeped directly into the South Platte River. According to Conoly Schuller, president of the Colorado Oil and Gas Association, “In the context of hundreds of billions of gallons of rain, and millions of gallons of raw sewage, 37,000 gallons is pretty small.”
Environmentalists, however, say that the long-term impacts of the flooding cannot yet be determined. They also point out how the dangers of placing oil and gas rigs in flood-plain areas are a recipe for disaster. Amy Mall, policy analyst for the Natural Resources Defense Council, noted the sheer luck that most of the flooding occurred in areas where active fracking operations were not actually happening; most of these wells were already in production. About 1,900 wells were “shut in” in preparation for the predicted flooding, but storage tanks and other production-related equipment experienced the impacts of the flood waters.
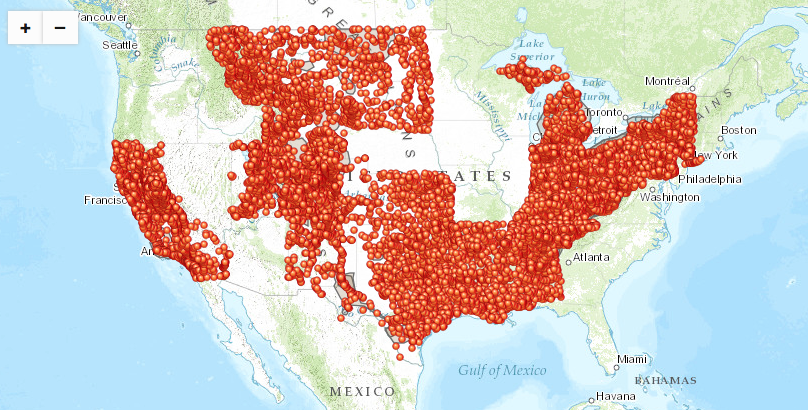
FracTracker Alliance created the following map of United States Geological Survey (USGS) streamflow gage stations across the Lower 48, in areas of mapped shale plays. Each of the USGS points is interactive. Pop-up bubbles allow the user to link directly to the USGS websites for that particular stream gage. Note that not all of the stream gages are currently active; some show only historic USGS data. Many sites, however, show a wealth of real-time information on stream discharge and allow the user to customize time parameters. USGS also includes stream gage height and contributing drainage area. Zooming into an area, users will also see wetlands delineated as part of the National Wetlands Inventory. These wetlands may also be endangered by floods that pick up waste material from oil and gas extraction sites.
Click here to view the full-screen version of this map.
https://www.fractracker.org/a5ej20sjfwe/wp-content/uploads/2013/10/Screen-Shot-2013-10-23-at-1.27.59-PM.png410808Karen Edelsteinhttps://www.fractracker.org/a5ej20sjfwe/wp-content/uploads/2025/09/2025-Wordmark-Logo.pngKaren Edelstein2013-10-22 23:59:362020-07-21 10:41:35USGS Stream Gages Helpful in Monitoring Risks in Shale-gas Extraction Regions
By Kyle Ferrar, CA Program Coordinator, FracTracker Alliance
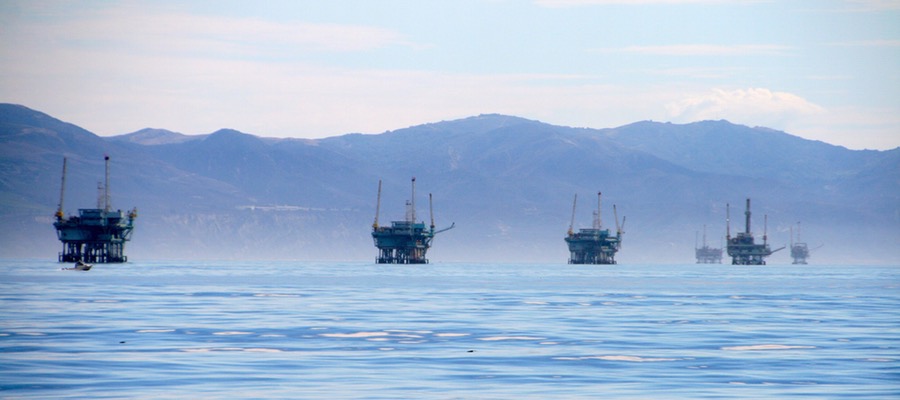
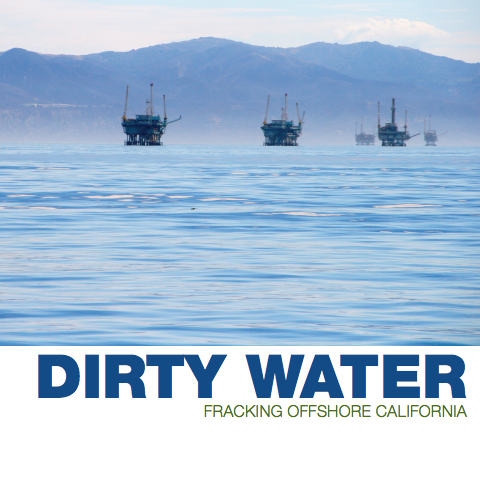
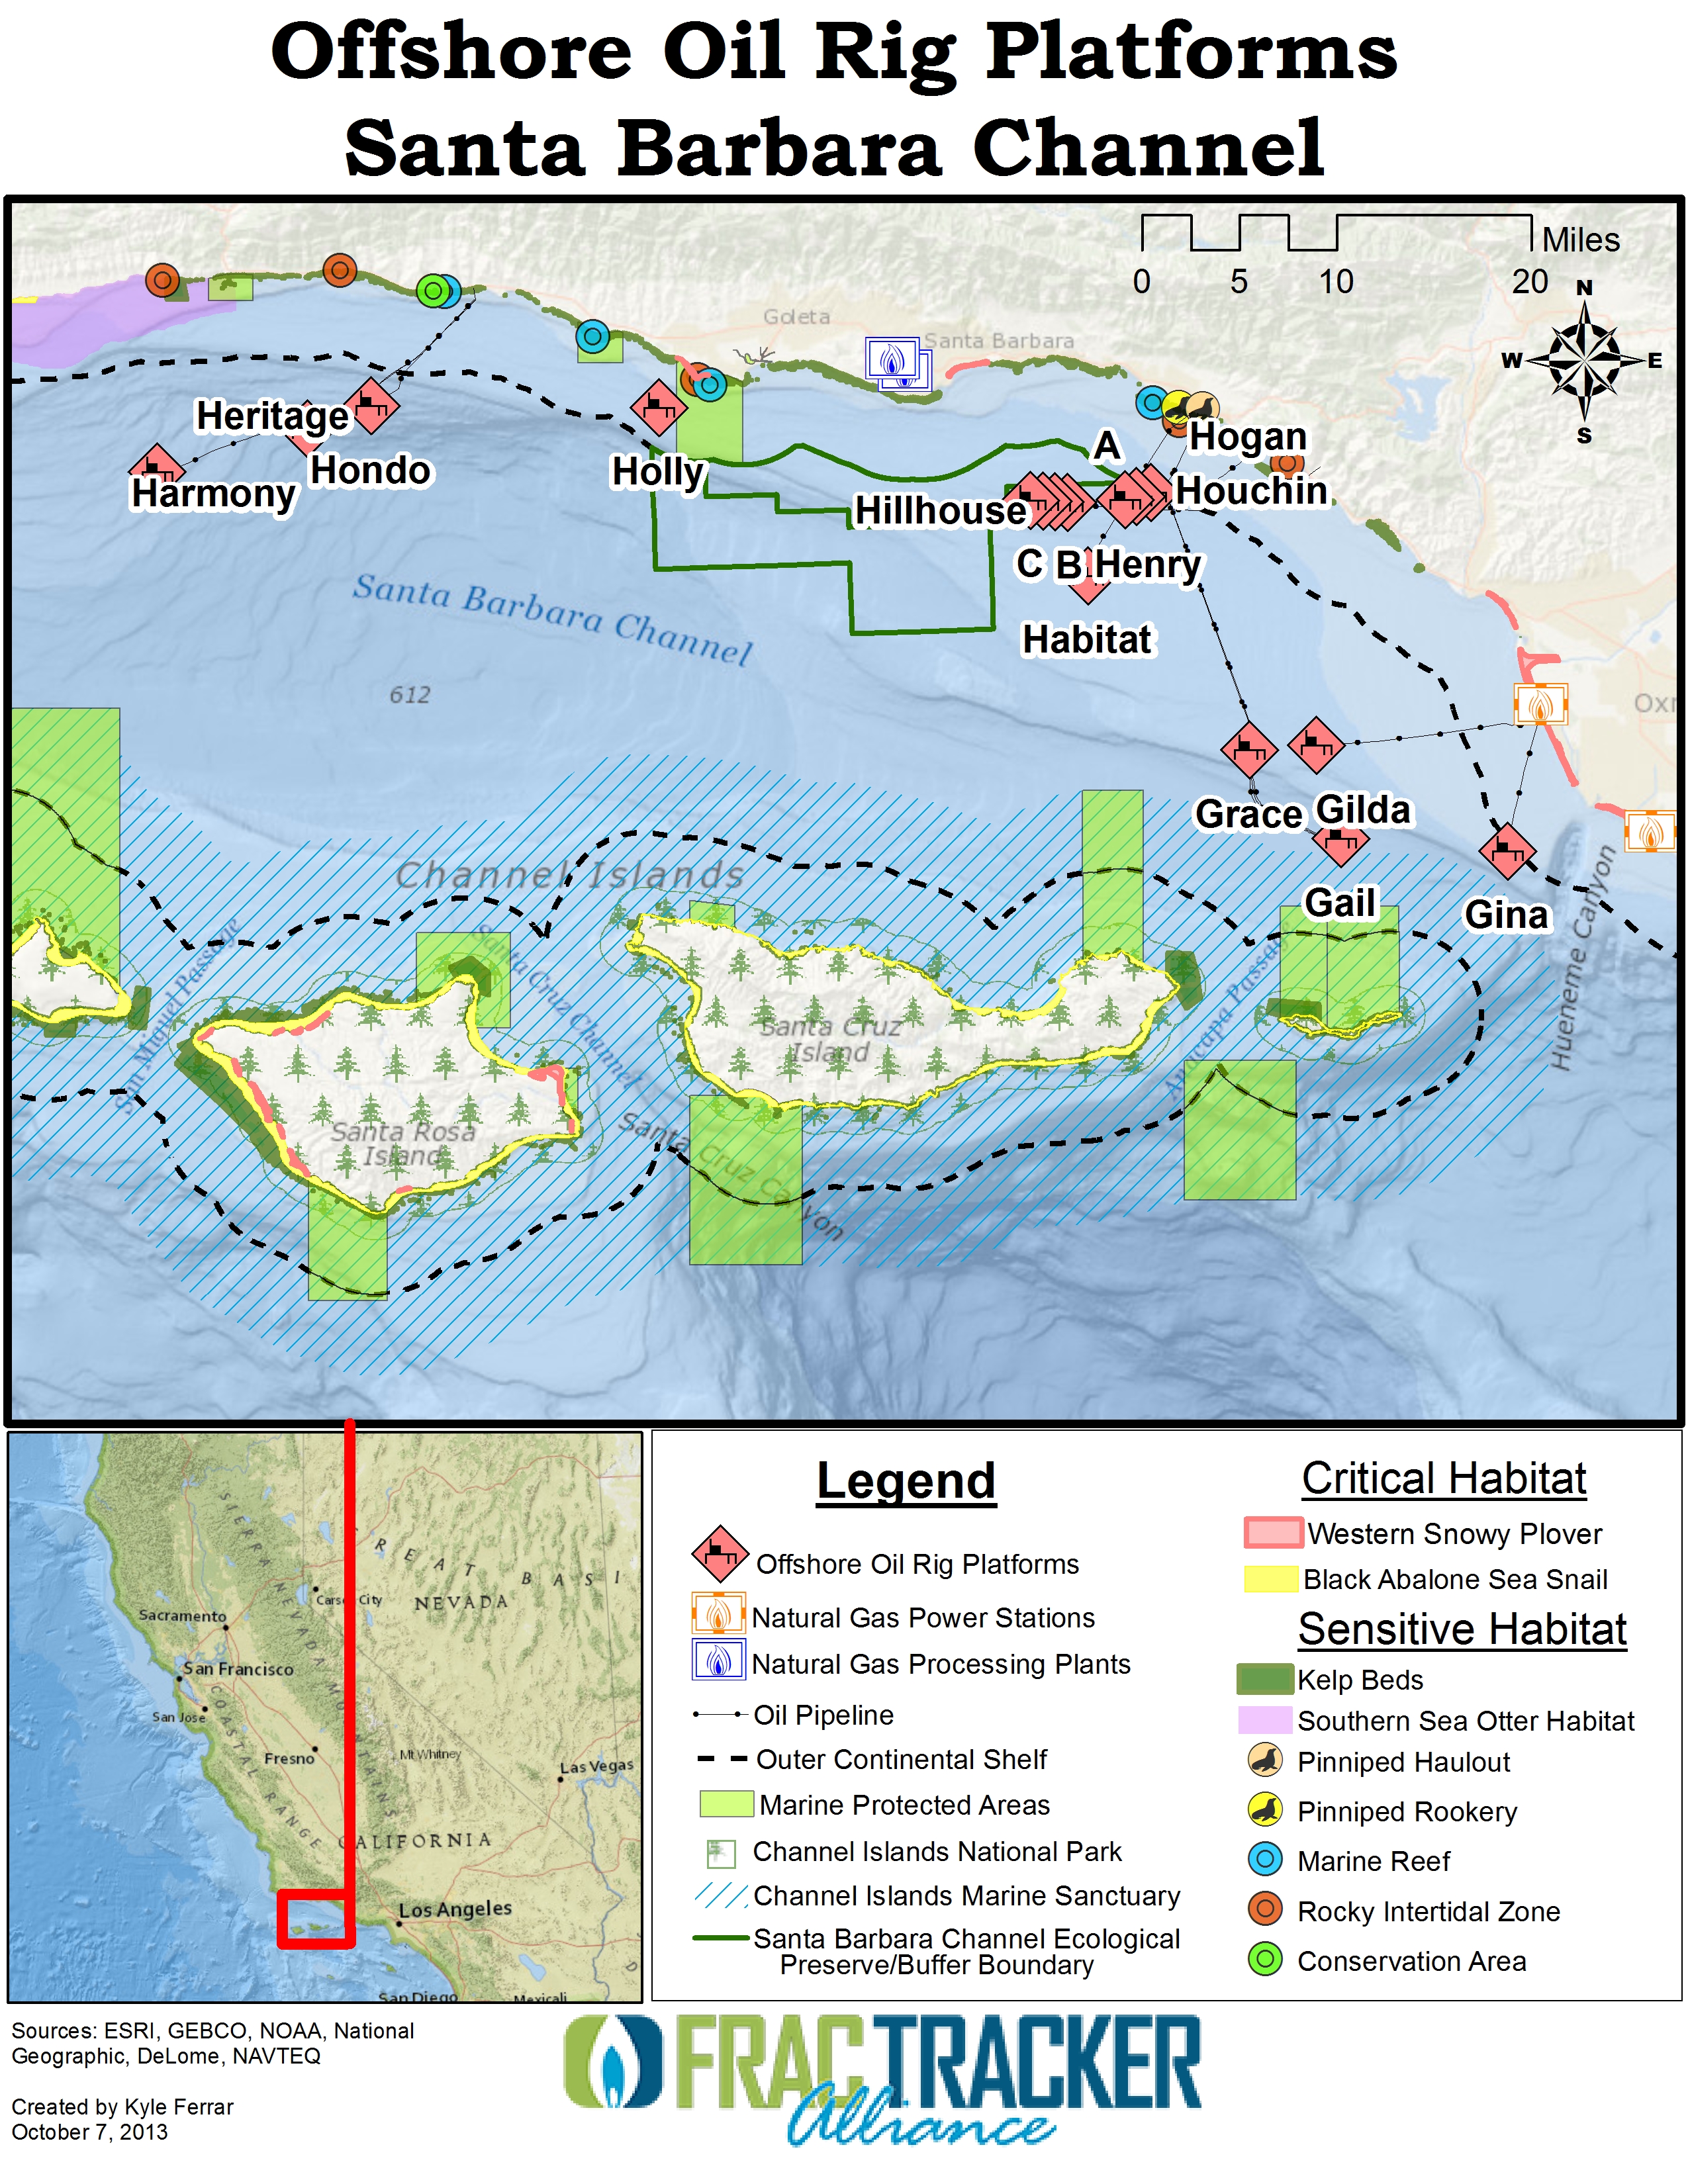
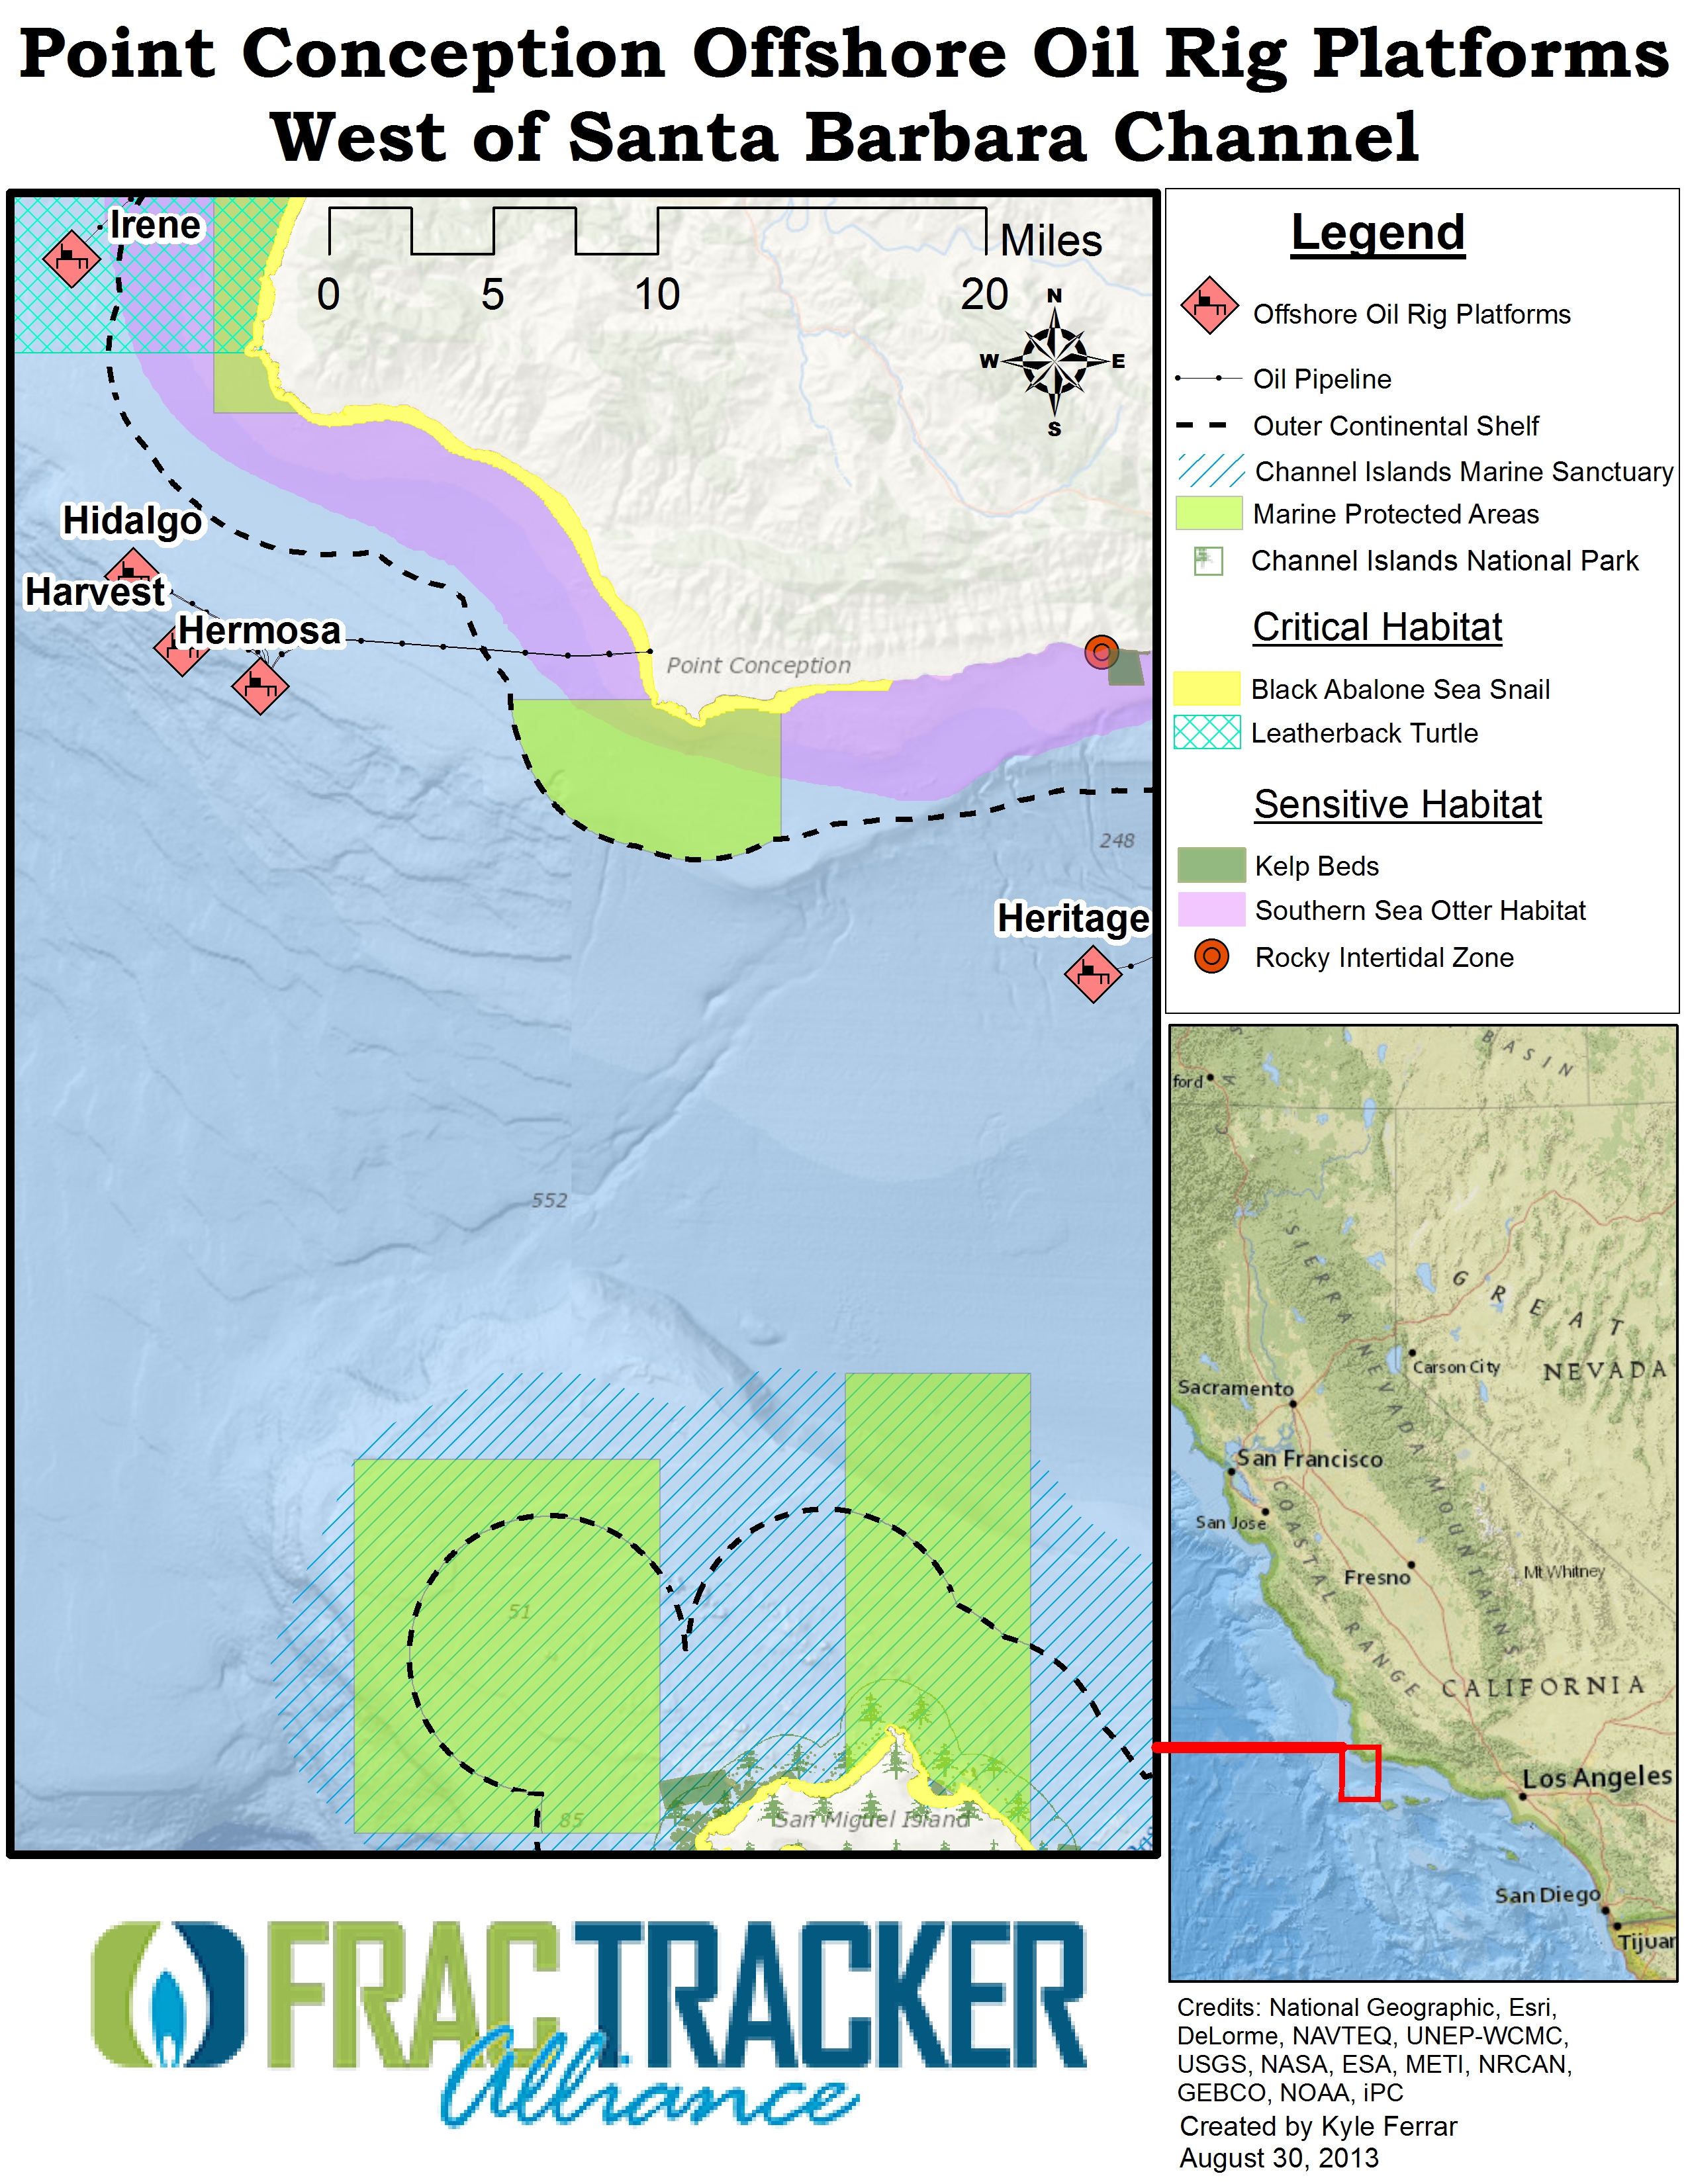
On October 16th, the Environmental Defense Center released a report focused on the use of hydraulic fracturing by offshore oil drilling platforms off the coast of California.1 The full report can be found on the EDC’s website. I was asked to assist in creating the report’s GIS maps, the results of which are described partially in the article below and are shown on the right. An interactive map of this data, overlaid with additional data layers including oil spills and offshore wells is below.
Regulation of Offshore Drilling
California has 24 offshore oil rigs, with only one of them located, and therefore regulated, in state waters. In the map below, the regulated platform is labeled as “Holly.” The rest of the platforms, including platform “A” which was responsible for the Santa Barbara oil spill of 1969, are located in federal waters beyond the “outer continental shelf” (OCS) boundary, shown in the map with a dashed line.
International, federal, and state laws are interrelated legal regimes that impact development of offshore oil, gas and other mineral resources in the US. Governance is bifurcated between state and federal law. States have authority in the “three-geographical-mile” area extending from their coasts. Federal regulatory regime governs minerals located under federal waters that extend out past state boundaries at least 200nautical miles from shore. This is known as the “exclusive economic zone,” for which coastal nations have the sovereign right to explore, exploit, conserve, and manage marine resources. The basis for most federal regulations is the Outer Continental Shelf Lands Act (OCSLA), which provides the system for offshore oil and gas exploration, leasing, and ultimate development. Regulations range from health, safety, resource conservation and environmental standards to requirements for production-based royalties and in some cases royalty relief and other development incentives. The moratoria on offshore leasing on many areas of the outer continental shelf were lifted in 2008 by President Bush and the 110th congress. Prior to that, several areas were made available for leasing in 2006 including the Aleutians and the Gulf. Recent changes to authorities regulating offshore development resulted after the Mineral Management Service was implicated in numerous scandals, including uncollected royalties estimated to amount to $160 million in 2006 alone.2 Offshore resource extraction is now regulated by the Bureau of Ocean Energy Management (BOEM) and the Bureau of Safety and Environmental Enforcement, both agencies of the Department of the Interior.
Investigating Hydraulic Fracturing
A recent freedom of information act request filed by the Environmental Defense Center (the group was formed in response to the 1969 Santa Barbara oil spill) identified 15 offshore drilling operations that used hydraulic fracturing. (Update: recent information from the FOIA shows 203 frac’ing operations from 6 different rig platforms!)4. This number is most likely a vast underestimation, as the Bureau of Safety and Environmental Enforcement (BSEE) estimates 12% of offshore operations in the Gulf use hydraulic fracturing. These “frac” operations were conducted without notifying the necessary regulatory agencies. The majority of this activity was conducted from the platforms Gilda and Gail, both labeled in the maps. While these offshore energy resources may be oil-rich, the fossil fuel resources pale in comparison to the biodiversity and ecological productivity of the Santa Barbara Channel and the California Channel Islands. The geography of the Channel Islands was formed by the cold-water swells of Northern California meeting with the warm-water swells of Southern California. This convergence resulted in a plethora of ecological microcosms in addition to the critical and sensitive habitats of endangered and threatened species shown in the maps.
Recently, the Department of the Interior approved four more hydraulic fracturing operations at these offshore platforms. Take note of the many ecological preserves and areas of protected/sensitive habitat in the midst of the many offshore wells and platforms. The map layer showing historic oil spills deserves special attention, with focus on the spills at platforms Gail and Gilda. Seeing this, it is alarming that the proposals were not required to conduct environmental impact assessments, and were instead granted “categorical exemptions” from the environmental analyses and public transparency actions strictly required by the National Environmental Policy Act. These actions (or lack thereof) in such an ecologically complex environment, especially considering it is the historical site of the US’s third largest oil spill, raises serious questions of compliance with other federal laws including the Clean Water Act, Endangered Species Act, Marine Mammal Protection Act, and Coastal Zone Management Act.3
Policy Recommendations
Additionally, the EDC report makes several policy recommendations:
Place a moratorium on offshore hydraulic fracturing, or “fracking,” and other forms of well stimulation unless and until such technologies are proven safe through a public and transparent comprehensive scientific review
Prohibit the use of categorical exclusions to authorize offshore fracking and other forms of well stimulation
Formally evaluate offshore fracking and other forms of well stimulation through a Programmatic Environmental Impact Statement
Initiate consistency reviews with the California Coastal Commission for all exploration plans, development plans, drilling or modification proposals involving fracking
Ensure that all fracking proposals comply with the Endangered Species Act and Marine Mammal Protection Act
Review and revise the Clean Water Act permit governing offshore oil platforms to directly address chemicals in frac flowback and other wastewater, either establishing effluent limitations for those chemicals or denying discharge altogether
https://www.fractracker.org/a5ej20sjfwe/wp-content/uploads/2013/10/Offshore-CA-Feature.jpg400900Kyle Ferrar, MPHhttps://www.fractracker.org/a5ej20sjfwe/wp-content/uploads/2025/09/2025-Wordmark-Logo.pngKyle Ferrar, MPH2013-10-20 18:07:042020-07-21 10:41:35Hydraulic Fracturing Offshore Wells on the California Coast
By Brook Lenker, Executive Director, FracTracker Alliance
Touring Doddrige County, West Virginia
On September 26th, FracTracker staff and board member, Brian Segee, traveled to Doddridge County, West Virginia for an eye-popping tour. This endeavor was led by Diane Pitcock of West Virginia Host Farms and local activists who are deeply concerned about the fate of their region – an area overwhelmed by shale gas development.
Approaching West Union on route 50, a giant flare roars above the roadway and about every fourth vehicle, mostly pickups, tankers, and dump trucks, suggest association with the shale gas industry. At the café in town, vehicles baring EQT logos fill the lot. Nearby, Middle Island Creek flows thick and brown despite an absence of rain for the past five days. Diane says it’s frequently muddy from the constant pipeline construction upstream.
Mark West site
The first stop is a Mark West complex with a cryogenic plant burning off excess hydrocarbons, a yard for loading CNG on tanker trucks, one well pad, and another in the works (see photo right). To build the latter, a hillside is being disemboweled. The heavy equipment and a train of idling trucks release diesel emissions. A stream once coursed through the field in the foreground, but the previous landowner had filled and relocated it without a permit. Watching and photographing from the adjoining rail trail, irony rules. The trail sign is topped by a company-placed “No Trespassing” sign. From the discussion and observations, it’s clear that the environment is being devalued and degraded in Doddridge County.
The tour continues on to a water withdrawal site. According to the permit numbers plastered beside the conduit, the site hosts approximately 50 unconventional gas wells – each requiring millions of gallons of water to crack the shale and hasten the flow of gas.
Right-of-Way?
Next, we traverse gravelly back roads widened by the industry. The roadway expansion often requires the purchase of right-of-way from landowners. Our guides tell us that if a landowner says no, sometimes they are told “if you don’t sell, we’ll take it by eminent domain.” The threat is hollow if not deceitful, since in such circumstances the industry has no right to exercise eminent domain. The industry does have the right to access mineral rights they may own, however, even if they don’t own the property on the surface. In West Virginia, these “split estate” situations are as common as country music, only they project a much more somber note to the landowner, especially when the gas company comes knocking.
A Neighbor’s Perspective
Well pad visit
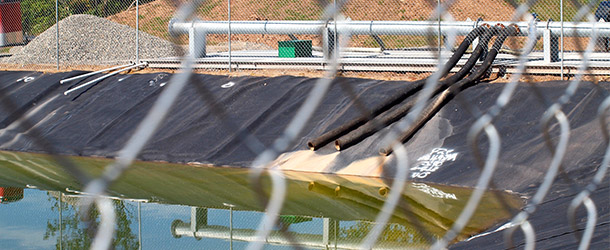
A freshly cut and clearcut road travels onward and upward across a half mile or more of former forest where a nice lady owns the land but not the natural gas being accessed more than a mile below. Piles of logs line the roadside, a reminder of what was. The road ends at a fenced impoundment holding thousands of gallons of impaired water. An odor, akin to antifreeze, hangs in the dry, dusty air. The lady tells the group about the wildlife she has seen, including the songbirds that rest on the high fence and likely drink from the poisonous reservoir.
Downhill lies an expansive well pad, big enough for a football game if there wasn’t the metallurgical din and sprawl of a towering drill rig and the pipes and machinery that accompany it. The landowner’s presence enables our group to enter the working well pad where workers, sleeping off a long shift, emerge from a trailer. While over 30 of her roughly 80 acres are affected by drilling-related activities, only a payment for timber is in negotiation. Meanwhile, she pays the taxes on the land – a parcel that will never quite be the same. Tom Bond, a local and well-informed activist, wistfully comments, “This is just the beginning. Eventually there will be well pads everywhere.” He may be right.
Pipeline Construction
A golden afternoon closes crossing steel plates over an open trench and green pipeline. The corridor is an undulating, exposed ribbon of ground spanning ridge to ridge in each direction. There are many more just like it snaking across the hills and hamlets of West Virginia from one compressor station to another.
From witnessing the industry’s heavy footprint to the stories we hear of problems emerging in home water wells, somehow a happy John Denver tune now seems melancholy.
By Kyle Ferrar, CA Program Coordinator, FracTracker Alliance
FracTracker was recently in attendance at the American Industrial Hygiene Association annual conference, held in Miami, FL, September 28-October 1st. The FracTracker Alliance’s Kyle Ferrar participated in the workshop “Natural GAS EXTRACTION – Rising Energy Demands Mandate a Multi-Perspective Approach.” The workshop was moderated by Dr. Mark Roberts, and in addition to the FracTracker Alliance, there was a presentation by NIOSH Senior Industrial Hygienist Eric Esswein and the well-versed chemist, engineer, and industry associate/consultant John Ely. The workshop was well-attended (sold out).
https://www.fractracker.org/a5ej20sjfwe/wp-content/uploads/2012/02/Twitter-FracTracker-Logo.png291317Kyle Ferrar, MPHhttps://www.fractracker.org/a5ej20sjfwe/wp-content/uploads/2025/09/2025-Wordmark-Logo.pngKyle Ferrar, MPH2013-10-10 17:47:292020-07-21 10:41:352013 American Industrial Hygiene Association Fall Conference
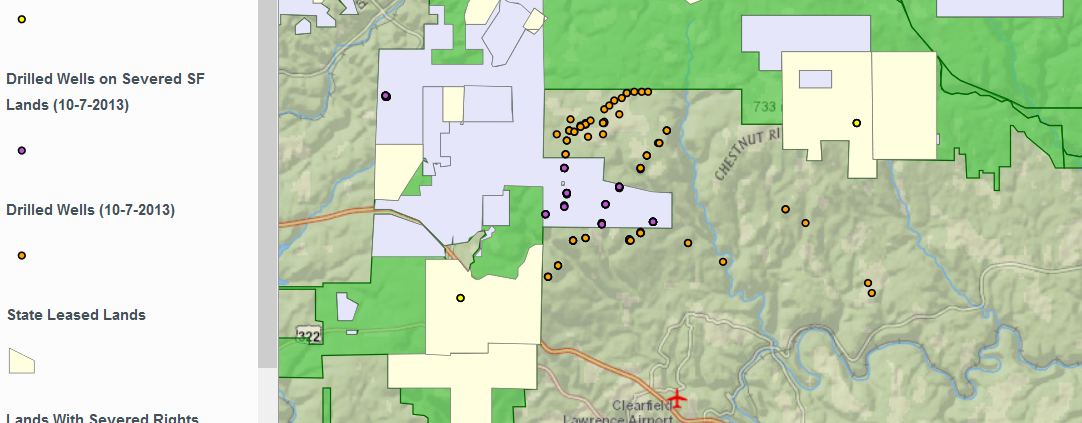
A few years ago, the Department of Conservation and Natural Resources (DCNR), the agency responsible for state park and state forest lands throughout Pennsylvania, published maps on their website showing which state forest lands had been leased for the purpose of unconventional oil and gas exploration and development. Not only has that page been taken down, but the data are also not among the hundreds of Pennsylvania-specific datasets available on the Pennsylvania Spatial Data Access (PASDA), to which DCNR is a key contributor.
This data does still exist though, and it was provided to the FracTracker Alliance from DCNR upon request, along with data showing areas of the state forest where unconventional oil and gas rights are owned by the state, which is not always the case. However, this fulfillment of our data request came with some strings attached:
I understand that the accuracy of this data set and its boundaries cannot be guaranteed and should not be considered precise.
I will not distribute raw data to other entities outside the scope of this request.
I will annually provide the Bureau of Forestry with a status update of the project activities and findings. If the project is abandoned, I will provide the Bureau of Forestry copies of the available information from the project.
I will provide the Bureau of Forestry with copies of draft reports, articles, publications and so forth that result from this analysis.
If requested, I agree to supply the Bureau of Forestry with copies of data analysis.
I understand that the Bureau of Forestry or the Commonwealth of Pennsylvania is not relinquishing any rights or interests with this agreement.
Obviously, this ties our hands with regards to making the data available for download, either through the download section of our site, or through ArcGIS Online, but we feel as if the scope of our request was worded in such a way as to allow us to produce a map of these layers, and make that available for public viewing. Readers interested in obtaining similar data will have to contact DCNR directly, until the agency decides to release the data regarding Pennsylvania’s public lands without conditions.
We have combined this data with drilling data from the Pennsylvania Department of Environmental Protection, so that we can finally take a closer look at drilling on public lands in Pennsylvania, including an approximation of which wells are drilled on lands have been leased by the state, and which by third parties. So with all appropriate disclaimers, here is that map:
Drilled unconventional wells in Pennsylvania and control of mineral rights on state forest land. To access full controls, such as legends, layer controls, and layer descriptions, please click the expanding arrows in the top-right corner of the map.
https://www.fractracker.org/a5ej20sjfwe/wp-content/uploads/2013/10/severed-and-leased.png5671082Matt Kelso, BAhttps://www.fractracker.org/a5ej20sjfwe/wp-content/uploads/2025/09/2025-Wordmark-Logo.pngMatt Kelso, BA2013-10-09 12:42:362020-07-21 10:41:34Leases and Severed Rights in PA’s State Forests