Different Definitions, Shared Discourse
By Jill Terner, PA Communications Intern, FracTracker Alliance
In the previous installment of this three part blog series, I focused on how industry defines sustainability, and how industry mobilizes research done on unconventional drilling in an attempt to label drilling a sustainable practice. That sustainability lends itself to industry’s mostly economic definition. Other groups, which for the sake of this series I will refer to as pro-environmental groups, use a different definition while sharing discourse with industry. This pattern makes sustainability a good example of a boundary object1. The versatile nature of a concept like sustainability makes it possible for different groups of people to talk about it, while each maintains their own understanding of what it is. Here, I will look at sustainability through the lens of groups charged with environmental regulation and protection, and discuss how they might use the same science as industry to tell a different story.
Sustainability Defined by Environmental Groups
While industry adheres to an economic model of sustainability, pro-environmental groups factor in environmental and social sustainability. These three facets – economic, environmental, and social – comprise a more holistic definition of sustainability, wherein the benefits of one facet do not outweigh the costs associated with another2. Focusing only on one component while downplaying others, then, would be inherently unsustainable. In particular, this view means recognizing that things like water quality and the environment are not entities we can separate from things we may care more about, like economic development3.
For example, Perkins (2012) suggests taking this holistic approach to development by rejecting one-or-the-other thinking and by decentralizing community decision-making. Through this people-and-place specific method of development regulation, the voices of all participants are heard. This process leads to representation of both industrial and pro-environmental interest groups, which, in turn, propagates social equity because everyone’s voices are being heard.
In terms of economic sustainability, environmental groups view unconventional drilling as a double-edged sword. While industry related job creation might see positive gains, other sectors of the local economy may be at a loss, particularly arenas that rely on environmental conservation4. As many of the areas slated to host drilling are non-metropolitan areas where activities like agriculture, hunting, and fishing are popular, environmental interest groups warn against drilling in these regions for economic reasons. Just as general sustainability should be viewed holistically, so should economic sustainability; all sectors of the local economy should be considered, not just those related to drilling.
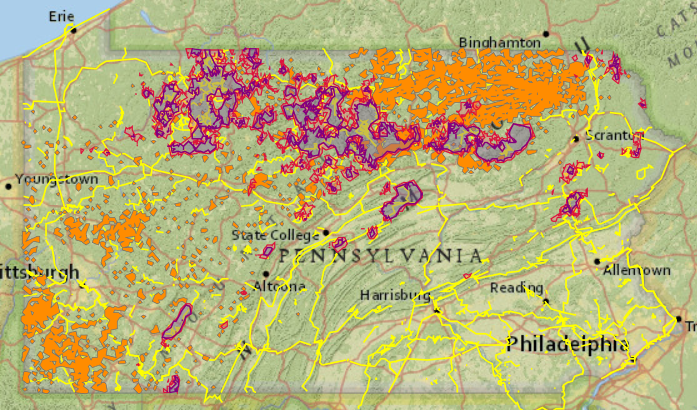
A good way to illustrate this point would be to look at areas like the Marcellus Shale in Pennsylvania and the southern tier of New York. Here, outdoor tourism related industries accounted for over $200 million in 20084. A potential secondary source of income for these areas is owners of second homes that are used to escape the harshness of everyday life. Public fear of industrial consequences, regardless or whether those fears are entirely realistic, could stymy these income sources for areas located over shale formations. The industrial consequences themselves could render the environment untenable to future re-development of outdoor recreational industries4.
Environmentally speaking, regulatory groups and local leaders view sustainable practices as those that occur with the least amount of environmental impact possible3. Air and water pollution primarily related to industry emissions are a major concern, however other environmental threats are also common. These include diesel emissions from truck traffic introduced by industry, degradation of the natural landscape due to industry activity, as well as noise and light pollution5, 6. All of these things must be mitigated in order to substantiate environmental sustainability.
Acknowledging that introducing industry to a community could have different direct and indirect socioeconomic impacts on different demographics and acting on this intersectionality constitutes social sustainability2. That is to say, social sustainability means making sure that all groups of a community are involved in the implementation of development, and reaching out to those members who stand to be negatively impacted by industry’s presence. As I mentioned above, making sure that all interests within a community receive fair and adequate representation is one way to do this. As one can imagine, these three components of sustainability are dynamic and connected, and weighing them against one another results in something unsustainable.
How Environmental Regulatory Groups Use Science
As I mentioned in my previous installment of this series, little detailed research has been conducted on any impacts of unconventional drilling on local economies. As a result of this, many environmental regulation and protection groups look at economic patterns that have occurred in other cities and countries. One analogy that researchers have used is that of the “resource curse.”4 This is the tendency for areas rich in natural resources to be economically poor and experience relatively slow economic growth, typically due to conflicting national and state level interests. Proponents of environmental regulation and protection warn against rapid growth of extractive practices in resource rich areas, as it could ultimately lead to a decline in economic growth and stymieing of community betterment.
Related to the “resource curse” is the boom-bust cycle4, 5. Pro-environmental groups pay equal or more attention to the bust as well as the boom. While pro-industry groups may highlight the positive economic outcomes associated with industry, those favoring regulation are quick to speak up about the research done on the bust that often follows. The bust doesn’t necessarily negate the positive findings related to the boom, however such a historical pattern makes it clear that there could be just as many negative consequences for modern day unconventional O&G extraction.
Similar to focusing on the flipside of economic impacts, regulatory groups also draw from research done on the environmental and social impacts of unconventional drilling. These components of sustainability often don’t figure into the equation in industry-funded studies4, so considering them sheds more light on the holistic definition of sustainability. Environmentally speaking, pro-environmental groups focus on studies that address a cumulative hazard, rather than just that of one or two emissions. That is, instead of saying that levels of two or three notable pollutants are below EPA thresholds, studies should refer to the cumulative effect of all the possible pollutants.
With regards to unconventional drilling, preliminary and industry funded studies found that the amount of CO2 released was half that of conventional coal combustion. Later, however, burgeoning research indicated that other pollutants, such as ground level ozone in the air and heightened levels of manganese, strontium, and toluene in the water table can pose a great risk when considered together7.
Additionally, pro-environmental groups focus on the social costs of unconventional drilling. By doing community based participatory research8, as well as focusing on noise and light pollution as consequences that can detract from residents’ quality of life, researchers often find that the presence of industry in communities can be taxing on residents9. Although there is a lack of research on the social impacts of drilling, what little has been done has indicated that if existing social inequalities are not addressed as part of the holistic definition of sustainability, they can worsen after industry becomes present in a community4. Importantly, those who promote regulation espouse the viewpoint that these social burdens are not a necessary cost of industry that might be mollified by economic boons. On the contrary, the social piece is equally as important as the economic and environmental portions of the sustainability pie.
Next Time
In the final installment of this three part series, I will discuss how these two different definitions of sustainability inform the court of public opinion when it comes to the development of unconventional drilling.
Sources
1. Star, S. L., & Griesemer, J. R. (1989). Institutional ecology, ‘translations’ and boundary objects: Amateurs and professionals in Berkeley’s museum of vertebrate zoology, 1907-39. Social Studies of Science, 19, 387-420.
2. Perkins, N. D. (2012). The fracturing of place: The regulation of Marcellus Shale development and the subordination of local experience. (research paper). Retrieved from Duquesne University School of Law Legal Studies Research Paper Series. (2012-17).
3. Dernbach, J. C., & Bernstein, S. (2003). Pursuing sustainable communities: Looking back, looking forward. The Urban Lawyer, 35(3), 495-532.
4. Barth, J. M. (2013). The economic impact of shale gas development on state and local economies: Benefits, costs, and uncertainties. New Solutions, 23(1), 85-101.
5. Brasier, K. J., Filteau, M. R., McLaughlin, D. K., Jacquet, J., Stedman, R. C., Kelsey, T. W., & Goetz, S. J. (2011). Residents’ perceptions of community and environmental impacts from development of natural gas in the Marcellus Shale: a comparison of Pennsylvania and New York cases. Journal of Rural Sociology, 26(1), 32-61.
6. Korfmacher, K. S., Jones, W. A., Malone, S. L., & Vinci, L. F. (2013). Public health and high volume hydraulic fracturing. New Solutions, 23(1), 13-31.
7. Smith, K.R., Frumkin, H., Balakrishnan, K., Butler, C. D., Chafe, Z. A., Fairlie, I., Kinney, P., Kjellstrom, T., Mauzerall, D. L., McKone, T. E., McMichael, A. J., & Schneider M. (2013). Energy and human health. Annual Review of Public Health, 34, 159-188.
8. Perry, S. L. (2013). Using ethnography to monitor the community health implications of onshore unconventional oil and gas developments: examples from Pennsylvania’s Marcellus Shale. New Solutions, 23(1), 33-53.
9. Ferrar, K. J., Kriesky, J., Christen, C. L., Marshall, L. P., Malone, S. L., Sharma, R. K., Michanowicz, D. R., & Goldstein, B. D. (2013). Assessment and longitudinal analysis of health impacts and stressors perceived to result from unconventional shale gas development in the Marcellus Shale region. International Journal of Occupational and Environmental Health, 19(2), 104-112.
 structure for unconventional resource extraction (hydraulic fracturing, acidizing, and other stimulation techniques) for the state. As a feature of the current version of the regulations, oil and gas drilling/development operators are required to notify the California Department of Conservation’s Division of Oil Gas and Geothermal Resources (DOGGR), as well as neighboring property owners, 30 days prior to stimulating an oil or gas well. In addition to property owners having the right to request baseline water sampling within the the following 20 days, DOGGR posts the well stimulation notices to their website.


 documenting what is happening around them to hold the industry accountable.