The majority of FracTracker’s posts are generally considered articles. These may include analysis around data, embedded maps, summaries of partner collaborations, highlights of a publication or project, guest posts, etc.

DEP Calls on Natural Gas Drillers to Stop Giving Treatment Facilities Wastewater

Reposted from the Department of Environmental Protection website:

HARRISBURG — At the direction of Governor Tom Corbett, acting Department of Environmental Protection Secretary Michael Krancer today called on all Marcellus Shale natural gas drilling operators to cease by May 19 delivering wastewater from shale gas extraction to 15 facilities that currently accept it under special provisions of last year’s Total Dissolved Solids (TDS) regulations.

“While the prior administration allowed certain facilities to continue to take this wastewater, conditions have changed since the implementation of the TDS regulations,” Krancer said. “We now have more definitive scientific data, improved technology and increased voluntary wastewater recycling by industry. We used to have 27 grandfathered facilities; but over the last year, many have voluntarily decided to stop taking the wastewater and we are now down to only 15. More than half of those facilities are now up for permit renewal. Now is the time to take action to end this practice.”

Read the full article»

Below is a snapshot creating by John Detwiler using FracTracker’s DataTool. It shows the wastewater treatment facilities mentioned in DEP’s ‘voluntary’ advisory of April 19, 2011. The larger the star, the greater the facility’s permitted wastewater flow (mgd).

To close the legend on the left, click the compass.

The Future of FracTracker

Dr. Conrad Dan Volz. Photo credit: Brian Cohen

The Center for Healthy Environments and Communities has received a lot of inquiries regarding the various reports that CHEC’s director, Conrad Dan Volz, DrPH, MPH, is leaving the University of Pittsburgh Graduate School of Public Health. This is indeed true, but many of the reports are misleading as to why and what this means for FracTracker. Since Dan’s decision inevitably affects CHEC and FracTracker, we thought it best to post a blog discussion about it.

What’s next for Dan Volz?

PopCity, a fantastic and local e-magazine and website, recently interviewed Dan on the subject after hearing the news that he is not renewing his faculty contract at GSPH, and therefore can no longer serve as the director of CHEC. Here are some of the excerpts from their discussion:

Are you walking away from the concerns you’ve been raising about Marcellus Shale drilling and the dangers it poses to our health and the environment?

Not at all. My intention is to be more of an advocate for public health around the issue of Marcellus Shale.

I am leaving the university to work on these greater questions. It’s time that someone rose up and spoke out about environmental policy and how it’s not only playing out in Southwestern Pennsylvania, but the world…

Will you continue your work with FracTracker?

This has yet to be worked out. I’m leaving the university. FracTracker is a tool for citizens and environment organizations, as well as the industry and government, to look at the potential impacts of this process. It is managed by CHEC. The software license is owned by the Foundation for Pennsylvania Watersheds… Certainly I will be participating as a citizen can on FracTracker. I may have a more formal arrangement in the future.


Project Partners:  CHEC  |  Foundation for PA Watersheds  |  Rhiza Labs  |  The Heinz Endowments

2011 Deans Day Awards

Archived

This article has been archived and is provided for reference purposes only.

April 7 and 8th marked the University of Pittsburgh Graduate School of Public Health’s annual academic poster competition for students to highlight their research and public health practice.

This year, several Center for Healthy Environments and Communities members competed:

On the day of the Deans Day awards ceremony, April 15th, Samantha received the Rosenkranz Award for the project judged to be the most significant contribution to the public health field, as well as the overall Dean’s Day third place award in the doctoral category. Drew received the EOH Keleti Award for environmental excellence. Congratulations to Sam and Drew, as well as all of the Dean’s Day award winners.

How Long Between MS Permit Issuance and Drilling in PA?

2011 Marcellus Shale Permits and Drilled Wells in PA (large)
2011 Marcellus Shale drilled wells (green circles) and permits issued (red stars). For a larger, dynamic view, please click the image.
Marcellus Shale Permits and Drilled Wells (large)
All Marcellus Shale permits issued (red circles) and drilled wells (green circles). Please zoom in for a closer look in the denser portions of the map.

Sometimes it seems like the oil and gas industry is in an awfully big hurry. They are in a hurry to get the mineral leases, presumably because if they don’t, some other operator will. They are in a hurry to get their drilling permits from the Department of Environmental Protection (DEP)–already this year, the DEP has issued 979 permits from the Marcellus Shale formation alone. And sometimes they are in a hurry to get the drill in the ground.  Sometimes, however, they are not.

This does not mean that I think the 444 Marcellus Shale wells that have been spudded (time when the drill first hits the ground) so far this year is a small number. After all, today is just the 104th day of the year, which means that on average, almost 4.3 Marcellus Shale wells are started every single day. That’s a lot of industrial activity, and yet it reflects well under half of the 9.5 Marcellus Shale permits that DEP secretary Michael Krancer signs off on every day.

The longer term trends are similar: Of the 6,092 Marcellus Shale wells with active permits(1), 2,574 have been drilled. That represents about 42 percent, meaning that the 45 percent clip for 2011 is actually running a bit ahead of schedule. All of this brings a couple questions to mind:

  • Why does the oil and gas industry get more than twice as many permits as they are able to drill?
  • What’s the lag time for drilling once the permit is in hand?

I’m still scratching my head over the first one. I have been told that the siting and permitting processes are so involved and expensive that once the permit is in hand, the industry will drill the site, but the numbers don’t seem to reflect that as being fully true. Certainly, the 107 oil and gas drilling rigs available in Pennsylvania right now is a limiting factor in how many wells are drilled, but that doesn’t explain why the permitting process is years ahead of the drilling queue.

As for how long it takes to drill once a permit has been issued, there are means of answering that question. First, I matched the permits data to the spuds data using the wells’ unique API numbers, finding 2,804 matches for 2,574 distinct wells (2)(3). The second step was to subtract the number of days between the spud date and the permit date to determine the lag time for those permits which have been drilled, and where API numbers did match up. Let’s take a look at the results:


Number of days between permit issuance and spud (initial drilling) date.

Some of the 39 wells marked as “reworked” may not have originally been Marcellus Shale wells, so they were not included in the chart above. In addition, there were two negative values, for which it would appear that well was drilled before the permit was issued. I am assuming those are attributable to clerical error, and those wells were not included in the chart above (4).


Number of days from permit issuance to spud date for Marcellus Shale wells. Please click the “i” and then a map feature for more information. Please click the gray compass rose and double carat (^) to hide those menus.

Overall, the value ranges from -86 to 2,274 days, with an average turnaround time of just over 100 days. If we omit the outliers discussed above, the values range from 1 to 566 days, with an average of just under 99 days.

After looking at these results, I am surprised by the vast range, and beyond the number of available rigs, I can only speculate as to what factors go into determining this. It also seems remarkable that there are wells that can get the equipment in place, the site prepared, and the drill in the ground the very next day after the permit was issued. And yet, for all of that celerity, sometimes it takes well over a year to start churning dirt.

  1. This data comes from the DEP’s Operators With Active Wells Inventory section of their Reports page. What I called “active permits” are actually “active wells” according to the DEP. These include all wells for which the permit has been issued but have not yet been plugged. This would include wells that hav not been drilled, thus my distinction.
  2. Both datasets had some duplication of well numbers. All records that were exact duplicates were removed, meaning that the remainder had at least slight variances in one or more columns.
  3. I should mention that the number of matches to the permits list means that there are 93 mismatches between the two datasets. In theory, all of the drilled wells should be on the permit report, but for now, let’s take the 97% match rate and move forward.
  4. All values are included in the posted dataset, and therefore the DataTool map.

Cornell study assessed climate change impact of natural gas drilling

Archived

This page has been archived. It is provided here for historical purposes.

We at the Center for Healthy Environments and Communities would like to congratulate and recognize the incredible efforts of our colleagues at Cornell University for their recent research study published in Climate Change Letters, entitled “Methane and the greenhouse-gas footprint of natural gas from shale formations.” Led by Dr. Robert Howarth, the study sought to determine the effect that natural gas drilling in shale formations has on the atmosphere over a 20-year period.*

Methane gas, the major component of natural gas, has been promoted by some entities as a greener energy alternative than the use of coal because it burns cleaner. Results of this recent Cornell study, however, indicate that the methane emissions that result from the natural gas industry may result in a greater greenhouse gas footprint than other forms of energy extraction.  This is partially due to the fact that methane is a very potent greenhouse gas.

From a researcher’s perspective, accurate and up-to-date data regarding the amount of methane gas that escapes during the life cycle of natural gas drilling is difficult to access – if it exists at all. To better-understand how natural gas drilling in shale formations will affect public health and the environment, especially as this industry develops, we must continue to conduct peer-reviewed research like the most recent Cornell study. Full Report

* A criticism of this study has been the shorter, 20-year time span they used to analyze the data. This approach was taken because methane does not stay in the atmosphere as long as other greenhouse gases like carbon dioxide. 

Proposed Tire Fire Plant in Greenwood Twp., Crawford County, PA

In the fall of 2010 Crawford Renewable Energy, LLC (CRE) announced plans to build a “tire-fired” power plant in Greenwood Township of Crawford County. The facility is designed to produce 100 MW of energy by burning used, recycled tires in two circulating fluidized bed (CFB) boiler systems. The design of the facility includes several pollutant emission control technologies. These types of equipment remove a portion of the pollutants from the exhaust. As nice as it is to think of tires simply “disappearing” rather than being land-filled, when any hydrocarbon fuel source is burned, such as a tire or coal, a multitude of toxic and carcinogenic compounds are released. And most of these pollutants cannot be captured using control technologies, so they are emitted into the air.

The facility is planned on an 80 acre industrial park land parcel. The control equipment includes a CFB scrubber, a fabric filter baghouse, and a regenerative catalytic reactor. The flue gasses will then be emitted through a 325 foot tall stack. A CFB scrubber uses limestone to decrease sulfur emissions. The regenerative catalytic reactor is used to reduce NOX. The fabric filter baghouse is a series of screens and filters that remove the majority of the mass of particulate matter. The majority of the mass of particulate emissions are removed by capturing the coarse fraction of particles, which are particles with larger diameters and mass, but do not pose a significant health threat. Baghouses and other particulate control devices (PCDs) are not as efficient at capturing the fine and ultrafine fraction of particulate emissions, which have smaller diameters. The fine and ultrafine modes of particulates are the most hazardous, and are directly related to asthma exacerbation, chronic obstructive pulmonary disorder (COPD) and other forms of respiratory disease.

The emissions and deposition pattern from this facility were modeled by the Center for Healthy Environments and Communities to assess the impact on local air quality. Several pollutant species were modeled, including sulfur dioxide (SO2), oxides of nitrogen (NOx), and both the course and the fine fractions of particulate matter, PM10 and PM2.5 respectively. Concentrations of these pollutants at ground level in ambient air were modeled using the CalPUFF non-steady state dispersion model. These will not be the only pollutants transported, rather these are efficient to model. Plumes of some of the other contaminants will most likely have similar patterns.

The mean, or average, levels of predicted ambient air concentrations are presented first for each pollutant (Figures 1, 3, 5, and 7). These maps show the average concentrations of the pollutant that are predicted to occur while the facility is operating. The concentrations are averaged over a one year period. Next, peak day concentrations of pollutants are presented (Figures 2, 4, 6, and 8). These concentrations are the highest predicted concentrations for a single day that would occur when the facility is operating normally, over the one year modeled cycle. The concentrations shown in all of the maps are only attributable to the proposed facility, and do not include any other sources of pollution or background concentrations of pollutants. These values essentially show the increases in ambient air pollutants that will occur when the proposed facility is operating.

For this 80 acre industrial park, a square “fence-line” with 570 meter sides could surround the park. Typically, exposures are expected to be very limited within the fence-line because the area is inaccessible to the public. Concern is focused on the exposures that may occur beyond the limit of the fence-line. If the smokestack is assumed to be located at the center of the park, it would be at a distance approximately 235 meters from the fence-line. Using the scales on the maps, it is evident that the even the highest concentration gradients shown in the maps would occur beyond the fence-line. When the facility is operating, it is reasonable for the surrounding communities to expect exposures to even the highest concentration gradients shown in the maps.

Figure 1.  Mean values of modeled SO2 ambient air concentrations at ground level, attributable to emissions from the proposed CRE plant.
Figure 2.  Peak day values of modeled SO2 ambient air concentrations at ground level, attributable to emissions from the proposed CRE plant.
Figure 3.  Mean values of modeled NOX ambient air concentrations at ground level, attributable to emissions from the proposed CRE plant.
Figure 4.  Peak day values of modeled NOX ambient air concentrations at ground level, attributable to emissions from the proposed CRE plant.
Figure 5.  Mean values of modeled PM10 ambient air concentrations at ground level, attributable to emissions from the proposed CRE plant.
Figure 6.  Peak day values of modeled PM10 ambient air concentrations at ground level, attributable to emissions from the proposed CRE plant.
Figure 7.  Mean values of modeled PM2.5 ambient air concentrations at ground level, attributable to emissions from the proposed CRE plant.
Figure 8.  Peak day values of modeled PM2.5 ambient air concentrations at ground level, attributable to emissions from the proposed CRE plant.

A Look at Horizontal Well Production in Virginia

Horizontal gas wells in Virginia in 2008 to 2009. Note that they are all clustered in the extreme western portion of the Commonwealth.

According to the Virginia Department of Mines, Minerals, and Energy’s (DMME) Division of Gas and Oil, there are 30 horizontal gas wells that produced gas between January 2008 and December 2009 (1). While this is not a large number of horizontal wells, the dataset is interesting, since Virginia publishes monthly production data online.

Of the 30 wells, only nine were in production for at least 12 of the 24 months that I looked at. This is, admittedly, a small sample size, but is as good an entry point as any into the discussion of how gas production changes over time.


Chart 1: Production in Thousands of Cubic Feet (Mcf) of Horizontal Gas Wells in Virginia, with at least 12 months of production between 2008 to 2009.

Many of the wells in this analysis have a spike in production within the first few months of production, followed by a gradual decline.


Chart 2: Maximum, Minimum, and Mean Production of Horizontal Gas Wells in Virginia, with at least 12 months of production between 2008 to 2009.

For wells with at least 12 months of production, the mean production value tends to be closer to the minimum value than the maximum. This is particularly true for those wells which show a significant spike in production, such as VH-520008.


Chart 3: Ratio of Most Recent Monthly Production to Peak Monthly Production of Horizontal Gas Wells in Virginia, with at least 12 months of production between 2008 to 2009.


Ratio of December 2009 production to each well’s maximum monthly production for all horizontal gas wells. Please click the gray compass rose and double carat (^) to hide those menus. Click the “i” tool then any map feature for more information.

For these nine horizontal gas wells in Virginia, the average production of the most recent month (December 2009) is slightly less than 30 percent of the peak monthly production. This figure is skewed on the one side by a well with a tremendous production spike (VH-530008, 6.93%) and on the other by a well with low but relatively steady production (VH-536927, 42.75%). When all wells are considered (as with the map) the range of values is much greater.

Each of these wells had been in production between 12 and 24 months as of December 2009, and none of them produced even half as much gas in that month as the month for their respective maximum production values. The complete production data is available on FracTracker’s DataTool.

  1. The most recent production data currently available is for January 2010, one month after the end of this analysis.

Abandoned Well Suspected in McKean County Explosion

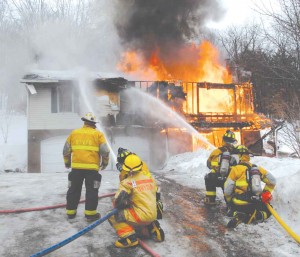
The Pennsylvania Department of Environmental Protection (DEP) thinks this February 28, 2011 gas explosion might have been caused by one of three abandoned gas wells in the vicinity. Photo by Jay Braddish

Luckily, Thomas Federspiel of Bradford Township in McKean County Pennsylvania was outside of his home when it suddenly exploded on February 28, 2011. He was able to rescue his dogs, too, but his house didn’t fare as well, taking an estimated $250,000 in damages, according to the Erie Times-News.

This fire, combined with a similar incident on December 12, 2010 have gotten the attention of U.S. Senator Bob Casey, who urged federal input into the investigation, which he suspected might be due to recent gas drilling operations:

While investigations are ongoing, the initial determinations are that these harrowing incidents were not caused by any gas utility issue. Rather, it appears that the gas may have migrated from deep underground during periods of high barometric pressure coupled with seismic activity and extensive new deep drilling activities.

The DEP recently suggested that the issue might be related to abandoned wells in the area, rather than new gas drilling activities. Three nearby uncapped abandoned wells were discovered, all of which are at least 90 years old. The well that the DEP considers to be a suspect in the February explosion, Rogers 9, was drilled in 1881.

Wells are considered to be abandoned if they have been out of production for twelve months.

Dr. Volz presented potential impacts of shale gas extraction at EPA hearings

As part of the U.S. EPA’s investigation into the safety of hydraulic fracturing, a process used to extract natural gas from underground, CHEC’s director Conrad Dan Volz, DrPH, MPH presented at the U.S. EPA’s Hydraulic Fracturing Study Technical Workshop 3, Fate and Transport on March 28 and 29, 2011. Extended Abstract | Presentation

Chemical and Biological Risk Assessment for Natural Gas Extraction in New York

By Ronald E. Bishop, Ph.D., CHO

Over the last decade, operators in the natural gas industry have developed highly sophisticated methods and materials for the exploration and production of methane from unconventional reservoirs. In spite of the technological advances made to date, these activities pose significant chemical and biological hazards to human health and ecosystem stability.

If future impacts may be inferred from recent historical performance, then:

  • Approximately two percent of shale gas well projects in New York will pollute local ground-water over the short term. Serious regulatory violations will occur at more than one of every ten new shale gas projects.
  • More than one of every six shale gas wells will leak fluids to surrounding rocks and to the surface over the next century.
  • Each gas well pad, with its associated access road and pipeline, will generate a sediment discharge of approximately eight tons per year. If not sequestered from local waterways, these sediments will further threaten federally endangered mollusks and other aquatic organisms.
  • Construction of access roads and pipelines will fragment field and forest habitats, further threatening plants and animals which are already species of concern.
  • Some chemicals in ubiquitous use for shale gas exploration and production, or consistently present in process wastes, constitute human health and environmental hazards when present at extremely low concentrations. Potential exposure effects for humans include poisoning of susceptible tissues, endocrine disruption syndromes, and elevated risks for certain cancers.
  • Exposures of gas field workers and neighbors to toxic chemicals and noxious bacteria are exacerbated by certain common practices, such as air/foam-lubricated drilling and the use of impoundments for flowback fluids. These methods, along with the intensive use of diesel-fueled equipment, will degrade air quality and may cause a recently described “down-winder’s syndrome” in humans, livestock and crops.
  • State officials have not effectively managed oil and gas exploration and production in New York, evidenced by thousands of undocumented or improperly abandoned wells and numerous incidents of soil and water contamination. Human health impacts from these incidents may include abnormally high death rates from glandular and reproductive system cancers in men and women. Improved regulations and enhanced enforcement may reasonably be anticipated to produce more industry penalties, but not necessarily better industry practices, than were seen in the past.

Overall, proceeding with any new projects to extract methane from unconventional reservoirs by current practices in New York State is highly likely to degrade air, surface water and ground-water quality, to harm humans, and to negatively impact aquatic and forest ecosystems. Mitigation measures can partially reduce, but not eliminate, the anticipated harm.

View/Download Full Report


Ronald E. Bishop, Ph.D., CHO
Chemistry & Biochemistry Department
State University of New York, College at Oneonta
Sustainable Otsego