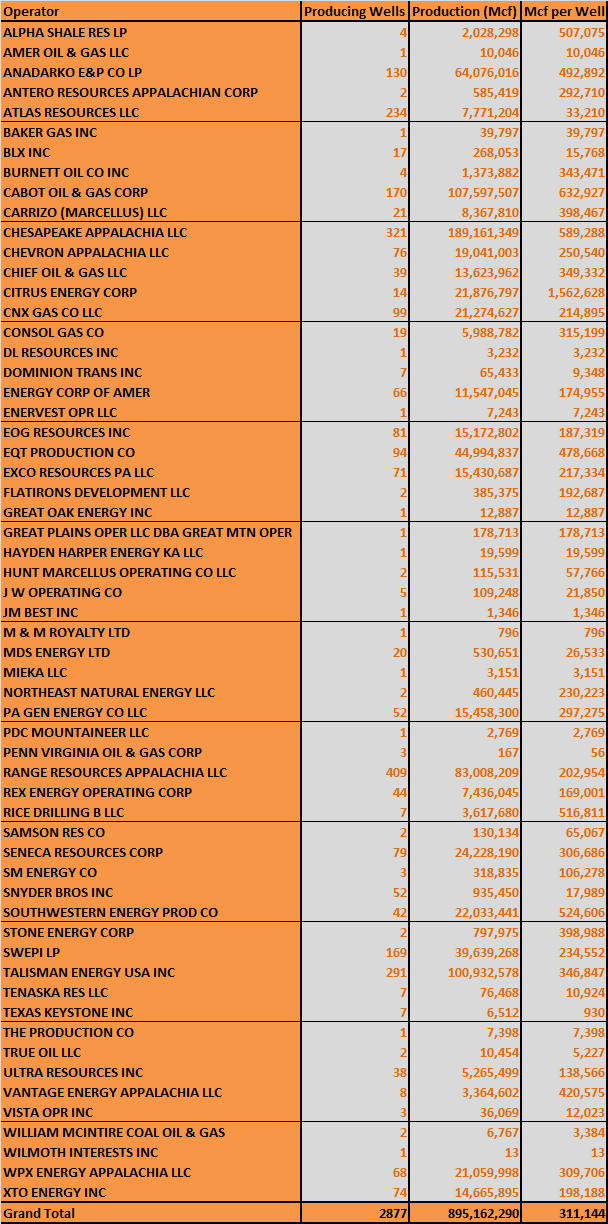
A visitor to our site recently asked about the amount of shale gas produced in Pennsylvania by operator. The following table contains data from the first six months of 2012, summarized by operator. It includes the number of wells showing gas production, the total sum of gas produced, and the average production of each operator’s producing wells. The dataset was downloaded on October 30, 2012, which is important to note, as it is sometimes updated without notice.
The results vary tremendously. There could be numerous reasons for this, including the age and location of the wells. This table does not take into consideration condensate or oil production, however those categories are rare in Pennsylvania’s Marcellus Shale and other unconventional wells.
https://www.fractracker.org/a5ej20sjfwe/wp-content/uploads/2025/09/2025-Wordmark-Logo.png00Matt Kelso, BAhttps://www.fractracker.org/a5ej20sjfwe/wp-content/uploads/2025/09/2025-Wordmark-Logo.pngMatt Kelso, BA2012-10-30 22:00:092020-07-21 10:40:37Production Data by Operator for PA’s Unconventional Wells
The Pennsylvania Department of Environmental Protection (PADEP) maintains datasets that are updated nightly for permits, drilled wells, and violations. It seems like it should be a fairly simple task to find totals and trends in this data, but this isn’t always as straight-forward as one might hope.
For example, on the permits data that I downloaded from PADEP on October 22, 2012, there were 13,847 entries, but only 10,512 unique wells as defined by their eight digit API number. This part is explainable, since additional permits are required for alterations to existing wells, but then there is the PADEP workload report, which counts 11,819 permits issued through October 12, 2012–a number that is obviously altogether different.
The drilled wells dataset used to be similarly afflicted, but the data now seem to be cured of that malady. However, the drilled wells had another issue: In January of this year, the Post-Gazette reported that there were hundreds of wells on the production dataset that were not on the drilled wells list, which is problematic because we’ve not yet figured out how to get the gas out of the ground without drilling a well first. At any rate, there is some reason to believe that this issue has been addressed–at least in part–as there are now records of more historical drilled unconventional wells than there used to be.
Which takes us to violations. The obstacle here is that there are often numerous issues that are encountered on an inspection, and the data show that PADEP hasn’t always been consistent in how it has handled that fact. While it does seem clear that PADEP counts violations by the number of discrete violation ID numbers that have been issued, sometimes those numbers have been used to apply to more than one issue found at a well. In addition, sometimes a single violation seems to apply to more than one well (perhaps at the same wellpad), and then sometimes there are enforcement actions that go along with violations, which generates a new line of data in the report. The net result is that the violations data that I downloaded on October 26, 2012 had 4,696 rows of data, which contained 4,064 violation ID numbers. Unlike permits and drilled wells, the workload report (see above) does not tally violations for multiple years, so that comparison is not available.
Given all of this, we can now see why questions such as, “How many unconventional gas permits have been issued in Pennsylvania?” are less straight-forward than one would hope. It also creates a challenge when trying to analyze the data that is based on such questions, while minimizing skew.
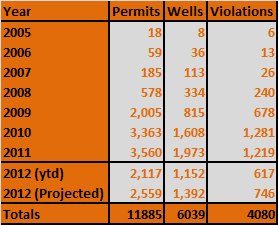
In order to look at long-term trends we need a consistent approach, so I developed a simple strategy to tackle these questions: use the summary information provided by PADEP from the dataset queries. Results may therefore not reflect what I think to be an optimal representation of events on the ground, but they are totals produced by PADEP that have been obtained in a uniform manner. For each year, I searched for all unconventional records between New Year’s Day and New Year’s Eve, except for 2012 of course, where I used today’s date. Here are those results:
Unconventional gas activity in Pennsylvania, with 2012 year to date totals and projections
The projected totals, for those who are curious, are based on the fact that October 29th is the 302nd day of the year, and multiplying the year to date totals by the inverse of the percentage of time elapsed in the year (365/302). The projected total for each category is down substantially from 2011 totals. Let’s take a closer look at each one:
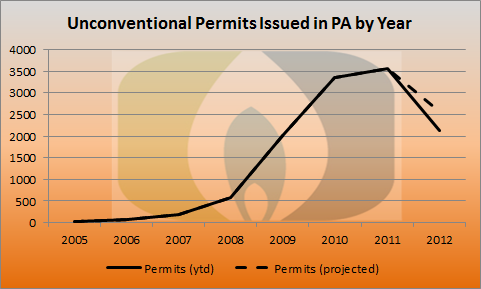
Permits issued by year
At the current rate, there will be 1001 fewer permits for unconventional oil and gas wells issued in 2012 as the year before, a reduction of 28%. This was widely predicted due to the low price of natural gas earlier in the year. That price has now rebounded back to $3.81. It remains to be seen whether permit counts rebound as well.
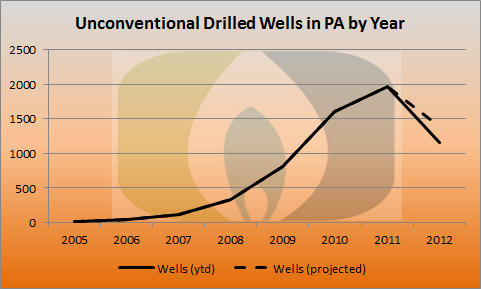
Drilled wells per year
This graph looks pretty similar to the permits, with the exception that all of the total values are lower. 2012 is on pace to have 581 fewer wells drilled statewide than 2011, a 29% reduction, presumably for much the same reason as permits.
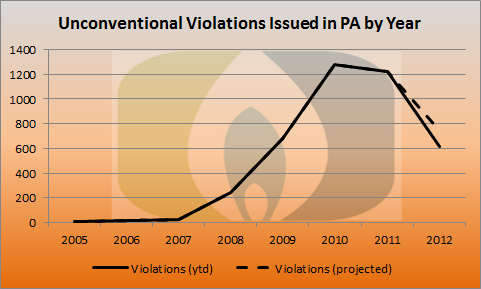
Violations issued per year
The number of violations peaked in 2010, so there may be some reason for the reduction other than the fact the industry itself is in a phase of contraction. Pennsylvania is on pace for 473 fewer violations that last year, which is a 39% drop. What these numbers cannot tell us is why. Is it a result of better performance in the field or less rigorous inspection by an administration with long-standing ties to the industry, or both?
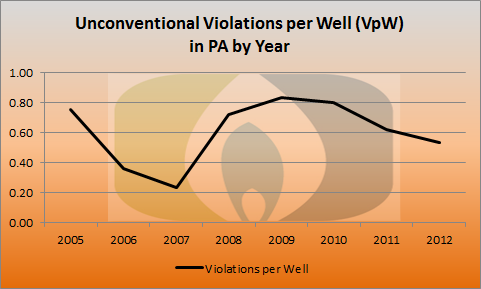
Violations per drilled well, by year
Since 2010, I’ve taken periodic looks at the number of violations issued divided by the number of wells drilled. It is a somewhat simplistic but effective way to conduct a cost-benefit analysis of impact by various operators, geographies, or in this case, time. The 2012 rate of 0.54 violations per drilled well is down 13% from last year, and 36% from the peak in 2009. This chart also has a huge dip in the years 2006 and 2007, at a time when the number of wells being drilled was small but growing rapidly.
https://www.fractracker.org/a5ej20sjfwe/wp-content/uploads/2025/09/2025-Wordmark-Logo.png00Matt Kelso, BAhttps://www.fractracker.org/a5ej20sjfwe/wp-content/uploads/2025/09/2025-Wordmark-Logo.pngMatt Kelso, BA2012-10-29 17:29:442020-07-21 10:40:37Trends in PA Data for Unconventional Wells
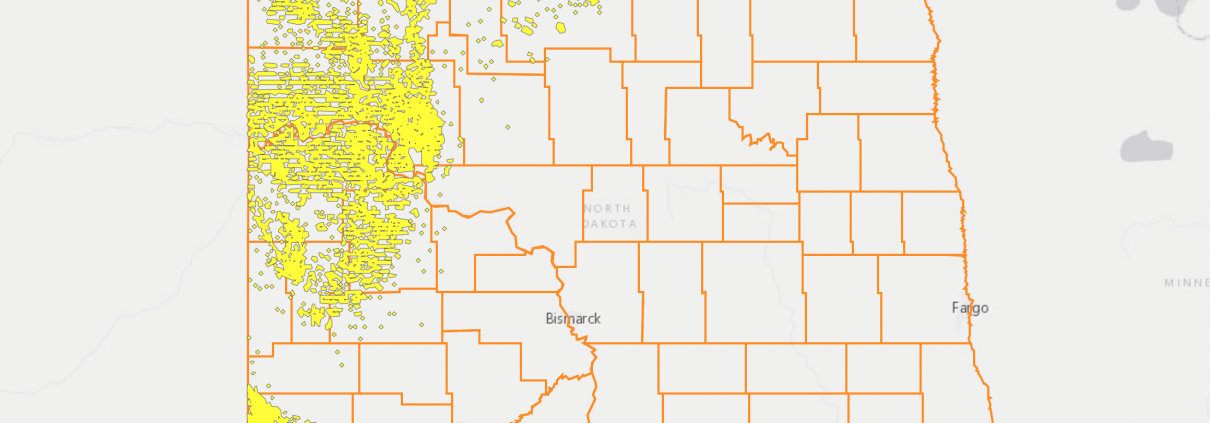
A new North Dakota map is now available on FracTracker. It joins content from New York, Ohio, Pennsylvania, and West Virginia in our efforts to make data concerning mineral extraction from shale more accessible and understandable.
In this embedded view of the North Dakota map, users can pan and zoom. For full featured control, click the expanding arrows icon (top right of map) to access the map directly.
The area drawn in yellow in the western portion of the state is a generalized layer of activity for the Bakken formation. It was created to help with map performance and accuracy at scales ranging from statewide to 1:750,000, or about the size of a county. Once you zoom in beyond that level, the generalized layer goes away, and some interesting content becomes available.
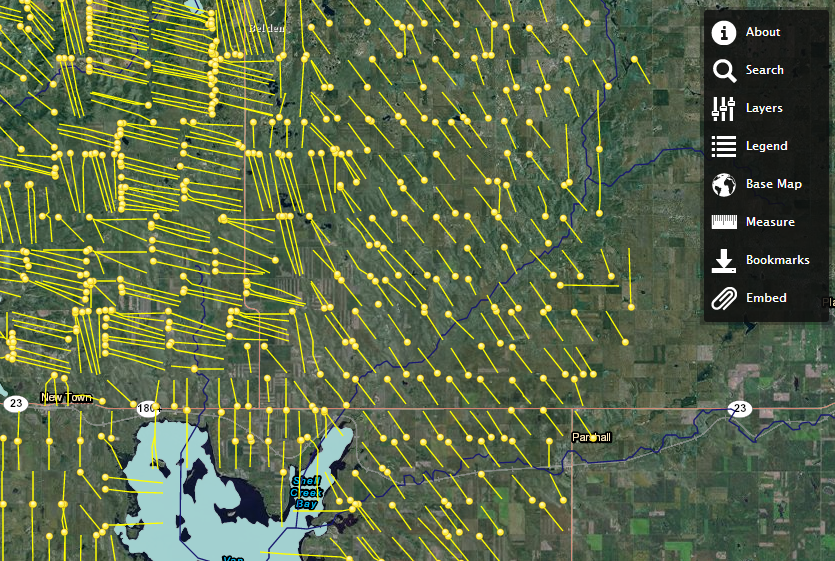
A screen capture of the North Dakota map
In the screen capture above, I zoomed in past 1:750,000, so the producing wells are visible, as well as a layer of horizontal laterals that are associated with the wells, a feature that few states make available. The location was chosen at random from the Bakken region, however, if you would like to see a similar view, click the “Search” tool and then type “New Town, ND” into the text box. I have also changed the basemap to show a satellite image by selecting “Imagery with Labels” from the base map selector.
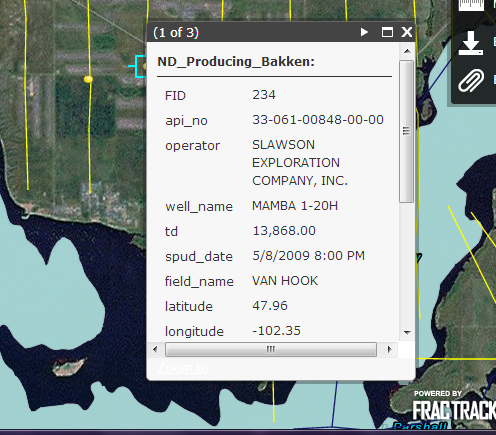
Close up of “Mamba 1-20H” well
Each feature, or item on the map, has different data associated with it. I’ve clicked on a well at random to bring up the data pop up box. Because the data is controlled at the state level, there are often substantial differences in the types of data that are available. In North Dakota, we can see the cumulative total of oil, gas, and waste water production by scrolling through these pop up boxes. Units of measure are not provided, but they are assumed to be barrels for oil and waste water, and thousands of cubic feet (Mcf) for gas.
At the very top of that box, there is a gray bar with the text “(1 of 3)”. This means that multiple features are selected. Viewers can scroll through them by clicking the arrow icon on the gray bar. Viewers can reduce the number of selected items by zooming in and making layers inactive. To change the layers, just click on “Layers” in the main toolbar, and click the checkboxes next to each layer to select or de-select the various available choices. Please recall that some layers are scale dependent, so they are not available at all times.
For more information about the Bakken formation and the layers available on the map, please click the “About” icon on the main toolbar.
https://www.fractracker.org/a5ej20sjfwe/wp-content/uploads/2013/07/ND-e1426882939461.png398900Matt Kelso, BAhttps://www.fractracker.org/a5ej20sjfwe/wp-content/uploads/2025/09/2025-Wordmark-Logo.pngMatt Kelso, BA2012-10-10 16:04:502020-07-21 10:40:36Exploring North Dakota’s Bakken Formation on FracMapper
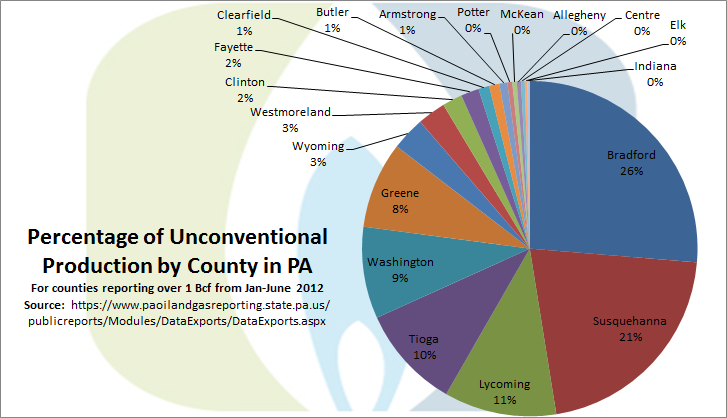
In the first half of 2012, gas production from unconventional sources such as the Marcellus Shale was reported in 30 different counties in Pennsylvania, according to data downloaded from the Pennsylvania Department of Environmental Protection (PADEP) website on September 10, 2012. Of these, 19 counties had aggregated totals of at least one billion cubic feet (Bcf), lead by Bradford (235 Bcf); Susquehanna (189 Bcf); Lycoming (97 Bcf); Tioga (89 Bcf); Washington (79 Bcf); and Greene (74 Bcf). Here are the proportions of those 19 counties presented graphically:
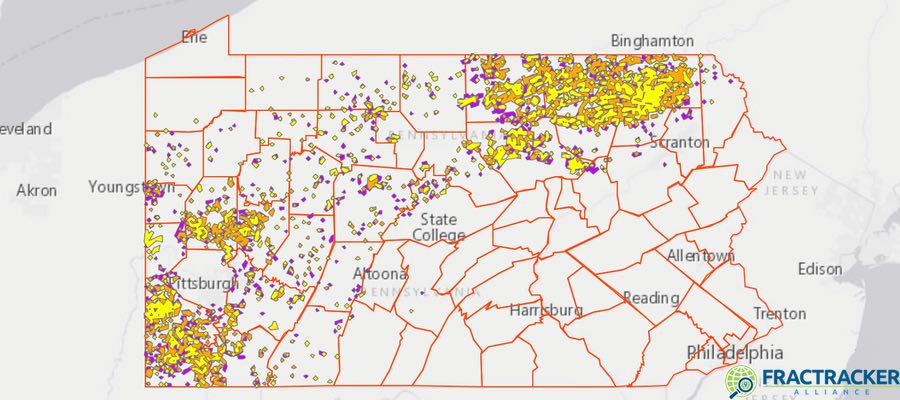
We can also view the data spatially. To find out the production value of any county, please click the blue “i” tool, then any county shown in blue. Also added is the location of the top ten wells in the state in terms of natural gas production for the six month period:
On this view, the top wells are clustered so closely together that there appear to be only four. The top two producers are both operated by Citrus Energy in Meshoppen Bourough, a small town in Wyoming County with 563 residents as of the 2010 Census, and a total surface area of 0.7 square miles. The other eight wells on the list are operated by Cabot Oil and Gas in a handful of municipalities in Susquehanna County. Here is a closer look at the wells, with an additional layer of all unconventional drilled wells:
The wells in red are the same 10 wells, all within 10 miles of one another as the crow flies. The wells in black show the other unconventional drilled wells in the area as of late August. Obviously, this part of the state has been the focus of considerable attention by the operators active in the region.
https://www.fractracker.org/a5ej20sjfwe/wp-content/uploads/2016/06/PAUpdate-Feature.jpg400900Matt Kelso, BAhttps://www.fractracker.org/a5ej20sjfwe/wp-content/uploads/2025/09/2025-Wordmark-Logo.pngMatt Kelso, BA2012-09-11 14:26:422020-07-21 10:40:02Spatial Distribution of Unconventional Production in PA
As we recently learned with unconventional production report, one never quite knows when Pennsylvania Department of Environmental Protection (PADEP) datasets are complete. According to the Post-Gazette, PADEP considers the reports to speak for themselves, and information is shared with the public without preamble or fanfare as it becomes available. Therefore, we can’t know that self-reported data, in this case unconventional waste report, is ever truly complete. Hopefully at this point, which is now several weeks after the reporting deadline, we can let the report speak what it will, expecting that further changes will be fairly minor in scope.
In addition to all of that, some oil and gas operators were apparently confused about the difference between gallons and 42 gallon barrels in the past, leading to wildly erroneous reports. We’ll just have to hope that’s not the case.
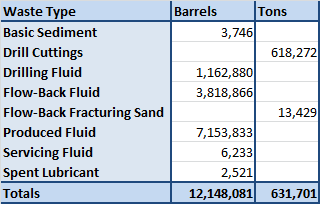
First, let’s take a look a the amount of waste produced by type for unconventional wells between January and June of 2012:
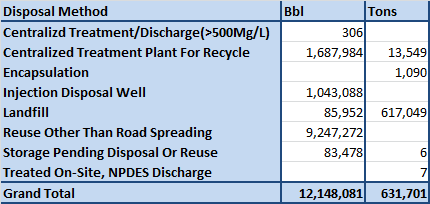
And here is the same dataset, arranged to show disposal method (with the waste types grouped together for the sake of simplicity):
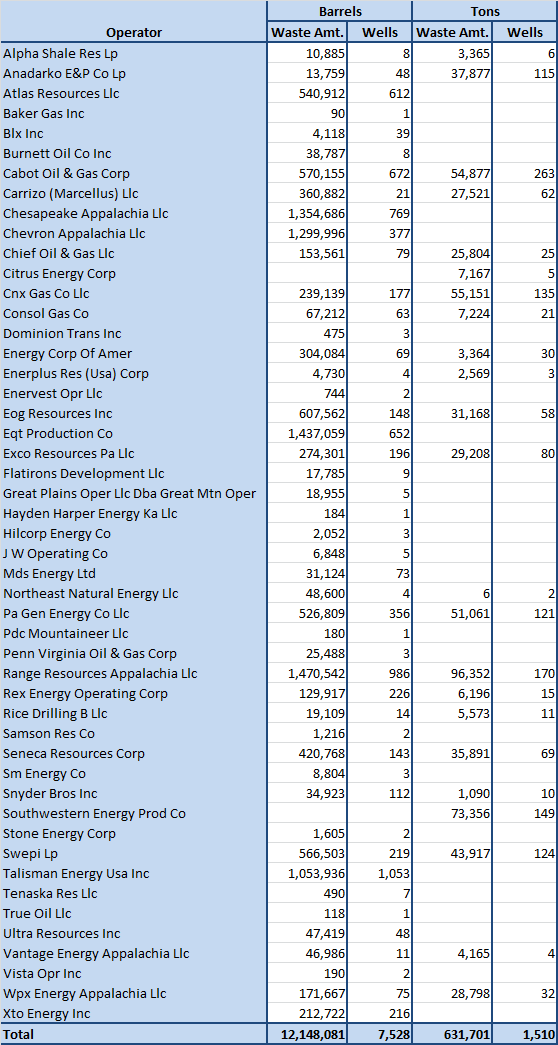
Here are the data arranged by operator:
Please note that not all wells that are present on the report are producing waste, or have even been drilled for that matter. In fact, there is a column in the data where operators can explain why there is no waste being reported. Here are those results, summarized:
This does not mean, however, that there are 7,994 wells producing waste. In fact, there are only 5,651 instances of wells reporting at least some amount of one or more kinds of waste, a number roughly in line with the spud count. This number was actually more than I had expected, since it is known that not all of the spudded (drilled) wells have been put into production, and that reported totals for drill cuttings are remarkable modest for a series of holes in the ground that are roughly between 5,000 and 8,500 feet deep. The explanation, it turns out, is due to the architecture of the dataset, wherein each line of data is capable of handling only one type of waste, so that wells reporting multiple types of waste must appear more than once. Therefore, there are not 9,038 wells, or even 5,651. There are 3,922 unique wells on the report, as counted by the unique well API numbers. For this reason, in the charts above, it is best to think of the “Wells” columns as “Instances” instead.
It is also probable that different operators report their waste in different ways. For example, EQT and Chesapeake are both near the top of the list in the amount of barrels of liquid waste produced, but neither one reported any waste that was measured in tons (drill cuttings and flowback fracturing sand). Without having seen their operations in the field, we must assume that the waste produced is fundamentally similar to that of other operators–perhaps they reported the waste content as a viscous fluid rather than filtering out some of the solids, as other operators seem to do.
https://www.fractracker.org/a5ej20sjfwe/wp-content/uploads/2025/09/2025-Wordmark-Logo.png00Matt Kelso, BAhttps://www.fractracker.org/a5ej20sjfwe/wp-content/uploads/2025/09/2025-Wordmark-Logo.pngMatt Kelso, BA2012-09-07 10:11:002020-07-21 10:40:02Pennsylvania Unconventional Waste Data
This information is out of date. Please visit our FracMapper page for updated PA maps.
There are two new Pennsylvania watershed available for download on FracTracker’s DataTool:
Pennsylvania Watersheds (HUC12), which shows the boundaries of watershed boundaries within the state at relatively fine level of detail. In general, the higher the number associated with the HUC (hydrologic unit code), the smaller the size of the watershed, and the greater the accuracy and resolution of the file. For more information on HUC’s, see this US Geologic Survey page.
Pennsylvania Watersheds With Drilled Unconventional Wells (8-29-2012), which contains those watersheds in the above dataset with one or more drilled wells, as determined by a spatial join with PADEP drilled unconventional welldata.Included on this dataset for each watershed is the number of unconventional wells drilled within its boundary from January 1, 2005 through August 29, 2012, as well as a density of wells per square kilometer.
You can find out more information on any watershed in the maps below by clicking the blue “i” tool, then clicking on any watershed shape. Please click the gray compass rose and double carat (^) symbol to hide those menus.
Drilled unconventional wells by watershed in Pennsylvania
Density of drilled unconventional wells per square kilometer in Pennsylvania watersheds
https://www.fractracker.org/a5ej20sjfwe/wp-content/uploads/2025/09/2025-Wordmark-Logo.png00Matt Kelso, BAhttps://www.fractracker.org/a5ej20sjfwe/wp-content/uploads/2025/09/2025-Wordmark-Logo.pngMatt Kelso, BA2012-08-30 12:12:182020-07-21 10:40:01Drilled Wells in PA by Watershed Data Available
Last week, I took a quick look at the newly released, semi-annual unconventional production report published by the Pennsylvania Department of Environmental Protection (PADEP) Office of Oil and Gas Management. The results were fairly stunning: it showed a decrease in production from 607 billion cubic feet (Bcf) for the period from July to December 2011 to just under 303 Bcf for the first six months of 2012.
Thanks to a comment from one of our astute users on the DataTool, I was alerted to the fact that the wells of Pennsylvania’s largest unconventional well operator, Chesapeake Appalachia, were entirely missing.
After checking the data again this morning, Chesapeake’s wells are still missing from the report, but other wells have been included that were previously missing, bringing the temporary total for unconventional gas for the six month period to 705 Bcf. This amounts to a substantial gain over the previous six month cycle, not a dramatic reduction.
I will check back regularly for Chesapeake data, but until then, both the production and waste reports, which are self-reported by operators to PADEP, should be considered incomplete. I apologize for the inadvertent mischaracterization of the data.
https://www.fractracker.org/a5ej20sjfwe/wp-content/uploads/2025/09/2025-Wordmark-Logo.png00Matt Kelso, BAhttps://www.fractracker.org/a5ej20sjfwe/wp-content/uploads/2025/09/2025-Wordmark-Logo.pngMatt Kelso, BA2012-08-20 09:38:132020-07-21 10:40:01Unconventional Production and Waste Data Still Trickling In
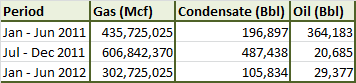
The Pennsylvania Department of Environmental Protection (PADEP) has released their semi-annual unconventional production and waste reports. This data is self-reported from well operators to PADEP. While in the past, this report was limited to Marcellus Shale wells only, now it includes wells in other formations, such as the Utica, which require similar treatment to extract hydrocarbons.
Despite the expanded definition, the gas production for this period is half that of the previous six months, and barely more than one fifth of condensate production:
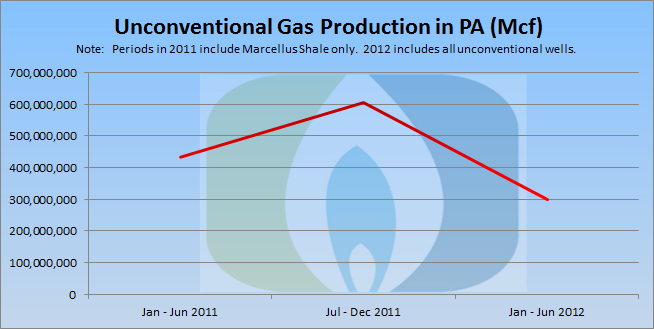
Here’s a look at just the gas production over the last three cycles:
In the map below, you can see production values for each well that reported for the cycle. Please click the compass rose and double carat (^) to hide those menus, then click the “i” tool and any map icon to learn about specific wells.
https://www.fractracker.org/a5ej20sjfwe/wp-content/uploads/2025/09/2025-Wordmark-Logo.png00Matt Kelso, BAhttps://www.fractracker.org/a5ej20sjfwe/wp-content/uploads/2025/09/2025-Wordmark-Logo.pngMatt Kelso, BA2012-08-17 08:51:392020-07-21 10:40:01Unconventional Gas Production Cut in Half in PA
Permits data for Marcellus Shale wells in West Virginia has recently been updated on FracTracker’s DataTool
[map archived]
Astute viewers will note that there is a well drawn in the Athens, OH area, a good 20 miles from the West Virginia border as the crow flies. As it turns out, this is not the most egregious error; if you zoom out, you will see purple dots in Indiana and North Carolina as well, neither of which are are even contiguous with West Virginia. There were also about five wells that I deleted the location data for, because I could tell at a glance that they would have drawn well south of the Tropic of Cancer.
These data errors are a shame, because they compromise the experience of an otherwise slick data delivery system, where viewers can pick permits from a given formation, see them draw on a map, and then download the data. The data are fairly bare-bones in nature, consisting of just six columns, but this is not something that I have a quarrel with, as it includes the information that most people want to know, including where the well is, who is responsible for it, when the permit was issued, and the unique well number. And we already know, based on download parameters, what the target formation of the well is.
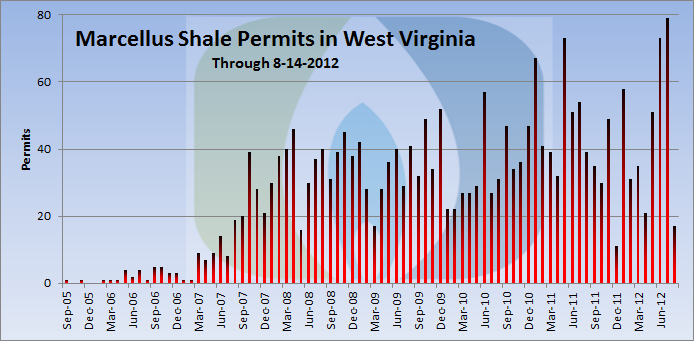
While only a handful of wells are affected by faulty location data, 330 out of 2,688 wells in the dataset lack permit issue dates, or just over 12 percent of the wells. This is significant enough to make the result of any trend analysis questionable. Nonetheless, let’s proceed to have a look, keeping relevant caveats in mind:
Marcellus Shale permits issued per month in West Virginia
While the number of permits per month is fairly erratic in West Virginia, it is clear that the last full month–July 2012–saw the largest number of permit issued in the Marcellus ever, and that June 2012 is tied for second. West Virginia clearly is not seeing the same contraction of unconventional gas activity that Pennsylvania is.
Like its neighbors, Pennsylvania and Ohio, Chesapeake has the largest number of permits for unconventional gas permits. Unlike Ohio, where the operator’s share was over 70 percent of the total of the Utica, here the plurality is just 17 percent of Marcellus Wells.
https://www.fractracker.org/a5ej20sjfwe/wp-content/uploads/2025/09/2025-Wordmark-Logo.png00Matt Kelso, BAhttps://www.fractracker.org/a5ej20sjfwe/wp-content/uploads/2025/09/2025-Wordmark-Logo.pngMatt Kelso, BA2012-08-14 15:02:292020-07-21 10:40:01Updated West Virginia Permits Data
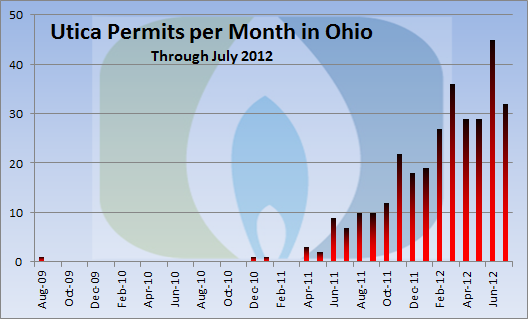
While unconventional activity in Pennsylvania is waning, at least in the short term, activity in Ohio’s Utica Shale appears to be experiencing a period of robust growth.
While the number of permits in July is down from the month before, the overall trend in Ohio seems to correspond with the notion that drillers are turning to wet gas in these times of low prices for methane.
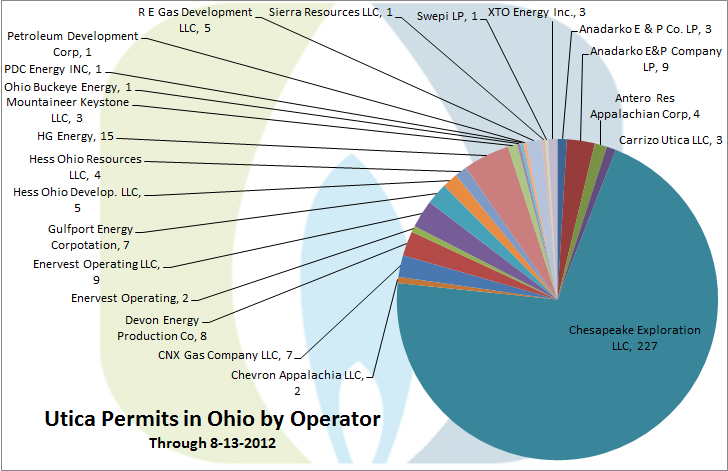
But when you want to talk about Ohio’s Utica, you are essentially talking about one company: Chesapeake Exploration, LLC. While Chesapeake also has the the most unconventional wells in Pennsylvania, there are many other drillers with substantial totals, such as Talisman and Range Resources. On the western side of the border, the industry is much less diversified:
Not only does Chesapeake hold 71 percent of the permits, but their total of 227 permits issued is over 15 times more than their nearest competitor in Ohio’s Utica, HG Energy.
https://www.fractracker.org/a5ej20sjfwe/wp-content/uploads/2025/09/2025-Wordmark-Logo.png00Matt Kelso, BAhttps://www.fractracker.org/a5ej20sjfwe/wp-content/uploads/2025/09/2025-Wordmark-Logo.pngMatt Kelso, BA2012-08-13 16:09:312020-07-21 10:40:00Ohio Utica Development Dominated by One Operator, Chesapeake