A white paper by Columbus Community Rights Coalition (CCRC) will inform resident stakeholders of risks to the water associated with oil & gas production activities occurring within their watershed region of Columbus, Ohio.
https://www.fractracker.org/a5ej20sjfwe/wp-content/uploads/2022/10/Columbus-Source-Water.jpg6051500Guest Authorhttps://www.fractracker.org/a5ej20sjfwe/wp-content/uploads/2025/09/2025-Wordmark-Logo.pngGuest Author2022-10-31 21:39:022022-11-29 14:24:38Synopsis: Risks to the Greater Columbus Water Supply from Oil and Gas Production
The federal government is accepting comments on a 5-Year Offshore Oil and Gas Lease Program. We need your voice to join in solidarity with communities in the Gulf and the Arctic and call for no new leases.
https://www.fractracker.org/a5ej20sjfwe/wp-content/uploads/2021/06/LKrop_infrastructure-offshoredrilling-drillrigs-SantaBarbara-CA_EnvrDefenseCtr_Aug20131-e1663254826557.jpg178400Erica Jacksonhttps://www.fractracker.org/a5ej20sjfwe/wp-content/uploads/2025/09/2025-Wordmark-Logo.pngErica Jackson2022-09-06 13:32:202022-09-15 11:14:03Take Action in Support of No New Leases
https://www.fractracker.org/a5ej20sjfwe/wp-content/uploads/2022/04/TAuch_Infrastructure-Compressor_Cryogenic_Complex-MarkWest_EnergyTransfer-WashingtonCounty-PA_Sept2021-feature.jpg6671500Matt Kelso, BAhttps://www.fractracker.org/a5ej20sjfwe/wp-content/uploads/2025/09/2025-Wordmark-Logo.pngMatt Kelso, BA2022-04-28 13:37:312023-03-09 14:03:402021 Production from Pennsylvania’s Oil and Gas Wells
Over the past decade, New York State has seen a steep decline in the quantity of waste products from the fracking industry sent to its landfills for disposal. Explore FracTracker’s 2020 updated data.
https://www.fractracker.org/a5ej20sjfwe/wp-content/uploads/2021/04/PA-Unconventional-Drilling-Waste-Disposal-in-NYS-2011-20-feature-scaled.jpg6671500Karen Edelsteinhttps://www.fractracker.org/a5ej20sjfwe/wp-content/uploads/2025/09/2025-Wordmark-Logo.pngKaren Edelstein2021-04-20 14:05:162021-05-19 10:54:04Trends in fracking waste coming to New York State from Pennsylvania
New York State Department of Environmental Conservation (DEC) Oil and Gas Database includes records for nearly 45,000 wells in the state, nearly all of which are related to the oil and gas industry. Of these records, only 19,600 include drilling dates; some records simply reflect drilling permits that were applied for and expired, or were cancelled for other reasons. Of the records listed, 99% of those drilled are vertical, “conventional” wells.
Research by Bishop (2013) indicates that there could be more than 30,000 additional oil and gas wells that are not documented in the DEC’s database, and potentially not adequately plugged.
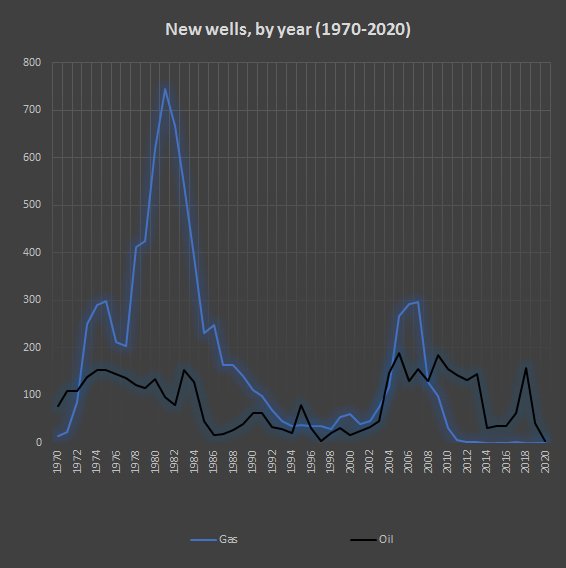
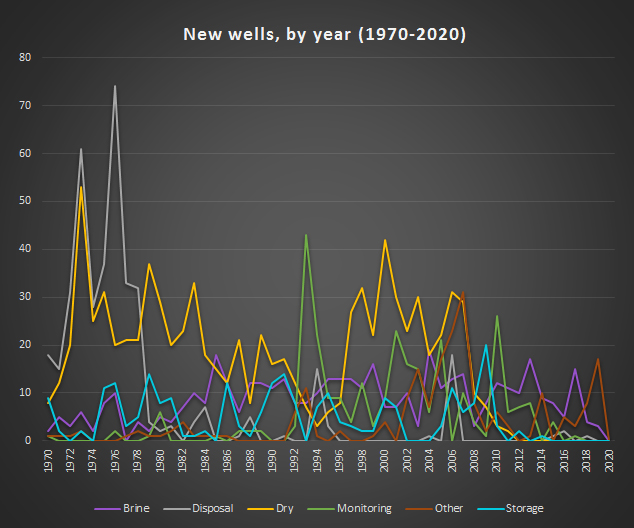
Over the past half-century, drilling activity in New York State has ebbed and flowed. In that period of time, drilling interest in oil and gas saw two main peaks: between 1975 and 1985, and — especially for gas — between 2004 and 2010. Gas drilling activity has currently tailed off to practically nothing since the ban on high-volume hydraulic fracturing was passed in late 2014.
In 2018 and 2019, there was a brief flurry of oil drilling, but that too has dropped off. The causes for the decline in new wells are complicated, but likely reflect a combination of reduced consumption of fossil fuels, as well as steady decreases in the price of oil and gas. Prices in the past several years are up to half what they were previously. In addition, the impact of COVID on the industry has also contributed to this decline, although other sources assert that the fossil fuel industry has benefited from the global pandemic.
In this article we’ll look specifically at spatial and temporal patterns in oil and gas drilling across New York State.
Mapping analysis
Every year, FracTracker updates the full state-wide dataset of oil, gas, and other assorted (non-drinking water) wells. To see the entire “big picture,” you can explore our interactive map below, which shows all wells in the New York State database, from prior to 1900 through late February 2021.
New York State Oil and Gas Wells
This map shows that, despite New York State banning high volume hydraulic, nearly 45,000 wells have been drilled, according to the Department of Environmental Conservation (DEC). Not all the wells in the DEC’s database were actually drilled; some were sites that were permitted, but never explored. Many have been plugged and abandoned. There may be nearly as many undocumented wells as there are in the database, given that record keeping in earlier years was nowhere near as comprehensive as it is today.
In order to turn layers on and off in the map, use the Layers dropdown menu. This tool is only available in Full Screen view. Data sources can be found in the Details section of the map as well as listed the end of this article.
FracTracker has also taken a more fine-grained approach to consider the patterns in drilling in New York State both spatially and temporally. Using the DEC wells database, we first filtered out well data for records that had actual spud (drilling) dates between 1970 and the present. Then, using pivot tables in Microsoft Excel, we graphed the data, and also looked for patterns around where the drilling was taking place.
Emergent from this process, we see the following.
Spatial distributions
Oil and gas hotspots are directly related to the underlying geology of a region. In New York State, the majority of oil wells have been drilled in the Chipmunk and Bradford Formations, followed by the Fulmer Valley, Glade, and Richburg Formations.
Oil Wells in NYS and Their Associated Geological Formations
Updated February 2021
Figure 1. Oil Wells in NYS and Their Associated Geological Formations. Gas wells have historically been most productive in the Medina Formation, followed by the Queenston, and also Trenton-Black River Formations. Data source: New York State DEC Oil and Gas Database.
Gas Wells in NYS and Their Associated Geological Formations
Updated February 2021
Figure 2. Gas wells in NYS and their associated geological formations. Data source: NYS DEC Oil and Gas Database.
Temporal distributions
Activity in drilling has exhibited distinct patterns over time, as well.
In 1982 and 1983, gas drilling in New York State surged, with 774 and 667 new wells drilled over those two years, respectively. The hot spot was in the Medina Group, which over the years, continued to be a primary focus. Well depths in this section of bedrock average around 3,400 feet at that time, although wells were exploited at a more shallow depth in subsequent years. Starting in 1995, gas was discovered in the Black River shale formation, with reservoirs more than 10,000 feet deep in some places. All of these wells were vertically oriented, but still were exploited using hydraulic fracturing technologies.
Oil
The early to mid-1980s marked a relatively high level in oil well drilling in New York State, with a peak occurring in 1984, with 153 wells drilled. After a lull of about 20 years, activity picked up again in 2005, hitting a high point in 2006 when 188 oil wells were drilled. In 2010, there was another peak with 188 wells, followed by a waning period of 4 years. Then, in 2019, interest exploded in a small area of the Bradford oil fields in Cattaraugus County, with 156 wells drilled, and an average production of 319 barrels per well over the course of that year.
Economic implications
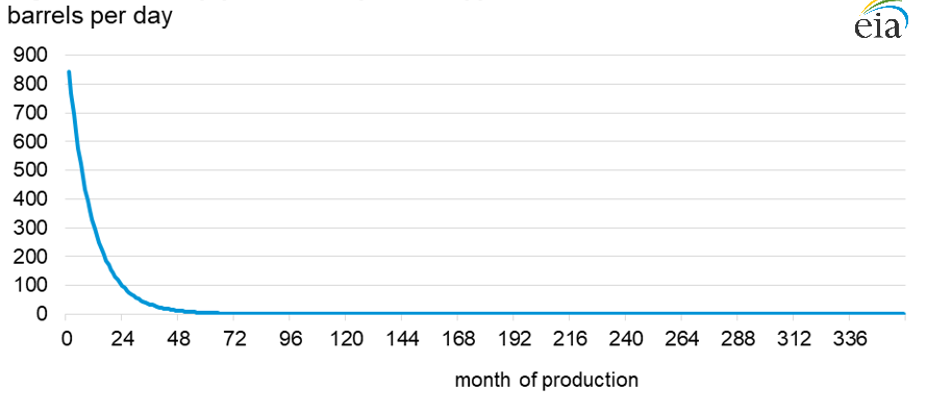
According to EIA estimate from 2014, the cost of drilling an onshore oil well is between $4.9 – 8.3 million, however smaller vertical wells like those common in New York State are likely to cost more in the range of $150,000. With the price of oil at $64 a barrel in 2019, in its first year in production, the gross profit of any of these wells in New York, based on reported production, would have been between $0 and $120,000, with an average year around $20,400 per well. It’s hard to imagine how drilling for oil in recent years in New York State could have possibly been profitable, in particular with the steep drop-off in production typically seen after the first year or two.
These simple examples of a localized “oil boom” in New York State provide a stark example of exactly how unsustainable these endeavors are, particularly for small drilling operators. So, despite the enthusiastic rush to oil drilling in 2019, activity after that has been followed by a quick decline, with only 41 oil wells drilled in New York State in 2020, and only 4, so far, in 2021.
Patterns in other types of wells
The increase in dry wells seems to track with the general patterns of oil and gas exploration. Hence, in periods when a lot of oil and gas wells are being drilled, there will be a higher number of wells that are dry, or nonproductive. During the 1970s, there was also a strong peak in disposal wells drilled. We are not certain whether this is, or is not, related to the high number of gas wells drilled during this period.
New York State moving towards better stewardship of legacy wells
Some of the oil and gas wells drilled in the 19th and early 20th century were particularly poorly documented (or not documented at all), and improperly plugged. This creates a public and environmental safety hazard, with more than 30,000 of these undocumented oil and gas wells spread across the state potentially leaking methane into the air and water. Finding the abandoned and orphan wells has been a long term problem because they are often located in rough terrain across central and western New York. Fortunately, the New York State Department of Environmental Conservation has taken new measures to locate and plug these legacy wells, using drone technology. FracTracker reported on a pilot initiative a few years ago that was testing this technique, but the new program is backed by $400,000 in funding from NYSERDA, the New York State Energy Research and Development Authority, in support of New York States ambitious goals to reduce greenhouse gas emissions through the Climate Leadership and Community Protection Act.
The Takeaway
One hundred years ago, few people expressed concerns about the environmental hazards associated with oil and gas drilling. Record-keeping was spotty, which has left us with a legacy of wells whose locations are lost to memory, or simply improperly plugged. After several periods of vigorous mineral extraction activity in the 1980s and early 2000s, oil and gas drilling has declined in its profitability, and formerly easily-accessed reserves have been depleted. Today, with unprecedented interest in clean energy sources like wind, geothermal, and solar, society can become less dependent on fossil fuels, and focus on responsibly stewarding the remnants of these “dinosaurs,” using new technologies to help clean up the damages left by them.
https://www.fractracker.org/a5ej20sjfwe/wp-content/uploads/2021/04/New-York-State-wells-feature.jpg8331875Karen Edelsteinhttps://www.fractracker.org/a5ej20sjfwe/wp-content/uploads/2025/09/2025-Wordmark-Logo.pngKaren Edelstein2021-04-01 11:10:062021-04-15 14:08:35New York State Oil & Gas Well Drilling: Patterns Over Time
Access to reliable data is crucial to our understanding of risky fracking waste disposal, and in turn, our ability to protect public health. But when it comes to oil and gas liquid waste disposal wells in Pennsylvania, despite monitoring by two separate agencies, we are left with an incomplete and inaccurate account.
If we were to emulate the Charles Dickens classic, this article might begin, “It was the best of datasets, it was the worst of datasets.” Unfortunately, even that would be too generous when it comes to describing available data around oil and gas liquid waste disposal wells in Pennsylvania. To fully understand the legacy and current state of these wells, it is necessary to query the two agencies that have a role in overseeing them, the United States Environmental Protection Agency (EPA) and the Pennsylvania Department of Environmental Protection (DEP).
Given the relatively small inventory of these wells compared to other oil and gas producing states, the problems with the two datasets are enormous. Before jumping into these issues, however, it would be useful to review the nature of these wells, why there are two regulatory agencies involved, and why there are so few of them in Pennsylvania in the first place, relatively speaking.
Disposal Wells Categories
To further our industrial exploits of the planet, humans have found it useful to inject all kinds of things into the earth. In the United States, this ultimately falls under the jurisdiction of EPA’s Underground Injection Control (UIC) program, and the point of injection is known as an injection well. Altogether, there are six classes of injection wells, with those related to oil and gas operations falling into Class II.
There are three categories of Class II injection wells, including waste disposal, enhanced recovery, and hydrocarbon storage. There is also an infamous exemption known as the “Haliburton Loophole,” which has allowed oil and gas companies to inject millions of gallons of hydraulic fracturing fluid into oil and gas wells in order to stimulate production without any federal oversight at all.
When most people speak of “injection wells” in an oil and gas context, they are usually referring to waste disposal wells, and this is our focus here. This well type is also referred to as Class II-D (disposal) and salt water disposal wells (SWD). This latter term is used by a majority of state regulators, so we will use that abbreviation here, even though considering this type of toxic and radioactive fluid “salt water” is surely one of the industry’s most egregious euphemisms.
Dealing with Dangerous Fluids
There are two main types of liquid waste that are disposed of at SWD injection wells. As always, these waste types have a number of different names to keep everyone on their toes but for the sake of simplicity will call them “flowback” and “brine,” and both are problematic materials to handle. Additionally, the very act of industrial-scale fluid injection presents problems in its own right.
As mentioned above, when operators pump a toxic stew of water, sand, and chemicals into a well to stimulate oil and gas production, that mixture is known as hydraulic fracturing fluid, or fracking fluid. Some of these chemicals are so secretive that even the operators of the well don’t know what is included in the mix, let alone nearby residents or first responders in the event of an incident.
Between 10% and 100% of this fluid will return to the surface, and is then known as flowback fluid, becoming a waste stream. In Pennsylvania, the average amount of fracking fluid injected into production wells exceeds 10 million gallons in recent years according to data from the industry’s self-reporting registry known as FracFocus. With more than 12,000 of these wells drilled statewide, disposing of this waste stream becomes an enormous concern.
In addition to flowback fluid, there are pockets of ancient fluids encountered by the drilling and fracking processes that return to surface as well. These solutions are commonly referred to as brine due to their extremely high salt content, although this is not the type of fluid that you’d want to baste a Thanksgiving turkey with. Total salt concentrations can reach up to 343 grams per liter, roughly ten times the salt concentration of sea water. These brines include but are not limited to the familiar sodium chloride that we use to season our food, but include other components as well, including significant bromide and radium concentrations.
When Pennsylvania experimented with our public health by authorizing disposal of these fracking brines in municipal plants designed to treat sewer sludge, the bromides in that drilling waste stream became problematic as they interacted with disinfectants to cause a cancerous class of chemicals known as trihalomethanes. This ended the practice of surface “treatment” from these sites into streams in 2011, and along the way caused many water authorities to switch from chlorine to chloramine disinfectant processes. This, in turn, may have exacerbated lead exposure issues in the region, as the water disinfected with chloramine often eats away at the calcium scale deposits covering lead pipes and solder in the region’s older homes.
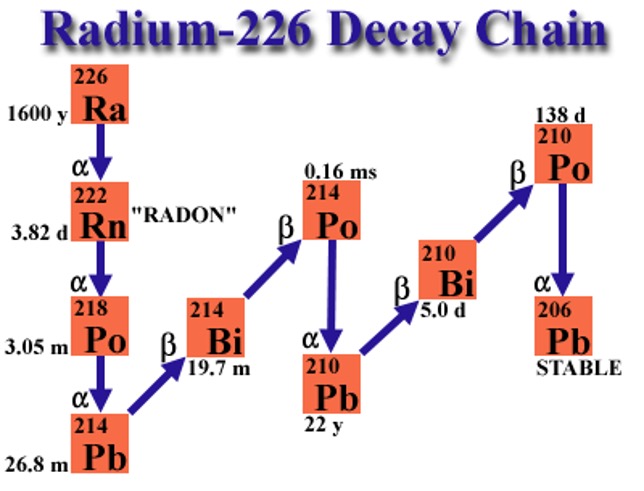
Marcellus and Utica wastewater are also very high in a radioactive isotope of radium known as Ra-226, which has a half-life of 1600 years. After that amount of time, half of the present radium will have emitted an alpha particle, which can cause mutations in strands of DNA when introduced inside the body, through contaminated drinking water, for example. After the hazardous expulsion of the alpha particle, the result become radon gas, which is estimated to cause 20,000 lung cancer deaths per year in the United States. Further down the decay chain is Polonium 210, which was infamously used in the assassination of Russian spy Alexander Litvinenko in London in 2006.
None of this should be injected into formations beneath people’s homes, near drinking water supplies, streams, or really anywhere that we aren’t comfortable sacrificing for the next few thousand years.
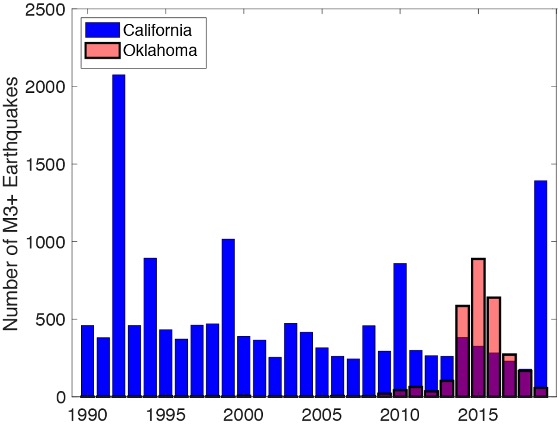
On top of all the problems with the water chemistry of both produced water and brine, the very act of injecting these fluids into the ground has triggered a large number of earthquakes in areas with frequent or large volumes of waste injection. This human-caused phenomenon is known as induced seismicity. The most well-known example of this is the previously stable state of Oklahoma which surged to have more magnitude 3.0+ earthquakes than California for a number of years during a drilling boom in that region. The largest of these was the magnitude 5.8 Pawnee earthquake in 2016.
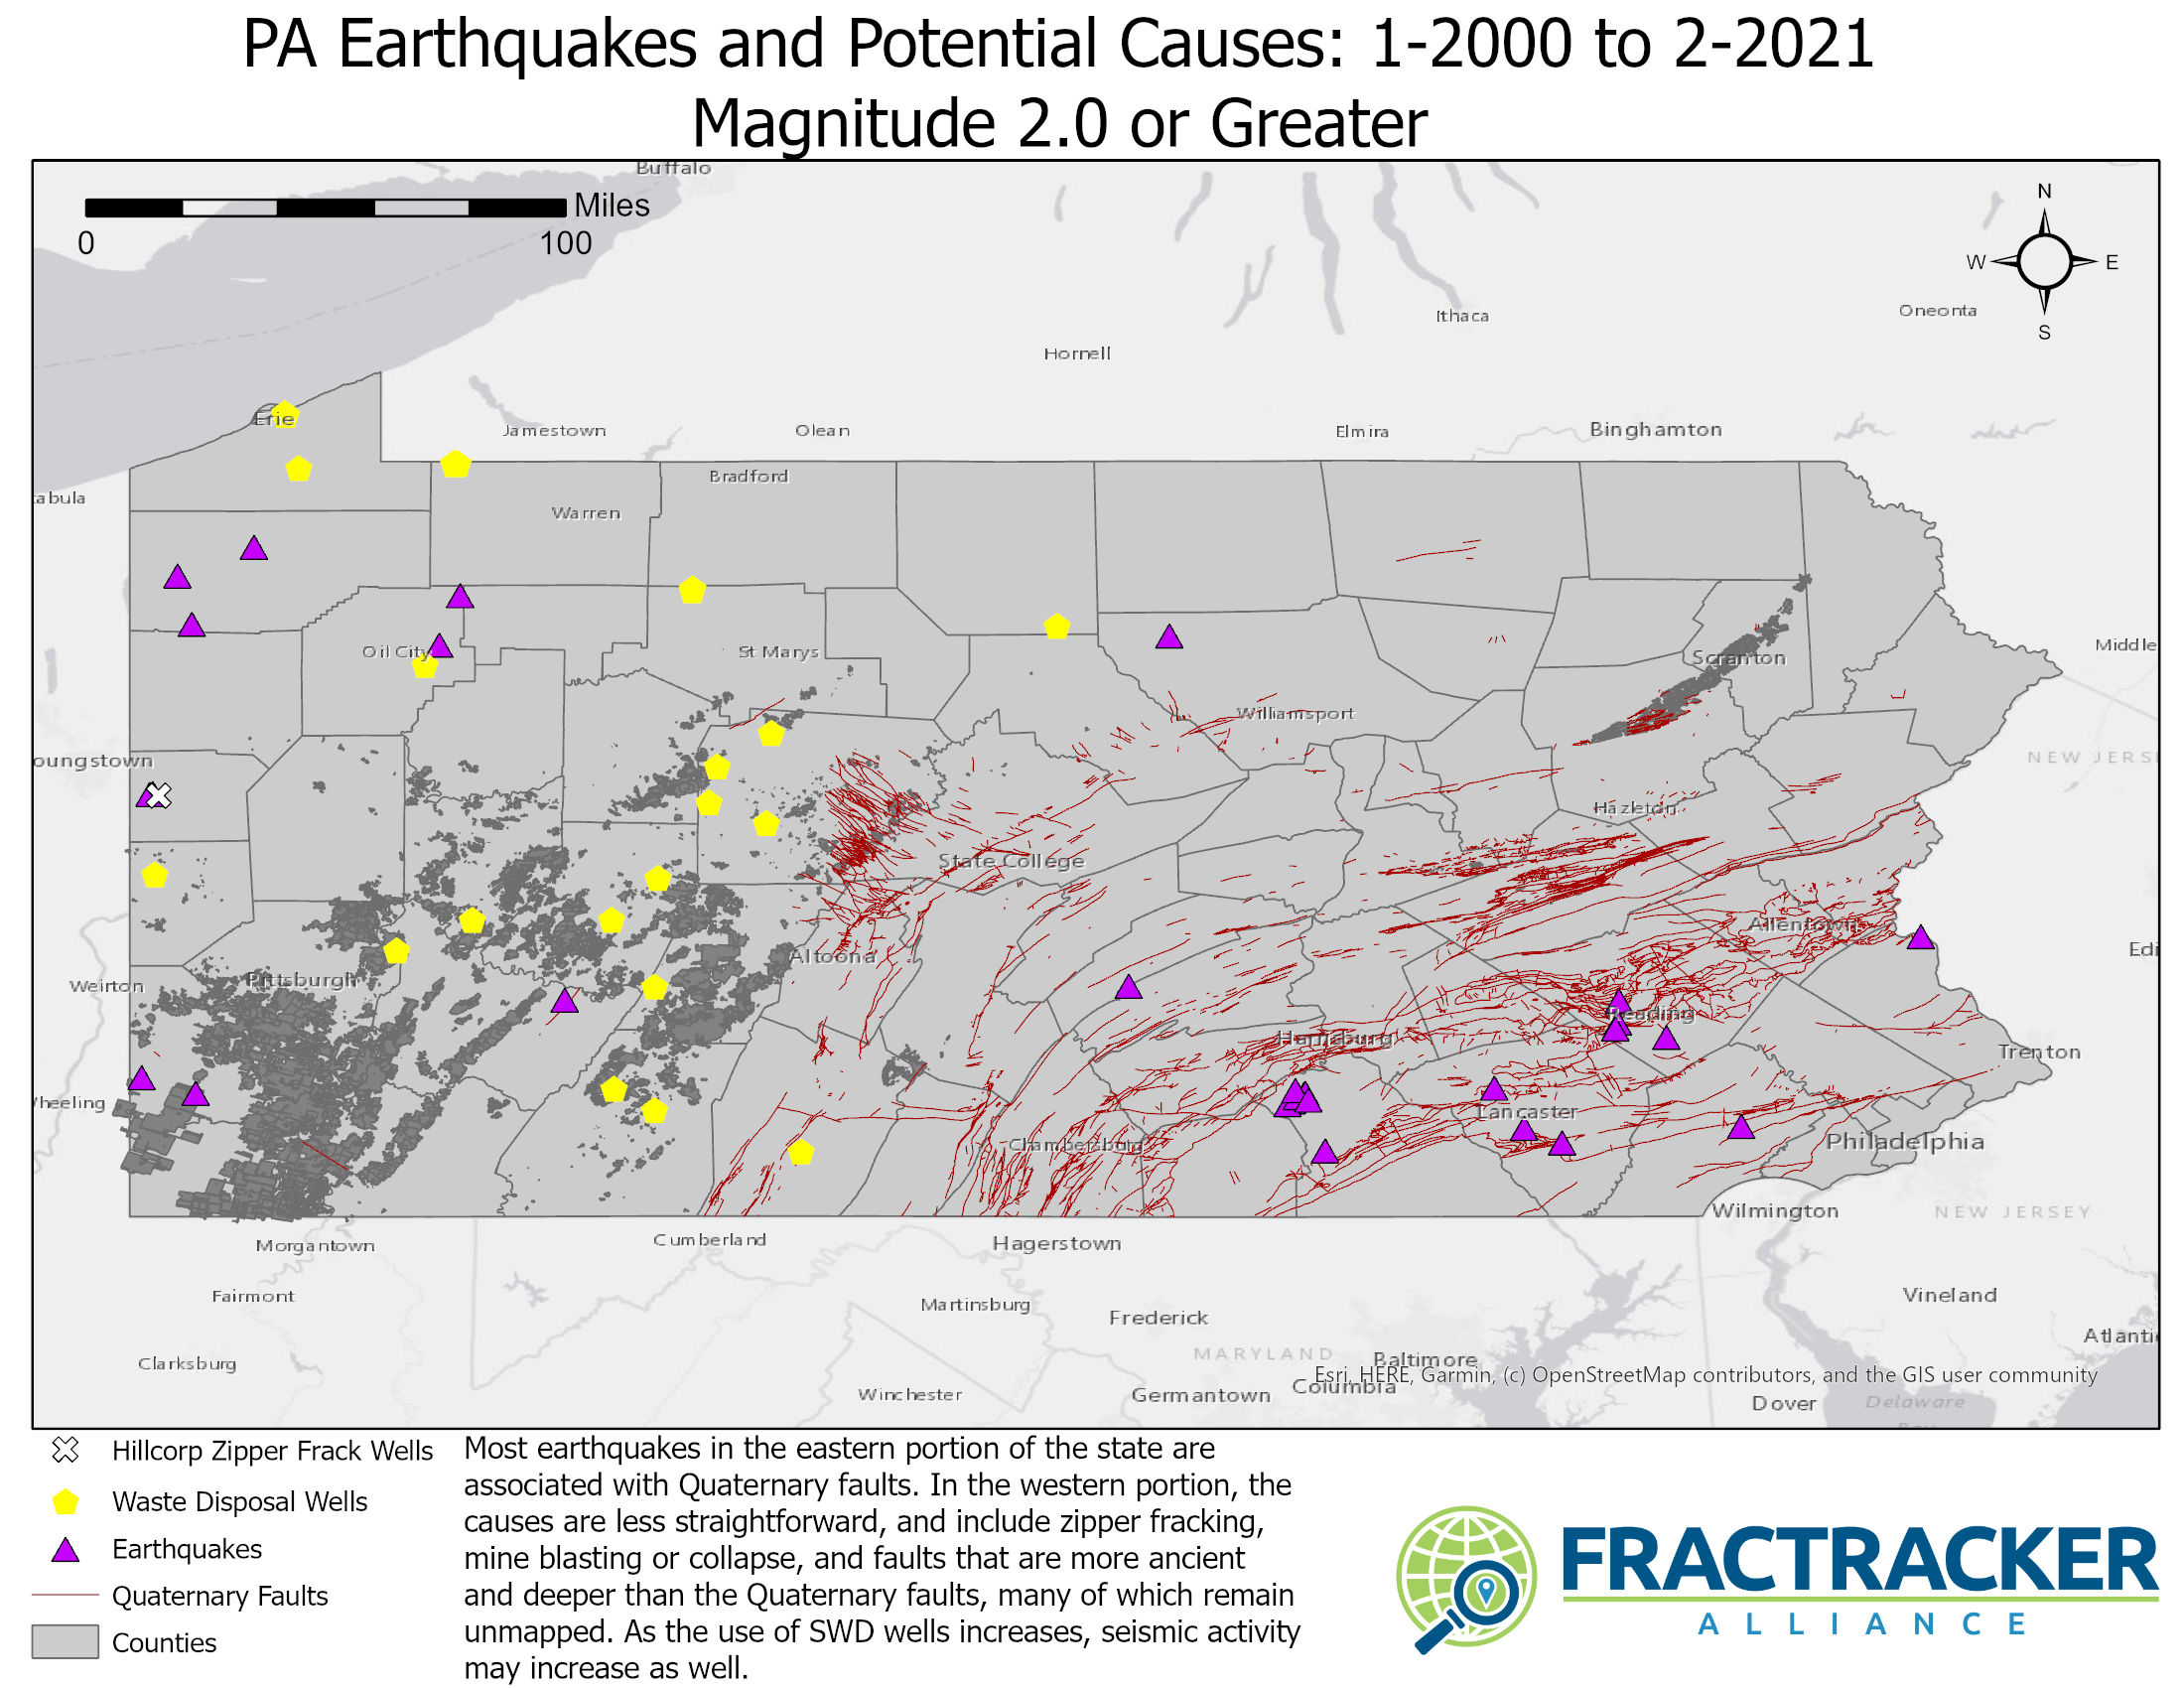
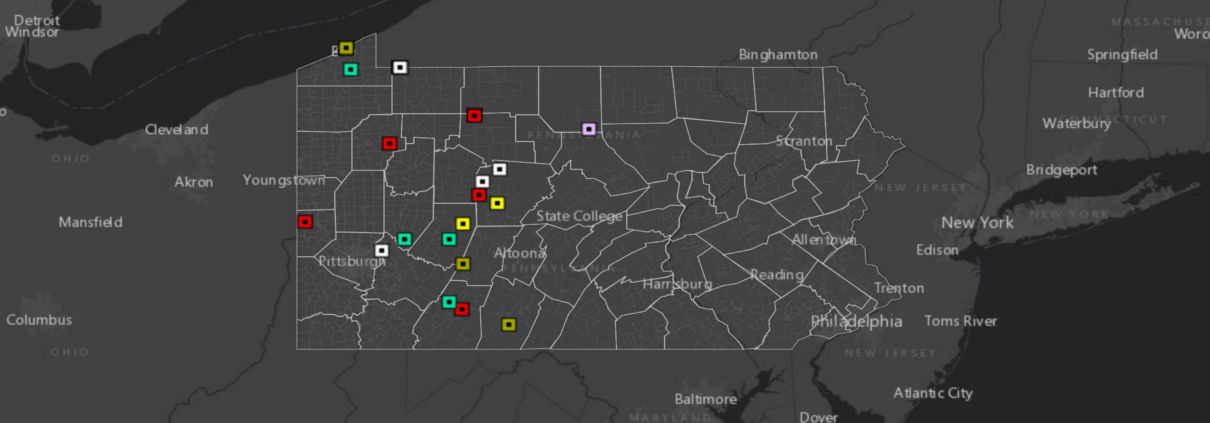
Figure 3. PA Earthquakes and Potential Causes: 1/2000 – 2/2021, Magnitude 2.0 or Greater. Most earthquakes in the eastern portion of the state are associated with Quaternary faults. In the western portion, the causes are less straightforward, and include zipper fracking, mine blasting or collapse, and faults that are more ancient and deeper than the Quaternary faults, many of which remain unmapped. As the use of SWD wells increases, seismic activity may increase as well.
Manmade earthquakes are not limited to Oklahoma. For example, there were approximately 130 seismic events in one year period in the Youngstown, Ohio area due to SWD activity, including one measuring 4.0 on the last day of 2011. Over the years, the regulatory reaction to induced earthquakes seems to walking along the slippery slope from “that can’t happen” to “that can’t happen here” to “they’re all small earthquakes” to “we can mitigate the impact,” despite all evidence to the contrary.
Two Regulators
So who gets to be in charge of this dumpster fire? As mentioned above, this is ultimately under the umbrella of EPA’s Underground Injection Control program. However, they have a complicated arrangement with the various states defining who has primary enforcement authority for this type of well.
In Pennsylvania, such wells must obtain a permit from EPA before obtaining a second permit from DEP. In a 2017 hearing in Plum Borough, Allegheny County, furious residents concerned with a variety of issues with a proposed SWD well were told that in Pennsylvania, EPA could only consider whether or not the well would violate the 1972 Clean Water Act when considering the permit, and that the correct audience for everything else would be DEP. Both permits for this well that is near and undear to me were ultimately issued, and operations are expected to begin in the next month if Governor Wolf does not instruct the DEP to reconsider their permit.
There is some precedent for overturning such a permit. In March of 2020, DEP yanked a permit for a SWD well in Grant Township, Indiana County, suddenly respecting a home-rule charter law that the agency had previously sued the Township over.
Without the prospect of royalties or impact fees, no community wants these wells and regulators know that they are nothing but problems. However, the reality is that the regulators oversee an industry that produces a tsunami of this toxic waste – more than 61.8 million barrels of it from unconventional wells in Pennsylvania in 2020 according to self-reported data, which is almost 2.6 billion gallons of the stuff, or slightly more than the capacity of Beaverdam Run Reservoir in Cambria County, a 382 acre lake with an average depth of 20 feet.
Unsuitable Geography
Nationally, injection wells are quite common, with over 740,000 such wells in the EPA inventory for 2018 and Class II (O&G) wells represent about a quarter of this figure. Of these Class II injection wells, roughly 20% are for fluid disposal, giving us an estimated 37,000 SWD wells nationwide. This number is expected to go up, as more than three-quarters of the 8,600 permits issued in 2018 were for oil and gas purposes.
However, in Pennsylvania, there have been quite few of these, compared to other states. The primary reason for this is its geology, which has largely been considered unsuitable for this type of activity. For example, a 2009 industry analysis states:
“The disposal of flowback and produced water is an evolving process in the Appalachians. The volumes of water that are being produced as flowback water are likely to require a number of options for disposal that may include municipal or industrial water treatment facilities (primarily in Pennsylvania), Class II injection wells [SWDs], and on-site recycling for use in subsequent fracturing jobs. In most shale gas plays, underground injection has historically been preferred. In the Marcellus play, this option is expected to be limited, as there are few areas where suitable injection zones are available.”
I discussed this topic in a phone call with an official from EPA, who largely confirmed this point of view, but preferred the phrase, “the geology is complicated” instead of the word “unsuitable.” When the UIC program was established from the 1974 Safe Drinking Water Act, there were only seven such wells in operation, and according to EPA’s data, there were still just 11 active SWD wells in the Commonwealth but with more on the way. I was cautioned that the geology wasn’t the only reason, however. Neighboring Ohio had hundreds of these wells, many of which are clustered close to the border with Pennsylvania. The two states have different primacy and permitting arrangements, which is a factor as well.
I have not come across sources mentioning why Pennsylvania’s geology was so unsuitable – or complicated, if we are being generous. However, there are numerous widespread issues that could be a factor, including voids created by karst and legacy coal mines, and formations that might have otherwise trapped gasses and fluids being punctured with up to 760,000 mostly unplugged oil and gas wells and more than one million drinking water wells.
Even when these fluids have been pumped deep underground, they are not necessarily out of sight and out of mind. For example, an abandoned well in Noble County Ohio suddenly began spewing gas field brine just a few weeks ago, resulting in a fish kill in a nearby stream. The incident is believed to be related to SWD wells in the general vicinity even though the closest of these is miles away from the toxic geyser. The waste fluids injected beneath the surface will exploit any pathway available through crumbling or porous rocks to alleviate the pressure built up from the injection process. These fluids don’t care whether the target is an old gas well, mine void, or drinking water aquifer.
Of course, we could ask the question in reverse, and ask what makes the injection of oil and gas fluids suitable in other locations, and the aggregated evidence would lead us to “nothing” as our answer. Nothing, other than the fact that drilling and fracking produces billions of gallons of liquid waste, and that it has to go somewhere.
Although EPA play a major role in permitting and regulating SWD wells in Pennsylvania, they do not publish data related to these wells on their website. FracTracker started hearing rumors about a spate of new SWD permits all over the state that were not accounted for in DEP data. As it turns out, many of these turned out to be other oil and gas wastewater processing facilities, and the public’s confusion about these is completely understandable because these facilities lacked the proper public notice process. These facilities are concerning in their own right – and residents of Pennsylvania should look here to see if one of these 49 facilities are in their neighborhoods – but these are not disposal wells.
To clear up the confusion, I submitted a Freedom of Information Act request to EPA for a spreadsheet of their Class II injection wells in Pennsylvania. This was apparently an onerous task that would require more than ten hours of labor on their behalf. When I mentioned that I was mostly interested in disposal wells, that sped the process up considerably.
Ultimately, I received a portion of the data fields that I had asked for.
Asked For
Received
Well Name
Yes
Well API Number
Yes
Class II Category (disposal, recovery, storage)
No
Date application received
No
Application status (e.g., pending, complete)
Yes
Application result (e.g., approved, rejected)
No
Application result date (date of EPA’s decision)
No
Well status (e.g., active, plugged)
Yes
Well county name
Yes
Well municipality name
No
Well latitude
Yes
Well longitude
Yes
Table 1 – Summary of fields requested and received in FracTracker’s FOIA submission with EPA.
I started to compare the EPA dataset to DEP’s SWD well dataset, which is a part of its conventional well inventory. Each source had 23 records. We were off to a good start, but this data victory turned out to be limited in scope as the discrepancies between the two datasets continued to grow. Inconsistencies between the two datasets are as follows:
County
DEP API
DEP Well Name
EPA API Match
EPA Name Match
Notes
Allegheny
003-21223
SEDAT 3A
Y
Y
Armstrong
005-21675
HARRY L DANDO 1
Y
Y
Beaver
007-20027
COLUMBIA GAS OF PENNA INC CGPA5
Y
Y
Bedford
009-20039
KENNETH A DIEHL D1
N
N
Not on EPA List
Cambria
021-20018
THE PEOPLES NATURAL GAS CO 4627X
N
N
Not on EPA list
Clearfield
033-27255
FRANK & SUSAN ZELMAN 1
N
Y
DEP / EPA API Number mismatch
033-27257
POVLIK 1
N
Y
No EPA API No.
033-00053
IRVIN A-19 FMLY FEE A 19
Y
Y
033-22059
SPENCER LAND CO 2
Y
Y
Elk
047-23835
FEE SENECA RESOURCES WARRANT 3771 38268
Y
Y
047-23885
FEE SENECA RESOURCES WARRANT 3771 38282
N
Y
DEP / EPA API Number mismatch
Erie
049-24388
NORBERT CROSS 2
Y
Y
049-20109
HAMMERMILL PLT 1
N
N
Not on EPA List
049-00013
HAMMERMILL 3
N
N
Not on EPA List
049-00012
HAMMERMILL 1
N
N
Not on EPA List
Greene
N
N
Not on DEP list. EPA Permit PAS2D210BGRE – no API to match
Indiana
063-31807
MARJORIE C YANITY 1025
Y
Y
063-20246
T H YUCKENBERG 1
Y
Y
Somerset
111-20059
W SHANKSVILLE SALT WATER DISP 1
Y
N
111-20006
MORRIS H CRITCHFIELD 1
Y
N
Potter
105-20473
H A HEINRICK RW-55
CA
Y
Category Anomaly – Not on DEP SWD list – does appear as Plugged OG Well (consistent w/ EPA status notes)
Venango
121-44484
LATSHAW 9
Y
Y
Warren
123-39874
BITTINGER 4
N
Y
API Mismatch (But does match Bittinger #1) Lat/Long match site name
123-33914
JOSEPH BITTINGER 1
N
Y
API Mismatch (But does match Bittinger #4) Lat matches site name, Long slightly off
123-33944
JOSEPH BITTINGER 2
Y
Y
123-33945
JOSEPH BITTINGER 3
CA
Y
Category Anomaly – Not on DEP SWD list – does appear as “Injection”
123-34843
SMITH/RAS UNIT 1
CA
Y
Category Anomaly – Not on DEP SWD list – does appear as “Observation”
123-22665
LEROY STODDARD & FRANK COFFA 1 WELL
N
N
Not on DEP list of all wells. Does appear on eFACTS. No location data
Table 2 – Discrepancies between EPA and DEP data for SWD wells in PA.
Altogether, there was at least one data discrepancy on 17 out of 28 wells (61%) on the combined inventories, and this is allowing for significantly different formatting of the well’s name. The DEP list contained five records that were not on the EPA dataset at all, four records where the well’s API number did not match, three instances where the DEP well type was different from EPA’s listing, two wells with matching API numbers but different well names, two wells that were missing the API number on the EPA list, and one well that was on the EPA list that I have not been able to find in any of DEP’s inventories. These last two wells could not be mapped due to the lack of location data.
It isn’t always possible to know which dataset is erroneous, but the EPA list has several obvious omissions and one instance where the API number and well name are in the wrong columns. The quality of DEP data has improved over the years and appear to have some data controls in place to avoid some of these basic errors. For that reason, I suspect that most of the problems stem from the EPA dataset, and I have used DEP coordinates to map these wells.
Waste Disposal Wells in Pennsylvania
This map contains numerous layers that explore the current state of Class II-D Salt Water Disposal (SWD) injection wells for oil and gas waste in Pennsylvania. View the map “Details” tab below in the top left corner to learn more and access the data, or click on the map to explore the dynamic version of this data.
In the early 1970s, it was recognized that industrial injection of oil and gas waste underground could lead to risks to human health and the environment, so several major protective laws were put in place, including the Clean Water Act of 1972, the Safe Drinking Water Act of 1974, and the Pennsylvania’s 1971 Environmental Rights Amendment. Decades later, it feels like the Pennsylvania Department of Environmental Protection and the United States Environmental Protection Agency don’t take their regulatory responsibilities very seriously when it comes to oil and gas liquid waste disposal wells. While the state does have fewer of this type of well than other states, there are five that are currently under construction, according to the EPA dataset. Many of these, like the Sedat 3A well in Allegheny County, have come after significant community opposition, and many of the residents’ concerns have not been addressed by either agency.
There will undoubtedly be more of these disposal wells proposed in the near future. Residents would do well to hassle their municipalities to update their ordinances for this type of well if they happen to live in a place where such ordinances are possible. Solicitors should be instructed to regularly scour the Pennsylvania Bulletin and be in contact with EPA for the earliest possible notification of a proposed site, so that there is time to respond within the comment periods.
Additionally, the sloppiness of the datasets calls all sorts of questions into play regarding the co-regulation of these wells. In the case of an incident, it’s not even clear that both agencies have the information on hand to even locate the site in the field. Meanwhile, a 61% error rate between the sites name, API number, and status does not inspire confidence that agencies are keeping a close eye on these facilities, to say the least.
Above all, we must all realize that it isn’t safe to assume that someone will let us know when these types of facilities are proposed. Regulators have shown us through their actions that they are thinking far more about the billions of gallons of waste that needs to be disposed of than of the well-being of dozens or even hundreds of neighbors near each toxic dump site.
References & Where to Learn More
Data supporting this article, as well as the static map in Figure 3, can be found here.
FracTracker Pennsylvania articles, maps, and imagery: https://www.fractracker.org/map/us/pennsylvania/
https://www.fractracker.org/a5ej20sjfwe/wp-content/uploads/2021/02/Waste-Disposal-Wells-in-Pennsylvania-feature-scaled.jpg6671500Matt Kelso, BAhttps://www.fractracker.org/a5ej20sjfwe/wp-content/uploads/2025/09/2025-Wordmark-Logo.pngMatt Kelso, BA2021-02-26 12:23:392021-04-15 14:08:41Pennsylvania’s Waste Disposal Wells – A Tale of Two Datasets
Since the advent of unconventional shale gas drilling, some effects have been immediate, some have emerged over time, and some are just becoming apparent. Two reports recently published by the Delaware Riverkeeper Network advance our understanding of the breadth of the impacts of fracking in Pennsylvania. The first report, written by FracTracker, reviews research on the ways fracking impacts the health of Pennsylvanians. The second report by ECONorthwest calculates the economic costs of the industry.
“Fracking is heavily impacting Pennsylvania in multiple ways but the burden is not being fairly and openly calculated. These reports reveal the health effects and economic costs of fracking and the astounding burdens people and communities are carrying,” said Maya van Rossum, the Delaware Riverkeeper.
Learn what the latest science and analysis tells us about the costs of fracking, who is paying now, and what the future price is forecasted to be.
Access the full reports here:
Health Impact Report
“Categorical Review of Health Reports on Unconventional Oil and Gas Development; Impacts in Pennsylvania,” FracTracker Alliance, 2019 Issue Paper
“The FracTracker Alliance conducted a review of the literature studying the impact of unconventional oil and gas on health. Findings of this review show a dramatic increase in the breadth and volume of literature published since 2016, with 89% of the literature reporting that drilling proximity has human health effects. Pennsylvanian communities were the most studied sample populations with 49% of reviewed journal articles focused on Marcellus Shale development. These studies showed health impacts including cancer, infant mortality, depression, pneumonia, asthma, skin-related hospitalizations, and other general health symptoms were correlated with living near unconventional oil and gas development for Pennsylvania and other frontline communities.”
–Kyle Ferrar, FracTracker Alliance Western Program Coordinator
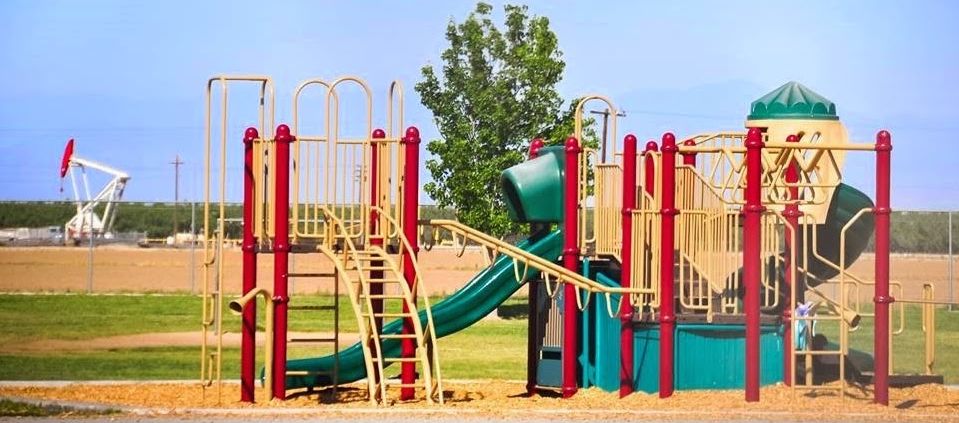
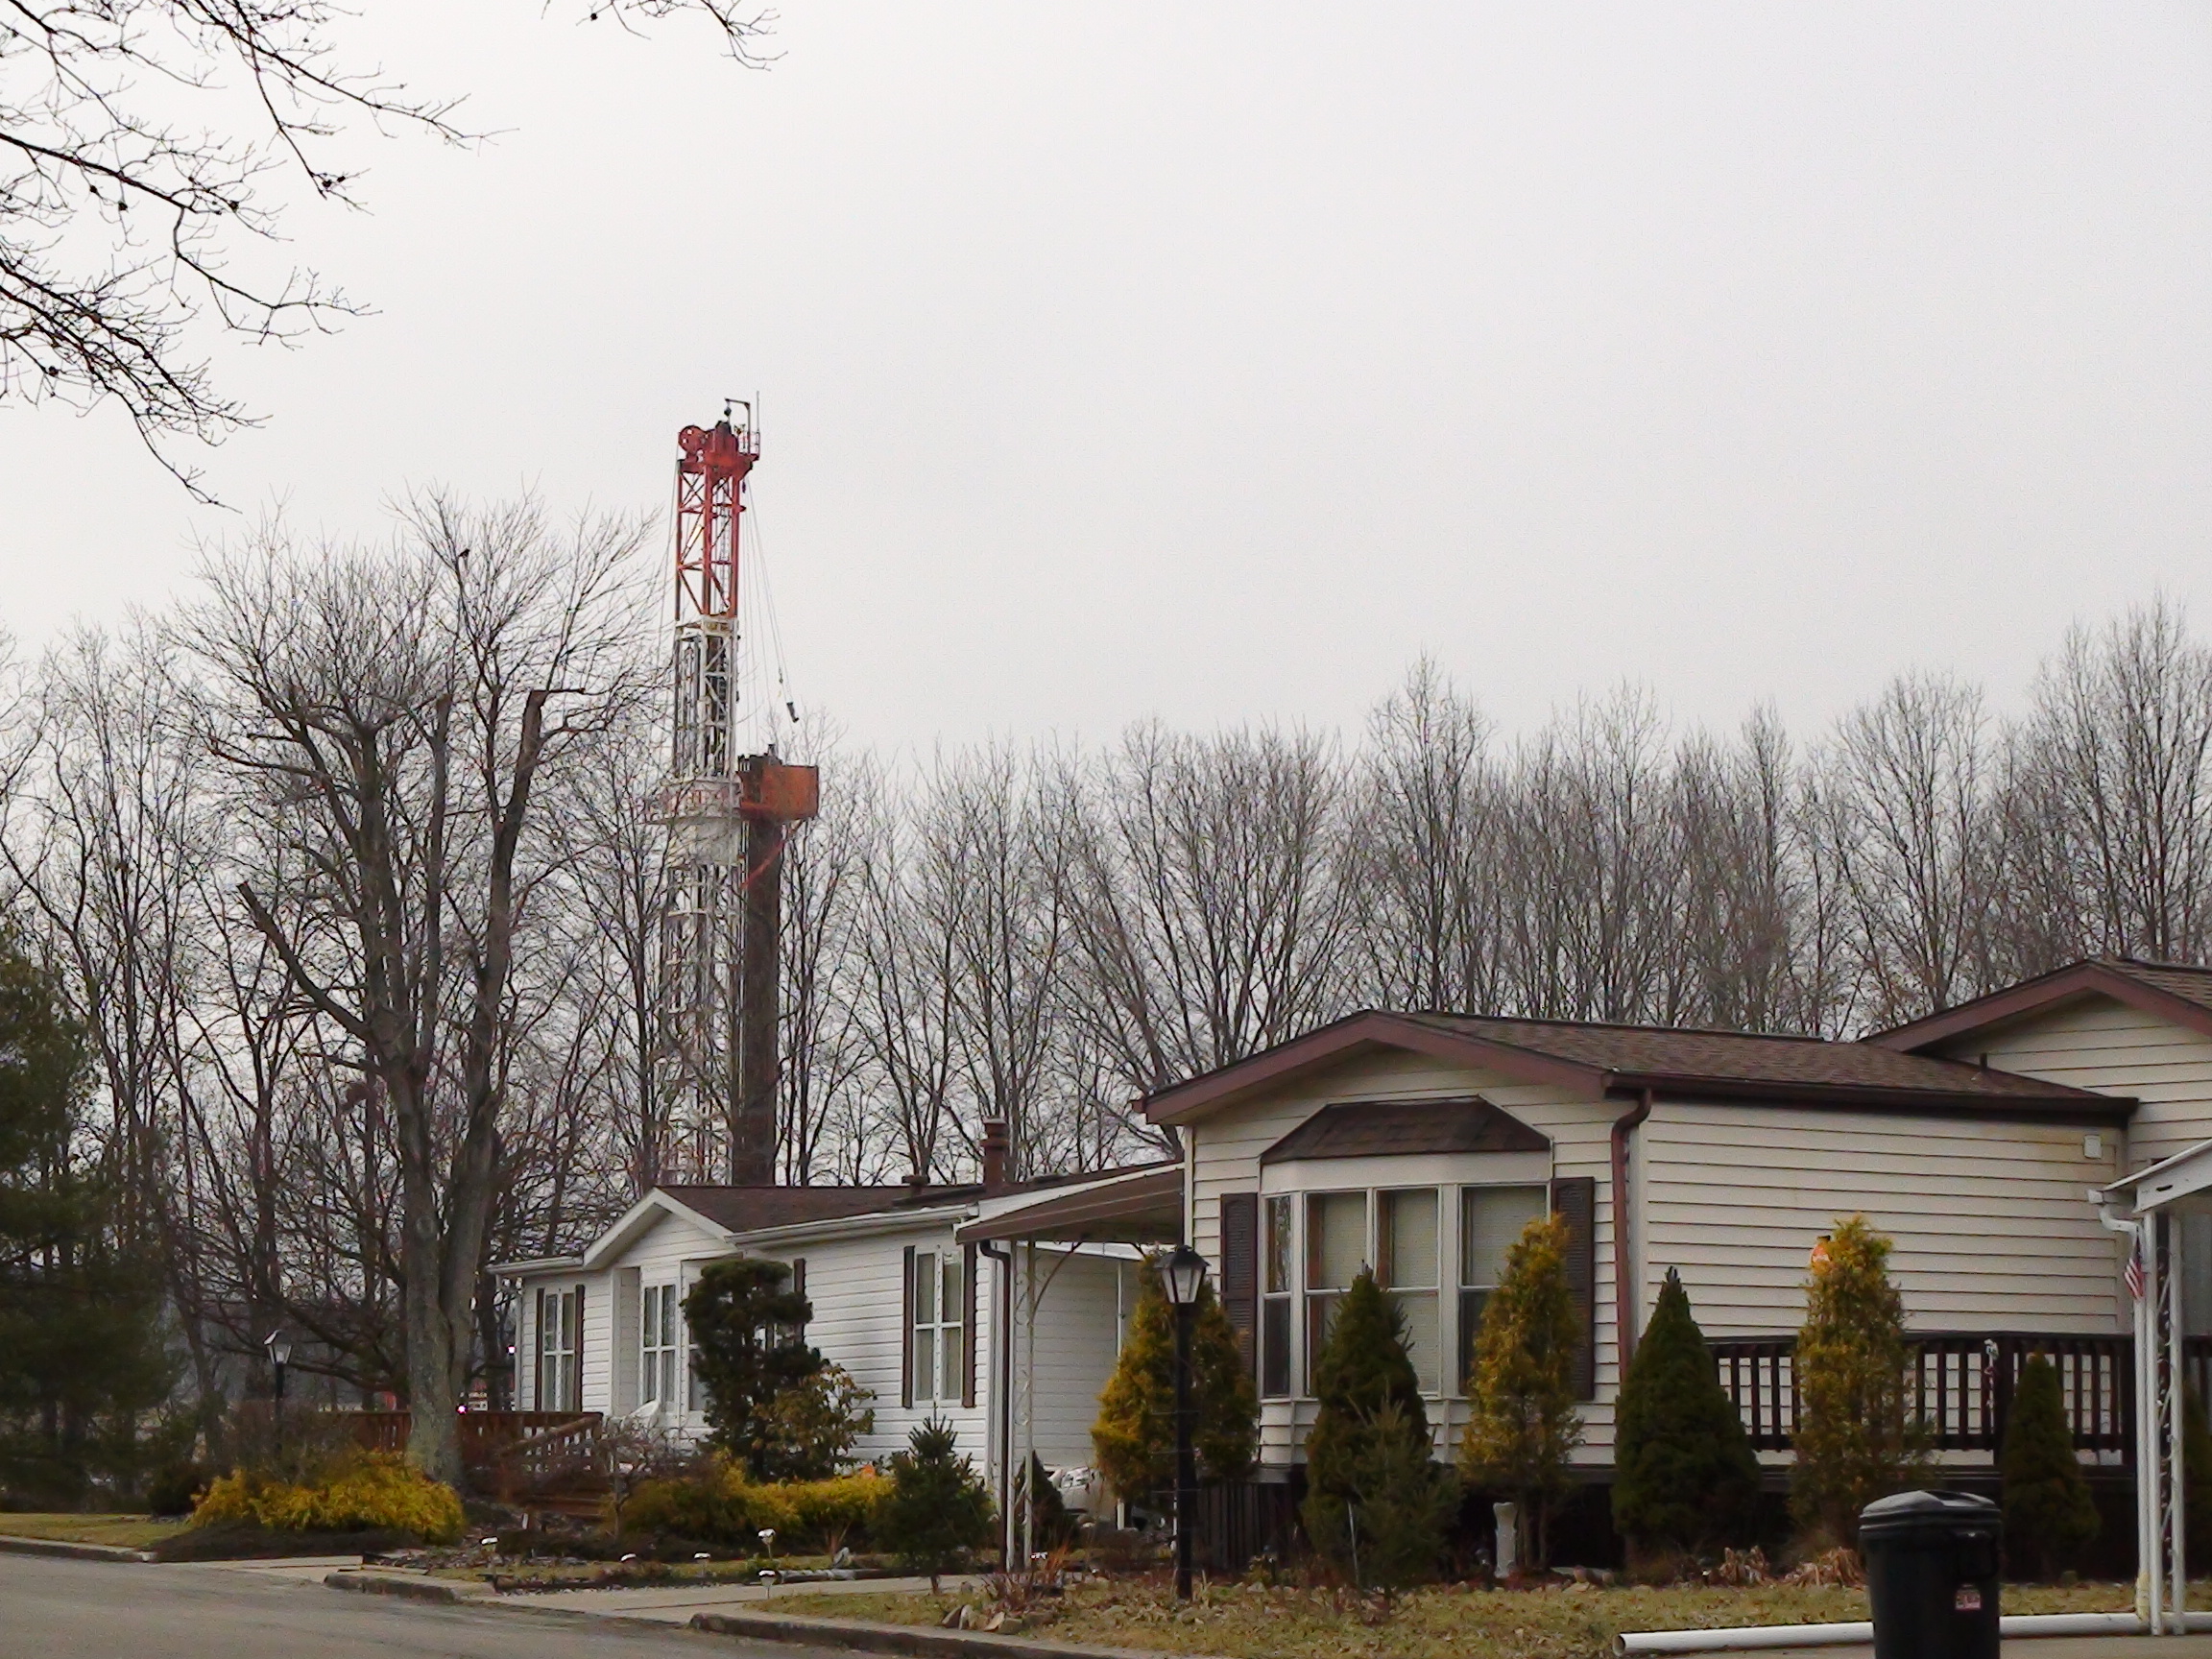
Rig and house. Westwood Lake Park. Photo by J Williams, 2013.
“Fracking wells have an extensive presence across Pennsylvania’s landscape – 20 percent of residents live within 2 miles of a well. This is close enough to cause adverse health outcomes. Collectively we found annual costs of current fracking activity over $1 billion, with cumulative costs given continued fracking activity over the next 20 years of over $50 billion in net present value for the effects that we can monetize. The regional economic benefits also seem to be less than stated, as the long-term benefits for local economies are quite low, and can disrupt more sustainable and beneficial economic trajectories that might not be available after a community has embraced fracking.”
–Mark Buckley, Senior Economist at the natural resource practice at ECONorthwest
These reports on the health effects and economic impacts of unconventional oil and natural gas development yield disheartening results. There are risks of extremely serious health issues for families in impacted areas, and the long term economic returns for communities are negative.
Arming ourselves with knowledge is an important first step towards the renewable energy transformation that is so clearly needed. The stakes are too high to allow the oil and natural gas industries to dictate the physical, social, and economic health of Pennsylvanians.
https://www.fractracker.org/a5ej20sjfwe/wp-content/uploads/2019/05/DrillingNearSchoolCA-1.jpg445959FracTracker Alliancehttps://www.fractracker.org/a5ej20sjfwe/wp-content/uploads/2025/09/2025-Wordmark-Logo.pngFracTracker Alliance2019-05-28 13:54:472021-04-15 14:56:31Who Pays? Health and Economic Impacts of Fracking in Pennsylvania
Designating a well as “idle” is a temporary solution for operators, but comes at a great economic and environmental cost to Californians
Idle wells are oil and gas wells which are not in use for production, injection, or other purposes, but also have not been permanently sealed. During a well’s productive phase, it is pumping and producing oil and/or natural gas which profit its operators, such as Exxon, Shell, or California Resources Corporation. When the formations of underground oil pools have been drained, production of oil and gas decreases. Certain techniques such as hydraulic fracturing may be used to stimulate additional production, but at some point operators decide a well is no longer economically sound to produce oil or gas. Operators are supposed to retire the wells by filling the well-bores with cement to permanently seal the well, a process called “plugging.”
A second, impermanent option is for operators to forego plugging the well to a later date and designate the well as idle. Instead of plugging a well, operators cap the well. Capping a well is much cheaper than plugging a well and wells can be capped and left “idle” for indefinite amounts of time.
Well plugging
Unplugged wells can leak explosive gases into neighborhoods and leach toxic fluids into drinking waters. Plugging a well helps protect groundwater and air quality, and prevents greenhouse gasses from escaping and expediting climate change. Therefore it’s important that idle wells are plugged.
Wells are left idle for two main reasons: either the cost of plugging is prohibitive, or there may be potential for future extraction when oil and gas prices will fetch a higher profit margin. While idle wells are touted by industry as assets, they are in fact liabilities. Idle wells are often dumped to smaller or questionable operators.
Orphaned wells
Wells that have passed their production phase can also be “orphaned.” In some cases, it is possible that the owner and operator may be dead! Or, as often happens, the smaller operators go out of business with no money left over to plug their wells or resume pumping. When idle wells are orphaned from their operators, the state becomes responsible for the proper plugging and abandonment.
The cost to plug a well can be prohibitively high for small operators. If the operators (who profited from the well) don’t plug it, the costs are externalized to states, and therefore, the public. For example, the state of California plugged two wells in the Echo Park neighborhood of Los Angeles at a cost of over $1 million. The costs are much higher in urban areas than, say, the farmland and oilfields of the Central Valley.
Since 1977, California has permanently sealed about 1,400 orphan wells at a cost of $29.5 million, according to reports by the Division of Oil, Gas, and Geothermal Resources (DOGGR). That’s an average cost of about $21,000 per well, not accounting for inflation. From 2002-2018, DOGGR plugged about 600 wells at a cost of $18.6 million; an average cost of about $31,000.
The map above shows the locations of idle wells in California. There are 29,515 wells listed as idle and 122,467 plugged or buried wells as of the most recent DOGGR data, downloaded 3/20/19. There are a total of 245,116 oil and gas wells in the state, including active, idle, new (permitted) or plugged.
Of the over 29,000 wells are listed as idle, only 3,088 (10.4%) reported production in 2018. Operators recovered 338,201 barrels of oil and 178,871 cubic feet of gas from them in 2018. Operators injected 1,550,436,085 gallons of water/steam into idle injection wells in 2018, and 137,908,884 cubic feet of gas.
The tables below (Tables 1-3) provide the rankings for idle well counts by operator, oil field, and county (respectively). Chevron, Aera, Shell, and California Resources Corporation have the most idle wells. The majority of the Chevron idle wells are located in the Midway Sunset Field. Well over half of all idle wells are located in Kern County.
Table 1. Idle Well Counts by Operator
Operator Name
Idle Well Count
1
Chevron U.S.A. Inc.
6,292
2
Aera Energy LLC
5,811
3
California Resources Production Corporation
3,708
4
California Resources Elk Hills, LLC
2,016
5
Berry Petroleum Company, LLC
1,129
6
E & B Natural Resources Management Corporation
991
7
Sentinel Peak Resources California LLC
842
8
HVI Cat Canyon, Inc.
534
9
Seneca Resources Company, LLC
349
10
Crimson Resource Management Corp.
333
Table 2. Idle Well Counts by Oil Field
Oil Field
Count by Field
1
Midway-Sunset
5,333
2
Unspecified
2,385
3
Kern River
2,217
4
Belridge, South
2,075
5
Coalinga
1,729
6
Elk Hills
958
7
Buena Vista
887
8
Lost Hills
731
9
Cymric
721
10
Cat Canyon
661
Table 3. Idle Well Counts by County
County
Count by County
1
Kern
17,276
2
Los Angeles
3,217
3
Fresno
2,296
4
Ventura
2,022
5
Santa Barbara
1,336
6
Orange
752
7
Monterey
399
8
Kings
212
9
San Luis Obispo
202
10
Sutter
191
Risks
According to the Western States Petroleum Association (WSPA) the count of idle wells in California has increased from just over 20,000 idle wells in 2015 to nearly 30,000 wells in 2018! That’s an increase of nearly 50% in just 3 years!
A U.S. EPA report on idle wells published in 2011 warned that existing monitoring requirements of idle wells in California was “not consistent with adequate protection” of underground sources of drinking water. Idle wells may have leaks and damage that go unnoticed for years, according to an assessment by the state Department of Conservation (DOC). The California Council on Science and Technology is actively researching this and many other issues associated with idle and orphaned wells. The published report will include policy recommendations considering the determined risks. The report will determine the following:
State liability for the plugging and abandoning of deserted and orphaned wells and decommissioning facilities attendant to such wells
Assessment of costs associated with plugging and abandoning deserted and orphaned wells and decommissioning facilities attendant to such wells
Exploration of mechanisms to ameliorate plugging, abandoning, and decommissioning burdens on the state, including examples from other regions and questions for policy makers to consider based on state policies
Current regulation
As of 2018, new CA legislation is in effect to incentivize operators to properly plug and abandon their stocks of idle wells. In California, idle wells are defined as wells that have not had a 6-month continuous period of production over a 2-year period (previously a 5-year period). The new regulations require operators to pay idle well fees. The fees also contribute towards the plugging and proper abandonment of California’s existing stock of orphaned wells. The new fees are meant to act as bonds to cover the cost of plugging wells, but the fees are far too low:
$150 for each well that has been idle for 3 years or longer, but less than 8 years
$300 for each well that has been idle for 8 years or longer, but less than 15 years
$750 for each well that has been idle for 15 years or longer, but less than 20 years
$1,500 for each well that has been idle for 20 years or longer
Operators are also allowed to forego idle well fees if they institute long-term idle well management and elimination plans. These management plans require operators to plug a certain number of idle wells each year.
In February 2019, State Assembly member Chris Holden introduced an idle oil well emissions reporting bill. Assembly bill 1328 requires operators to monitor idle and abandoned wells for leaks. Operators are also required to report hydrocarbon emission leaks discovered during the well plugging process. The collected results will then be reported publicly by the CA Department of Conservation. According to Holden, “Assembly Bill 1328 will help solve a critical knowledge gap associated with aging oil and gas infrastructure in California.”
While the majority of idle wells are located in Kern County, many are also located in California’s South Coast region. Due to the long history and high density of wells in the Los Angeles, the city has additional regulations. City rules indicate that oil wells left idle for over one year must be shut down or reactivated within a month after the city fire chief tells them to do so.
Who is responsible?
All of California’s wells, from Kern County to three miles offshore, on private and public lands, are managed by DOGGR, a division of the state’s Department of Conservation. Responsibilities include establishing and enforcing the requirements and procedures for permitting wells, managing drilling and production, and at the end of a well’s lifecycle, plugging and “abandoning” it.
To help ensure operator liability for the entire lifetime of a well, bonds or well fees are required in most states. In 2018, California updated the bonding requirements for newly permitted oil and gas wells. These fees are in addition to the aforementioned idle well fees. Operators have the option of paying a blanket bond or a bond amount per well. In 2018, these fees raised $4.3 million.
Individual well fees:
Wells less than 10,000 feet deep: $10,000
Wells more than 10,000 feet deep: $25,000
Blanket fees:
Less than 50 wells: $200,000
50 to 500 wells: $400,000
500 to 10,000 wells: $2,000,000
Over 10,000 wells: $3,000,000
With an average cost of at least $31,000 to plug a well, California’s new bonding requirements are still insufficient. Neither the updated individual nor blanket fees provide even half the cost required to plug a typical well.
Conclusions
Strategies for the managed decline of the fossil fuel industry are necessary to make the proposal a reality. Requiring the industry operators to shut down, plug and properly abandon wells is a step in the right direction, but California’s new bonding and idle well fees are far too low to cover the cost of orphan wells or to encourage the plugging of idle wells. Additionally, it must be stated that even properly abandoned wells have a legacy of causing groundwater contamination and leaking greenhouse gases such as methane and other toxic VOCs into the atmosphere.
By Kyle Ferrar, Western Program Coordinator, FracTracker Alliance
https://www.fractracker.org/a5ej20sjfwe/wp-content/uploads/2019/03/IdleWellsHathaway_resize.jpg400900Kyle Ferrar, MPHhttps://www.fractracker.org/a5ej20sjfwe/wp-content/uploads/2025/09/2025-Wordmark-Logo.pngKyle Ferrar, MPH2019-04-03 11:30:582021-04-15 14:56:34Idle Wells are a Major Risk
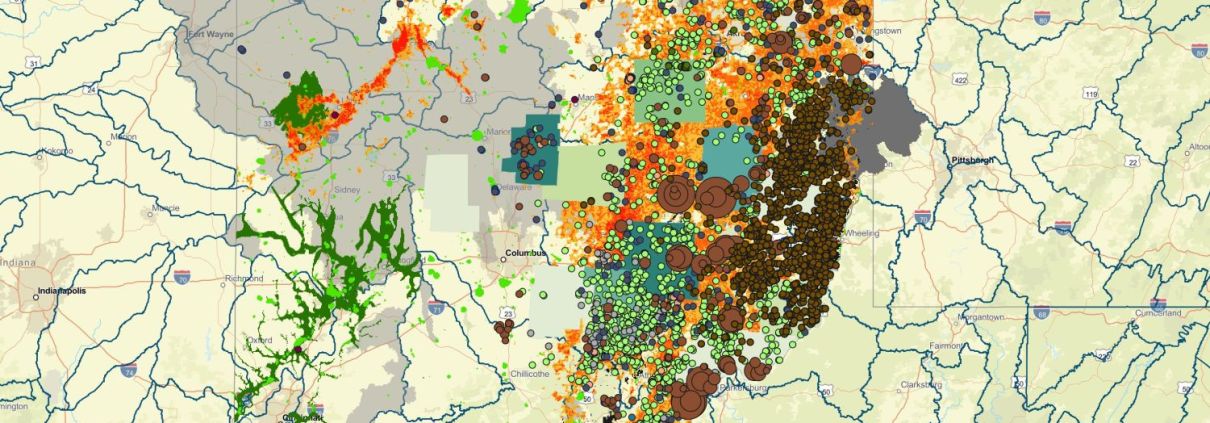
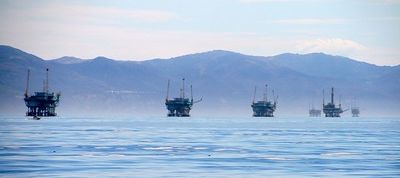
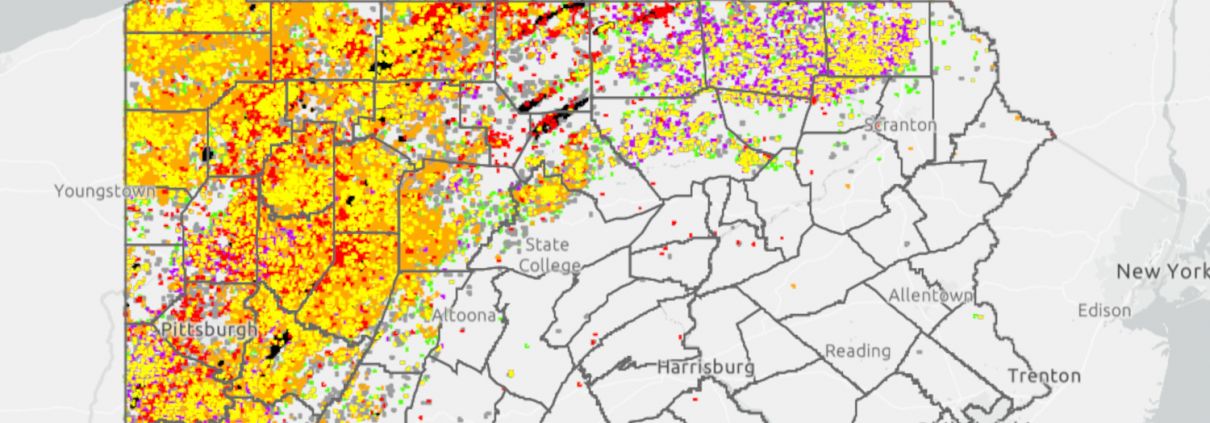
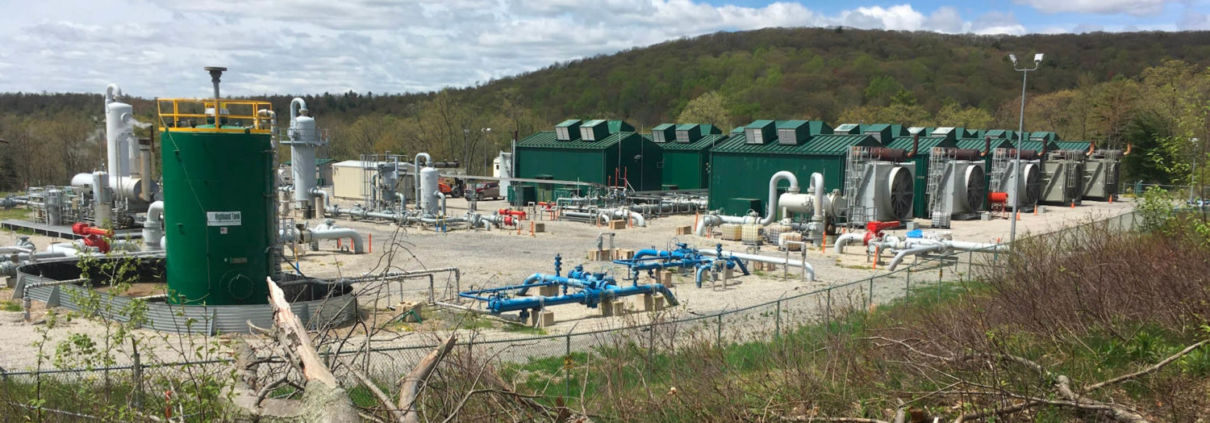
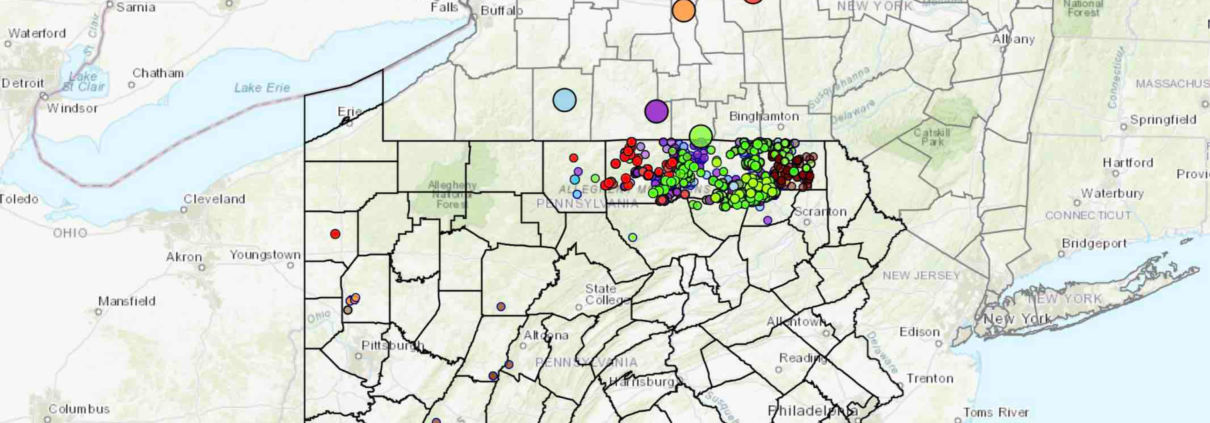
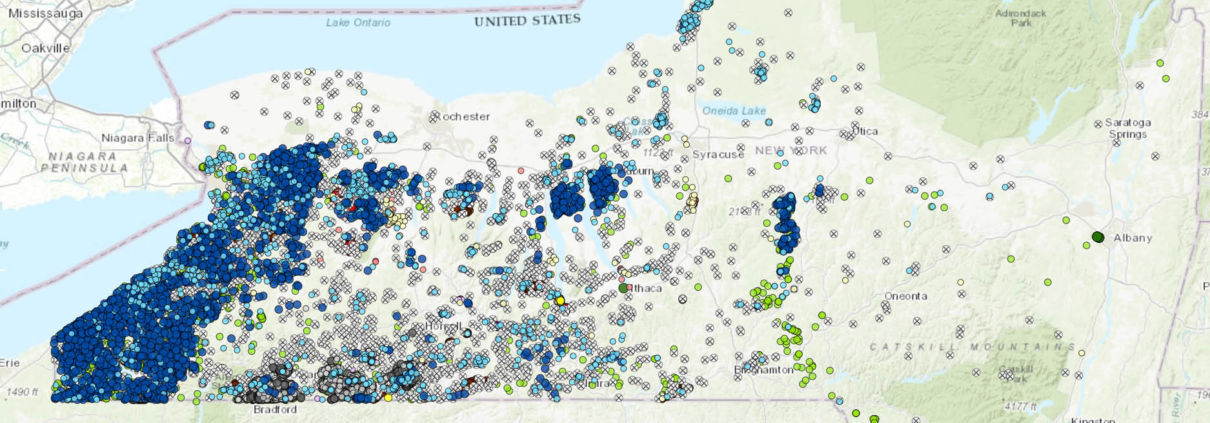
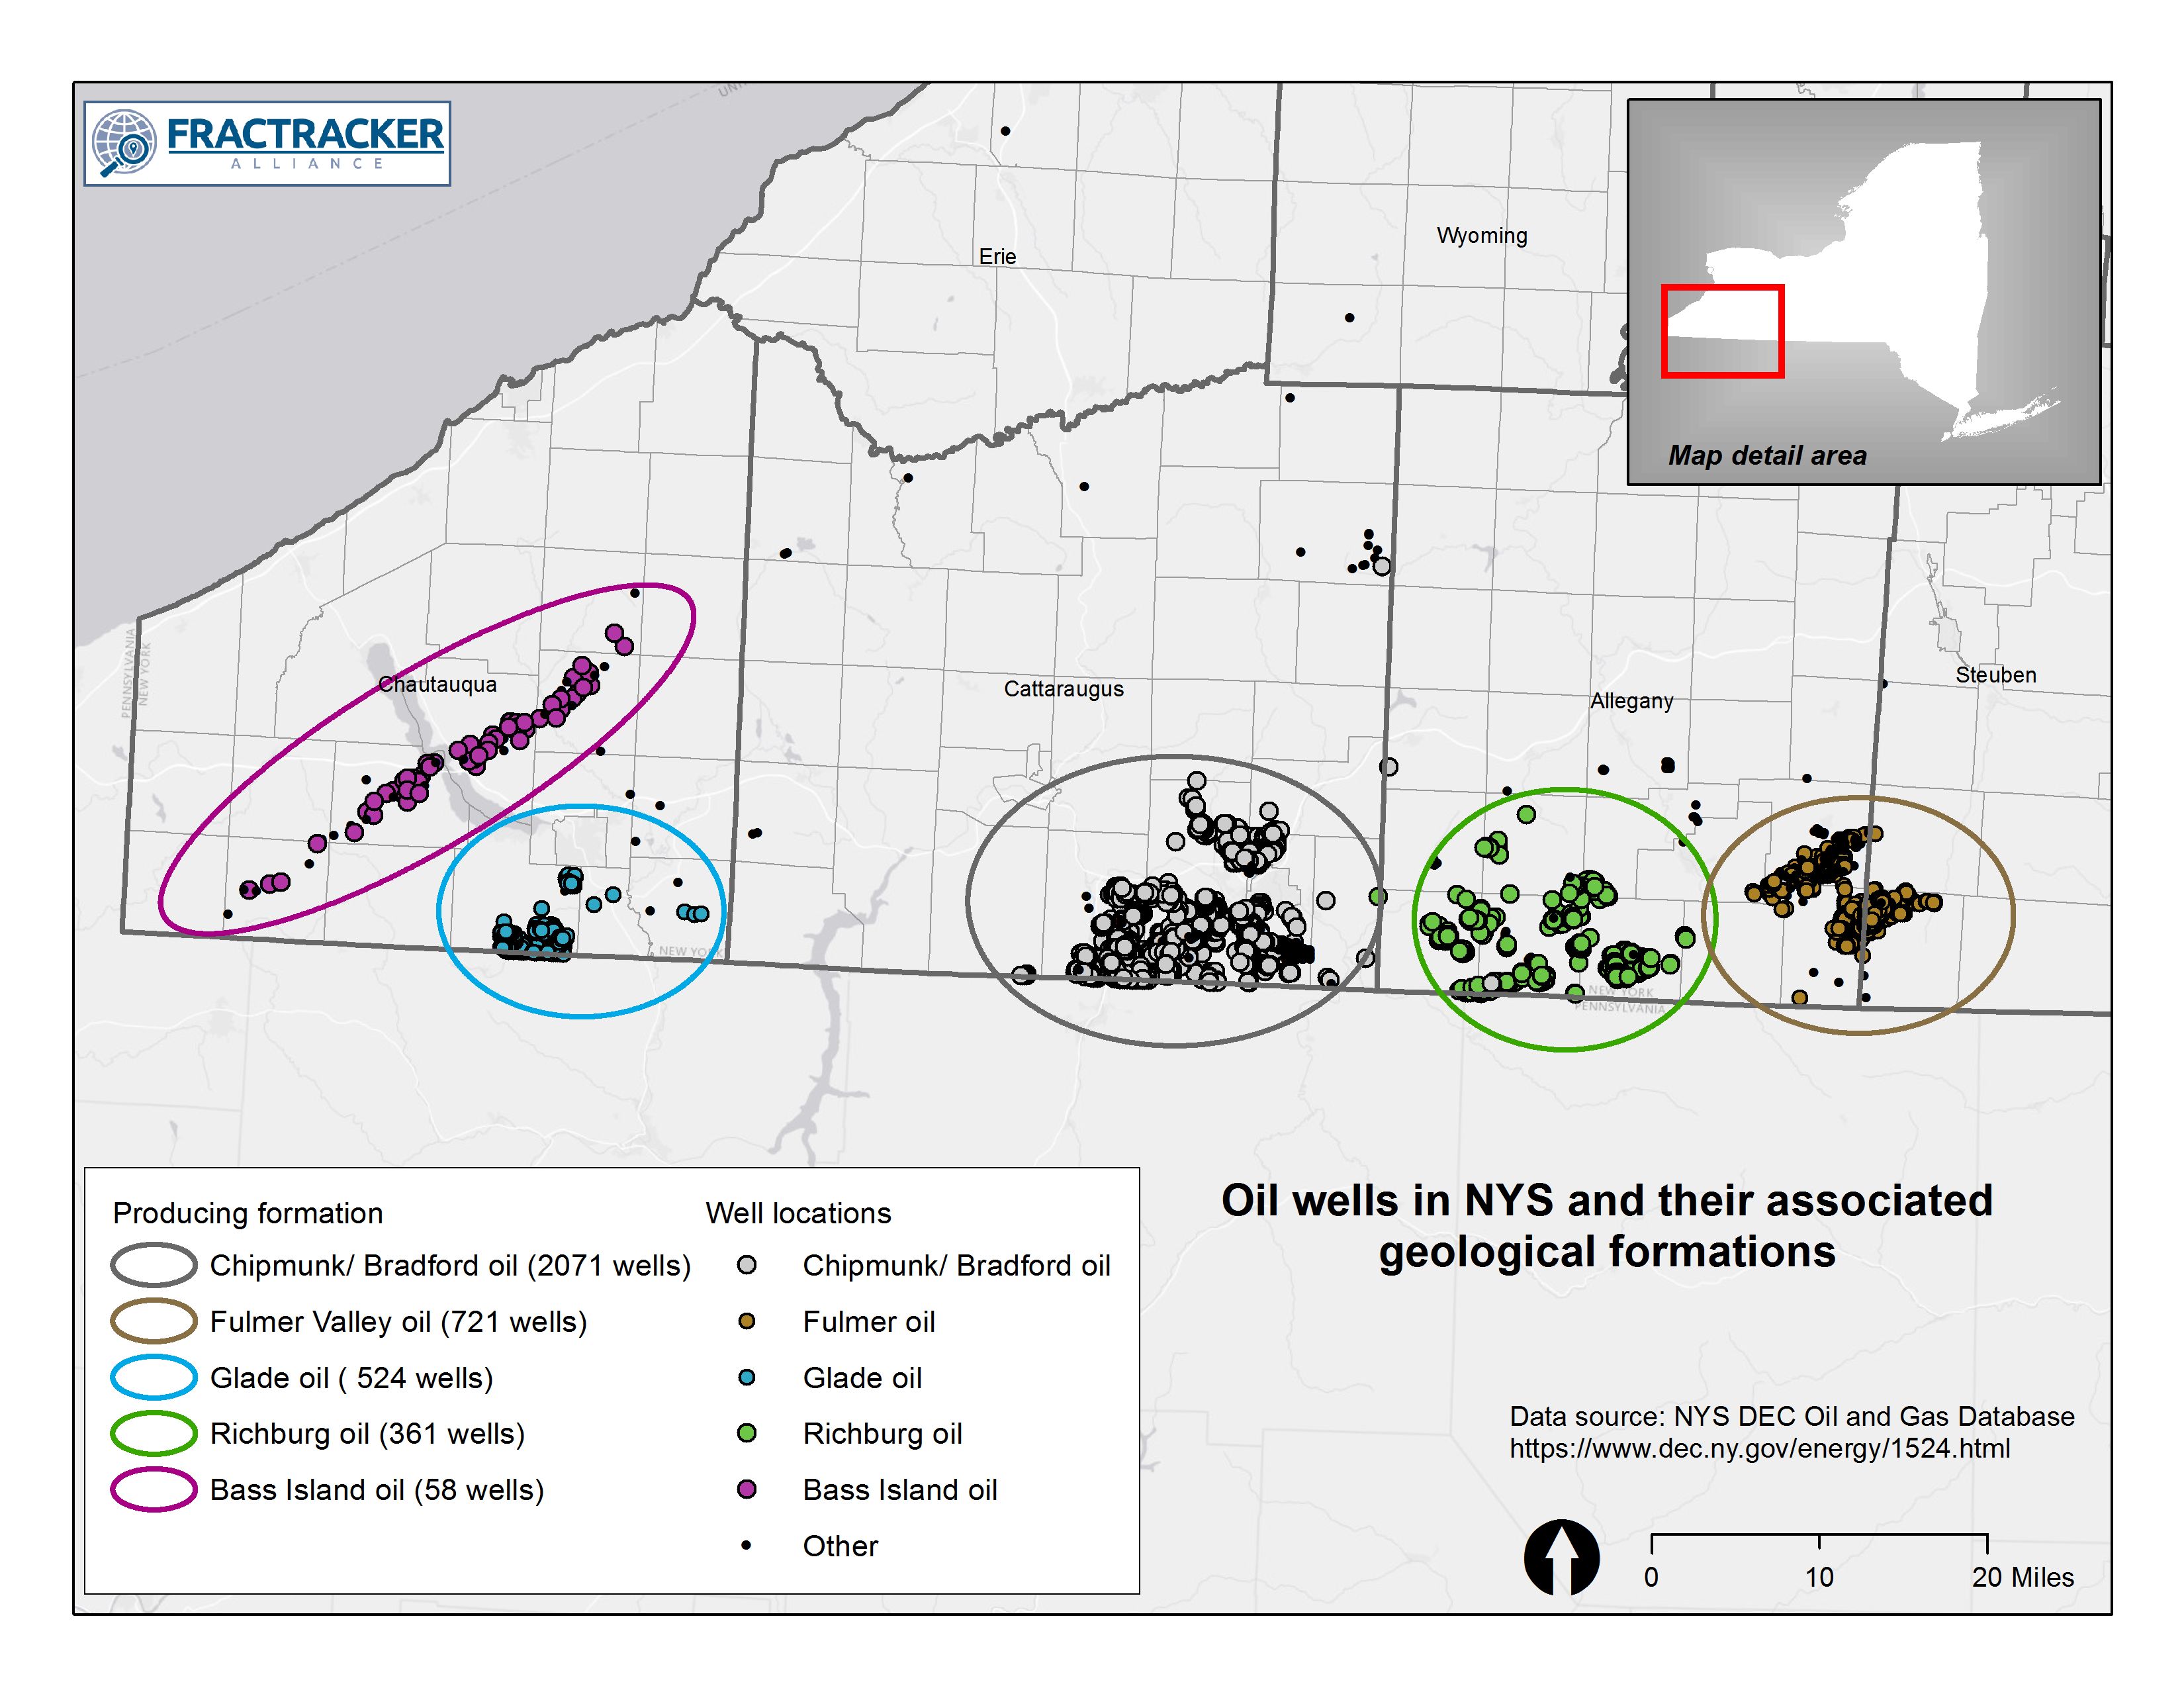 Figure 1. Oil Wells in NYS and Their Associated Geological Formations. Gas wells have historically been most productive in the Medina Formation, followed by the Queenston, and also Trenton-Black River Formations.
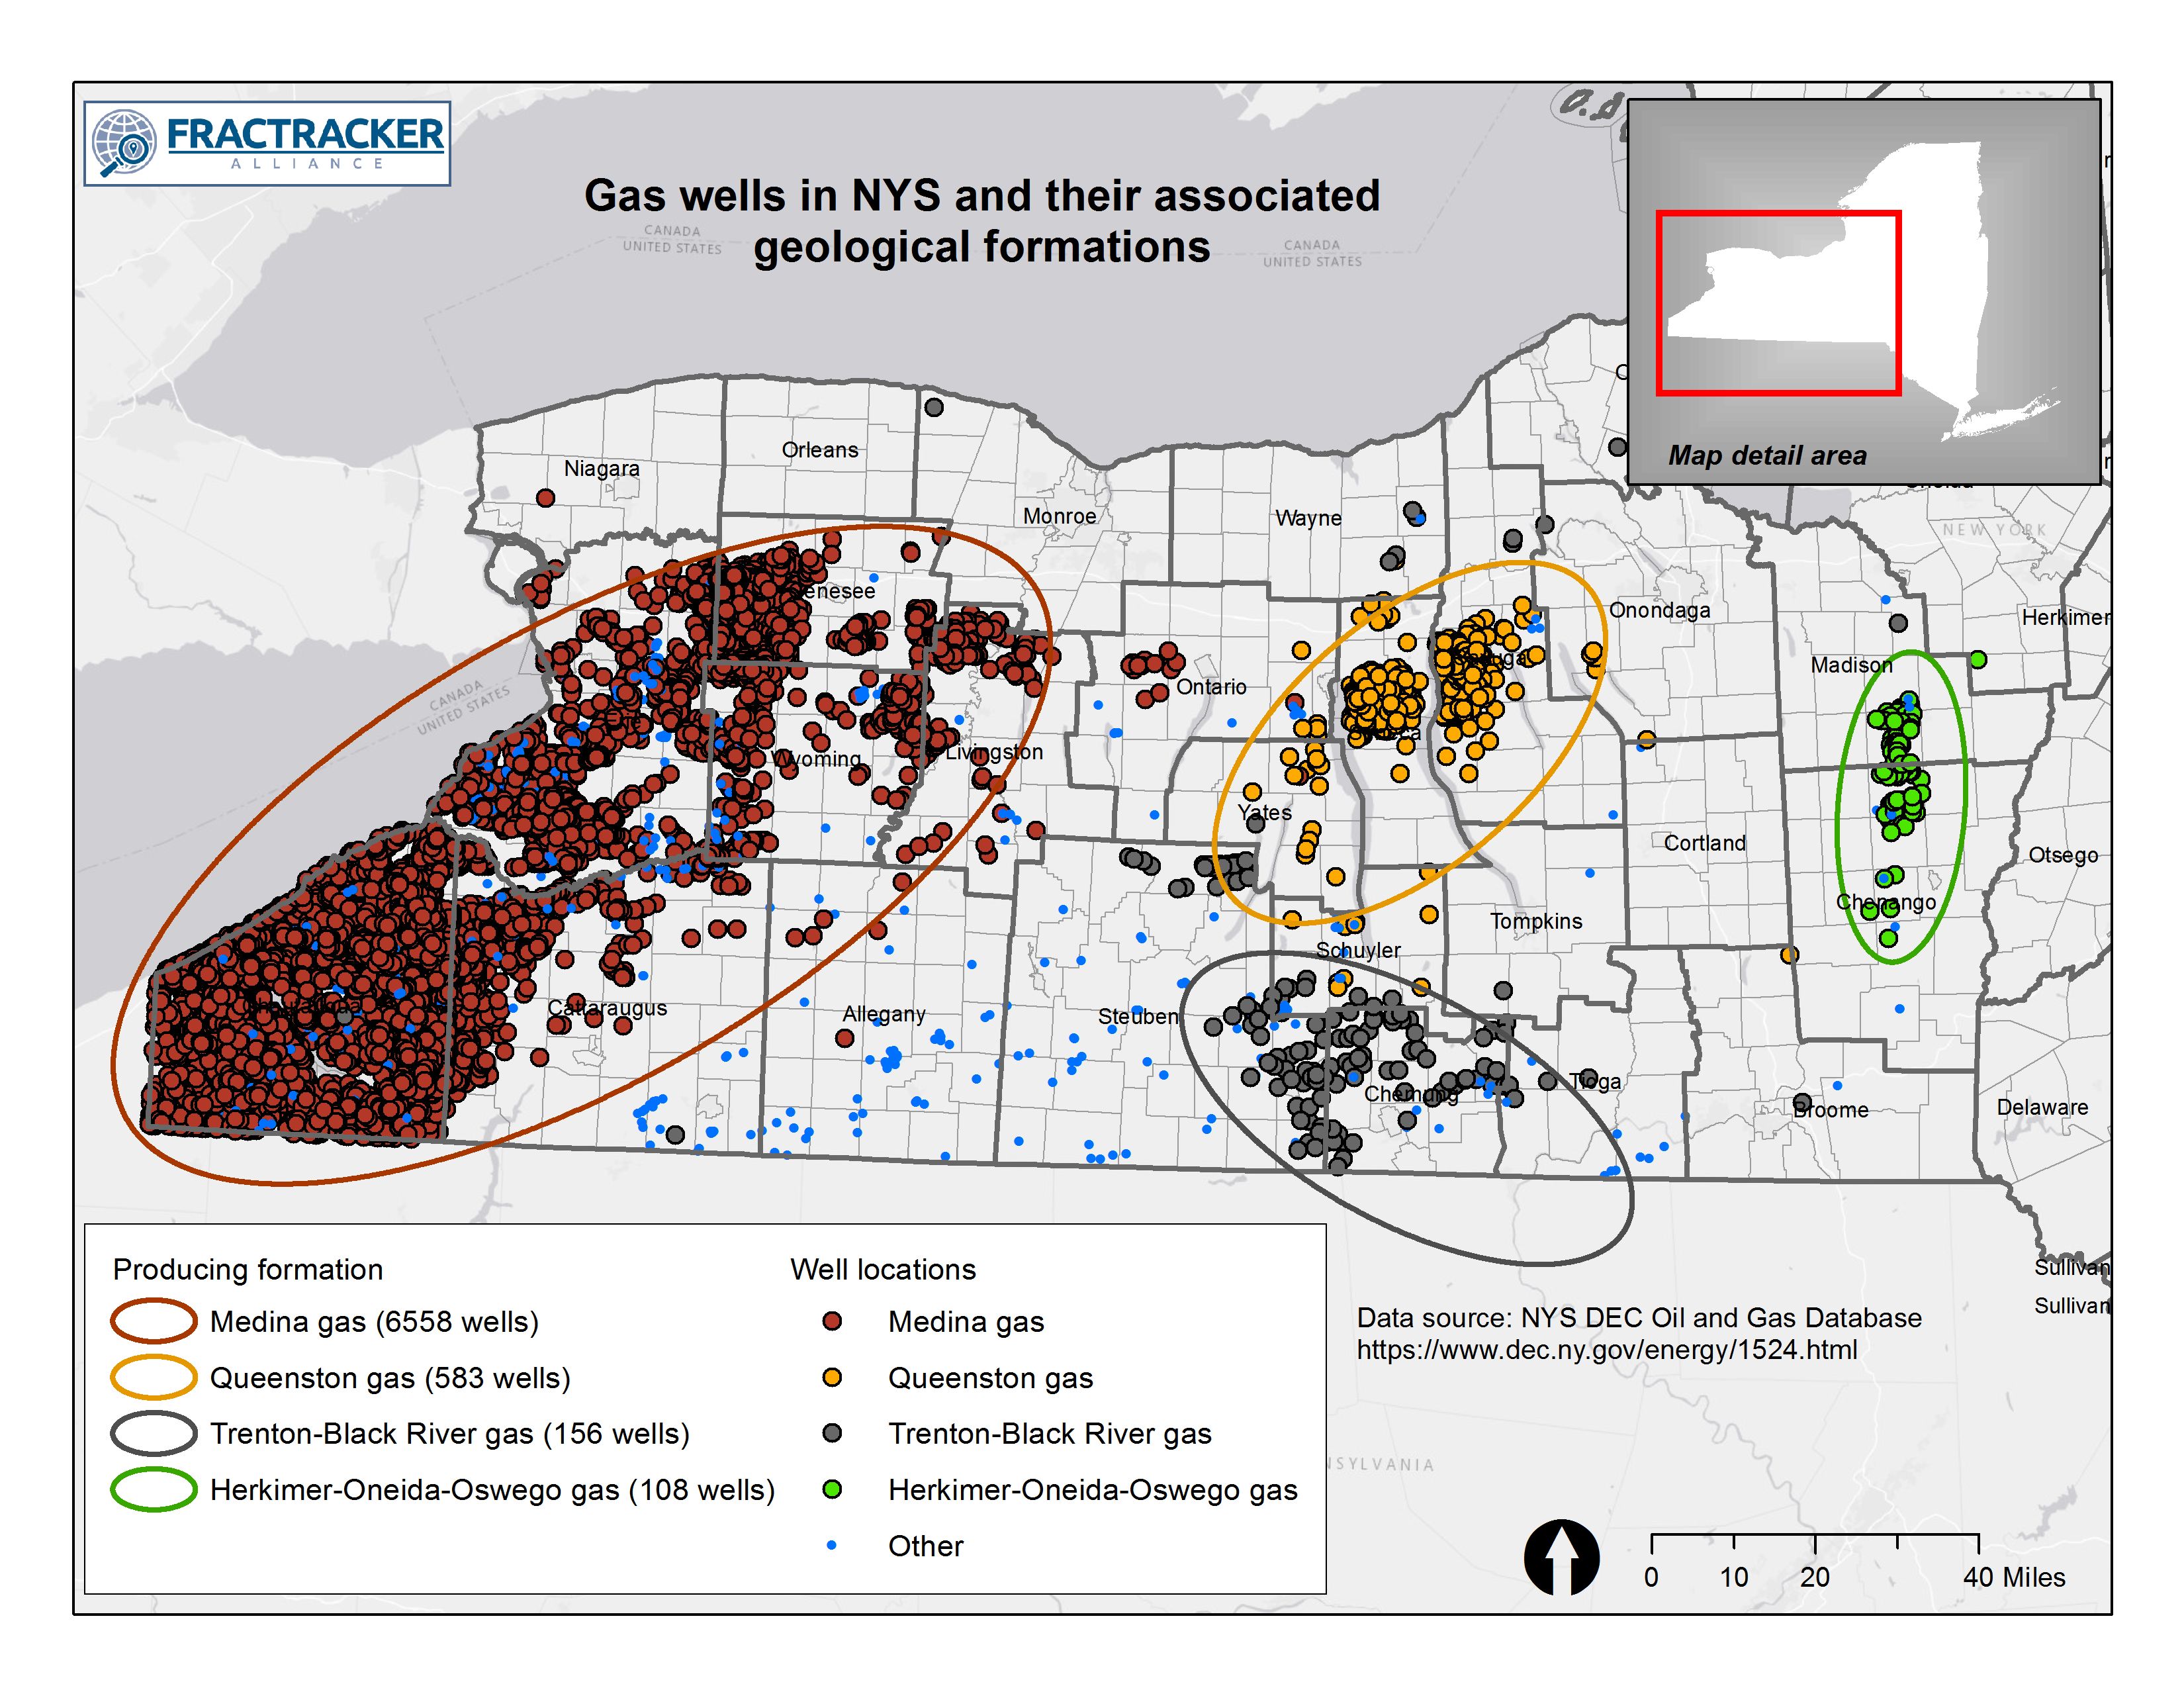
 FracTracker Alliance, 2021