We live in a complex environment of local, regional, national, and international issues. We are constantly bombarded with a news cycle that regenerates at increasingly dizzying speeds. How can we possibly know what is truly important when hyped up twitter controversies clog up our news feeds?
In this quantity-over-quality culture, many of the most important issues and fights for civil rights and energy justice become casualties of a regression to ignorance.
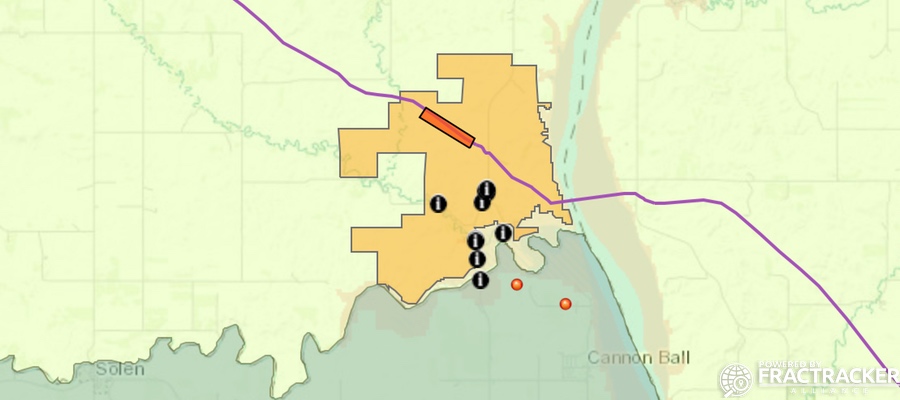
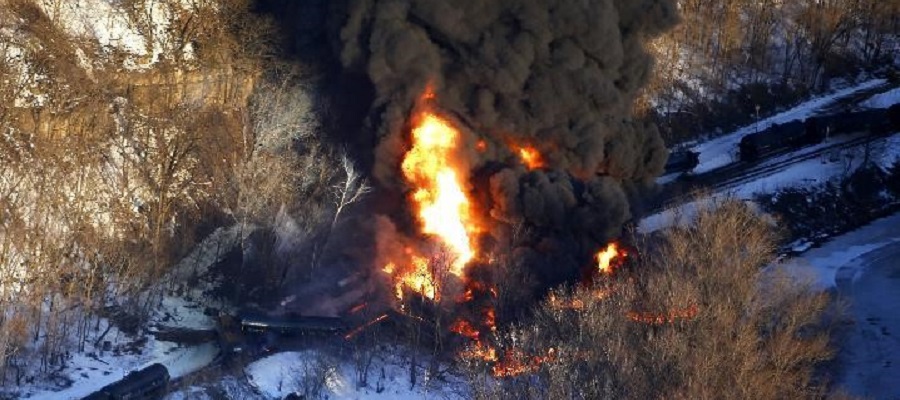
At FracTracker, we disagree with this tactic – especially as it relates to the protests at Standing Rock. FracTracker has previously written about these demonstrations (shown in the map above), and has also analyzed and mapped data on oil spills from pipelines in North Dakota. We will continue FracTracker’s coverage of Standing Rock and the Water Protectors who fought – and continue to fight – the Dakota Access Pipeline (DAPL), known as the Black Snake.
Following the Fight
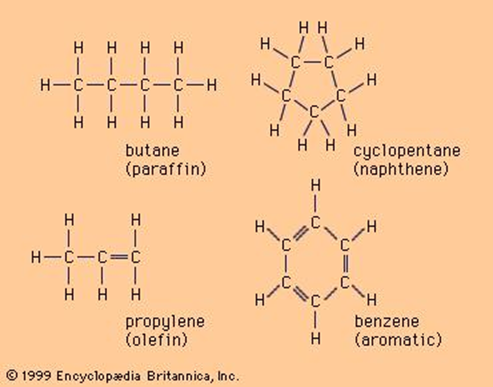
For those unaware, the fight against the Dakota Access Pipeline operated by Energy Transfer Partners, continues. While the project was green-lighted by the Trump Administration and Bakken oil began flowing in June of 2017, the court has returned the permits to the U.S. Army Corps of Engineers. A U.S. District Court judge ruled that the initial approval of the pipeline did not undergo adequate study of its environmental consequences. The finding stated that the Army Corps provided a flawed model, inadequate for predicting the full impacts of a leak under Lake Oahe. The model does not consider what would happen in the event of a leak under the lake. It models only benzene — one of many toxic chemicals present in crude oil — and models its movement in an unrealistic manner. Energy Transfer Partners claims the model is conservative, but it massively underestimates the potential impacts on human health and wildlife. The Army Corps provides no plan to contain an underground leak or clean contaminated soil and groundwater under Lake Oahe.
On a related note, DAPL’s parent company, Energy Transfer Partners, said in a recent annual report that it may not have sufficient liquid assets to finance a major cleanup project and would likely pass those costs onto local landowners and federal taxpayers. Energy Transfer Partners has since filed a racketeering lawsuit seeking $300 million in damages from the Red Warrior Camp at Standing Rock.
… the agency could simply revise or update its environmental review and again conclude that no EIS (environmental impact statement) is required. If that happens, additional legal challenges are likely. The Tribe believes this court decision should trigger a full EIS, including consideration of route alternatives, just as the Obama administration proposed in December.
Normally, when a permit is issued in violation of the National Environmental Protection Act (NEPA), operations are suspended, which would have forced the DAPL to shut down while the review is conducted. Contrary to the usual protocol, on October 11, 2017 a federal judge ruled that the pipeline will remain operational pending the environmental review by the Army Corps. Standing Rock Sioux Chairman Dave Archambault II has said in a statement, however, “Just because the oil is flowing now doesn’t mean that it can’t be stopped.”
More Information and Resources
The Lakota People’s Law Project (LPLP) has been a resource to Lakota country – an area comprised of nine Indian reservation in North and South Dakota – since 2004. The LPLP supports a number of campaigns including divestment and energy justice, and has published several reports:
Special thanks to the Lakota People’s Law Project and Rachel Hallett-Ralston for the information provided.
In January of 2017, 76 Water Protectors including Chase Iron Eyes were arrested on land granted to the Standing Rock Lakota Sioux Tribe under the 1851 Treaty of Fort Laramie. Chase Iron Eyes, Lead Counsel of the Lakota People’s Law Project, has been charged with felony incitement to riot and misdemeanor criminal trespass. In the interview above, Chase Iron Eyes discusses his involvement with Standing Rock and the political pressures to make an example out of him. Read the Lakota People’s Law Project petition here.
By Kyle Ferrar, Western Program Coordinator, FracTracker Alliance
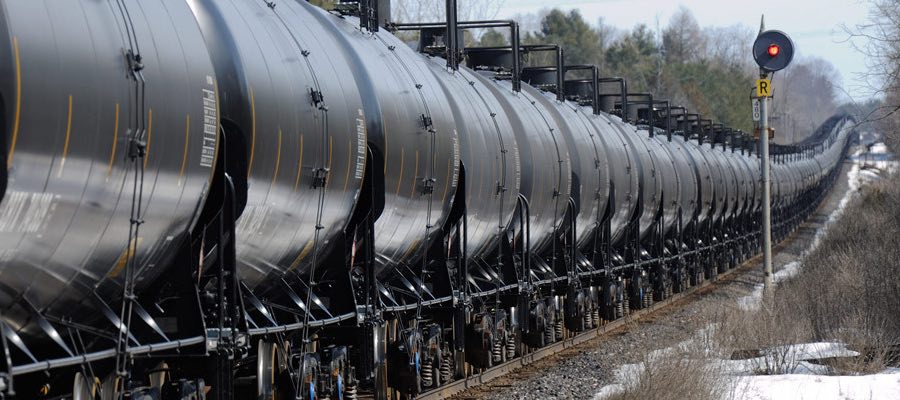
Pipelines are hailed as the “safest” way to transport crude oil and other refinery products, but federal and state data show that pipeline incidents are common and present major environmental and human health hazards. In light of current events that have green-lighted multiple new pipeline projects, including several that had been previously denied because of the environmental risk they pose, FracTracker Alliance is continuing to focus on pipeline issues.
In this article we look at the record of oil spills, particularly those resulting from pipeline incidents that have occurred in North Dakota, in order to determine the risk presented by the soon-to-be completed Dakota Access Pipeline.
Standing Rock & the DAPL Protest
To give readers a little history on this pipeline, demonstrators in North Dakota, as well as across the country, have been protesting a section of the Dakota Access Pipeline (DAPL) near the Standing Rock Sioux Tribe’s lands since April 2016. The tribe’s momentum has shifted the focus from protests at the build site to legal battles and a march on Washington DC. The pipeline section they are protesting has at this point been largely finished, and is slated to begin pumping oil by April 2017. This final section of pipe crosses under Lake Oahe, a large reservoir created on the Missouri River, just 1.5 miles north of the Standing Rock Sioux Tribal Lands. The tribe has condemned the pipeline because it cuts through sacred land and threatens their environmental and economic well-being by putting their only source for drinking water in jeopardy.
Pipelines
… supposedly safest form of transporting fossil fuels, but …
However, what makes one form of land transport safer than the others is dependent on which factor is being taken into account. When considering the costs of human death and property destruction, pipelines are indeed the safest form of land transportation. However, for the amount of oil spilled, pipelines are second-worst, beaten only by trucks. Now, when it comes to environmental impact, pipelines are the worst.
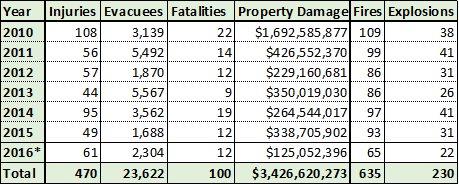
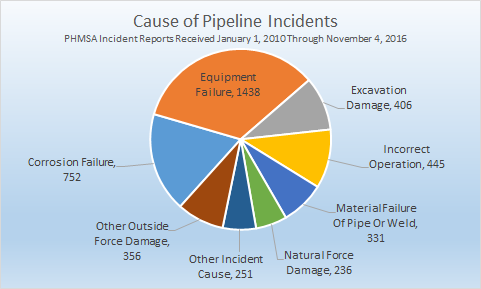
What is not debatable is the fact that pipelines are dangerous, regardless of factor. Between 2010 and October 2016 there was an average of 1.7 pipeline incidents per day across the U.S. according to data from the Pipeline and Hazardous Materials Safety Administration (PHMSA). These incidents have resulted in 100 reported fatalities, 470 injuries, and over $3.4 billion in property damage. More than half of these incidents were caused by equipment failure and corrosion (See Figures 1 and 2).
Figure 1. Impacts of pipeline incidents in the US. Data collected from PHMSA on November 4th, 2016 (data through September 2016). Original Analysis
Figure 2. Cause of pipeline incidents for all reports received from January 1, 2010 through November 4, 2016. Original Analysis
Recent Spills in North Dakota
To dig into the risks posed in North Dakota more specifically, let’s take a look at some spill data in the state.
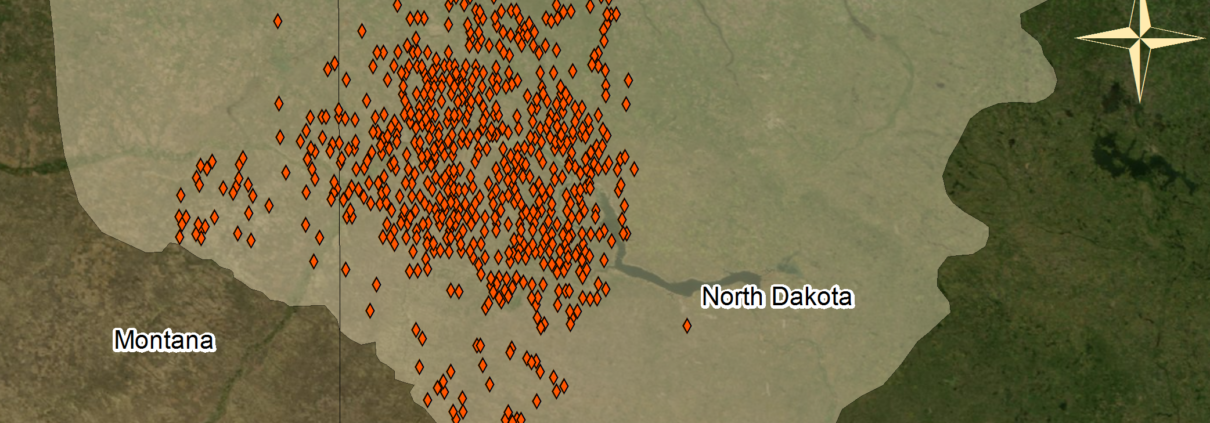
Map 1. Locations of Spills in North Dakota, with volume represented by size of markers
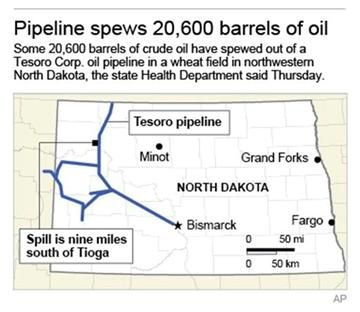
In North Dakota alone there have been 774 oil spill incidents between 2010 and September 2016, spilling an average of 5,131 gallons of oil per incident. The largest spill in North Dakota in recent history, and one of the largest onshore oil spills in the U.S., took place in September 2013. Over 865,000 gallons of crude oil spilled into a wheat field and contaminated about 13 acres. The spill was discovered several days later by the farmer who owns the field, and was not detected by remote monitors. The state claims that no water sources were contaminated and no wildlife were hurt. However, over three years of constant work later, only about one third of the spill has been recovered.
Below we have analyzed available spill data for North Dakota, including the location and quantity of such incidents.
North Dakota saw an average of 111 crude oil spills per year, or a total of 774 spills from 2010 to October 2016. The greatest number of spills occurred in 2014 with a total of 163. But 2013 had the largest spill with 865,200 gallons and also the highest total volume of oil spilled in one year of 1.3 million gallons. (Table 1)
Table 1. Data on all spills from 2010 through October 2016. Data taken from PHMSA and North Dakota.
2010
2011
2012
2013
2014
2015
Jan-Oct 2016
Number of Spills
55
80
77
126
163
117
156
Total Volume (gallons)
332,443
467,544
424,168
1,316,910
642,521
615,695
171,888
Ave. Volume/Spill (gallons)
6,044
5,844
5,509
10,452
3,942
5,262
1,102
Largest Spill (gallons)
158,928
106,050
58,758
865,200
33,600
105,000
64,863
The total volume of oil spilled from 2010 to October 2016 was nearly 4 million gallons, about 2.4 million of which was not contained. Most spills took place at wellheads, but the largest spills occurred along pipelines. (Table 2)
Table 2. Spills by Source. Data taken from PHMSA and North Dakota.
Wellhead
Vehicle Accident
Storage
Pipeline
Equipment
Uncontained
All Spills
Number of Spills
694
1
12
54
13
364
774
Total Volume (gallons)
2,603,652
84
17,010
1,281,798
68,623
2,394,591
3,971,169
Ave. Volume/Spill (gallons)
3,752
84
1,418
23,737
5,279
6,579
5,131
Largest Spill (gallons)
106,050
84
10,416
865,200
64,863
865,200
865,200
A. Sensitive Areas Impacted
5,875 square miles
Total Affected Areas (408 linear miles)
Spills that were not contained could potentially affect sensitive lands and waterways in North Dakota. Sensitive areas include Native American Reservations, waterways, drinking water aquifers, parks and wildlife habitat, and cities. Uncontained spill areas overlapped, and potentially contaminated, 5,875 square miles of land and water, and 408 miles of streams.
Drinking Water Aquifers – 2,482.3 total square miles:
Non-Community Aquifer – 0.3 square miles
Community Aquifer – 36 square miles of hydrologically connected aquifer
Surficial Aquifer – 2,446 square miles of hydrologically connected aquifer
A large area of potential drinking water (surficial aquifers) are at risk of contamination. Of the aquifers that are in use, aquifers for community use have larger areas that are potentially contaminated than those for non-community use.
Native American Tribal Reservation
Fort Berthold, an area of 1,569 square miles
Cities – 67 total square miles
Berthold
Dickinson
Flaxton
Harwood
Minot
Petersburg
Spring Brook
Stanley
West Fargo
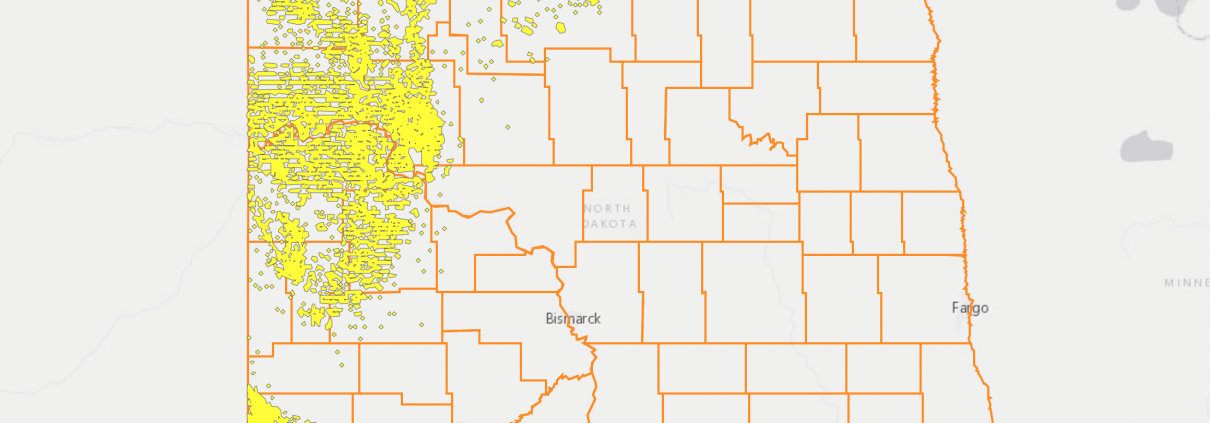
Map 2. Areas where Oil Spills Present Public Health Threats
Floodplains – 73 square miles of interconnected floodplains
Streams – 408 miles of interconnected streams
Of the 364 oil spills that have occurred since 2010, 229 (63%) were within 1/4 mile of a waterway
Of the 61 Uncontained Brine Spills that have occurred since 2001, 38 (63%) were within 1/4 mile of a waterway.
If a spill occurs in a floodplain during or before a flood and is uncontained, the flood waters could disperse the oil over a much larger area. Similarly, contaminated streams can carry oil into larger rivers and lakes. Explore Map 3 for more detail.
Using ArcGIS software, uncontained spill locations were overlaid on spatial datasets of floodplains, stream beds, groundwater regions, sensitive habitats, and other sensitive regions.
The average extent (distance) spilled oil traveled from uncontained spill sites was calculated to 400 meters. This distance was used as a buffer to approximate contact of waterways, floodplains, drinking water resources, habitat, etc. with uncontained oil spills.
https://www.fractracker.org/a5ej20sjfwe/wp-content/uploads/2017/04/OilSpill_12.16_crop.jpg400900Kyle Ferrar, MPHhttps://www.fractracker.org/a5ej20sjfwe/wp-content/uploads/2025/09/2025-Wordmark-Logo.pngKyle Ferrar, MPH2017-04-11 16:15:232021-04-15 15:03:11Oil Spills in North Dakota: What does DAPL mean for North Dakota’s future?
Over the past seven years, there has been a very strong upswing in domestic oil production coming from Bakken Formation in North Dakota. Extraction rates increased over 700% between November 2007 and November 2015, to over 1.2 million barrels per day. With all this oil coming out of the North Dakota oil fields, the challenge is how to get that oil to port, and to refineries. For the large part, the method of choice has been to move the oil by rail. Annual shipments out of North Dakota have jumped from 9500 carloads in 2008 to close to a half million carloads by 2013.
Nearly 25% of oil leaving the Bakken Formation is destined for east coast refineries located in New Jersey, Philadelphia, and Delaware. Trains carrying the crude enter New York State along two routes. A southern route, passes through Minneapolis, Chicago, Cleveland, and Buffalo, and on to Albany. A northern route, which originates in the oil fields of southern Manitoba and Saskatchewan Provinces in Canada, passes through Toronto, Montreal, and then south to Albany.
Currently, once the oil reaches Albany, it is transported south through the Hudson Valley, either by barge or by train. Two “unit trains” per day, each carrying 3 million gallons in 125-tank car trains, are bound for Philadelphia-area refineries. In addition, a barge per day, carrying 4 million gallons, heads to New Jersey refineries. Environmental groups in New York’s Hudson Valley, including Hudson RiverKeeper, have registered alarm and opposition about the potential impacts and risks of the transport of this process poses to the safety of residents of the Hudson Valley, and to the health of the Hudson River. More background information is available in this Pilgrim Pipelines 101 webinar.
What are the Pilgrim Pipelines?
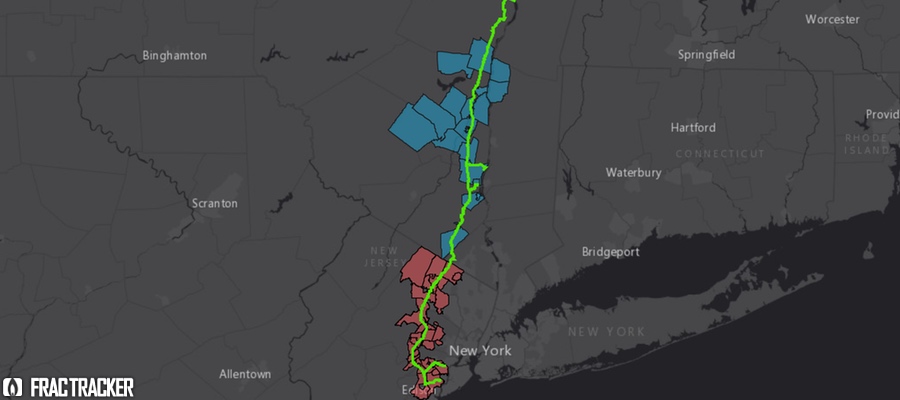
The proposed Pilgrim Pipelines are two parallel 18-24-inch pipelines that would run from the Port of Albany to Linden, NJ, alongside the New York State Thruway (I-87) for 170 miles just to the west of the Hudson River, with nearly 80% of the pipeline within the public right-of-way. The rest of the pipeline would traverse private property and some utility areas.
The pipeline running south from Albany would carry the light, explosive crude to refineries in NJ, Philadelphia, and Delaware. After the oil is refined, the North-bound pipeline would carry the oil back to Albany, moving 200,000 barrels (8.4 million gallons) of oil in each direction, every day. Touted by Pilgrim Pipeline Holdings, LLC as a central component in “stabilization of the East Coast oil infrastructure,” the project proposes to:
provide the Northeast region of the United States with a more stable supply of essential refined petroleum products… and… provide the region with a safer and more environmentally friendly method of transporting oil and petroleum products.
The Controversy
The Pilgrim company is lead by two individuals with deep ties to the energy industry. Both the company president, Errol B. Boyles, as well as vice-president, Roger L. Williams, were in the upper echelon management of Wichita, Kansas-based Koch Industries.
Proponents of the project claim that it includes environmental benefits, such as 20% lower greenhouse gas emissions than would be generated moving the same quantity of oil via barge, and even claim that the proposed Pilgrim Pipelines “will produce a net air quality benefit to the region.” Of course, this argument is predicated on the belief that the unbridled oil extraction from the Bakken Formation is both environmentally desirable, and nationally required.
Economic benefits described by the pipeline company include the faster rate the petroleum products can be pumped through existing terminals in New York, and also meet a hoped-for demand surge for petroleum products. Naturally, the company would also create some construction jobs (albeit somewhat temporary and for out-of-state firms), and increase fuel available to consumers at lower prices because of proposed transportation savings. However, the Albany Business Review indicated that the pipeline could actually create a net loss of jobs if the pipeline were to make the Port of Albany less active as a shipping location.
Project opponents cite both short- and long-term impacts of the project on human and environmental health, the local and regional economy, property values, nearly a dozen threatened and endangered wildlife species, water quality, ecology of the pristine Hudson Highlands Region, and contributions that the project invariably makes to accelerating climate change, both through local impacts, and as an infrastructure component supporting the extraction of crude from the East Coast all the way to the Bakken Fields of North Dakota. Groups also cite the high rate of “non-technical” pipeline failures, due to excavation damage, natural force damage, and incorrect operation.
Communities in Action
Close to 60 municipalities along the pipeline route have passed local resolutions and ordinances expressing their opposition to the pipeline. Residents assert that the local communities would bear most of the risks, and few, if any, of the benefits associated with the Pilgrim Pipeline. These communities, represented by over a million people in New York and New Jersey, are shown in the map below. Other groups – including the New Jersey State Assembly and Senate, numerous county boards in both New York and New Jersey, and several school districts – have also passed resolutions opposing the project.
Access links to the resolution documents for individual towns by clicking on the town location in the map below.
The New York State Thruway Authority was initially the sole lead agency on the State Environmental Quality Review (SEQR) of the project, a decision that was decried by impacted municipalities, environmental groups, and the Ramapough Lenape Nation. Dwain Perry, Ramapough Lenape chief, urged that the New York State Department of Environmental Conservation be the lead agency, instead, saying:
…DEC has a much more thorough outlook into different things that can happen….[and]..is looking out for everyone’s interest.
However, in a development announced in late December 2015, the New York State Department of Environmental Conservation revealed that they, along with the NYS Thruway Authority, would jointly lead the environmental review of the project. This decision has perplexed many groups involved in the debate, and environmental groups such as Scenic Hudson, Environmental Advocates of New York, Hudson Riverkeeper, and Coalition Against the Pilgrim Pipeline expressed their dismay over this choice, and urged that the SEQR review address whether the project will be consistent with NY Governor Cuomo’s aggressive goals to reduce carbon emissions that are driving climate disruption.
DEC’s own guidelines advise against creating co-lead agencies in projects particularly because there is no prescribed process for resolution of disputes between two such agencies. Nonetheless, a DEC spokesperson, Sean Mahar, tried to assure critics that because the two lead agencies have “unique and distinct expertise” few problems would arise.
We’ll post updates as the project’s SEQR process gets underway.
By Randy Sargent, Carnegie Mellon CREATE Lab and Samantha Malone, FracTracker Alliance
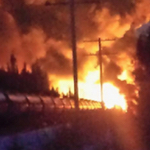
In the past two years, crude oil trains have exploded 10 times, killing 47 people.
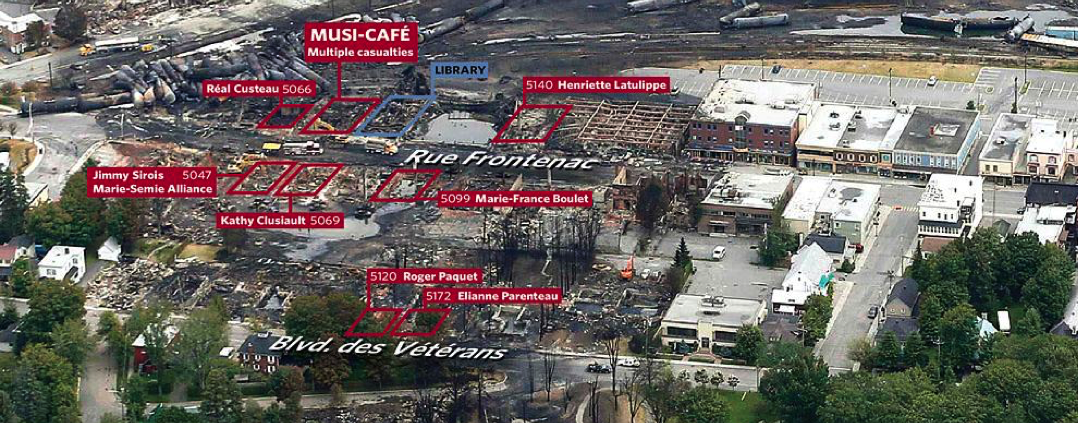
Lac-Mégantic, Quebec: 47 killed
Outside Plaster Rock, New Brunswick
Outside Casselton, ND
Outside Aliceville, AL
Outside Lynchburg, VA
Outside Mt. Carbon, WV
Outside Timmins, Ontario
Outside Galena, IL
Outside Heimdal, ND
Outside Gogama, Ontario
It could have been much worse. Eight of the ten trains exploded in rural areas. The train that flattened half the business district of the small town of Lac-Mégantic might have killed hundreds of people if it had exploded during business hours.[1] Residents in Philadelphia have dodged a bullet several times already; they’ve seen two oil train derailments there that fortunately did not explode. And last week’s Amtrak train derailment in Philadelphia that killed 8 people and injured more than 200 could have been much worse, had it impacted an oil train in that area.
Today we ship 17 times as much oil by rail as we did in 2010. This past year we shipped 14.5 billion gallons of oil — that’s 6,700 oil trains the size that destroyed Lac-Mégantic:
This chart above and the ones that follow are derived from the U.S. Energy Information Administration’s recently provided data tracking crude oil movements by rail.
Why do oil trains explode so easily?
Like a carbonated beverage with dissolved CO2, oil extracted from Bakken wells naturally has lighter hydrocarbons in it, such as methane, ethane, propane, and butane. Methane — natural gas — is the lightest of the gases and boils out quickly at surface pressure. But ethane, propane, and butanes, known as light ends or natural gas liquids in the oil industry, take time and/or heat to boil out.[2]
In the most prolific oilfield in the U.S. today, North Dakota’s Bakken formation, most of light ends are left in the oil before loading on the train, to maximize value of what is sent to the refinery. But much like a soda bottle, the pressure increases with temperature and motion, with pressurized ethane, propane, and butane at the top. With those highly volatile gases under pressure, all it takes to create an explosion is a leak and a spark, and both commonly happen in a derailment or collision.
All ten exploding crude trains carried oil from the Bakken.
Bakken trains travel through much of the US and Canada, heading to refineries on the coasts. Increasingly, they are traveling to East coast refineries, which now handle over half of Bakken crude oil production.
Closer to home for the authors, Pittsburgh is a popular waypoint for Bakken oil trains. Known for its steel industry in the 20th century, Pittsburgh continues to sport a large rail infrastructure. Its rails go through very densely populated areas, a good thing when the rails carried ore and steel and coal for the mills. But it’s a disaster waiting to happen now that the rails are bringing explosive oil trains through the city.
Oil and compressed gasses transit Carnegie Mellon University multiple times daily, Pittsburgh, PA
Oil trains travel across Pittsburgh’s North Shore and Downtown multiple times daily, as well
A significant and growing fraction of Bakken oil trains carrying 1 million gallons or more transit Pittsburgh, with ~30 a week based on Pennsylvania Emergency Management Agency data released for five days in October 2014. Prior to the disclosure, volunteers spent a day with us in 2014 recording traffic along one of several routes into the city to learn more about whether / how the trains might pose a risk to city residents and workers. Learn more about what we found here.
Why does this matter?
As crude-by-rail traffic continues to increase, it is only a matter of time before an oil train explodes in a populated area again. Imagine any of the 10 explosions so far taking place instead in downtown Philadelphia or Pittsburgh, or flattening a school in suburban Chicago, for example.
Map of Lac-Mégantic destruction from the Toronto Star’s article, Where they died. Click to explore the interactive map.
One attempt to make these trains safer, by requiring new tanker cars be built to a safer standard, does not appear to have helped; the most recent 5 exploding trains used the newest, “safer” tanker cars.
But there are effective measures that are in our power to take:
If you are concerned about these oil trains, please engage in the democratic process and tell your representatives and friends what you think. The Department of Transportation regulates interstate rail traffic. And local governments can be effective in rerouting traffic, as we’ve seen in St. Louis.
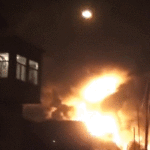
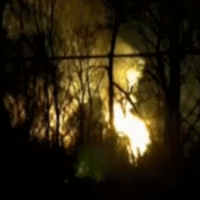
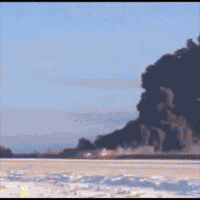
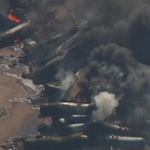
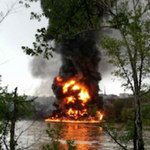
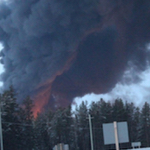
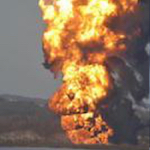
Throughout the U.S. more crude was spilled from rail incidents in 2013 than the prior four decades combined. Recently, in a period of three weeks, there were four* derailments of crude oil trains carrying Bakken and other Canadian crudes resulting in fire and explosions, with multiple cars rupturing and set ablaze.1 One of the most recent incidents occurred on March 5th in Galena, Illinois, just north of Chicago (video below). The fires resulting from crude derailments blaze so hot that emergency responders and firefighters are not able to get close enough to extinguish them. The only option is to let the fire burn out. This process can take days, during which local communities are subject to impaired air quality if not evacuated.2
*This number was revised 4/19/15.
Here we explore how regulators are responding to this public health risk and the new rules being put in place.
Oil Train Incidents Prior to August 2014
Derailments and accidents that occurred prior to August 1, 2014. Click here to view map fullscreen3
Regulatory Responses
Local Bakken Oil and Oil Train Resolutions
In response to these incidents and concerns, at least 50 cities and counties around the country have enacted or proposed resolutions regarding oil trains and Bakken oil. Some of these resolutions ask for direct action while others simply express concern publicly about the risks that the transportation of volatile crude oil by rail poses within their communities.
Resolutions Passed By Local Jurisdictions in California
While we have not collected all of these repossess, a good sample is shown below by state:
If any of the PDF’s linked to above do not load, refresh your browser.
Thank you to the many groups and individuals who have helped to compile this list above, such as Audubon Washington and Forest Ethics.
If you would like to recommend additions to this oil trains local actions list, please do so using the comment form at the bottom of this page.
Federal and National Responses
In an official request, the federal Department of Transportation ordered rail companies to provide the shipping details only to state emergency response officials. Due to the health and safety implications of crude by rail, groups like Earth Justice say the public has the right to know what is going through their backyards.4 The National Transportation Safety Board (NTSB) and a working group for the state of New York both found numerous deficiencies in the regulation of rail safety. The Working Group found that there are serious risks throughout the state from oil by rail in addition to significant gaps in local emergency response capabilities.5, 6
To reduce the actual intensity of these incidents, federal regulations establishing “vapor-pressure cap” rules go into effect this April. This specific regulation puts a limit on the amount of explosive gas allowed in the tanker cars. Crudes with greater amounts of short chain hydrocarbons are more volatile (lighter) and therefore more explosive. Bakken crude is considered “light” and “sweet” (more volatile short chain hydrocarbons) and therefore is more flammable/explosive than other crudes.7 Oil producers will have to measure the actual vapor pressure of the crude. The current practice is to calculate the vapor pressure using standards that are not specific enough for the lighter Bakken crude. Measuring the vapor pressure of each tank using an established protocol (i.e. regulatory standards) is therefore necessary to ensure an accurate knowledge of vapor pressure.8
The new standards for North Dakota crude will require operators to filter the crude in order to bring the vapor pressure down to 13.7 psi, a level comparable to the 13.5 psi standard for most automobile gasoline. The North Dakota Petroleum Council criticized the regulations, saying the explosive components of the Bakken crude are what give it such high value. NDPC also criticized the standards for temperature and pressure as being unnecessary.9 The recent West Virginia train that derailed and exploded would have violated this rule according to the testing conducted in North Dakota before departure. Crude involved in the Lac-Mégantic disaster was far below this standard, with an estimated vapor pressure of 9.3.10
Canadian Pacific Railway, the second largest rail company in Canada, wants the authority to refuse to haul crude oil and other hazardous materials due to liability concerns. This change would require an overhaul of the Canada Transportation Act that requires railways to haul any and all legal goods in rail cars that meet safety standards. The Board of Directors asked, “‘What kind of exposure do we have and what kind of exposure are we [exposing] the public to by hauling some of these commodities?” The U.S. railway BNSF, owned by Warren Buffet’s Berkshire Hathaway, has also protested against a similar U.S. federal regulation.11
Are the recent regulations enough?
The most destructive incident to-date was the Lac-Mégantic, Quebec derailment that killed 47 people on July 6, 2013. Following the Lac-Mégantic explosion, U.S. regulators issued an emergency directive that trains carrying hazardous materials could no longer be left unattended with the engines running unless they first received approval from the Federal Railroad Administration (FRA). The actual implementation of the rule only requires the railroad operators to prepare a plan for such activity and have it on file. There is no requirement for approval from the FRA.3
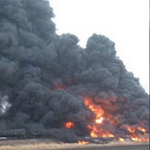
Other more substantive regulations are slowly coming into effect; for example, by 2017 the weaker DOT-111 oil tanker cars will be retired and all crude will be transported in safer Model CPC-1232 tank cars. Of note, however, is the fact that all five of these recent incidents have involved the safer, reinforced Model 1232 tank cars. A video of the recent derailment outside of Chicago can be seen below.
Galena, Illinois oil train derails with safer model CP-1232 tank cars that had been retrofitted with protective shields.
Data Transparency and Information
Not much detailed information is known publicly about the amount of crude being shipped by railway, the source of the crude, or which routes will be used, but research by the FracTracker Alliance has identified the expansion of crude shipments in communities throughout New York State. In the City of Buffalo, 33% of residents live within the ½ mile blast zone of a railway with crude oil tanker shipments, for example.12 Additional work by groups such as ours and Oil Change International has identified gaps in oversight that may not be possible for state or federal regulations to address. Because the nature of shipping by rail involves long distances and periods of time with infrequent cargo checks, any type of oil spill that goes immediately unnoticed may make it impossible to issue an effective response. Such is the case of a spill in Washington State, shown in the map below.12
In order to preserve the confidentiality of this information, the BNSF and other rail carriers have claimed trade secret exemptions to keep the information and data from being released to the public. The U.S. Department of Transportation has found the oil shipments by rail to “constitute an imminent hazard” and has required that carriers notify the State Emergency Response Commission (SERC) in each state that it operates trains transporting 1,000,000 gallons (23,809.5 barrels) or more of Bakken crude. This information has not been released to the public due to security concerns, however.13
References
Wikipedia. List of Rail Accidents. (http://en.wikipedia.org/wiki/List_of_rail_accidents_%282010%E2%80%93present%29#2015). Accessed 4/19/15.
Stern, Marcus; Jones, Sebastian. U.S. Crackdown on Oil Trains – Less Than Meets the Eye. 12/8/2014. Inside Climate News. Accessed 3/10/15.
Pipeline and Hazardous Materials Safety Administration. 2014. Operation Safe Delivery Update. U.S. Department of Transportation. Accessed 3/12/15.
Pichler, Hannes, and Josef Lutz. 2014. Why Crude Oil Vapor Pressure Should Be Tested Prior to Rail Transport. Advances in Petroleum Exploration and Development2.
S. DOT. 5/7/2014. Emergency Order. Docket No. DOT-OST-2014-0067. Accessed 3/10/15
https://www.fractracker.org/a5ej20sjfwe/wp-content/uploads/2015/03/galena_crude_derail_re1.jpg400900Kyle Ferrar, MPHhttps://www.fractracker.org/a5ej20sjfwe/wp-content/uploads/2025/09/2025-Wordmark-Logo.pngKyle Ferrar, MPH2015-03-25 10:00:052020-07-21 10:32:11Responses to the Rash of Oil Train Incidents
By Samir Lakhani, GIS Intern, FracTracker Alliance
In the hazy world of gas flaring and venting, finding worthwhile data often leads one to a dead end. Although the Energy Information Administration (EIA) holds the authority to require active oil/gas companies to disclose this data, they choose not to. EIA will not proceed with such actions because, “…assessing the volume of natural gas vented and flared would add significant reporting burdens to natural gas producers causing them substantial investments.” Additionally, the EIA is not confident that oil/gas producing companies have the capability to accurately estimate their own emissions from venting or flaring activities.
Piece-Meal
Some states do voluntarily submit their estimates, but only 8 of the nation’s 32 oil and gas producing states submit their data. This makes attempts for national estimates incomplete and inaccurate. State officials have repeatedly complained that the EIA has provided them with insufficient guidelines as to how the data should be submitted, and in what format. It appears the only way that concerned parties are able to monitor this practice is with satellite imagery from the sky, to literally watch flaring as it occurs.
Bird’s Eye View
The Bakken Shale Formation has received a considerable amount of attention. We’ve all seen the nighttime satellite images of North Dakota, where a normally quiet portion of the state light up like a bustling city. It is to be understood that not all the lights in this region are gas flares. Much of it is emergency lighting and temporary housing associated with drilling companies.
There are a few obvious issues with satellite surveillance. Firstly, it is difficult to monitor venting emissions from a bird’s eye perspective. Venting is the process by which unsought gas is purposely wafted from drill sites into the atmosphere. Venting is a much more environmentally costly decision compared to the ignited alternative, as pure natural gas is twenty times more potent than CO2 as a greenhouse gas. To monitor venting behavior, from up high, Infrared sensors must be used. Unfortunately, these emissions do not transmit well through the atmosphere. Proper detection must be made much closer to earth’s surface, perhaps from an airplane or on the ground. Secondly, flaring is almost impossible to detect during the day using satellites. One could equate it to attempting to see a flashlight’s beam when the sun is out. Lastly, when the time comes to churn out an estimate on how much gas is really being wasted—the statistics vary wildly.
Using SkyTruth’s satellite image, and GIS data retrieved from North Dakota’s Department of Mineral Resources, it is now possible to pinpoint North Dakota’s most active gas flaring sites. Using this, more accurate estimates are now within reach. North Dakota gas drillers may flare their “associated” gas for up to one year. However, Officials at Mineral Management Service claim that it is not difficult to get an extension, due to economic hardship. There are always instances of gas/oil operators flaring or venting without authorization. In 2003, Shell paid a 49 million dollar settlement over an unnoticed gas flaring and venting operation that lasted several years. The beauty of satellite imagery and GIS detail is the observer’s ability to pinpoint flaring operations and by referencing the leases, evaluate whether or not such practices were authorized.
This map shows flaring activity in the Bakken Formation from January 1 through June 30, 2013. Please click the “Fullscreen” icon in the upper right hand corner to access the full set of map controls.
Regulation and Control
If flaring and venting are costly to the environment and result in a loss of company product (methane), you may ask why these practices are still conducted. Flaring and venting practices are cheaper than building the infrastructure necessary to harness this energy, unfortunately. To effectively collect this resource, a serious piping network is needed. It is as if a solar farm has been built in the desert, but there is no grid to take this power to homes. To lay down piping is an expensive endeavor, and it requires continuous repairs and on-site monitors. Even when North Dakota burns over 30% of their usable product, there is little initiative to invest in long term savings. A second method, called “green completions”, is becoming a more popular choice for oil and gas companies. A green completion is a portable refinery and condensate tank aimed to recover more than half of excess methane produced from drilling. Green completions are the best management practice of today, and the EPA wishes to implement green completion technology nationwide by 2015.
The best way to estimate gas flare and venting emissions is through submissions from gas/oil companies and to analyze the data using GIS applications. Concerned organizations and citizens should not have to rely on satellite services to watch over the towering infernos. There is new research coming out each day on adverse health effects from living in close proximity to a gas flare and vent. It releases a corrosive mixture of chemicals, and returns to the earth as acid rain. Please refer to this publication for a thorough assessment of possible health effects.
This issue is not limited to US borders only; flaring has wreaked havoc in South America, Russia, Africa, and the Middle-East. During the extraction of oil, gas may return to the surface. In many of these areas where oil drilling is prevalent, there are no well-developed gas markets and pipeline infrastructure, which makes venting and flaring a more attractive way to dispose of an unintentionally extracted resource. If the US were to make substantial changes to the way we monitor, regulate, and reduce gas flaring/venting, and accessibility to data, we would set the standard on an international level. Such policy changes include: carbon taxation, streamlining the leasing process (Many oil/gas officials despise the leasing applications for pipelines), installing flaring/venting meters and controls, and tax incentives (to flare and green complete, rather than vent).
All of these changes would tremendously reduce and regulate gas flaring in the US, but without accurate and comprehensive data these proposed policies are meaningless. Data is, and forever will be, the diving board on which policy and change is founded.
Special thanks to Paul Woods and Yolandita Franklin of Skytruth, for using VIIRS and IR technologies to compile the data for the above map.
https://www.fractracker.org/a5ej20sjfwe/wp-content/uploads/2013/07/BakkenShaleMap2-e1459778822164.png9352084Guest Authorhttps://www.fractracker.org/a5ej20sjfwe/wp-content/uploads/2025/09/2025-Wordmark-Logo.pngGuest Author2013-07-18 14:31:102020-07-21 10:41:16Gas Flaring and Venting: Data Availability and New Methods for Oversight
A new North Dakota map is now available on FracTracker. It joins content from New York, Ohio, Pennsylvania, and West Virginia in our efforts to make data concerning mineral extraction from shale more accessible and understandable.
In this embedded view of the North Dakota map, users can pan and zoom. For full featured control, click the expanding arrows icon (top right of map) to access the map directly.
The area drawn in yellow in the western portion of the state is a generalized layer of activity for the Bakken formation. It was created to help with map performance and accuracy at scales ranging from statewide to 1:750,000, or about the size of a county. Once you zoom in beyond that level, the generalized layer goes away, and some interesting content becomes available.
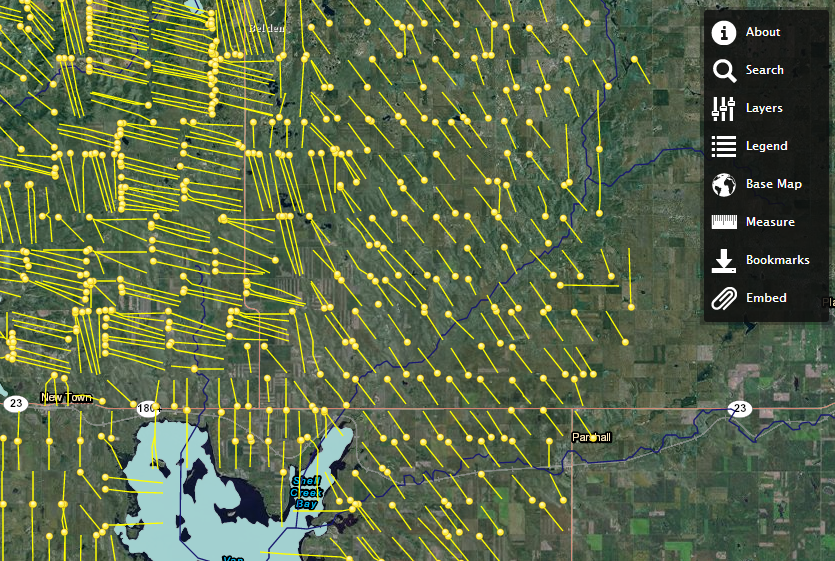
A screen capture of the North Dakota map
In the screen capture above, I zoomed in past 1:750,000, so the producing wells are visible, as well as a layer of horizontal laterals that are associated with the wells, a feature that few states make available. The location was chosen at random from the Bakken region, however, if you would like to see a similar view, click the “Search” tool and then type “New Town, ND” into the text box. I have also changed the basemap to show a satellite image by selecting “Imagery with Labels” from the base map selector.
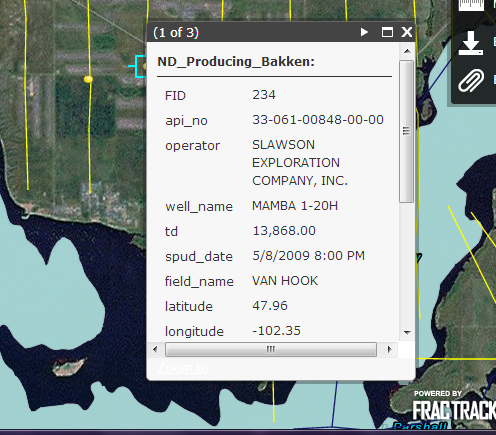
Close up of “Mamba 1-20H” well
Each feature, or item on the map, has different data associated with it. I’ve clicked on a well at random to bring up the data pop up box. Because the data is controlled at the state level, there are often substantial differences in the types of data that are available. In North Dakota, we can see the cumulative total of oil, gas, and waste water production by scrolling through these pop up boxes. Units of measure are not provided, but they are assumed to be barrels for oil and waste water, and thousands of cubic feet (Mcf) for gas.
At the very top of that box, there is a gray bar with the text “(1 of 3)”. This means that multiple features are selected. Viewers can scroll through them by clicking the arrow icon on the gray bar. Viewers can reduce the number of selected items by zooming in and making layers inactive. To change the layers, just click on “Layers” in the main toolbar, and click the checkboxes next to each layer to select or de-select the various available choices. Please recall that some layers are scale dependent, so they are not available at all times.
For more information about the Bakken formation and the layers available on the map, please click the “About” icon on the main toolbar.
https://www.fractracker.org/a5ej20sjfwe/wp-content/uploads/2013/07/ND-e1426882939461.png398900Matt Kelso, BAhttps://www.fractracker.org/a5ej20sjfwe/wp-content/uploads/2025/09/2025-Wordmark-Logo.pngMatt Kelso, BA2012-10-10 16:04:502020-07-21 10:40:36Exploring North Dakota’s Bakken Formation on FracMapper