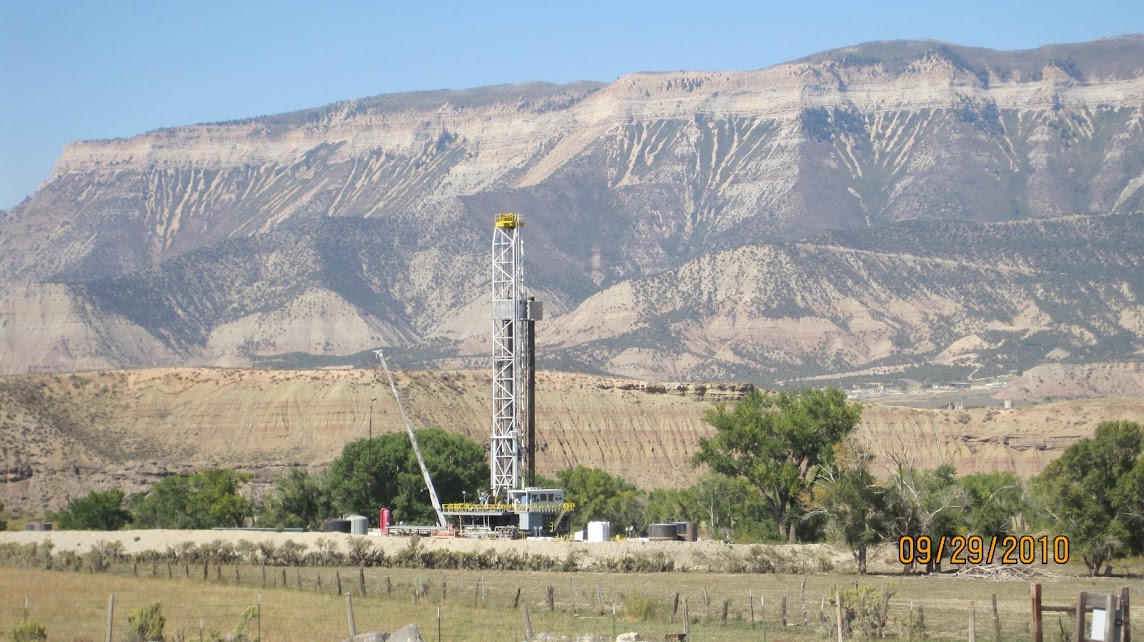
Since the release of a May 2025 report exposing widespread noncompliance with Colorado’s 2022 oil and gas chemical disclosure law, well-by-well oil and gas chemical disclosures have significantly increased, nearly doubling the total submitted since the law took effect under the state’s landmark transparency legislation.
https://www.fractracker.org/a5ej20sjfwe/wp-content/uploads/2013/12/Colorado.jpg6421144FracTracker Alliancehttps://www.fractracker.org/a5ej20sjfwe/wp-content/uploads/2025/09/2025-Wordmark-Logo.pngFracTracker Alliance2025-07-22 10:42:552025-07-23 11:06:23Colorado Operators Increase Chemical Disclosures After Public Pressure, but Major Gaps Remain
Communities in Colorado should be immediately informed of oil and gas spills that increase their health risks. Our analysis shows why public health alerts are particularly important for communities located near extraction operations.
https://www.fractracker.org/a5ej20sjfwe/wp-content/uploads/2024/03/ColoradoSpills_3.22.24.jpg11591500Kyle Ferrar, MPHhttps://www.fractracker.org/a5ej20sjfwe/wp-content/uploads/2025/09/2025-Wordmark-Logo.pngKyle Ferrar, MPH2024-03-25 16:57:102024-03-26 22:18:53Empowering Colorado Communities: The Importance of the Community Right to Know Act
A report by FracTracker Alliance finds Colorado’s oil and gas industry has produced enough wastewater statewide to completely satisfy the current and past needs of source water for hydraulic fracturing completions.
https://www.fractracker.org/a5ej20sjfwe/wp-content/uploads/2023/05/Colorado-Water-Use-5.2.23.jpg5891500Kyle Ferrar, MPHhttps://www.fractracker.org/a5ej20sjfwe/wp-content/uploads/2025/09/2025-Wordmark-Logo.pngKyle Ferrar, MPH2023-05-02 12:33:532026-04-23 15:43:28Evaluation of the Capacity for Water Recycling for Colorado Oil and Gas Extraction Operations
FracTracker Alliance has released a new national map, filled with energy and petrochemical data. Explore the map, continue reading to learn more, and see how your state measures up!
This map has been updated since this blog post was originally published, and therefore statistics and figures below may no longer correspond with the map
The items on the map (followed by facility count in parenthesis) include:
For oil and gas wells, view FracTracker’s state maps.
Transportation & Storage
Natural gas compressor stations (1,367) – Facilities built along a pipeline route that pressurize natural gas to keep it flowing through the pipeline.
Crude oil rail terminals (94) – Rail terminals that load and unload crude oil (liquid hydrocarbons that have yet to be processed into higher-value petroleum products).
Liquefied natural gas import/export terminals (8) – Facilities that can a) liquefy natural gas so it can be exported as LNG (liquefied natural gas) and/or b) re-gasify LNG so it can be used as natural gas. Natural gas is transported in a liquid state because it takes up less space as a liquid than as a gas.
Natural Gas Underground Storage (486) – Locations where natural gas is stored underground in aquifers, depleted gas fields, and salt formations.
Petroleum Product Terminals (1,484) – Terminals with a storage capacity of 50,000 barrels or more and/or the ability to receive volumes from tanker, barge, or pipeline. Petroleum products include products “produced from the processing of crude oil and other liquids at petroleum refineries, from extraction of liquid hydrocarbons at natural gas processing plants, and from production of finished petroleum products at blending facilities.”
Petroleum Ports (242) – A port that can import and/or export 200,000 or more short tons of petroleum products a year.
Natural gas import/export pipeline facility (54) – A facility where natural gas crosses the border of the continental United States.
Pipelines
Crude oil pipelines – major crude oil pipelines, including interstate truck lines and selected intrastate lines, but not including gathering lines.
Natural gas liquid pipelines – Also referred to as hydrocarbon gas liquid pipelines, they carry the heavier components of the natural gas stream which are liquid under intense pressure and extreme cold, but gas in normal conditions.
Natural gas pipelines– Interstate and intrastate natural gas pipelines. Due to the immensity of this pipeline network and lack of available data, this pipeline layer in particular varies in degree of accuracy.
Petroleum Product Pipelines – Major petroleum product pipelines.
Recent Pipeline Projects – Pipeline projects that have been announced since 2017. This includes projects in various stages, including under construction, complete, planned or canceled. Click on the pipeline for the status.
Processing & Downstream
Natural Gas Processing Plants (478) – Plants that separate impurities and components of the natural gas stream.
Chemical plants (36) – Includes two types of chemical plants – petrochemical production and ammonia manufacturing – that report to EPA’s Greenhouse Gas Reporting Program.
Ethylene Crackers (30) – Also referred to as ethane crackers, these petrochemical complexes that converts ethane (a natural gas liquid) into ethylene. Ethylene is used to make products like polyethylene plastic.
Petroleum Refineries (135) – A plant that processes crude oil into products like petroleum naphtha, diesel fuel, and gasoline.
Power Plants (9,414) – Electric generating plants with a capacity of at least one megawatt, sorted by energy source.
Wind Turbines (63,003) – Zoom in on wind power plants to see this legend item appear.
Natural Resources
Shale Plays (45) – Tight oil and gas shale plays, which are formations where oil and gas can be extracted.
Major Rivers
Solar Energy Potential – Potential solar energy generation, in kilowatt-hours per square meter per day – averaged annually.
This map is by no means exhaustive, but is exhausting. It takes a lot of infrastructure to meet the energy demands from industries, transportation, residents, and businesses – and the vast majority of these facilities are powered by fossil fuels. What can we learn about the state of our national energy ecosystem from visualizing this infrastructure? And with increasing urgency to decarbonize within the next one to three decades, how close are we to completely reengineering the way we make energy?
Key Takeaways
Natural gas accounts for 44% of electricity generation in the United States – more than any other source. Despite that, the cost per megawatt hour of electricity for renewable energy power plants is now cheaper than that of natural gas power plants.
The state generating the largest amount of solar energy is California, while wind energy is Texas. The state with the greatest relative solar energy is not technically a state – it’s D.C., where 18% of electricity generation is from solar, closely followed by Nevada at 17%. Iowa leads the country in relative wind energy production, at 45%.
The state generating the most amount of energy from both natural gas and coal is Texas. Relatively, West Virginia has the greatest reliance on coal for electricity (85%), and Rhode Island has the greatest percentage of natural gas (92%).
With 28% of total U.S. energy consumption for transportation, many of the refineries, crude oil and petroleum product pipelines, and terminals on this map are dedicated towards gasoline, diesel, and other fuel production.
Petrochemical production, which is expected to account for over a third of global oil demand growth by 2030, takes the form of chemical plants, ethylene crackers, and natural gas liquid pipelines on this map, largely concentrated in the Gulf Coast.
Electricity generation
The “power plant” legend item on this map contains facilities with an electric generating capacity of at least one megawatt, and includes independent power producers, electric utilities, commercial plants, and industrial plants. What does this data reveal?
In terms of the raw number of power plants – solar plants tops the list, with 2,916 facilities, followed by natural gas at 1,747.
In terms of megawatts of electricity generated, the picture is much different – with natural gas supplying the highest percentage of electricity (44%), much more than the second place source, which is coal at 21%, and far more than solar, which generates only 3% (Figure 1).
Figure 1. Electricity generation by source in the United States, 2019. Data from EIA.
This difference speaks to the decentralized nature of the solar industry, with more facilities producing less energy. At a glance, this may seem less efficient and more costly than the natural gas alternative, which has fewer plants producing more energy. But in reality, each of these natural gas plants depend on thousands of fracked wells – and they’re anything but efficient.
The cost per megawatt hour of electricity for a renewable energy power plants is now cheaper than that of fracked gas power plants. A report by the Rocky Mountain Institute, found “even as clean energy costs continue to fall, utilities and other investors have announced plans for over $70 billion in new gas-fired power plant construction through 2025. RMI research finds that 90% of this proposed capacity is more costly than equivalent [clean energy portfolios, which consist of wind, solar, and energy storage technologies] and, if those plants are built anyway, they would be uneconomic to continue operating in 2035.”
The economics side with renewables – but with solar, wind, geothermal comprising only 12% of the energy pie, and hydropower at 7%, do renewables have the capacity to meet the nation’s energy needs? Yes! Even the Energy Information Administration, a notorious skeptic of renewable energy’s potential, forecasted renewables would beat out natural gas in terms of electricity generation by 2050 in their 2020 Annual Energy Outlook.
This prediction doesn’t take into account any future legislation limiting fossil fuel infrastructure. A ban on fracking or policies under a Green New Deal could push renewables into the lead much sooner than 2050.
In a void of national leadership on the transition to cleaner energy, a few states have bolstered their renewable portfolio.
Figure 2. Electricity generation state-wide by source, 2019. Data from EIA.
One final factor to consider – the pie pieces on these state charts aren’t weighted equally, with some states’ capacity to generate electricity far greater than others. The top five electricity producers are Texas, California, Florida, Pennsylvania, and Illinois.
Transportation
In 2018, approximately 28% of total U.S. energy consumption was for transportation. To understand the scale of infrastructure that serves this sector, it’s helpful to click on the petroleum refineries, crude oil rail terminals, and crude oil pipelines on the map.
Transportation Fuel Infrastructure. Data from EIA.
The majority of gasoline we use in our cars in the US is produced domestically. Crude oil from wells goes to refineries to be processed into products like diesel fuel and gasoline. Gasoline is taken by pipelines, tanker, rail, or barge to storage terminals (add the “petroleum product terminal” and “petroleum product pipelines” legend items), and then by truck to be further processed and delivered to gas stations.
China leads the world in this movement. In 2018, just over half of the world’s electric vehicles sales occurred in China. Analysts predict that the country’s oil demand will peak in the next five years thanks to battery-powered vehicles and high-speed rail.
In the United States, the percentage of electric vehicles on the road is small but growing quickly. Tax credits and incentives will be important for encouraging this transition. Almost half of the country’s electric vehicle sales are in California, where incentives are added to the federal tax credit. California also has a “Zero Emission Vehicle” program, requiring electric vehicles to comprise a certain percentage of sales.
We can’t ignore where electric vehicles are sourcing their power – and for that we must go back up to the electricity generation section. If you’re charging your car in a state powered mainly by fossil fuels (as many are), then the electricity is still tied to fossil fuels.
Petrochemicals
Many of the oil and gas infrastructure on the map doesn’t go towards energy at all, but rather aids in manufacturing petrochemicals – the basis of products like plastic, fertilizer, solvents, detergents, and resins.
Natural gas processing plants separate components of the natural gas stream to extract natural gas liquids like ethane and propane – which are transported through the natural gas liquid pipelines. These natural gas liquids are key building blocks of the petrochemical industry.
Ethane crackers process natural gas liquids into polyethylene – the most common type of plastic.
The chemical plants on this map include petrochemical production plants and ammonia manufacturing. Ammonia, which is used in fertilizer production, is one of the top synthetic chemicals produced in the world, and most of it comes from steam reforming natural gas.
As we discuss ways to decarbonize the country, petrochemicals must be a major focus of our efforts. That’s because petrochemicals are expected to account for over a third of global oil demand growth by 2030 and nearly half of demand growth by 2050 – thanks largely to an increase in plastic production. The International Energy Agency calls petrochemicals a “blind spot” in the global energy debate.
Petrochemical development off the coast of Texas, November 2019. Photo by Ted Auch, aerial support provided by LightHawk.
Investing in plastic manufacturing is the fossil fuel industry’s strategy to remain relevant in a renewable energy world. As such, we can’t break up with fossil fuels without also giving up our reliance on plastic. Legislation like the Break Free From Plastic Pollution Act get to the heart of this issue, by pausing construction of new ethane crackers, ensuring the power of local governments to enact plastic bans, and phasing out certain single-use products.
“The greatest industrial challenge the world has ever faced”
Mapped out, this web of fossil fuel infrastructure seems like a permanent grid locking us into a carbon-intensive future. But even more overwhelming than the ubiquity of fossil fuels in the US is how quickly this infrastructure has all been built. Everything on this map was constructed since Industrial Revolution, and the vast majority in the last century (Figure 3) – an inch on the mile-long timeline of human civilization.
Figure 3. Global Fossil Fuel Consumption. Data from Vaclav Smil (2017)
In fact, over half of the carbon from burning fossil fuels has been released in the last 30 years. As David Wallace Wells writes in The Uninhabitable Earth, “we have done as much damage to the fate of the planet and its ability to sustain human life and civilization since Al Gore published his first book on climate than in all the centuries—all the millennia—that came before.”
What will this map look like in the next 30 years?
A recent report on the global economics of the oil industry states, “To phase out petroleum products (and fossil fuels in general), the entire global industrial ecosystem will need to be reengineered, retooled and fundamentally rebuilt…This will be perhaps the greatest industrial challenge the world has ever faced historically.”
Is it possible to build a decentralized energy grid, generated by a diverse array of renewable, local, natural resources and backed up by battery power? Could all communities have the opportunity to control their energy through member-owned cooperatives instead of profit-thirsty corporations? Could microgrids improve the resiliency of our system in the face of increasingly intense natural disasters and ensure power in remote regions? Could hydrogen provide power for energy-intensive industries like steel and iron production? Could high speed rail, electric vehicles, a robust public transportation network and bike-able cities negate the need for gasoline and diesel? Could traditional methods of farming reduce our dependency on oil and gas-based fertilizers? Could zero waste cities stop our reliance on single-use plastic?
Of course! Technology evolves at lightning speed. Thirty years ago we didn’t know what fracking was and we didn’t have smart phones. The greater challenge lies in breaking the fossil fuel industry’s hold on our political system and convincing our leaders that human health and the environment shouldn’t be externalized costs of economic growth.
https://www.fractracker.org/a5ej20sjfwe/wp-content/uploads/2020/02/National-map-feature-3.png400900Erica Jacksonhttps://www.fractracker.org/a5ej20sjfwe/wp-content/uploads/2025/09/2025-Wordmark-Logo.pngErica Jackson2020-02-28 17:35:142022-05-02 15:21:42National Energy and Petrochemical Map
WASHINGTON, DC – As oil and gas representatives descend on Pittsburgh this week for the annual Shale Insight conference, four advocates working to protect their communities from the harms of oil and gas development have been selected to receive the 2018 Community Sentinel Award for Environmental Stewardship, coordinated by FracTracker Alliance:
Ellen Gerhart – Pennsylvania
Natasha Léger – Colorado
Rebecca Roter – Pennsylvania, now Georgia
Youth award: Nalleli Cobo – California
This year’s recipients have founded grassroots organizations to protect communities from nearby drilling, paired traditional advocacy with scientific savvy, protested pipelines on land taken by eminent domain, and organized to stop urban drilling despite persistent health problems related to the drilling activity.
“The impacts of the oil and gas industry are visible across the United States, but hope abounds in the volunteers working in their communities and cherished places to document, report, and confront fossil fuel harms,” remarked Brook Lenker, Executive Director of FracTracker Alliance. “We are proud to honor Ellen, Natasha, Rebecca, and Nalleli this year, whose noble actions exemplify the transformative power of caring, committed, and engaged people.”
These four steadfast advocates were nominated by peers and selected by a committee of community defense leaders: Raina Rippel of Southwest Pennsylvania Environmental Health Project (Pennsylvania); Dan Shaffer of Allegheny-Blue Ridge Alliance and Dominion Pipeline Monitoring Coalition (Virginia); Dan Xie of Student PIRG (Florida); Jill Hunkler- Native American activist (Ohio); and Elena Sorokina of Crude Accountability (Washington, DC).
The award recipients will each receive $1,000 for their efforts and be recognized at an evening reception at the Renaissance Pittsburgh Hotel in Pittsburgh, Pennsylvania on Monday, November 26, 2018. The reception will also recognize heroes of the movement who recently passed away. Purchase tickets ($40).
This year’s major Community Sentinel sponsors include 11th Hour Project, The Heinz Endowments, and Foundation for Pennsylvania Watersheds. Award partners (to date) include Allegheny-Blue Ridge Alliance, Breathe Project, Center for Coalfield Justice, Crude Accountability, Earthworks, Food & Water Watch, Halt the Harm Network, Ohio Valley Environmental Coalition, Pipeline and Property Rights Center, Save the Hills Alliance, Sierra Club, Southwest Pennsylvania Environmental Health Project, and Viable Industries. View current sponsors and partners.
To learn more about the fourth annual Community Sentinel Award for Environmental Stewardship and to purchase tickets to the reception on November 26th, please visit: fractracker.org/sentinel-award.
# # #
About FracTracker Alliance
FracTracker Alliance is a national non-profit with regional offices in California, New York, Ohio, Pennsylvania, Washington DC. The organization’s mission is to study, map, and communicate the risks of oil and gas development to protect our planet and support the renewable energy transformation. Learn more at fractracker.org.
Press Contact For Release on October 24, 2018
Samantha Rubright malone@fractracker.org (preferred)
(202) 630-6426
https://www.fractracker.org/a5ej20sjfwe/wp-content/uploads/2016/06/SentinelAward-Feature.jpg400900FracTracker Alliancehttps://www.fractracker.org/a5ej20sjfwe/wp-content/uploads/2025/09/2025-Wordmark-Logo.pngFracTracker Alliance2018-10-24 10:14:212021-04-15 14:57:35Four environmental stewards receive the 2018 Community Sentinel Award
Oil and gas operators are polluting groundwater in Colorado, and the state and U.S. EPA are granting them permission with exemptions from the Safe Drinking Water Act.
FracTracker Alliance’s newest analysis attempts to identify groundwater risks in Colorado groundwater from the injection of oil and gas waste. Specifically, we look at groundwater monitoring data near Class II underground injection control (UIC) disposal wells and in areas that have been granted aquifer exemptions from the underground source of drinking water rules of the Safe Drinking Water Act (SDWA). Momentum to remove amend the SDWA and remove these exemption.
Aquifer exemptions are granted to allow corporations to inject hazardous wastewater into groundwater aquifers. The majority, two-thirds, of these injection wells are Class II, specifically for oil and gas wastes.
The results of this assessment provide insight into high-risk issues with aquifer exemptions and Class II UIC well permitting standards in Colorado. We identify areas where aquifer exemptions have been granted in high quality groundwater formations, and where deep underground aquifers are at risk or have become contaminated from Class II disposal wells that may have failed.
Of note: On March 23, 2016, NRDC submitted a formal petition urging the EPA to repeal or amend the aquifer exemption rules to protect drinking water sources and uphold the Safe Drinking Water Act. Learn more
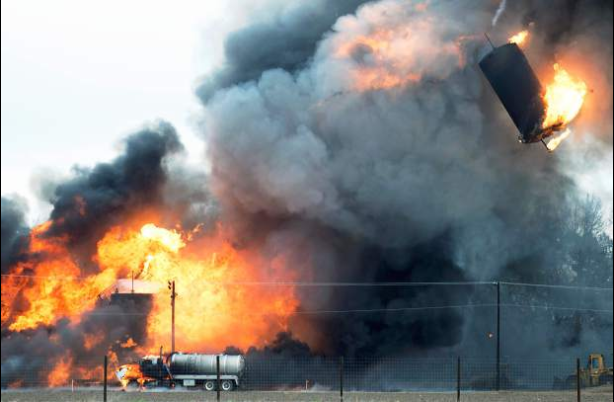
Research shows injection wells do fail
Class II injection well in Colorado explodes and catches fire. Photo by Kelsey Brunner for the Greeley Tribune.
Disposal of oil and gas wastewater by underground injection has not yet been specifically researched as a source of systemic groundwater contamination nationally or on a state level. Regardless, this issue is particularly pertinent to Colorado, since there are about 3,300 aquifer exemptions in the US (view map), and the majority of these are located in Montana, Wyoming, and Colorado. There is both a physical risk of danger as well as the risk of groundwater contamination. The picture to the right shows an explosion of a Class II injection well in Greeley, CO, for example.
Applicable and existing research on injection wells shows that a risk of groundwater contamination of – not wastewater – but migrated methane due to a leak from an injection well was estimated to be between 0.12 percent of all the water wells in the Colorado region, and was measured at 4.5 percent of the water wells that were tested in the study.
A recent article by ProPublica quoted Mario Salazar, an engineer who worked for 25 years as a technical expert with the EPA’s underground injection program in Washington:
In 10 to 100 years we are going to find out that most of our groundwater is polluted … A lot of people are going to get sick, and a lot of people may die.
Also in the ProPublic article was a study by Abrahm Lustgarten, wherein he reviewed well records and data from more than 220,000 oil and gas well inspections, and found:
Structural failures inside injection wells are routine.
Between 2007-2010, one in six injection wells received a well integrity violation.
More than 7,000 production and injection wells showed signs of well casing failures and leakage.
…groundwater contamination problems related to the subsurface disposal of liquid wastes by deep-well injection have been reviewed in the literature since 1950 (Morganwalp, 1993) and groundwater contamination accordingly is a serious problem.
According to his textbook, a 1974 U.S. EPA report specifically warns of the risk of corrosion by oil and gas waste brines on handling equipment and within the wells. The potential effects of injection wells on groundwater can even be reviewed in the U.S. EPA publications (1976, 1996, 1997).
As early as 1969, researchers Evans and Bradford, who reported on the dangers that could occur from earthquakes on injection wells near Denver in 1966, had warned that deep well injection techniques offered temporary and not long-term safety from the permanent toxic wastes injected.
Will existing Class II wells fail?
For those that might consider data and literature on wells from the 1960’s as being unrepresentative of activities occurring today, of the 587 wells reported by the Colorado’s oil and gas regulatory body, COGCC, as “injecting,” 161 of those wells were drilled prior to 1980. And 104 were drilled prior to 1960!
Wells drilled prior to 1980 are most likely to use engineering standards that result in “single-point-of-failure” well casings. As outlined in the recent report from researchers at Harvard on underground natural gas storage wells, these single-point-of-failure wells are at a higher risk of leaking.
It is also important to note that the U.S. EPA reports only 569 injection wells for Colorado, 373 of which may be disposal wells. This is a discrepancy from the number of injection wells reported by the COGCC.
Aquifer Exemptions in Colorado
According to COGCC, prior to granting a permit for a Class II injection well, an aquifer exemption is required if the aquifer’s groundwater test shows total dissolved solids (TDS) is between 3,000 and 10,000 milligrams per liter (mg/l). For those aquifer exemptions that are simply deeper than the majority of current groundwater wells, the right conditions, such as drought, or the needs of the future may require drilling deeper or treating high TDS waters for drinking and irrigation. How the state of Colorado or the U.S. EPA accounts for economic viability is therefore ill-conceived.
Data Note: The data for the following analysis came by way of FOIA request by Clean Water Action focused on the aquifer exemption permitting process. The FOIA returned additional data not reported by the US EPA in the public dataset. That dataset contained target formation sampling data that included TDS values. The FOIA documents were attached to the EPA dataset using GIS techniques. These GIS files can be found for download in the link at the bottom of this page.
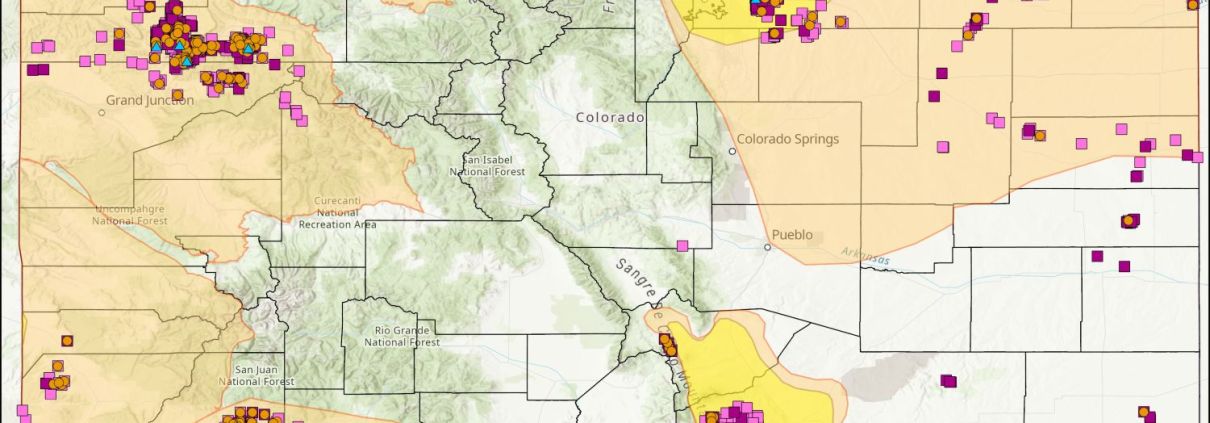
Map 1 above shows the locations of aquifer exemptions in Colorado, as well as the locations of Class II injection wells. These sites are overlaid on a spatial assessment of groundwater quality (a map of the groundwater’s quality), which was generated for the entire state. The changing colors on the map’s background show spatial trends of TDS values, a general indicator of overall groundwater quality.
In Map 1 above, we see that the majority of Class II injection wells and aquifer exemptions are located in regions with higher quality water. This is a common trend across the state, and needs to be addressed.
Our review of aquifer exemption data in Colorado shows that aquifer exemption applications were granted for areas reporting TDS values less than 3,000 mg/l, which contradicts the information reported by the COGCC as permitting guidelines. Additionally, of the 175 granted aquifer exemptions for which the FOIA returned data, 141 were formations with groundwater samples reported at less than 10,000 mg/l TDS. This is half of the total number (283) of aquifer exemptions in the state of Colorado.
When we mapped where class II injection wells are permitted, a total of 587 class II wells were identified in Colorado, outside of an aquifer exemption area. Of the UIC-approved injection wells identified specifically as disposal wells, at least 21 were permitted outside aquifer exemptions and were drilled into formations that were not hydrocarbon producing. Why these injection wells are allowed to operate outside of an aquifer exemption is unknown – a question for regulators.
You can see in the map that most of the aquifer exemptions and injection wells in Colorado are located in areas with lower TDS values. We then used GIS to conduct a spatial analysis that selected groundwater wells within five miles of the 21 that were permitted outside aquifer exemptions. Results show that groundwater wells near these sites had consistently low-TDS values, meaning good water quality. In Colorado, where groundwater is an important commodity for a booming agricultural industry and growing cities that need to prioritize municipal sources, permitting a Class II disposal well in areas with high quality groundwater is irresponsible.
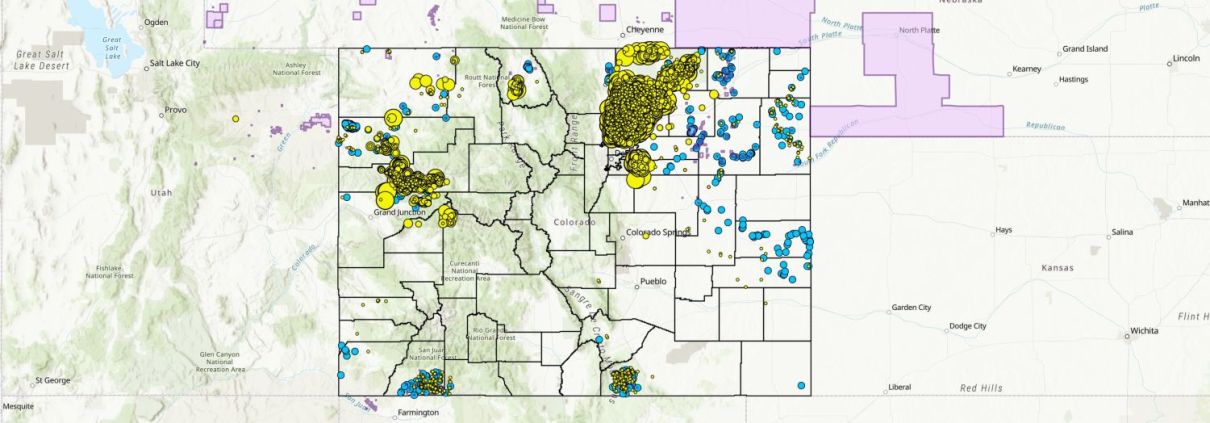
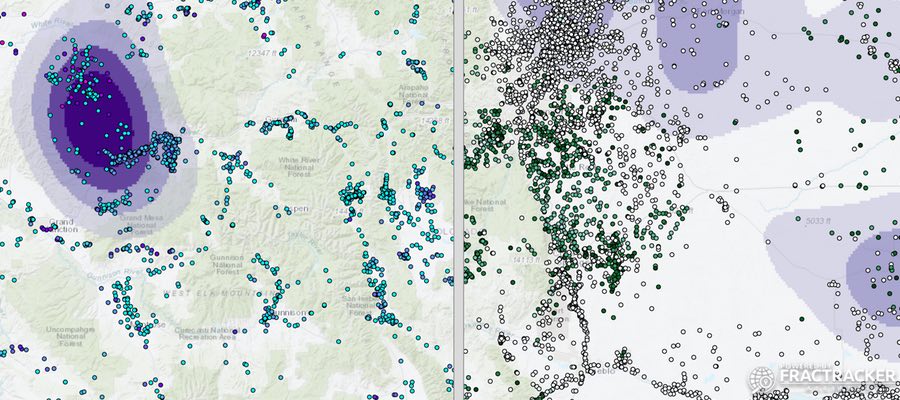
In Map 2, above, the locations of groundwater wells in Colorado are shown. The colors of the dots represent the concentration of TDS on the right and well depth on the left side of the screen. By sliding the bar on the map, users can visualize both. This feature allows people to explore where deep wells also are characterized by high levels of TDS. Users can also see that areas with high quality low TDS groundwater are the same areas that are the most developed with oil and gas production wells and Class II injection wells, shown in gradients of purple.
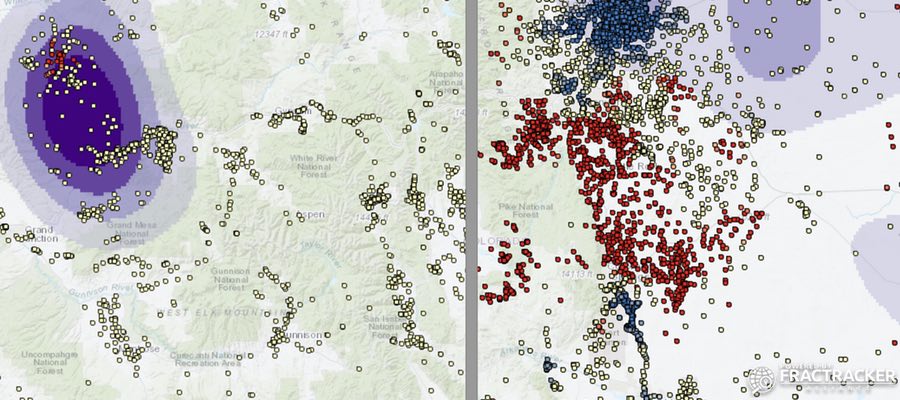
Statistical analysis of this spatial data gives a clearer picture of which regions are of particular concern; see below in Map 3.
In Map 3, above, the data visualized in Map 2 were input into a hot-spots analysis, highlighting where high and low values of TDS and depth differ significantly from the rest of the data. The region of the Front Range near Denver has significantly deeper wells, as a result of population density and the need to drill municipal groundwater wells.
The Front Range is, therefore, a high-risk region for the development of oil and gas, particularly from Class II injection wells that are necessary to support development.
Methods Notes: The COGCC publishes groundwater monitoring data for the state of Colorado, and groundwater data is also compiled nationally by the Advisory Committee on Water Information (ACWI). (Data from the National Groundwater Monitoring Network is sponsored by the ACWI Subcommittee on Ground Water.) These datasets were cleaned, combined, revised, and queried to develop FracTracker’s dataset of Colorado groundwater wells. We cleaned the data by removing sites without coordinates. Duplicates in the data set were removed by selecting for the deepest well sample. Our dataset of water wells consisted of 5,620 wells. Depth data was reported for 3,925 wells. We combined this dataset with groundwater data exported from ACWI. Final count for total wells with TDS data was 11,754 wells. Depth data was reported for 7,984 wells. The GIS files can be downloaded in the compressed folder at the bottom of this page.
Site Assessments – Exploring Specific Regions
Particular regions were further investigated for impacts to groundwater, and to identify areas that may be at a high risk of contamination. There are numerous ways that groundwater wells can be contaminated from other underground activity, such as hydrocarbon exploration and production or waste injection and disposal. Contamination could be from hydraulic fracturing fluids, methane, other hydrocarbons, or from formation brines.
From the literature, brines and methane are the most common contaminants. This analysis focuses on potential contamination events from brines, which can be detected by measuring TDS, a general measure for the mixture of minerals, salts, metals and other ions dissolved in waters. Brines from hydrocarbon-producing formations may include heavy metals, radionuclides, and small amounts of organic matter.
Wells with high or increasing levels of TDS are a red flag for potential contamination events.
Methods
Groundwater wells at deep depths with high TDS readings are, therefore, the focus of this assessment. Using GIS methods we screened our dataset of groundwater wells to only identify those located within a buffer zone of five miles from Class II injection wells. This distance was chosen based on a conservative model for groundwater contamination events, as well as the number of returned sample groundwater wells and the time and resources necessary for analysis. We then filtered the groundwater wells dataset for high TDS values and deep well depths to assess for potential impacts that already exist. We, of course, explored the data as we explored the spatial relationships. We prioritized areas that suggested trends in high TDS readings, and then identified individual wells in these areas. The data initially visualized were the most recent sampling events. For the wells prioritized, prior sampling events were pulled from the data. The results were graphed to see how the groundwater quality has changed over time.
Case of Increasing TDS Readings
If you zoom to the southwest section of Colorado in Map 2, you can see that groundwater wells located near the injection well 1 Fasset SWD (EPA) (05-067-08397) by Operator Elm Ridge Exploration Company LLC were disproportionately high (common). Groundwater wells located near this injection well were selected for, and longitudinal TDS readings were plotted to look for trends in time. (Figure 1.)
The graphs in Figure 1, below, show a consistent increase of TDS values in wells near the injection activity. While the trends are apparent, the data is limited by low numbers of repeated samples at each well, and the majority of these groundwater wells have not been sampled in the last 10 years. With the increased use of well stimulation and enhanced oil recovery techniques over the course of the last 10 years, the volumes of injected wastewater has also increased. The impacts may, therefore, be greater than documented here.
This area deserves additional sampling and monitoring to assess whether contamination has occurred.
Figures 1a and 1b. The graphs above show increasing TDS values in samples from groundwater wells in close proximity to the 1 Fassett SWD wellsite, between the years 2004-2015. Each well is labeled with a different color. The data for the USGS well in the graph on the right was not included with the other groundwater wells due to the difference in magnitude of TDS values (it would have been off the chart).
Groundwater Contamination Case in 2007
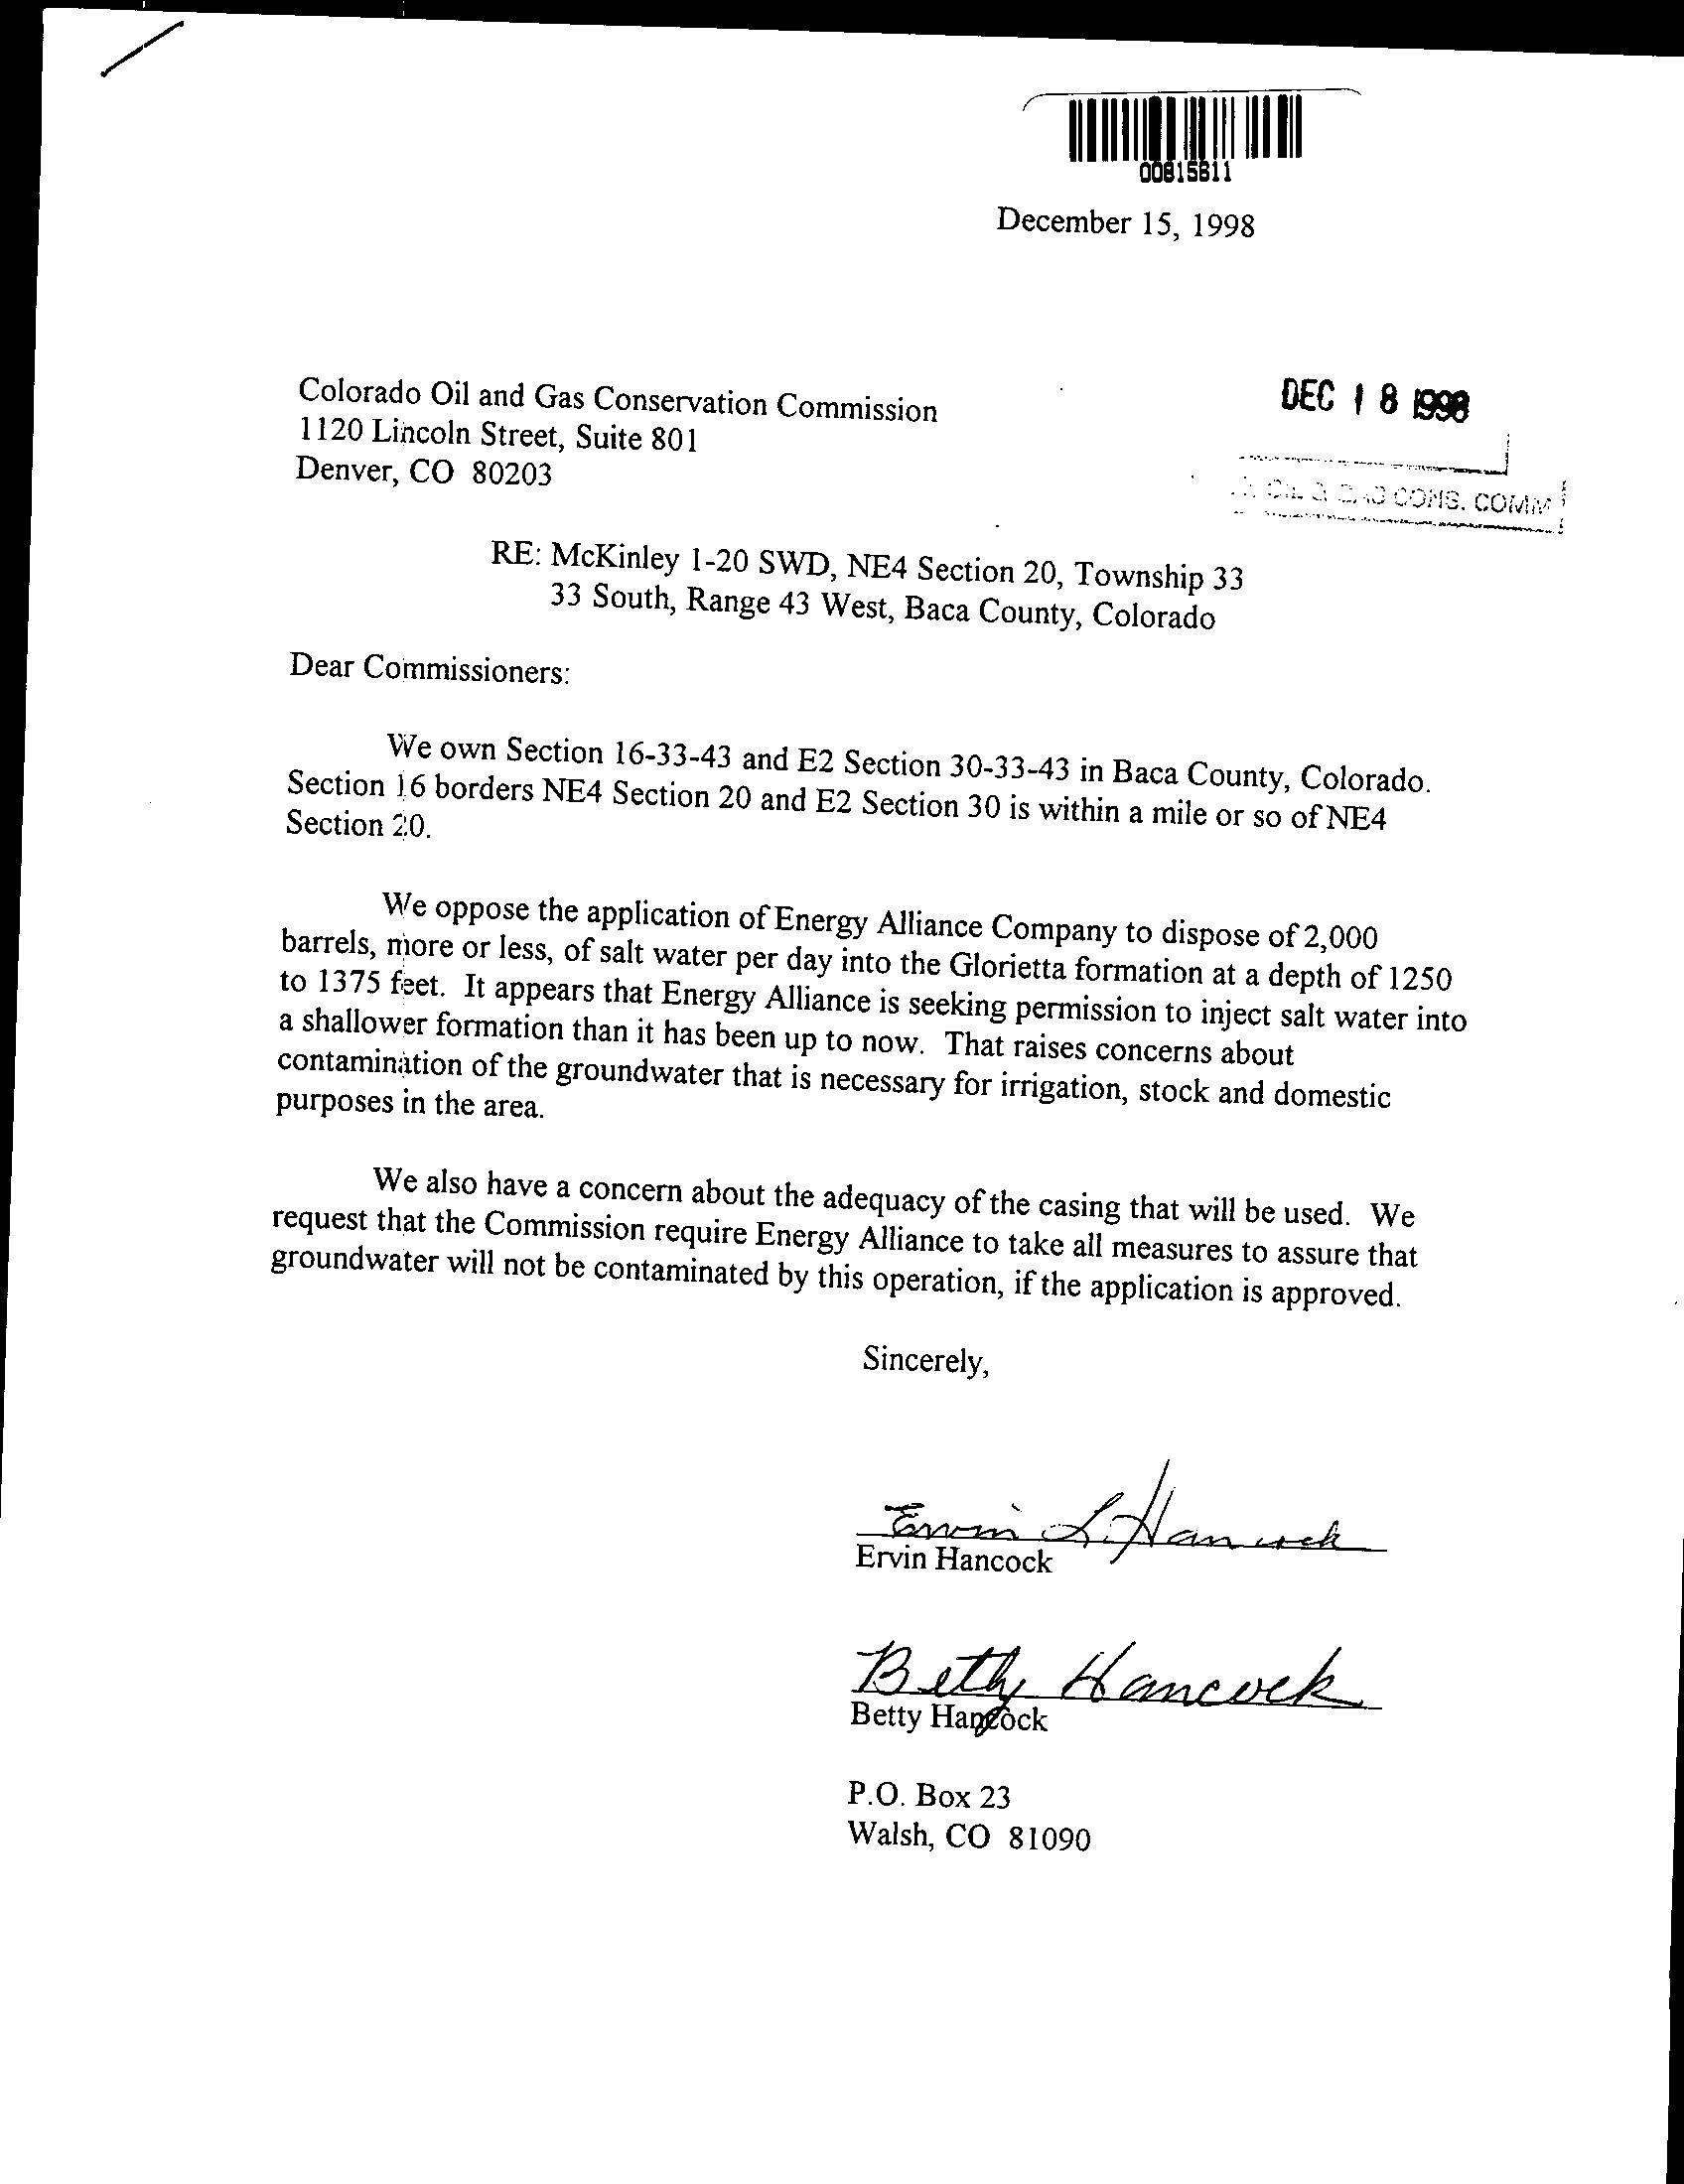
We also uncovered a situation where a disposal well caused groundwater contamination. Well records for Class II injection wells in the southeast corner of Colorado were reviewed in response to significantly high readings of TDS values in groundwater wells surrounding the Mckinley #1-20-WD disposal well.
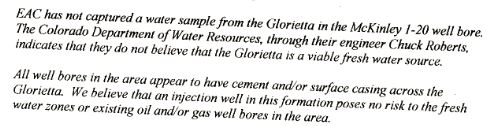
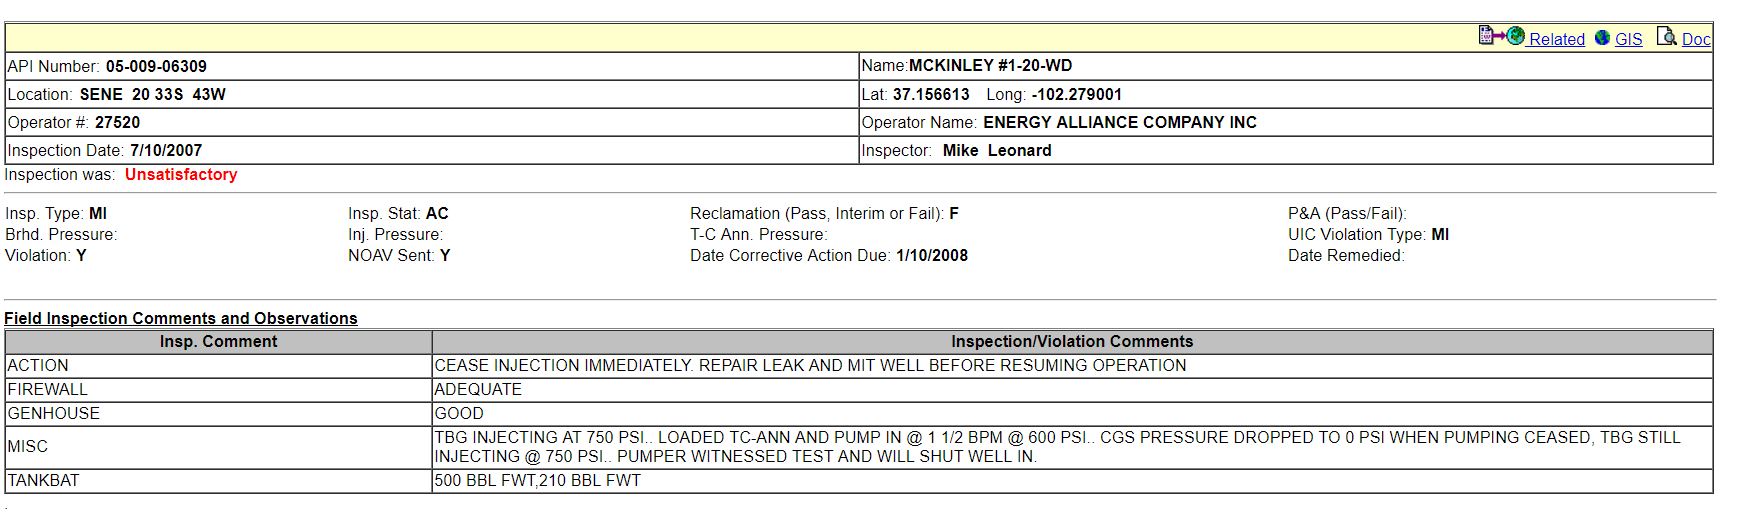
When the disposal well was first permitted, farmers and ranchers neighboring the well site petitioned to block the permit. Language in the grant application is shown below in Figure 2. The petitioners identified the target formation as their source of water for drinking, watering livestock, and irrigation. Regardless of this petition, the injection well was approved. Figure 3 shows the language used by the operator Energy Alliance Company (EAC) for the permit approval, which directly contradicts the information provided by the community surrounding the wellsite. Nevertheless, the Class II disposal well was approved, and failed and leaked in 2007, leading to the high TDS readings in the groundwater in this region.
Figure 2. Petition by local landowners opposing the use of their drinking water source formation for the site of a Class II injection disposal well.
Figure 3. The oil and gas operation EAC claims the Glorietta formation is not a viable fresh water source, directly contradicting the neighboring farmers and ranchers who rely on it.
Figure 4. The COGCC well log report shows a casing failure, and as a result a leak that contaminated groundwater in the region.
Areas where lack of data restricted analyses
In other areas of Colorado, the lack of recent sampling data and longitudinal sampling schemes made it even more difficult to track potential contamination events. For these regions, FracTracker recommends more thorough sampling by the regulatory agencies COGCC and USGS. This includes much of the state, as described below.
Southeastern Colorado
Our review of the groundwater data in southeastern Colorado showed a risk of contamination considering the overlap of injection well depths with the depths of drinking water wells. Oil and gas extraction and Class II injections are permitted where the aquifers include the Raton formation, Vermejo Formation, Poison Canyon Formation and Trinidad Sandstone. Groundwater samples were taken at depths up to 2,200 ft with a TDS value of 385 mg/l. At shallower depths, TDS values in these formations reached as high as 6,000 mg/l, and 15 disposal wells are permitted in aquifer exemptions in this region. Injections in this area start at around 4,200 ft.
In Southwestern Colorado, groundwater wells in the San Jose Formation are drilled to documented depths of up to 6,000 feet with TDS values near 2,000 mg/l. Injection wells in this region begin at 565 feet, and those used specifically for disposal begin at below 5,000 feet in areas with aquifer exemptions. There are also four disposal wells outside of aquifer exemptions injecting at 5,844 feet, two of which are not injecting into active production zones at depths of 7,600 and 9,100 feet.
Western Colorado
In western Colorado well Number 1-32D VANETA (05-057-06467) by Operator Sandridge Exploration and Production LLC’s North Park Horizontal Niobara Field in the Dakota-Lokota Formation has an aquifer exemption. The sampling data from two groundwater wells to the southeast, near Coalmont, CO, were reviewed, but we can’t get a good picture due to the lack of repeat sampling.
In Northwestern Colorado near Walden, CO and the McCallum oil field, two groundwater wells with TDS above 10,000 ppm were selected for review. There are 21 injection wells in the McCallum field to the northwest. Beyond the McCallum field is the Battleship field with two wastewater disposal wells with an aquifer exemption. West of Grover, Colorado, there are several wells with high TDS values reported for shallow wells. Similar trends can be seen near Vernon. The data on these wells and wells from along the northern section of the Front Range, which includes the communities of Fort Collins, Greeley, and Longmont, suffered from the same issue. Lack of deep groundwater well data coupled with the lack of repeat samples, as well as recent sampling inhibited the ability to thoroughly investigate the threat of contamination.
Trends and Future Development
Current trends in exploration and development of unconventional resources show the industry branching southwest of Weld County towards Fort Collins, Longmont, Broomfield and Boulder, CO.
These regions are more densely populated than the Front Range county of Weld, and as can be seen in the maps, the drinking water wells that access groundwaters in these regions are some of the deepest in the state.
This analysis shows where Class II injection has already contaminated groundwater resources in Colorado. The region where the contamination has occurred is not unique; the drinking water wells are not particularly deep, and the density of Class II wells is far from the highest in the state.
Well casing failures and other injection issues are not exactly predictable due to the variety of conditions that can lead to a well casing failure or blow-out scenario, but they are systemic. The result is a hazardous scenario where it is currently difficult to mitigate risk after the injection wells are drilled.
Allowing Class II wells to expand into Front Range communities that rely on deep wells for municipal supplies is irresponsible and dangerous.
The encroachment of extraction into these regions, coupled with the support of Class II injection wells to handle the wastewater, would put these groundwater wells at particular risk of contamination. Based on this analysis, we recommend that regulators take extra care to avoid permitting Class II wells in these regions as the oil and gas industry expands into new areas of the Front Range, particularly in areas with dense populations.
Feature Image: Joshua Doubek / WIKIMEDIA COMMONS
Article by: Kyle Ferrar, Western Program Coordinator, FracTracker Alliance
October 31, 2017 Edit: This post originally cited the Clean Water Act instead of the Safe Drinking Water Act as the source that EPA uses to grant aquifer exemptions.
https://www.fractracker.org/a5ej20sjfwe/wp-content/uploads/2017/10/kansas_wellpad.jpg400900Kyle Ferrar, MPHhttps://www.fractracker.org/a5ej20sjfwe/wp-content/uploads/2025/09/2025-Wordmark-Logo.pngKyle Ferrar, MPH2017-10-26 14:55:032021-04-15 15:02:07Groundwater risks in Colorado due to Safe Drinking Water Act exemptions
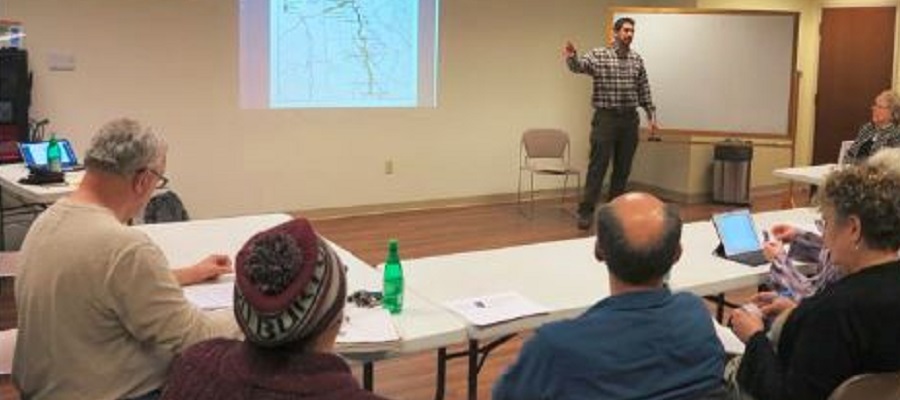
FracTracker Alliance invites Colorado’s Front Range communities to attend and participate in two community meetings, open to the public on August 23rd and 24th. Our shared goals will be to craft new research projects for FracTracker to study related to the environmental health impacts resulting from oil and gas development in Colorado. We also welcome Dr. Stephanie Malin, who will be giving a short presentation on her current work.
Background
FracTracker is returning to Colorado’s Front Range to continue working with communities where oil and gas exploration and production impacts the daily lives of Coloradoans and degrades the environment. While Colorado is not well known for oil and gas extraction, development within recent years using unconventional techniques like fracking has bloated production to over 60,000 active wells. The majority of these wells, over 33,000, are located in Weld County. These Front Range communities are also the most densely populated regions near major unconventional oil and gas development. FracTracker will, therefore, continue to support these communities under assault by the fossil fuel industry.
Community Workshops
FracTracker will be hosting two community engagement workshops in Weld County on August 23rd and 24th. You can find the flyers with times posted below. The meetings will serve to both inform the communities of the work FracTracker is currently conducting or has already completed to date, and to direct and inform future research in Colorado. Active communty engagement is most important to the environmental health research process. Researchers rely on community members. You, the community, are the experts we need to create responsibly informed research projects!
Below are flyers with more information about the events (click to expand).
Our agenda for the August 23rd meeting includes a synopsis of the research products that have been generated by FracTracker thus far. Below you will find links to the research that has been summarized into blog posts. Current, active research will also be presented:
Instead of coming in with a preconceived research question, we’re starting with your concerns. The goal of these meetings is to narrow down topics for future research, and then to refine the questions associated with each topic. The meeting on the 23rd will serve to nail down the issues that are most important to community members. This conversation may include expanding existing research and revisiting topics. On the evening of August 24th, we will present these topics to the greater community for further discussion. The issues will be prioritized with the help of a larger audience, and specific research aims will be synthesized.
For more information about these community meetings in Colorado, please contact Kyle Ferrar at ferrar@fractracker.org.
https://www.fractracker.org/a5ej20sjfwe/wp-content/uploads/2017/08/cover.jpg400900Kyle Ferrar, MPHhttps://www.fractracker.org/a5ej20sjfwe/wp-content/uploads/2025/09/2025-Wordmark-Logo.pngKyle Ferrar, MPH2017-08-21 12:58:152021-04-15 15:02:35FracTracker Alliance to Host Community Meetings in Colorado
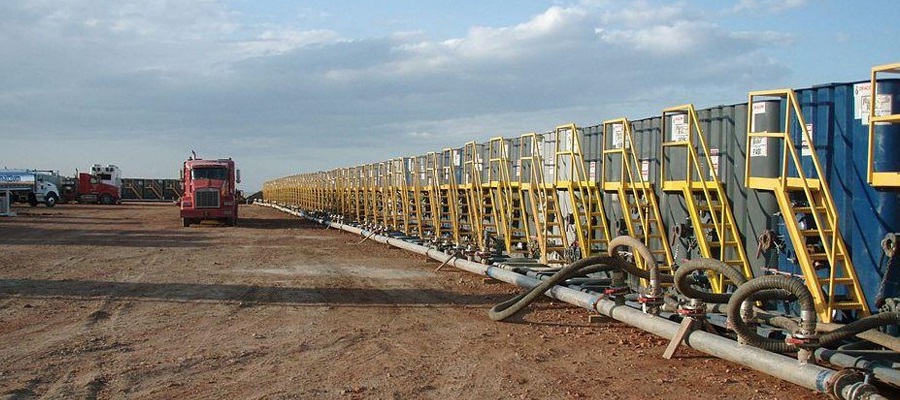
Given recent concerns about underground natural gas storage wells (UGS), FracTracker mapped UGS wells and fields in Colorado, as well as midstream transmission pipelines of natural gas that transport the gas from well sites to facilities for processing. Results show that 6,673 Colorado residents in 2,607 households live within a 2.5 mile evacuation radius of a UGS well. Additionally, the UGS fields with the largest number of “single-point-of-failure” high-risk storage wells are also the two fields in Colorado nearest communities.
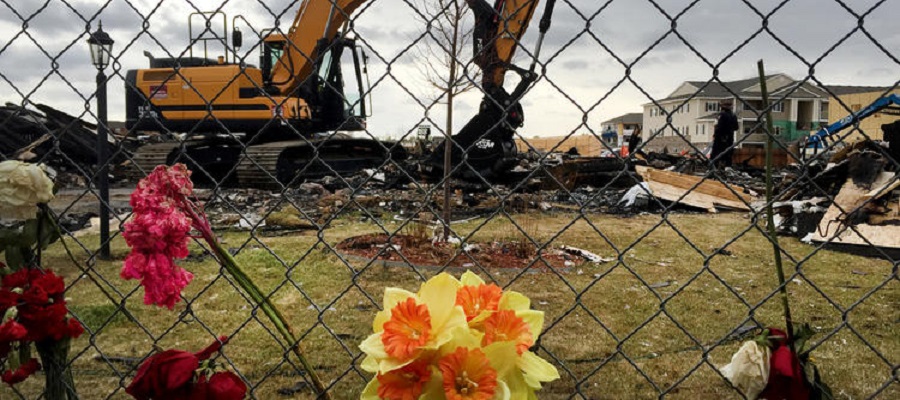
Worst Case Scenario
A house exploding from a natural gas leak sounds straight out of a 19th century period drama, but this tragedy just recently occurred in Firestone, Colorado. How could this happen in 2017? We have seen pictures and read reports of blowouts and explosions at well sites, and know of the fight against big oil and natural gas pipelines across the country. At the same time we take for granted the natural gas range that heats our food to feed our families. The risk of harm is seemingly far removed from our stove tops, although it may be much closer to home than we think – There are documented occupational hazards and compartmentalized risks in moving natural gas off site.
Natural gas is an explosive substance, yet the collection of the gas from well sites remains largely industry-regulated. Unfortunately, it has become clear that production states like Colorado are not able to provide oversight, much less know where small pipelines are even located. This is particularly dangerous, since the natural gas in its native state is ordorless, colorless, and tasteless. Flowing in the pipelines between well sites and processing stations, natural gas does not contain the mercaptan that gives commercial natural gas its tell-tale odor. In fact, much of the natural gas or “product” is merely lost to the atmosphere, or much worse, can collect in closed spaces and reach explosive levels. This means that high, potentially explosive levels of methane may go undetected until far too late.
Mapping Flow Lines
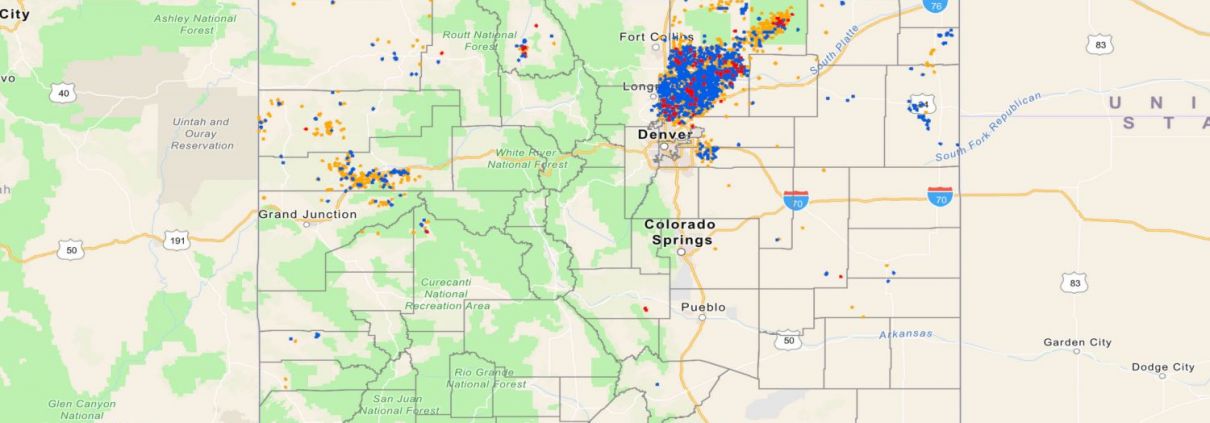
As a result of the house explosion in Firestone on April 17th CO regulators are now requiring oil and gas operators to report the location of their collection flow pipelines, as shown in Figure 1.
The locations of the collection of pipeline “flowlines”, like the uncapped pipeline that caused the house explosion in Firestone, have been mapped by FracTracker Alliance (above). The dataset is not complete, as not all operators complied with the reporting deadline set by the COGCC. For residents living in the midst of Colorado’s oil and gas production zones, addresses can be typed into the search bar in the upper left corner of the map. Users can see if their homes are located near or on top of these pipelines. The original mapping was done by Inside Energy’s Jordan Wirfs-Brock.
Underground Storage
When natural gas is mixed with mercaptan and ready for market, operators and utility companies store the product in UGS fields. (EDIT – Research shows that in most cases natural gas in UGS fields is not yet mixed with mercaptan. Therefore leaks may go undetected more easily. Aliso Canyon was a unique case where the gas was being stored AFTER being mixed with mercaptan. Odorization is not legally required until gas moves across state lines in an interstate pipeline or is piped into transmission lines for commercial distribution.) In August 2016, a natural gas storage well at the SoCal Gas Aliso Canyon natural gas storage field failed causing the largest methane leak in U.S. history. The Porter Ranch community experienced health impacts including nosebleeds, migraines, respiratory and other such symptoms. Thousands of residents were evacuated. While Aliso Canyon was the largest leak, it was by no means a unique case.
FracTracker has mapped the underground natural gas storage facilities in Colorado, and the wells that service the facilities. As can be seen below, there are 10 storage fields in Colorado, and an 11th one is planned. All the fields used for storage in Colorado are previously depleted oil and gas production fields. The majority of storage wells used to be production wells. All sites are shown in the map below (Figure 2).
Figure 2. Map of Natural Gas Underground Storage Facilities
Our analysis of Colorado natural gas storage facilities shows that 6,673 Colorado residents living in 2,607 households live within a 2.5 mile evacuation radius of a UGS well. The majority of those Coloradans (5,422) live in Morgan County, with 2,438 in or near the city of Fort Morgan. The city of Fort Morgan is surrounded by the Young Gas Storage Facility with a working capacity of 5,790,049 MCF and Colorado Interstate Gas Company with a working capacity of 8,496,000 MCF.
By comparison, the failure in Aliso Canyon leaked up to 5,659,000 MCF. A leak at either of these facilities could, therefore, result in a similar or larger release.
UGS Well Risk Assessment
A FracTracker co-founder and colleague at Harvard University recently completed a risk assessment of underground natural gas storage wells across the U.S. The analysis identified the storage wells shown in the map above (Figure 1) and defined a number of “design deficiencies” in wells, including “single-point-of-failure” designs that make the wells vulnerable to leaks and failures. Results showed that 2,715 of the total 14,138 active UGS wells across the country were constructed using similar techniques as the Aliso Canyon failed well.
Applying this assessment to the wells in Colorado, FracTracker finds the following:
There are a total of 357 UGS wells in Colorado.
220 of which are currently active.
Of those 220 UGS wells, they were all drilled between 1949 and 1970.
43 of the UGS wells are repurposed production wells.
40 of those repurposed wells are the highest risk single barrier wells.
Specifically focusing on the UGS fields surrounding the city of Fort Morgan:
21 single barrier wells are located in the Flank field 2.5 miles North of the city.
13 single barrier wells are located in the Fort Morgan field 2.5 miles South of the city.
We originally asked how something as terrible as Firestone could have occurred. Collectively we all want to believe this was an isolated incident. Sadly, the data suggest the risk is higher than originally thought: The fields with the largest number of “single-point-of-failure” high-risk UGS wells are also the two fields in Colorado nearest communities. While the incident in Firestone is certainly heartbreaking, we hope regulators and operators can use the information in this analysis to avoid future catastrophes.
By Kyle Ferrar, Western Program Coordinator, FracTracker Alliance
Feature Image: Heavy equipment moves debris from the site of a house explosion April 17, 2017 in Firestone, Colorado, which killed two people. (David Kelly / For The Times)
https://www.fractracker.org/a5ej20sjfwe/wp-content/uploads/2017/07/firestone_DavidKelly_Forthetimes_re.jpg400900Kyle Ferrar, MPHhttps://www.fractracker.org/a5ej20sjfwe/wp-content/uploads/2025/09/2025-Wordmark-Logo.pngKyle Ferrar, MPH2017-07-20 12:57:302021-04-15 15:02:39Risks from Colorado’s Natural Gas Storage and Transmission Systems
Over 50% of land in the United States is dedicated to agriculture. Oil and gas development, particularly hydraulic fracturing or “fracking,” is taking place near many of these farms.
Farms feed us, and unfortunately they are not protected from the impacts of fracking. Even if drilling can be done responsibly, accidents happen. In Colorado, for example, two spills occur on average per day, 15% of which result in water contamination. [1] Risking our food supply is not only a risk to our health – it’s a risk to national security.
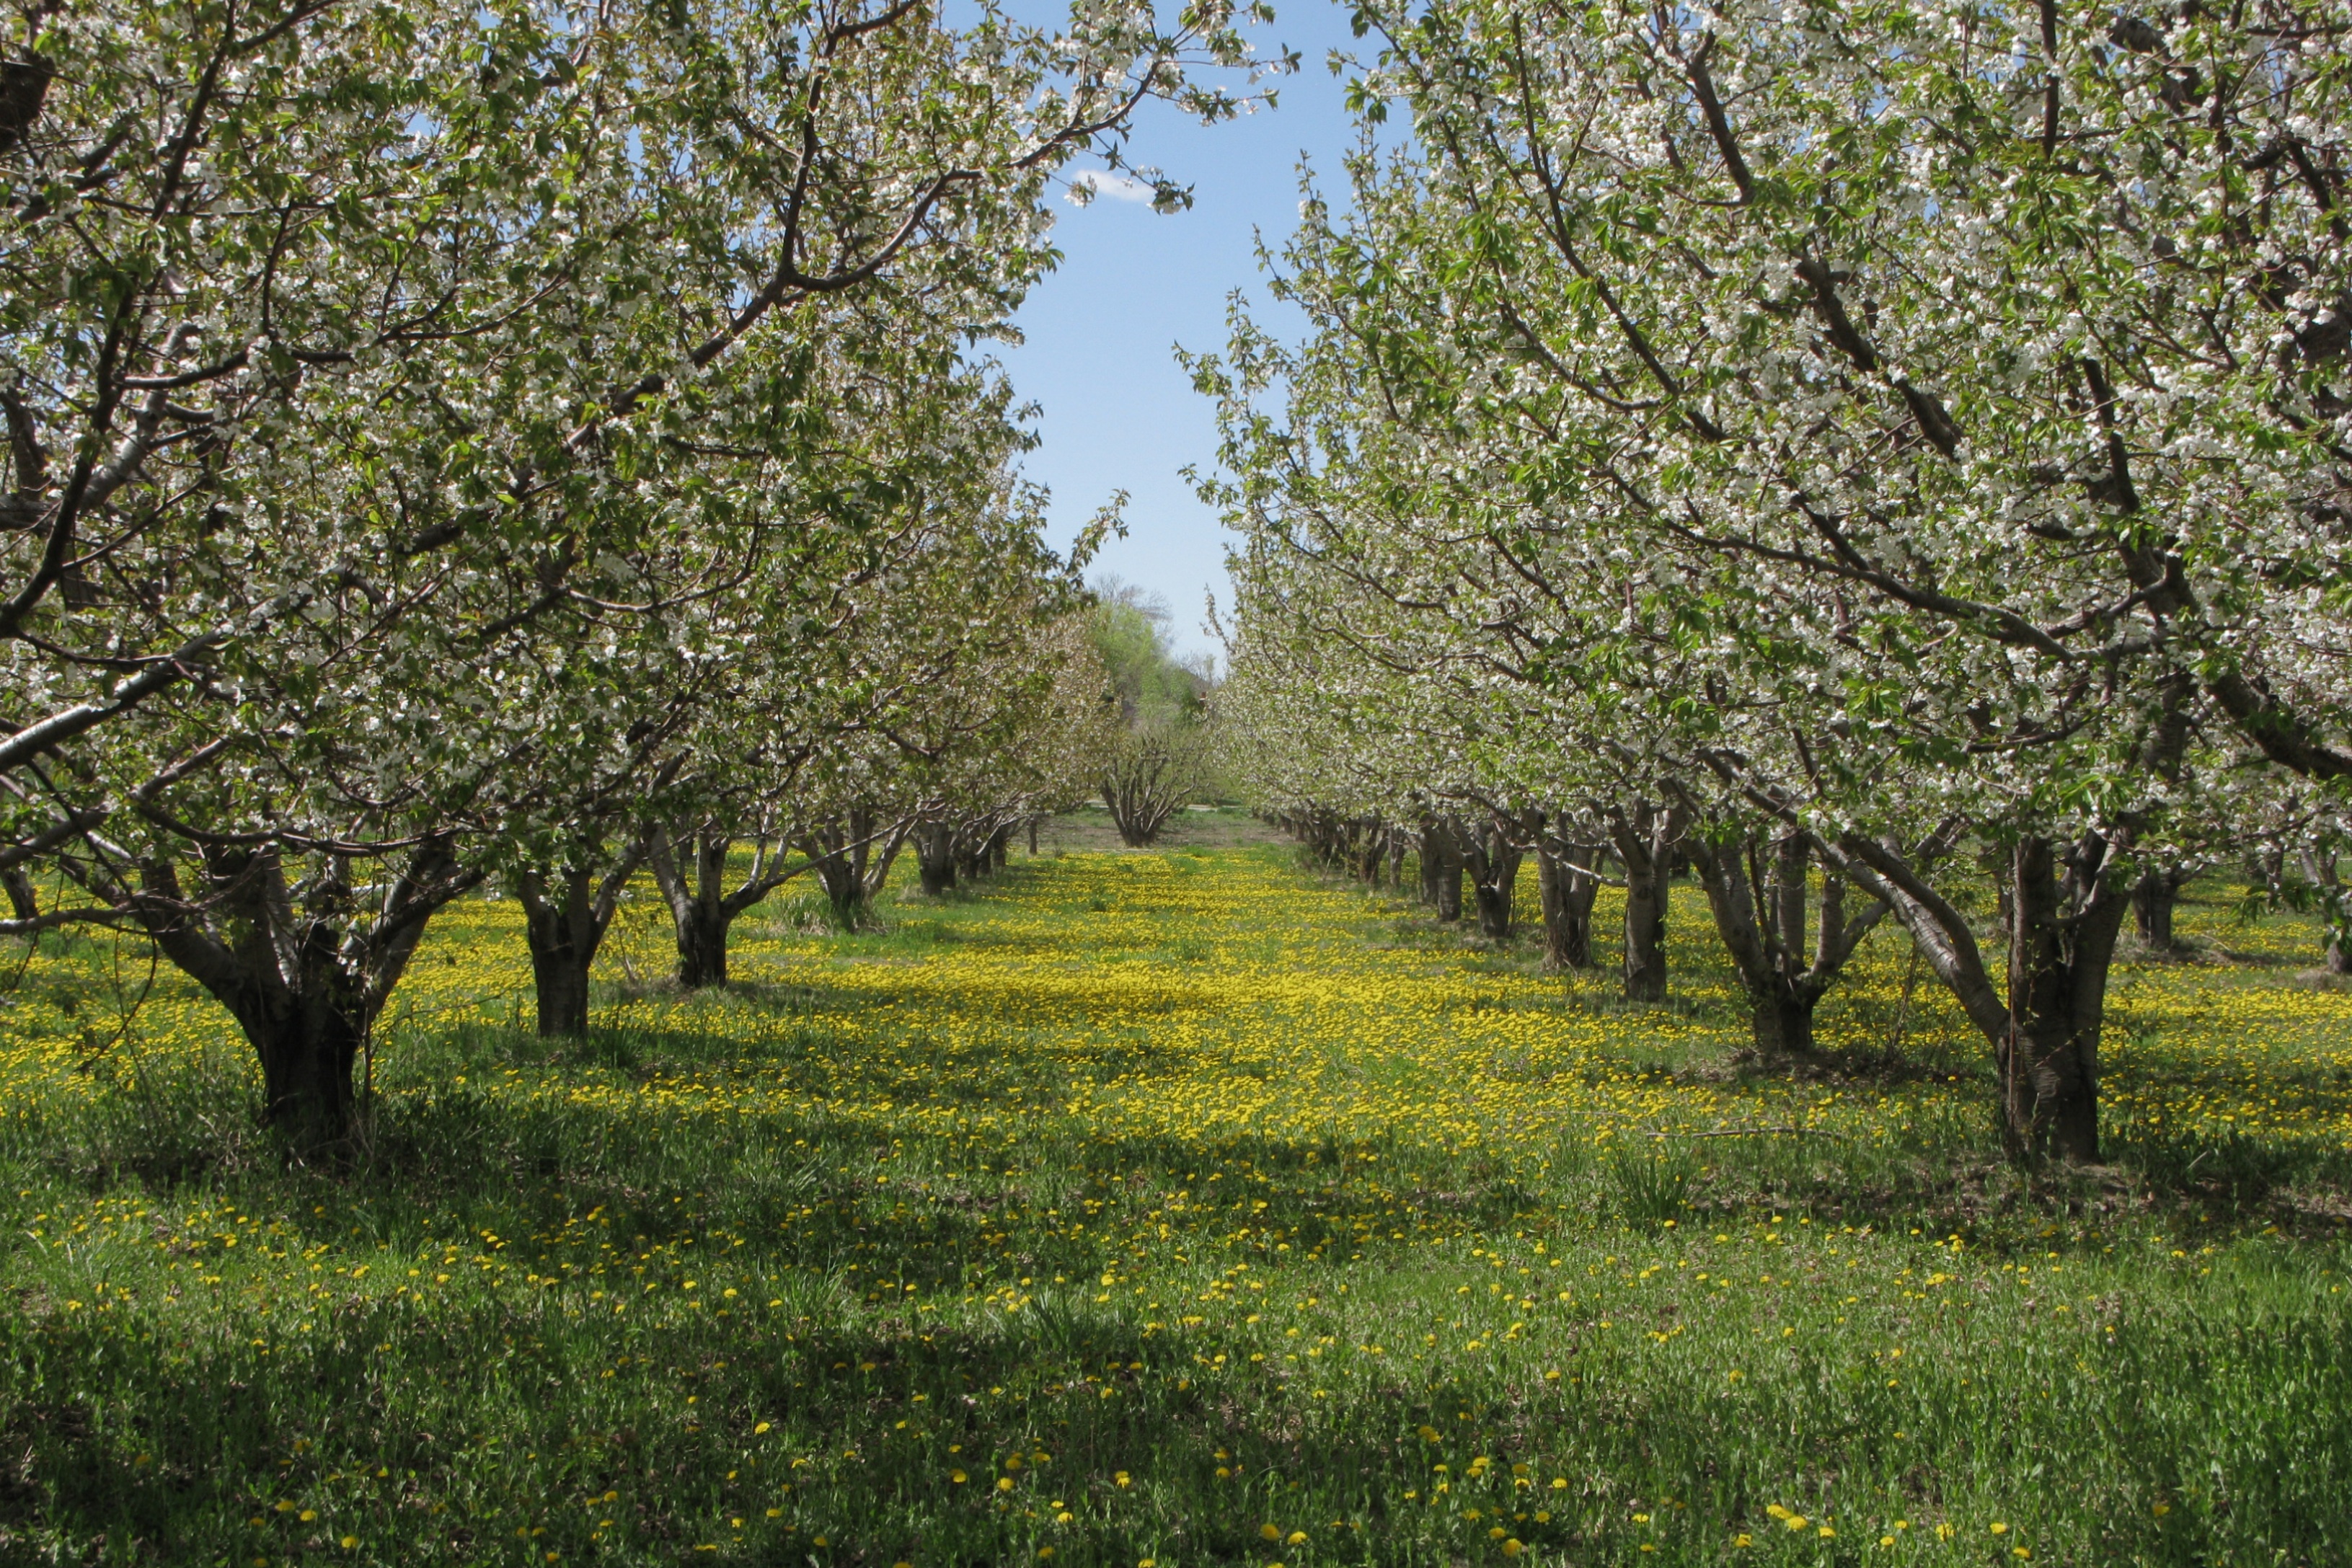
Food Independence
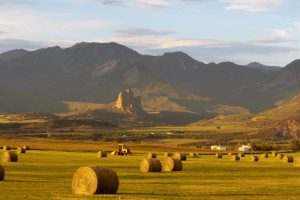
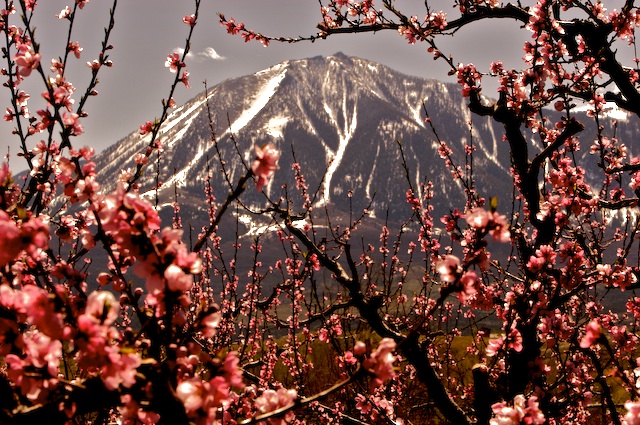
Rocky Mountain apple orchard. Photo by Celia Roberts
Domestic oil and gas production has been promoted by the industry as a means to provide the U.S. with energy independence. The argument goes something like this: “We need to be a net exporter of energy so as to reduce our reliance on foreign countries for these resources, especially countries in the Middle East.” This ignores the point that for energy security we might want to keep rather than export fossil fuels.
However, energy independence and food independence are inextricably linked.
Considering that the basic human needs are clean water, food, shelter, and safety — along with energy — we need to think about self-reliance; we can’t be dependent on foreign countries for our food. The U.S. is currently a net exporter of agricultural products, and California produces 50% of the food consumed in the U.S. But what would happen if our foodsheds became contaminated?
Drilling Proximity – Why the concern?
Front Range, Colorado working landscape at risk of unconventional oil & gas drilling. Photo by Rita Clagget
Over 58% of US agricultural market value and 74% of US farms – both conventional and organic – operate within shale basins, active shale plays, and the primary frac sand geologies.
Why is this so important? Why be concerned? Here are just a few reasons:
People can be exposed to the compounds involved with oil and gas extraction through spills, emissions, and other processes. The top five health impacts associated with these chemicals are: respiratory, nervous system, birth defects, and reproductive problems, blood disorders, and cancer.[2]
Rural gas gathering pipelines are unregulated; operators have no obligation to publicly report about incremental failures along the pipeline that may contaminate soil and water as long as they don’t require evacuations.[3]
Oil and gas operators are exempt from certain provisions of several environmental laws designed to protect public health and safety, including the Safe Water Drinking Act, The Resource Conservation and Recovery Act, The Emergency Planning and Community Right-to-Know Act, The Clean Water Act, The Clean Air Act, and The Comprehensive Environmental Response, Compensation, and Liability Act. These exemptions, in a way, permit oil and gas operators to contaminate water supplies with chemicals from their operations, in particular hydraulic fracturing fluids and produced wastewater.[4]
The gold standard of clean, chemical-free food is the USDA National Organic Program Standards, as governed by the Organic Foods Production Act. Unfortunately, organic certification does not require testing for oil and gas chemicals in water being used in organic production. The organic standard is satisfied as long as state, water, and food safety agencies deem the water safe. To our knowledge these agencies do not test for oil and gas chemicals.[5]
Based on available data spills occur regularly. Recent research has identified that the mixture of chemicals from fracking fluid and produced wastewater interact in a way that can lead to soil accumulation of these chemicals. Potentially, then, the chemicals may be absorbed by plants.[6] Fifteen chemicals often used in fracking have been identified as toxic, persistent and fast-traveling.[7] Some farms – such as those in Southern California – are being irrigated with produced water from oil and gas operations. Additionally, every single farm in the San Jaoquin Valley is within eight miles of oil and gas operations.[8]
There is significant Competition for water between natural gas production and agriculture. This includes growing commodity crops for energy, such as ethanol. Natural gas operations result in removing water quantity available for agriculture, and changing the water quality, which affects the agricultural product. In drought stricken areas, water scarcity is already an issue. In addition, extreme heat as a result of climate change is putting more stress on farmers operating in already depleted watersheds. Layered on all of this is the growing realization that precipitation regimes are gradually – and in many places dramatically – transitioning from many smaller and more predictable events to fewer, more intense, and less predictable rain and snow events which is are harder for the landscape to capture, process, and store for agricultural and/or other uses.
Operating costs: Farmers are already operating under razor- thin margins, with the cost of inputs continually increasing and the resilience of the soils and watersheds they rely upon coming into question with unconventional oil and gas’ expansion across the Midwest and Great Plains.
Public Lands
Over 45% of lands in the Western United States are owned by the federal government. Opening up public lands—by the Bureau of Land Management, United State Forest Service in particular—is controversial on multiple levels. As it relates to food security and independence, the issue often missed is that many headwaters to prime farmland reside on federal lands, along with the majority of cattle grazing.
There isn’t enough private land in the West for oil and gas operators to reach their production goals. They have to drill on public lands in order to scale up production and develop an export market for domestic natural gas. This means that public lands, taxpayer funded public lands, could potentially be used to irreparably harm prime agricultural and grazing lands (foodsheds). More alarming, is that the Trump Administration is focused on unfettered development, extraction and distribution of natural gas resources, including opening up public lands to oil and gas leasing and gutting regulations that protect us from pollution and public health risks.
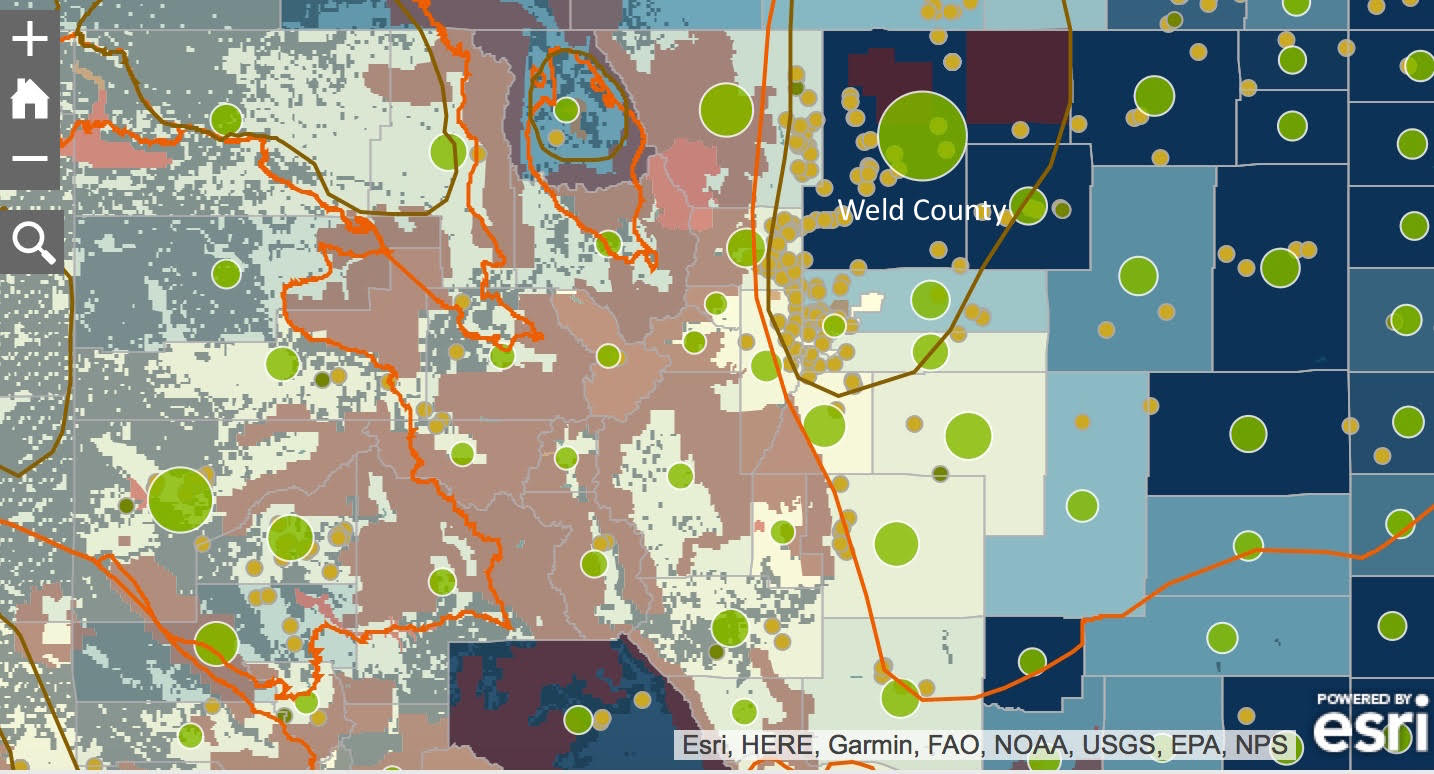
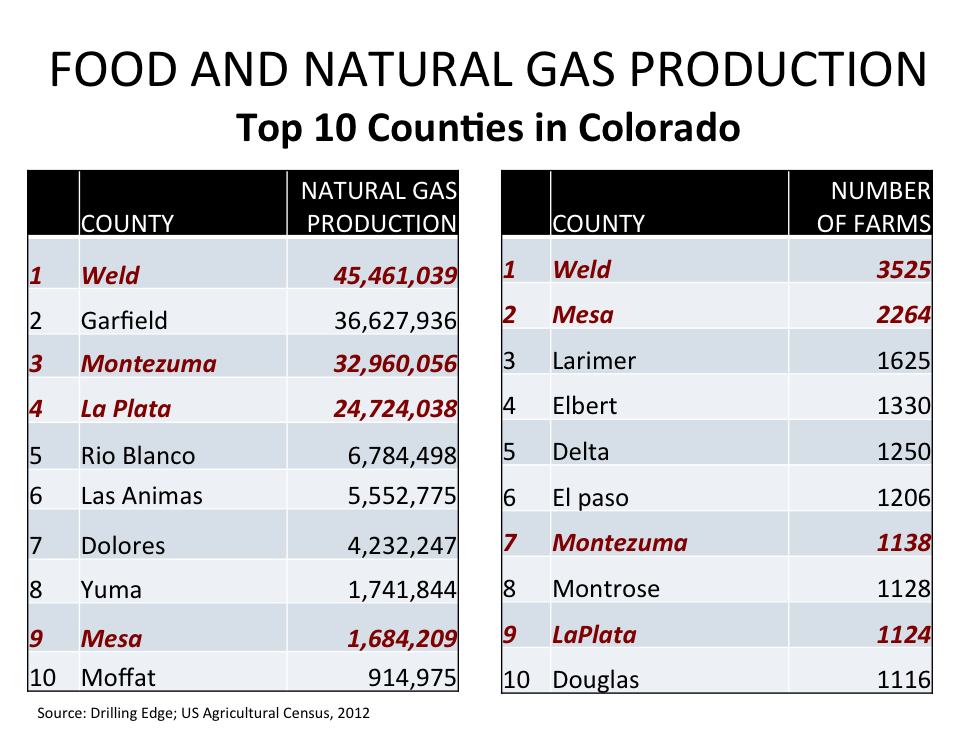
The map we have developed shows that many of the largest farms in the West are surrounded by public lands. Sixty-percent of Colorado farms are surrounded by public lands, which are within shale basins or active shale plays. Four of the top natural gas producing counties in Colorado are also four of the top agricultural producing counties: Weld, Mesa, Montezuma, and LaPlata counties. The third, fifth, sixth, eighth and tenth agricultural producing counties in the State are surrounded by public lands within shale basins, respectively,: Larimer, Delta, El Paso, Montrose and Douglas counties. The 6,325 farms in these counties represent 17% of all Colorado farms, and 29% (nearly half) of Colorado at-risk farms for being surrounded by public lands and within shale basins.
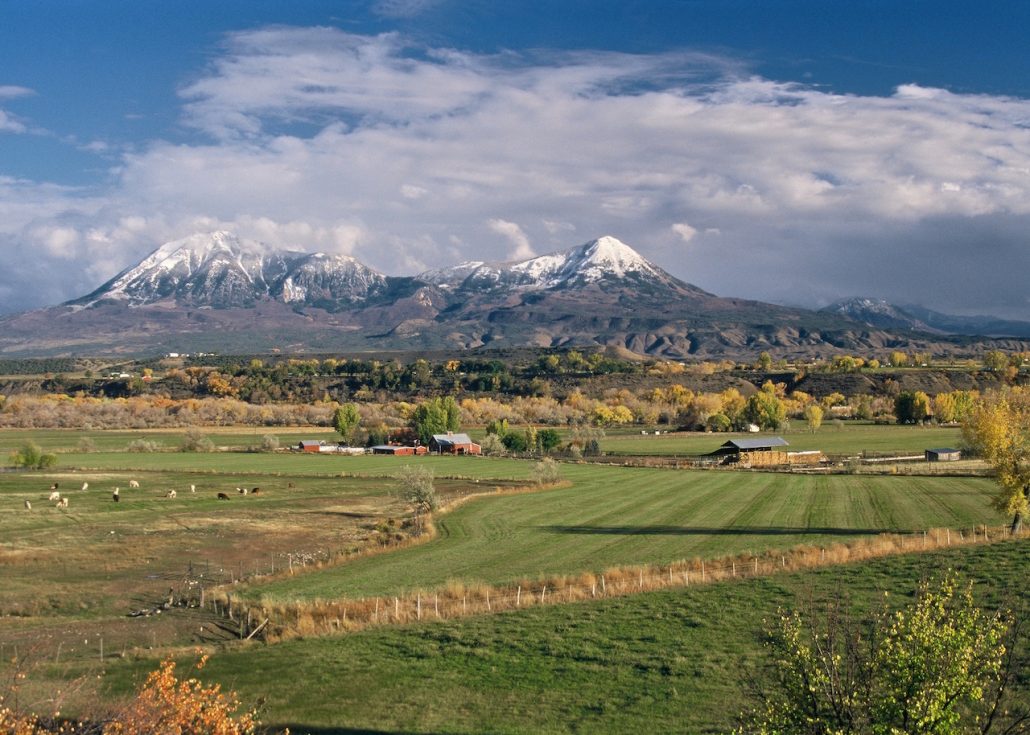
Colorado: Public lands surround majority of farms.
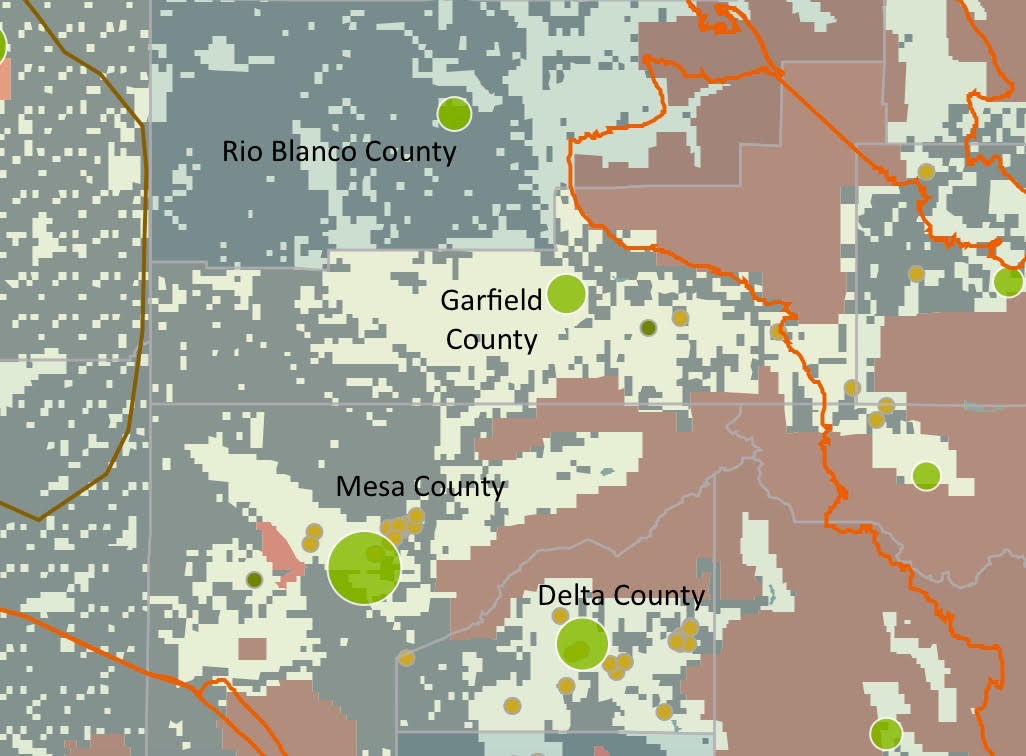
Colorado: Map zoomed into 3 of top agricultural producing and natural gas producing counties in Colorado, illustrating how they are surrounded by public lands.
These farms, headwaters, and public lands need to be protected if we are to maintain food independence and security. Producing potentially contaminated food is neither food independence, nor food security.
Policy Implications
Why should policy makers and health insurers care? Chronic and terminal illnesses are on the rise. Healthcare costs have nowhere to go but up as long as the environment we live in, the food we eat, the water we drink, and the air we breathe continue to be polluted at such a large scale. Attempts to reduce healthcare costs by insuring all Americans will have no impact if they are all sick. The insurance model only works when there are more healthy people in the pool than unhealthy people.
Mapping Conventional & Organic U.S. Farms
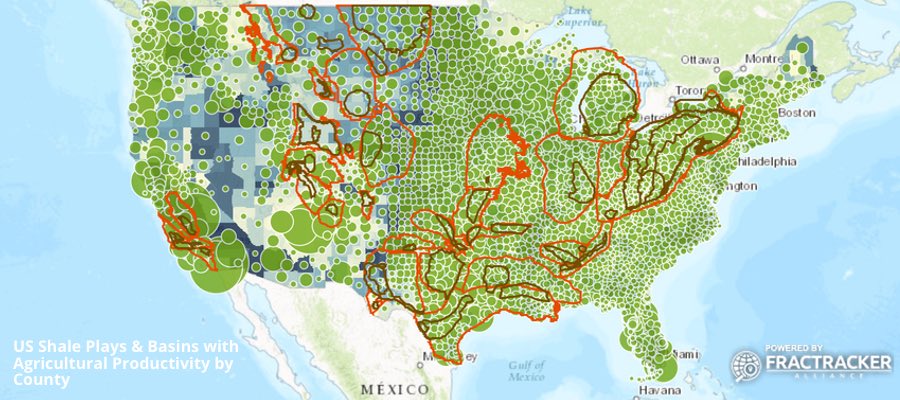
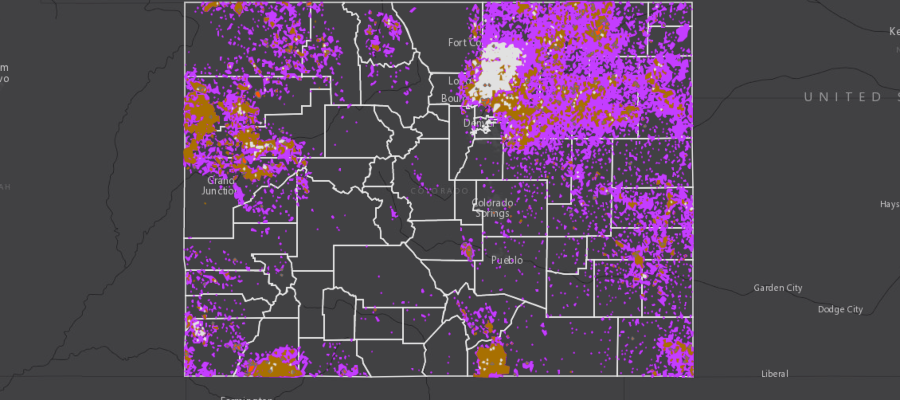
Below is an interactive map showing agricultural production in the U.S. You can use the map to zoom in at the county level to understand better the type of agricultural production taking place, as well as the value of the agricultural products at the county level.
U.S. Conventional and Organic Farms and Their Productivity Near Shale Plays and Basins
This map excludes Alaska for a variety of reasons[9]. We include over 180 unique data points for each county across five categories: 1) Crops and Plants, 2) Economics, 3) Farms, 4) Livestock and Animals, and 5) Operators. We then break these major categories into 20 subcategories.
Table 1. Subcategories Utilized in the “US Shale Plays and Basins Along with Agricultural Productivity By County” map above
Categories
Subcategories
Crops and Plants
Field Crops Harvested
Fruits, Tree Nuts, Berries, Nursery and Greenhouse
Hay and Forage Crops Harvested
Seed Crops Harvested
Vegetables and Melons Harvested
Economics
Buildings, Machinery and Equipment on Operation
Farm Production Expenses
Farm-Related Income and Direct Sales
Farms by Value of Sales
Market Value of Agricultural Products Sold
Farms
Agricultural Chemicals Used
Farms
Farms by Size
Farms by Type of Organization
Land in Farms and Land Use
Livestock and Animals
Livestock, Poultry, and Other Animals
Operators
Characteristics of Farm Operators
Hired Farm Labor
Primary Occupation of Operator
Tenure of Farm Operators and Farm Operations
Analysis Results
In total, there are 589,922 and 1,369,961 farms in US Shale Plays and Basins, respectively, averaging between 589 and 646 acres in size and spread across 2,146 counties (Figure 1). These farm counties produce roughly $87.31- 218.32 billion in agricultural products each year with the highest value per-acre being the Monterey and Monterey-Temblor Formations of Southern California, the Niobrara Formation in North Central Colorado, Eastern Barnett in North Central Texas, the Antrim in Michigan, and the Northern Appalachian Shale Basins of Pennsylvania, New York, and Ohio (Figures 2a/2b). Roughly 52% of all agricultural revenue generated in US Shale Play counties comes from livestock, poultry, and derivative products vs. a national average of 44% (Figure 3).
Put another way, the value of US Shale Basin agricultural infrastructure would rank as the 9th largest economy worldwide, between Italy and Brazil.
Family-owned farms are at the greatest risk. While corporations tend to own larger acreage farms, only 8.2% of US farms are owned by corporations. This figure is nearly halved in US Shale Plays, with 4.5% of farms owned by corporations, or 95% owned by families or individuals.
Figures 1, 2a, 2b, and 3 above show the number of farms near drilling, as well as variations in the value of agricultural products produced in those regions.
Risk vs. Benefits in CO
Oil and gas activity is regulated on a somewhat patchwork basis, but generally it is overseen at the state level subject to federal laws. New York and Maryland are the only two states that ban fracking, while communities around the country have invoked zoning laws to ban fracking or impose moratoriums on a smaller scale. However, in Colorado, the Colorado Oil and Gas Conservation Commission has exclusive jurisdiction over oil and gas regulation in the State. There, fracking bans imposed by local communities, with a large number of farms, have been found to be unconstitutional by the Colorado Supreme Court.
Weld County is Colorado’s leading producer of cattle, grain, and sugar beets. Weld is the richest agricultural county in the U.S. east of the Rocky Mountains, the fourth richest overall nationally, and the largest natural gas producer in CO. Compare this to the North Fork Valley on the Western Slope of CO, which is home to the largest concentration of organic farms in the state, one of two viticultural (wine making) areas in the state, and has a reputation for being a farm-to-table hub. Delta County, in which the North Fork Valley is located, is known for its sustainable agriculture initiatives. Uniquely, Delta County is one of the few agricultural areas in the country so far untouched by the fracking boom – but that could all change. The Bureau of Land Management is considering opening 95% of BLM lands and minerals within and surrounding Delta County to oil and gas leasing.
Protecting Food Supplies
Oil and gas extraction is taking place on both private and public lands across the country. Prime and unique agricultural lands need to be protected from these industrial activities if we are to maintain food independence and ensure a healthy food supply. As demonstrated by the map above, agricultural communities in active shale plays may already in trouble. To prevent further damages on day-to-day food staples, it is imperative to increase awareness about this consequential issue.
How can people trust that the food they eat is safe to consume? Families trust farmers, food brands, school and office cafeterias, and restaurants to the extent that the food supply chain is regulated and maintained. If most of the food produced in the U.S. is within active shale plays, and the water/soil is not being tested for oil and gas chemicals, that supply chain is at risk. The secure production of our food – via clean air, water, and soil – is tantamount to lasting food independence.
Farming Testimonials
I am the leader of Slow Food Western Slope, which functions as a chapter of Slow Food USA. We envision a world in which all people can eat food that is good for them, good for the people who grow it and good for the planet: good, clean and fair food for all. Our chapter promotes and supports over 70 farmers, orchardists, ranchers, agricultural businesses and winemakers of the North Fork Valley – all of which depend on good and clean water, air and soil. With its industrial footprint and potential damage to landscape, air, water, soil and human health, extraction industries have no place in the future of the North Fork Valley. We can build a new economy around clean food, outdoor recreation, healthy lifestyle and small nonthreatening businesses.
Jim BrettSlow Food Western Slope
Agricultural land is much more valuable in the long-run than the short-term gains promised from oil and gas extraction… As farmers we are attuned to crop, soil, and water conditions especially as a result of weather. If it’s too hot, too dry, too wet, too cold then there is no food. Natural gas extraction is an undeniable factor in changing climate and is incompatible with the practice of sustainable agriculture.
Mark WaltermireOwner of Thistle Whistle Farm in Hotchkiss, CO
References and More Information
FracTracker Alliance raised awareness of this issue in 2015 when it mapped the proximity of organic farms to oil and gas wells. In that mapping analysis, it was discovered that 11% of organic farms are within ½ mile of oil and gas development. Did you know that less than 1% of agricultural lands in the United States are used to grow crops without chemicals, and that 42% of those organic farms produce food for human consumption?
This research prompted the question of what about the other 99% of agricultural lands used to grow crops and raise livestock utilizing chemicals and other conventional methods in the United States. The majority of dairy, grains, beef, poultry, fruits, vegetables, and animal feed for livestock are produced on conventional farms. Where are they located, and do we know how they are being impacted by oil and gas development?
The majority of the US population lives in urban centers and is disconnected from the American farm, including how and where food is produced. People trust their farmer, food brands, school and office cafeterias, and restaurants to the extent that they trust their supply chain, and to the extent that the farmers trust their water supply and soils. If the majority of the food produced in the U.S. is within active shale plays, and the water and soil are not being tested for oil and gas chemicals, this research questions how people can trust that their food is safe to consume. If we are to maintain our food independence and health, not only do consumers need to understand that the food supply is at risk in order to exercise their rights to protect it at the local, state, and federal levels, but policymakers need to be informed with this data to make better decisions around oil and gas development regulations and development proposals that impact our foodsheds.
Issues with Alaskan agricultural data include incomplete reporting and large degrees of uncertainty in the data relative to the Lower 48.
By Natasha Léger, Interim Executive Director, Citizens for a Healthy Community and Ted Auch, Great Lakes Program Director, FracTracker Alliance
https://www.fractracker.org/a5ej20sjfwe/wp-content/uploads/2017/02/Agriculture-Feature-Feb2017.jpg400900Ted Auch, PhDhttps://www.fractracker.org/a5ej20sjfwe/wp-content/uploads/2025/09/2025-Wordmark-Logo.pngTed Auch, PhD2017-06-07 01:35:232021-04-15 15:02:42Health vs. Power – Risking America’s Food for Energy
https://www.fractracker.org/a5ej20sjfwe/wp-content/uploads/2020/03/TruckFeatureImage.jpg6661500Erica Jacksonhttps://www.fractracker.org/a5ej20sjfwe/wp-content/uploads/2025/09/2025-Wordmark-Logo.pngErica Jackson2020-02-28 23:18:032020-07-17 10:27:25Front Range Health Tracking Project