Ongoing Safety Concerns over Shell’s Falcon Pipeline
Ohio River Valley Groups react to a new safety warning issued by federal regulators to Shell regarding the troubled Falcon Pipeline
Ohio River Valley Groups react to a new safety warning issued by federal regulators to Shell regarding the troubled Falcon Pipeline
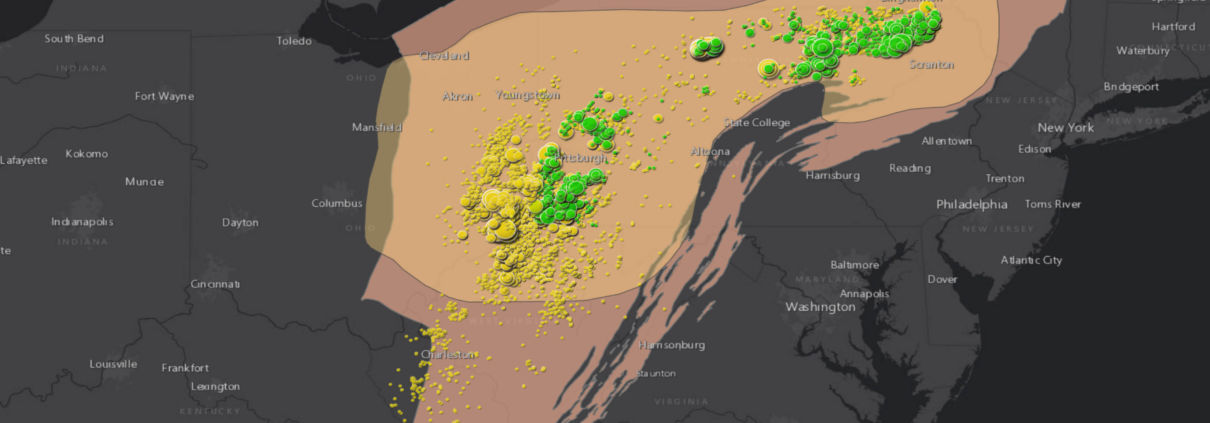
FracTracker’s aerial survey of unconventional oil & gas infrastructure and activities in northeast PA to southern OH and central WV
The Falcon Ethane Pipeline System is at the center of major investigations into possible noncompliance with construction and public safety requirements and failing to report drilling mud spills, according to documents obtained from the Pennsylvania Department of Environmental Protection (PA DEP) by FracTracker Alliance. These investigations, which are yet to be released, also uncovered instances of alleged data falsification in construction reports and Shell Pipeline Company firing employees in retaliation for speaking up about these issues.
3/17/21 Press release: https://www.fractracker.org/falcon-investigation-press-release-fractraccker-alliance/
Shell’s attempts to cut corners while constructing this 98-mile pipeline, likely motivated by the increasingly bleak economic prospects of this project, present serious public safety concerns for the thousands of residents along its route in Pennsylvania, West Virginia, and Ohio.
These allegations are serious enough to warrant immediate action. We’re calling on the Pipeline and Hazardous Materials Safety Administration (PHMSA) to thoroughly examine these allegations and suspend construction if not yet completed, or, in the case that construction is complete, operation of the Falcon Pipeline. Furthermore, we call on state environmental regulators to fully investigate construction incidents throughout the entire pipeline route, require Shell Pipeline to complete any necessary remediation, including funding independent drinking water testing, and take enforcement action to hold Shell accountable. Read our letters to these agencies here.
These investigations were featured in a March 17th article by Anya Litvak in the Pittsburgh Post-Gazette.
3/18/21 update:
Additional coverage of this story was published in a Times Online article by Daveen Ray Kurutz, a StateImpact Pennsylvania article by Reid Frazier, and an Observer-Reporter article by Rick Shrum.
According to documents obtained through a public records request, a whistleblower contacted PHMSA in 2019 with serious concerns about the Falcon, including that the pipeline may have been constructed with defective corrosion coating. PHMSA is a federal agency that regulates pipeline operation. The whistleblower also shared environmental threats occurring within the DEP’s jurisdiction, prompting the PA DEP and Pennsylvania Attorney General’s Office to get involved.
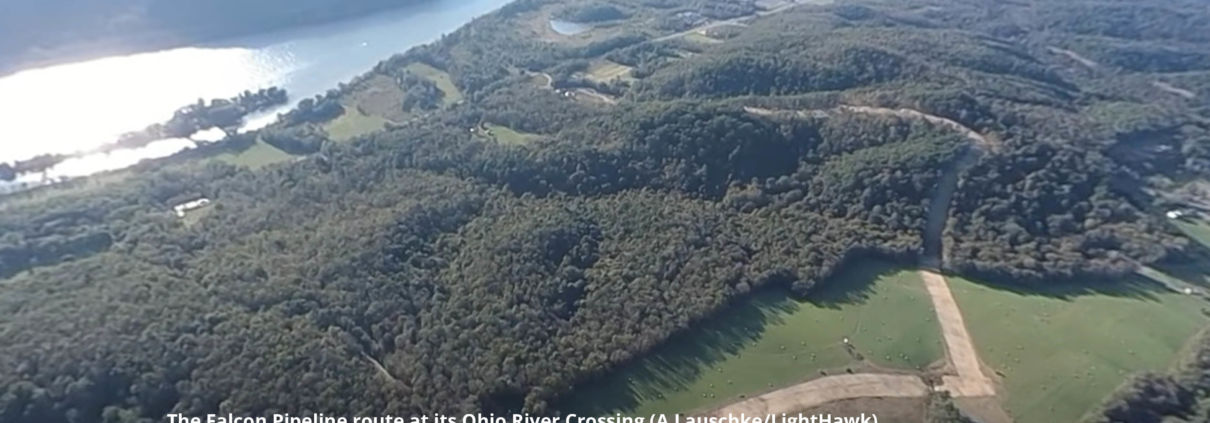
Many of the issues with the Falcon relate to a construction method used to install pipelines beneath sensitive areas like roads and rivers called horizontal directional drilling (HDD). Shell Pipeline contracted Ellingson Trenchless LLC to complete over 20 HDDs along the Falcon, including crossings beneath drinking water sources such as the Ohio River and its tributaries. FracTracker and DeSmog Blog previously reported on major drilling mud spills Shell caused while constructing HDDs and how public agencies have failed to regulate these incidents.
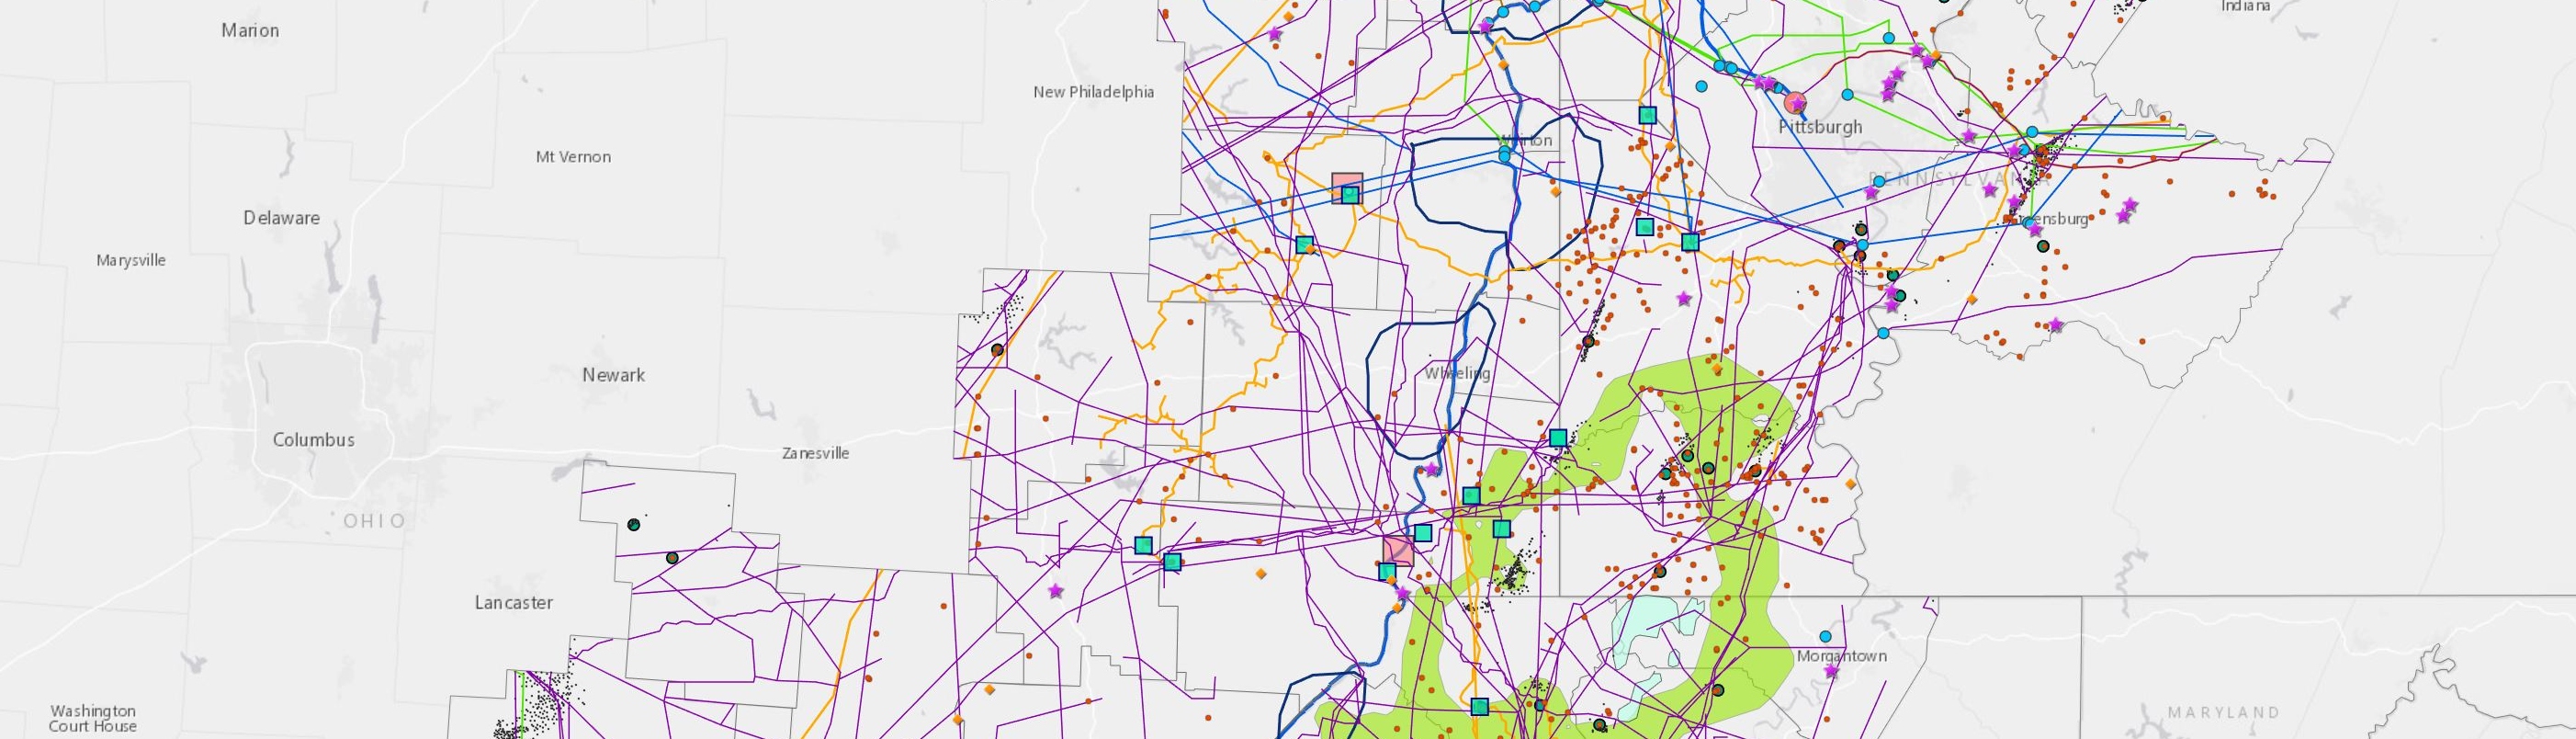
This map shows the Falcon Pipeline’s HDD crossings and spills of drilling fluid spills that occurred through 3/5/2020. To see the data sources, click on the information icon found in the upper right corner of the map header as well as under the map address bar.
View Map Full Sized | Updated 6/16/20
Correspondence between the PA DEP and PHMSA from February 26, 2020 reveal the gravity of the situation. While PHMSA conducted an inquiry into the whistleblower’s complaints in 2019 and concluded there were no deficiencies, PA DEP Secretary Patrick McDonnell wrote that his agency felt it was incomplete and urged PHMSA to conduct a more thorough investigation. Secretary McDonnell noted the PA DEP “has received what appears to be credible information that sections of Shell’s Falcon Pipeline project in western PA, developed for the transportation of ethane liquid, may have been constructed with defective corrosion coating protection,” and that “corroded pipes pose a possible threat of product release, landslide, or even explosions.”
FracTracker submitted a Freedom of Information Act request with PHMSA asking for documents pertaining to this inquiry, and was directed to the agency’s publicly available enforcement action webpage. The page shows that PHMSA opened a case into the Falcon on July 16, 2020, five months after Secretary McDonnell sent the letter. PHMSA sent Shell Pipeline Company a Notice of Amendment citing several inadequacies with the Falcon’s construction, including:
Shell responded with its amended procedures on July 27, 2020, and PHMSA closed the case on August 13, 2020.
Of note, PHMSA states it is basing this Notice on an inspection conducted between April 9th and 11th, 2019, when construction on the Falcon had only recently started. PHMSA has confirmed its investigation on the Falcon is ongoing, however we question the accuracy of self reported data given to PHMSA inspectors should be questioned
The PA DEP also brought the matter to the attention of the US Environmental Protection Agency.
The Falcon pipeline also crosses through Ohio and briefly, West Virginia. While we do not know how these states are involved in these investigations, our past analyses raise concerns about the Ohio Environmental Protection Agency’s (OEPA) ability to regulate the pipeline’s HDD crossings.
One of the focuses of the Pennsylvania DEP’s investigation is the failure to report drilling fluid spills that occur while constructing a HDD crossing. The PA DEP shut down all HDD operations in November, 2019 and forced Shell to use monitors to calculate spills, as was stated in permit applications.
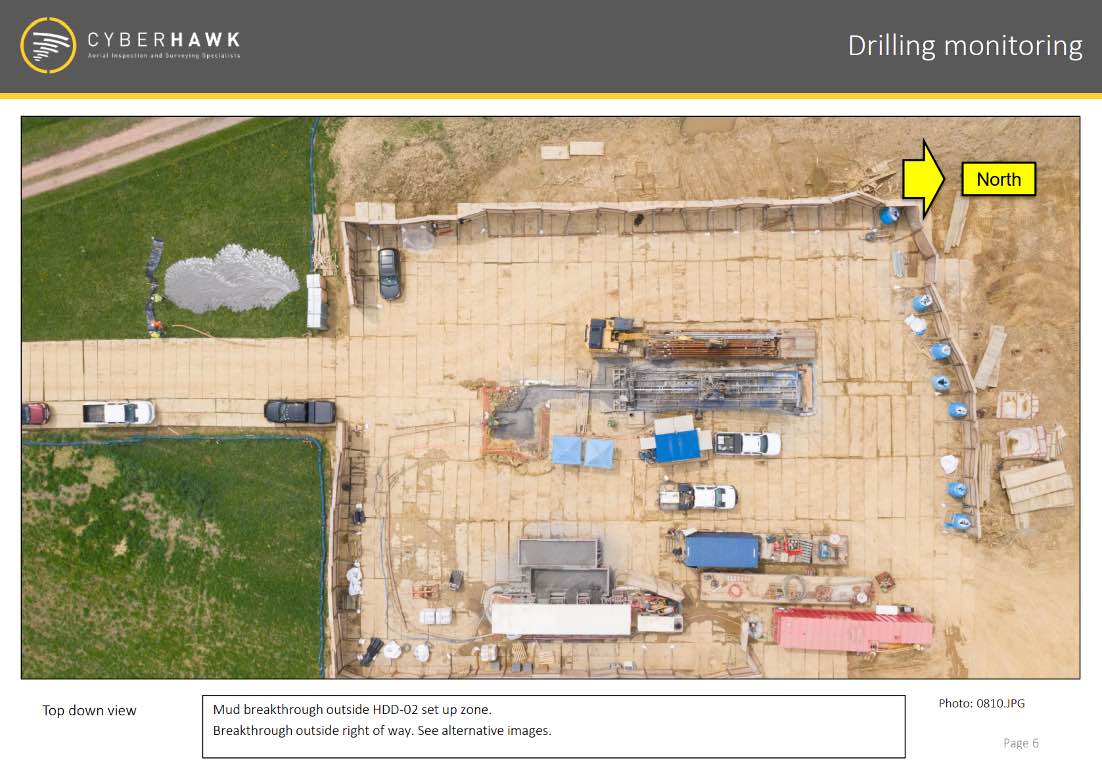
A horizontal directional drilling (HDD) construction site for the Falcon Pipeline in Southview, Washington County, Pennsylvania. You can see where the drilling mud has returned to the surface in the top left of the photo. Photo by Cyberhawk obtained by FracTracker Alliance through a right-to-know request with the Pennsylvania Department of Environmental Protection.
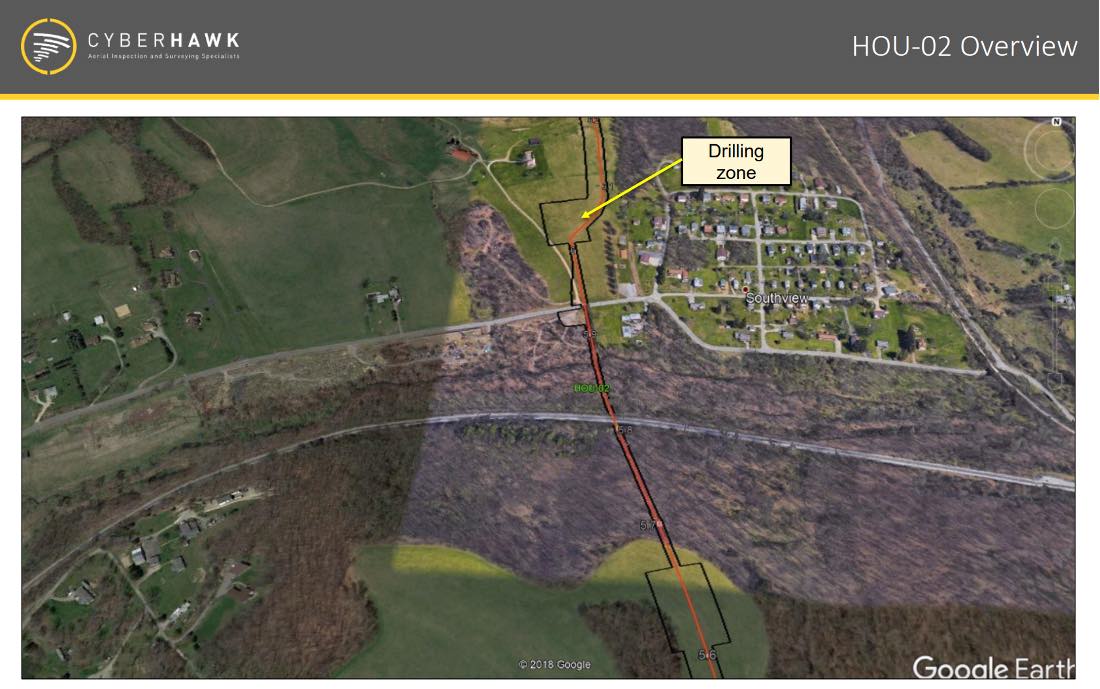
The Falcon Pipeline’s HDD locations are often close to neighborhoods, like the HOU-02 crossing in Southview, Washington County, Pennsylvania. Photo by Cyberhawk obtained by FracTracker Alliance through a right-to-know request with the Pennsylvania Department of Environmental Protection.
To our knowledge, the OEPA did not enforce this procedure, instead relying on workers to manually calculate and report spills. Shell’s failure to accurately self-report raises concerns about the safety of the Falcon’s HDD crossings in Ohio, including the crossing beneath the Ohio River, just upstream of drinking water intakes for Toronto and Steubenville, Ohio.
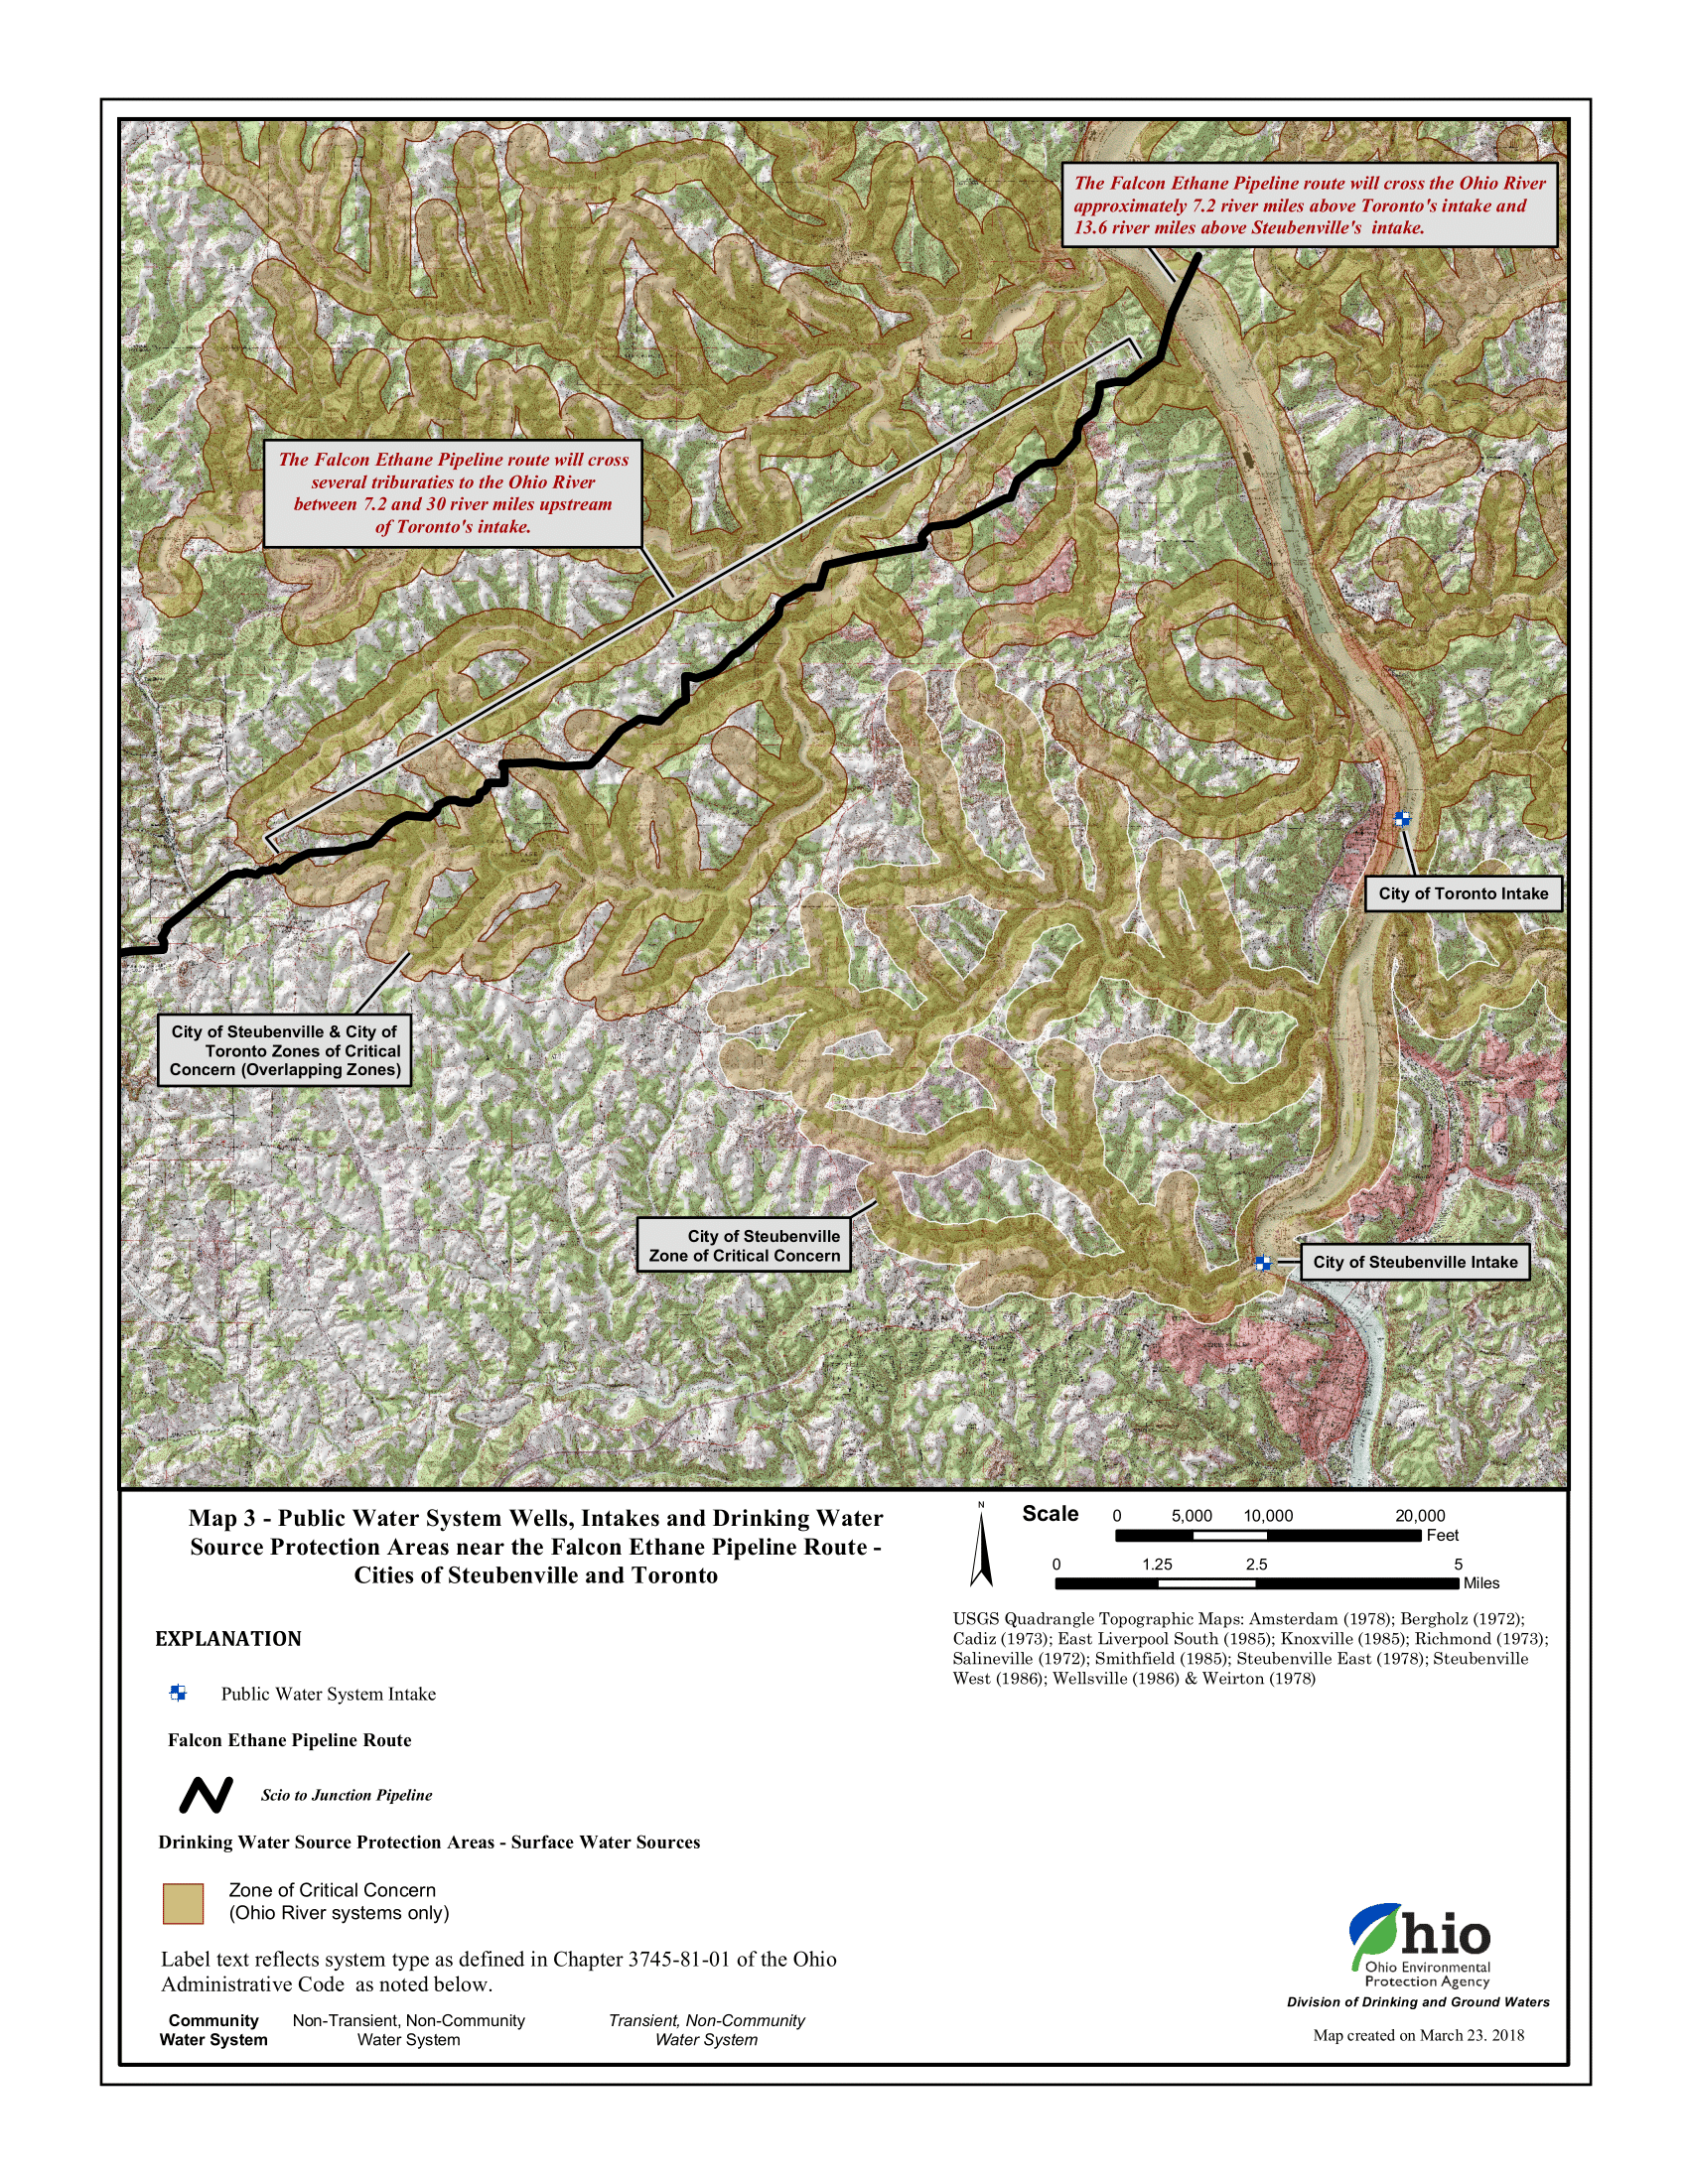
Public water system wells, intakes, and Drinking Water Source Protection Areas nears the Falcon Pipeline Route. Note, the pipeline route may have slightly changed since this map was produced. Source: Ohio EPA
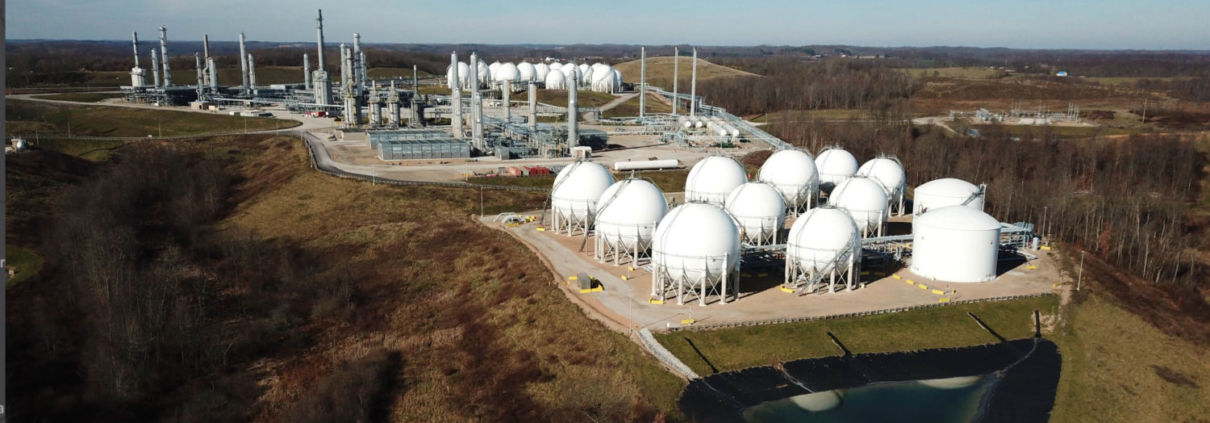
The Falcon is connected to one of Shell’s most high-profile projects: a $6 billion to $10 billion plastic manufacturing plant, commonly referred to as the Shell ethane cracker, in Beaver County, Pennsylvania. These massive projects represent the oil and gas industry’s far-fetched dream of a new age of manufacturing in the region that would revolve around converting fracked gas into plastic, much of which would be exported overseas.
Many in the Ohio River Valley have raised serious concerns over the public health implications of a petrochemical buildout. The United States’ current petrochemical hub is in the Gulf Coast, including a stretch of Louisiana known colloquially as “Cancer Alley” because of the high risk of cancer from industrial pollution.
Construction of the ethane cracker and the Falcon pipeline have forged forward during the COVID-19 pandemic. In another example of the culture of fear at the worksite, several workers expressed concern that speaking publicly about unsafe working conditions that made social distancing impossible would cost them their jobs. Yet the state has allowed work to continue on at the plant, going so far as to grant Shell the approval to continue work without the waiver most businesses had to obtain. As of December 2020, over 274 Shell workers had contracted the coronavirus.
While the oil and gas industry had initially planned several ethane crackers for the region, all companies except for Shell have pulled out or put their plans on hold, likely due to the industry’s weak financial outlook.
A June 2020 report by the Institute for Energy Economics and Financial Analysis (IEEFA), stated that:
Royal Dutch Shell owes a more complete explanation to shareholders and the people of Pennsylvania of how it is managing risk. Shell remains optimistic regarding the prospects for its Pennsylvania Petrochemical Complex in Beaver County, Penn. The complex, which is expected to open in 2021 or 2022, is part of a larger planned buildout of plastics capacity in the Ohio River Valley and the U.S. IEEFA concludes that the current risk profile indicates the complex will open to market conditions that are more challenging than when the project was planned. The complex is likely to be less profitable than expected and face an extended period of financial distress.
Many of Pennsylvania’s elected officials have gone to great lengths to support this project. The Corbett administration enticed Shell to build this plastic factory in Pennsylvania by offering Shell a tax break for each barrel of fracked gas it buys from companies in the state and converts to plastic (valued at $66 million each year). The state declared the construction site a Keystone Opportunity Zone, giving Shell a 15-year exemption from state and local taxes. In exchange, Shell had to provide at least 2,500 temporary construction jobs and invest $1 billion in the state, giving the company an incredible amount of power to decide where resources are allocated in Pennsylvania.
Would the state have asked Shell for more than 2,500 construction jobs if it knew these jobs could be taken away when workers spoke out against life-threatening conditions? Will the politicians who have hailed oil and gas as the only job creator in the region care when workers are forced to hide their identity when communicating with public agencies?
The PA DEP appears to have played a key role in calling for this investigation, yet the agency itself was recently at the center of a different investigation led by Pennsylvania Attorney General Josh Shapiro. The resulting Investigating Grand Jury Report revealed systematic failure by the PA DEP and the state’s Department of Health to regulate the unconventional oil and gas industry. One of the failures was that the Department seldom referred environmental crimes to the Attorney General’s Office, which must occur before the Office has the authority to prosecute.
The Office of Attorney General is involved in this investigation, which the PA DEP is referring to as noncriminal.
The Grand Jury Report also cited concerns about “the revolving door” that shuffled PA DEP employees into higher-paying jobs in the oil and gas industry. The report cited examples of PA DEP employees skirting regulations to perform special favors for companies they wished to be hired by. The watchdog research organization Little Sis listed 47 fracking regulators in Pennsylvania that have moved back and forth between the energy industry, including Shell’s Government Relations Advisor, John Hines.
The Falcon Pipeline sits empty as people across the nation are amping up pressure on President Biden to pursue bold action in pursuit of environmental justice and a just transition to clean energy. Following Biden’s cancellation of the Keystone XL pipeline, Indigenous leaders are calling for him to shut down other projects including Enbridge Line 3 and the Dakota Access Pipeline.
Over a hundred groups representing millions of people have signed on to the Build Back Fossil Free campaign, imploring Biden to create new jobs through climate mobilization. Americans are also pushing Biden to be a Plastic Free President and take immediate action to address plastic pollution by suspending and denying permits for new projects like the Shell ethane cracker that convert fracked gas into plastic.
If brought online, the Falcon pipeline and Shell ethane cracker will lock in decades of more fracking, greenhouse gasses, dangerous pollution, and single-use plastic production.
Just as concerning, Shell will need to tighten its parasitic grip on the state’s economic and legislative landscape to keep this plant running. Current economic and political conditions are not favorable for the Shell ethane cracker: financial analysts report that its profits will be significantly less than originally presented. If the plant is brought online, Shell’s lobbyists and public relations firms will be using every tactic to create conditions that support Shell’s bottom line, not the well-being of residents in the Ohio River Valley. Politicians will be encouraged to pass more preemptive laws to block bans on plastic bags and straws to keep up demand for the ethane cracker’s product. Lobbyists will continue pushing for legislation that imposes harsh fines and felony charges on people who protest oil and gas infrastructure, while oil and gas companies continue to fund police foundations. Shell will ensure that Pennsylvania keeps extracting fossil fuels to feed its ethane cracker.
The Falcon pipeline is at odds with global demands to address plastic and climate crises. As these new documents reveal, it also poses immediate threats to residents along its route. While we’re eager for more information from state and federal agencies to understand the details of this investigation, it’s clear that there is no safe way forward with the Falcon Pipeline.
Royal Dutch Shell has been exerting control over people through the extraction of their natural resources ever since it began drilling for oil in Dutch and British colonies in the 19th Century. What will it take to end its reign?
Health & Safety | Legislation & Politics | Petrochemicals & Plastics | Pipelines
A new collaboration between FracTracker Alliance and Algalita is aiming to help middle school and high school students understand the connection between plastics and fracking — and the wide ranging implications for climate change, environmental injustice, and human health.
Most young people today understand that plastics are problematic. But, there is still often a disconnect between the symptom of plastics in our oceans, and the root causes of the problem. Algalita’s mission is to empower a new generation of critical thinkers to shift the broken and unjust systems that are causing the plastic pollution crisis. Algalita’s strategy is creating educational experiences directly with the movement’s diverse leaders, and this new project with FracTracker is a perfect example.
Specifically, Algalita and FracTracker have been working together to add new lessons to Algalita’s brand-new online, gamified, action platform: Wayfinder Society. Through this program, students can guide their own exploration of the complexities of the plastics issue, and can take action at their own pace and scale, by completing lessons and action-items (called Waymarks) based on difficulty, topic, and type of impact.
The first of two FracTracker Waymarks outlines the connection between fracking and plastic production. Students explore a map showing the full plastics production process from fracking pads, to pipelines, to ethane crackers, and packaging factories.
In a second Waymark that builds off of the first, students explore the massive petrochemical buildout on the Gulf Coast and in the Ohio River Valley. The map allows students to analyze the greenhouse gas emissions predicted for this buildout using the data point pop-up boxes. They can also examine the effects of climate change on communities amongst the buildout by viewing the coastal flood zone areas in Texas and Louisiana. Beyond that, students can investigate how facilities are impacting their peers in schools close to massive ethane cracker facilities. Finally, students are introduced to the movement’s #PlasticFreePresident Campaign, giving them a direct action to apply their new knowledge.
This StoryMap was created by FracTracker for Wayfinder Society, a program by Algalita. Learn more at Algalita.org. Place your cursor over the image and scroll down to advance the StoryMap and explore a series of maps charting the fracking-for-plastic system. Click on the icon in the bottom left to view the legend. Scroll to the end of the StoryMap to learn more and access the data sources.
View Full Sized Map | Updated 11/20
Algalita is excited about this partnership for so many reasons. For one, GIS is a critical skill for young people to learn. These two Waymarks pose an accessible and non-intimidating introduction to ArcGIS by using simple maps and StoryMaps like the one above. The maps let students get comfortable with GIS concepts and capabilities like layers, data attribute tables, measuring tools, and filters. Allowing students to explore how plastics are produced through a geographical lens provides a unique visual and interactive experience for them. The goal is for students to be able to connect petrochem buildout, with the plastics, climate and justice issues that they are focusing on — often separately. Our aim is that by putting this part of the story in context of real physical space they will more easily make those connections. We hope these lessons spark some students’ interest in mapping, geography, and GIS, providing a new generation of changemakers with GIS in their toolbox.
On top of that, we are stoked to be building this partnership with FracTracker because the success of our collective movement depends on strong, clear communication and synergies between the nodes of the movement’s network. The FracTracker Waymarks give our Wayfinders direct access to real-time data, visualizations, and expert insights that they can then use to level-up their actions and stories around their activism. And, they connect the dots not just for students, but also for educators and movement partners like us at Algalita — we are all for this powerful lever for change!
Check out Wayfinder Society here. Access the FracTracker Waymarks here and here — but you’ll need to be logged in. If you’re a student, get started by creating a profile, and then start earning Cairns (points)! If you’re an educator, parent or mentor, and interested in exploring the site, email us here for the guest login.
By Anika Ballent, Education Director, Algalita
Algalita empowers a new generation of critical thinkers who will shift the broken and unjust systems that are causing the plastic pollution crisis. We do this by offering educational experiences created directly with the movement’s diverse leaders.
Anika has been working in the movement against plastic pollution for ten years, studying microplastics in benthic and freshwater environments. She brings together her science background and creativity to educate young changemakers through hands-on experiences in schools, Algalita’s International Youth Summit, and online programs.
Data Sources:
Fracked Wells: Pennsylvania Department of Environmental Protection
ATEX Pipeline: EIA
Railroad: Selection from ArcGIS online
Process information: Houston Chronicle
Falcon Pipeline: Shell/AECOM and FracTracker Alliance
Mariner East 2 Pipeline: PA DEP
Greenhouse gas emission increases: Environmental Integrity Project. (2020, November 30). Emission Increase Database. Retrieved from https://environmentalintegrity.org/oil-gas-infrastructure-emissions.
All other data points were mapped by FracTracker Alliance referencing various online sources. While this map is based on actual infrastructure, it is intended as a model of the fracking-for-plastic lifecycle and certain steps may vary in real life.
Fracking produces more than just oil and gas — billions of gallons of highly toxic waste are also created in the process. Regulatory loopholes have led to limited oversight into how this waste is tracked and treated, putting public health and safety at risk.
The maps below explore issues related to fracking waste from the Marcellus and Utica Shale regions of Pennsylvania, Ohio, New York, and West Virginia.
This mapping platform is an evolving tool based on available data — yet the opaqueness of the fracking industry limits our ability to map and analyze the full scope of the problem of fracking waste in the Appalachian Basin.
Unfortunately, even after sifting through thousands of data points, we’re left with many outstanding questions — what are the chemical components of the waste created? Where is it all sent? Where are its byproducts sent? What facilities are being planned and proposed? How much illegal dumping occurs?
The production of fracking waste in the Appalachian Basin will continue to create environmental and public health threats for decades after the industry leaves the region. Wells can continue to generate wastewater for years and contaminated equipment sent to landfills will leach toxins into the environment. Furthermore, with the industry’s history of failing to restore land after it has been used for oil and gas operations, we can expect abandoned fracking sites to become an increasing source of pollution in the Appalachian Basin in the coming decades. It’s imperative that the public have access to accurate and detailed data on fracking waste to protect the health of workers and residents.
By Erica Jackson, Community Outreach & Communications Specialist, FracTracker Alliance
The virtual story map is live!
In this special one-day fundraiser event, two intrepid FracTracker teams will build and share a live virtual map as we travel throughout the Ohio River Valley Region documenting oil, gas, and its effects on our health, climate, and environment.
We’ll share our findings to build awareness about the plight of this region—and so many other places victimized by this rogue industry. Plus, viewers will gain a firsthand understanding of how FracTracker turns data into real-world impact.
Proceeds will benefit the ongoing work of FracTracker to decarbonize our economy and promote environmental justice.
Whether you are able to contribute financially at this time or not, we hope you’ll join us on this virtual journey. You’ll see regular video updates along the way as we share our progress, and watch as a story map is updated throughout the day.
Join our team of explorers in spirit and pledge your support! We’re excited to share this journey with you.
By Ted Auch, PhD, Great Lakes Program Coordinator and Shannon Smith, Manager of Communications & Development
The oil and gas industry continues to use rhetoric focusing on national security and energy independence in order to advocate for legislation to criminalize climate activists. Backlash against protestors and environmental stewards has only increased since the onset of COVID-19, suggesting that industry proponents are exploiting this public health crisis to further their own dangerous and controversial policies.[1]
Industry actors contributing to the wave of anti-protest bills include American Petroleum Institute (API), IHS Markit, The American Fuel & Petrochemical Manufacturers (AFPM), and most effectively, the American Legislative Exchange Council (ALEC), by way of its primary financial backer, Koch Industries (Fang, 2014, Shelor, 2017).
ALEC is the source of the model legislation “Critical Infrastructure Protection Act” of 2017, intended to make it a felony to “impede,” “inhibit,” “impair,” or “interrupt” critical infrastructure operation and/or construction. Close approximations – if not exact replicas – of this legislative template have been passed in 11 hydrocarbon rich and/or pathway states, and 8 more are being debated in 4 additional states.
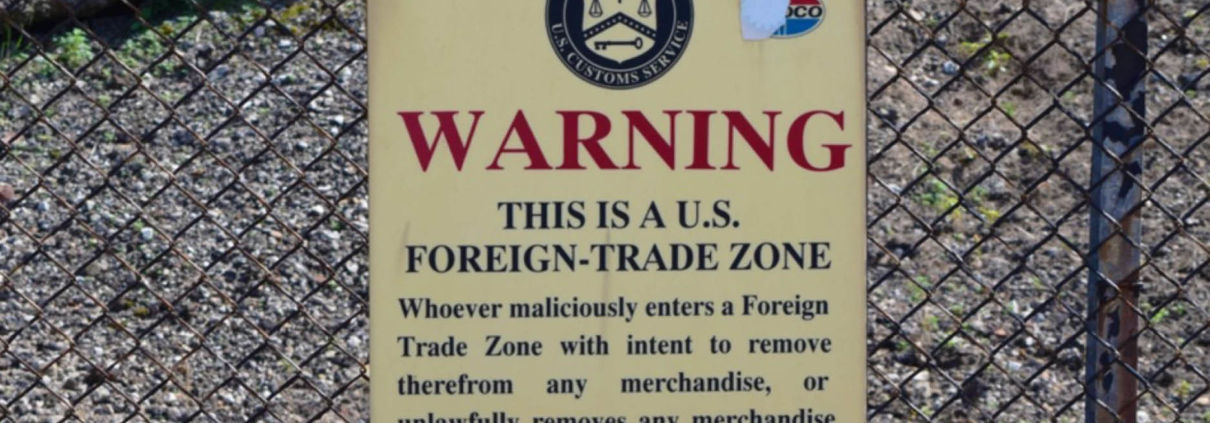
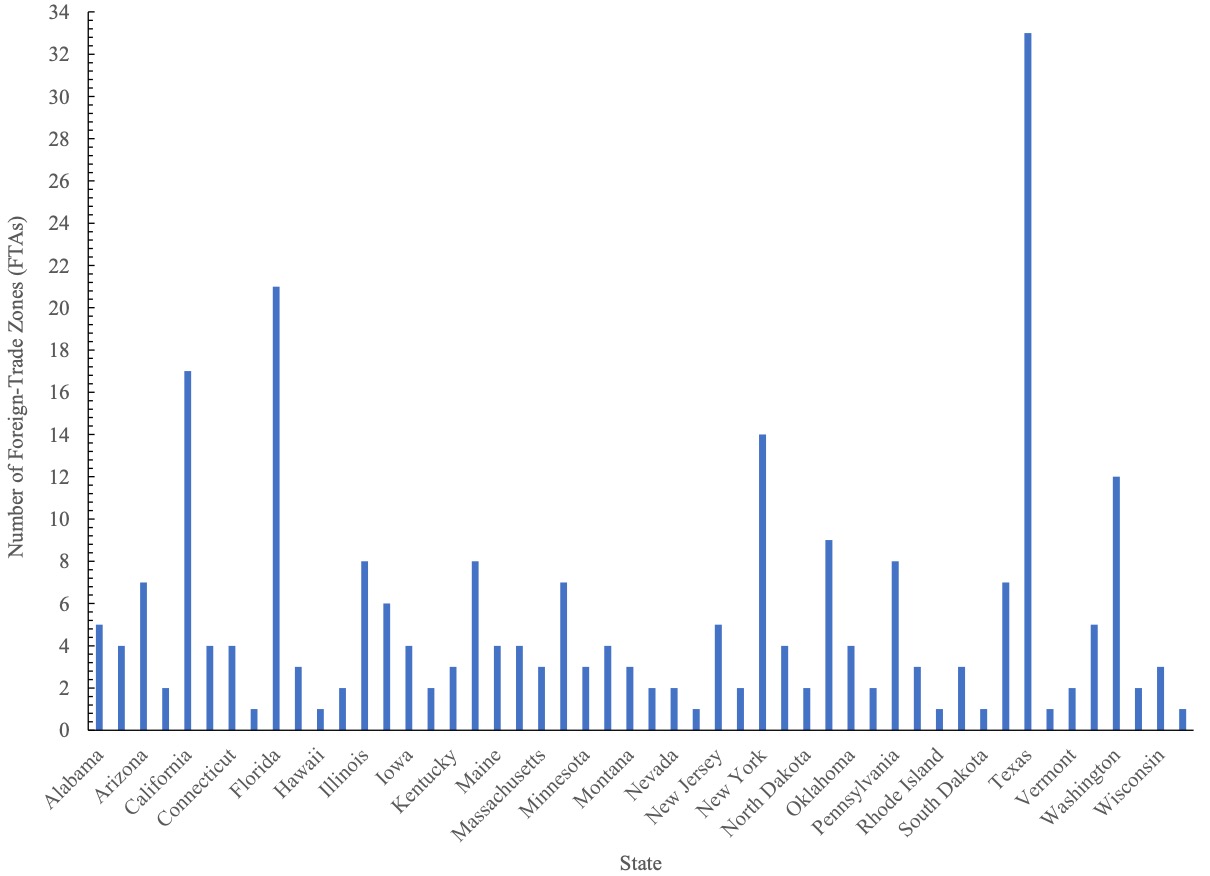
The “critical infrastructure” designation in ALEC’s “Critical Infrastructure Protection Act” is extremely broad, including over 70 pieces of infrastructure, from wastewater treatment and well pads, to ports and pipelines. However, along with the 259 Foreign Trade Zones (FTZ) (Figures 1 and 4) supervised by US Customs and Border Protection (CBP), security is of such importance because over 50% of this infrastructure is related to oil and gas. According to our analysis, there are more than 8,000 unique pieces of infrastructure that fall under this designation, with over 10% in the Marcellus/Utica states of Ohio, West Virginia, and Pennsylvania. See Figure 1 for the number of FTZ per state.
Regarding FTZ, the US Department of Homeland Security doesn’t attempt to hide their genuine nature, boldly proclaiming them “… the United States’ version of what are known internationally as free-trade zones … to serve adequately ‘the public interest’.” If there remains any confusion as to who these zones are geared toward, the US Department of Commerce’s International Administration (ITA) makes the link between FTZ and the fossil fuel industry explicit in its FTZ FAQ page, stating “The largest industry currently using zone procedures is the petroleum refining industry.” (Figure 2)
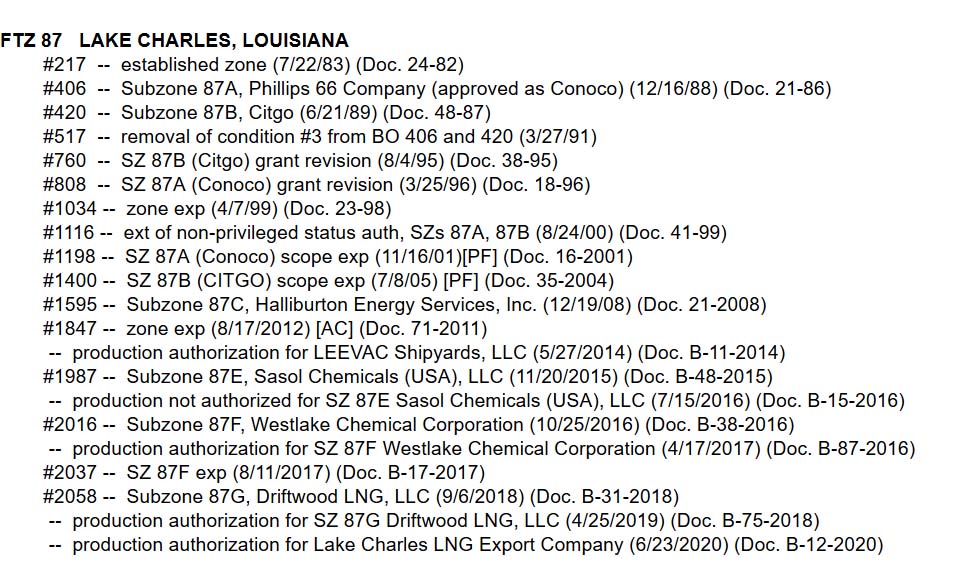
Foreign-Trade Zone (FTZ) Board of Actions in Zone 87 in Lake Charles, Louisiana
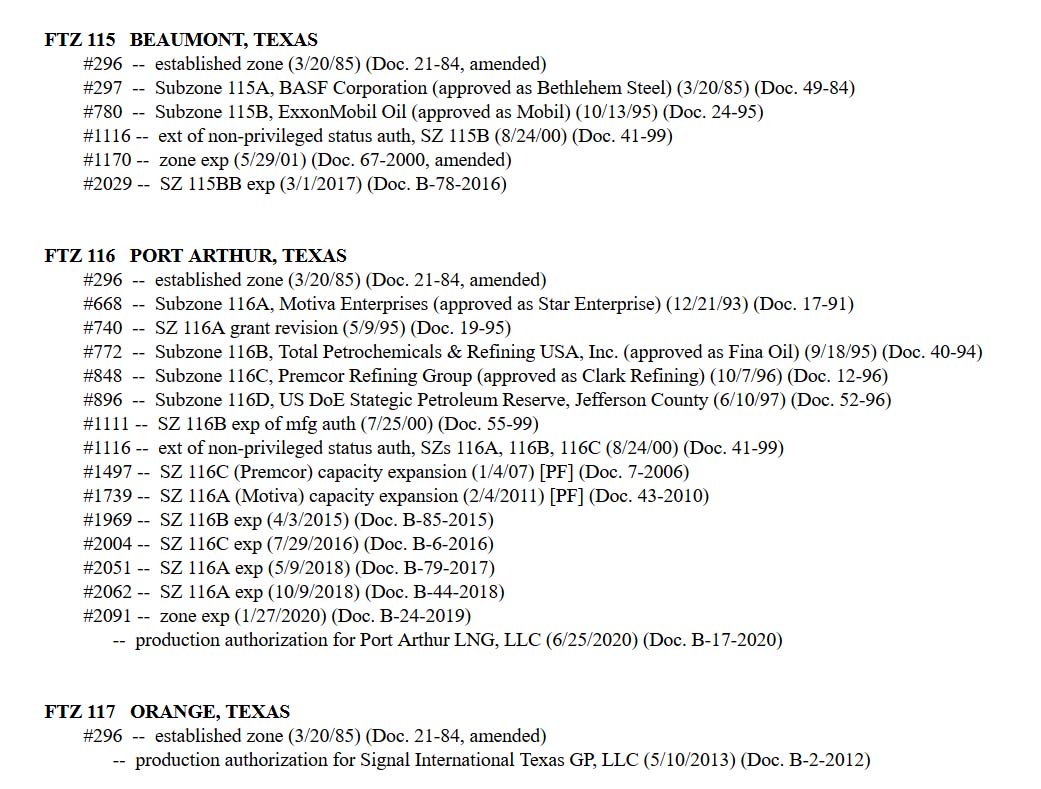
Foreign-Trade Zone (FTZ) Board of Actions in Zones 115-117 in and around Port Arthur, Texas
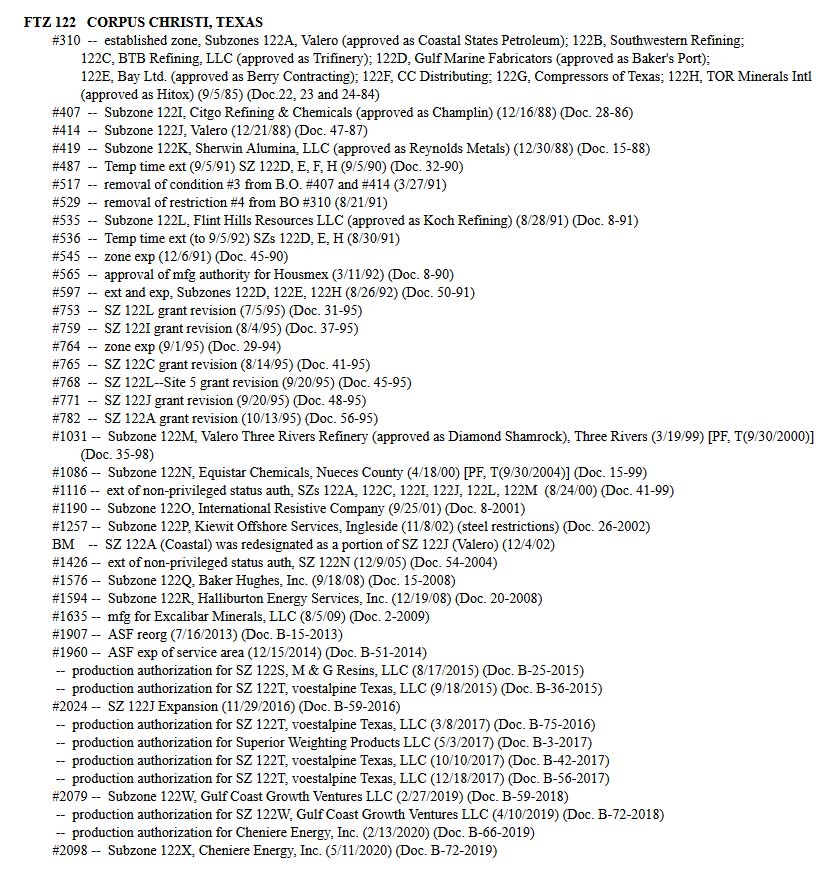
Foreign-Trade Zone (FTZ) Board of Actions in Zone 122 in Corpus Christi, Texas
Much of the oil, gas, and petrochemical industries’ efforts stem from the mass resistance to the Dakota Access Pipeline (DAPL). Native American tribes and environmental groups spent months protesting the environmentally risky $3.78 billion dollar project, which began production in June 2017, after Donald Trump signed an executive order to expedite construction during his first week in office. The Standing Rock Sioux tribe also sued the US government in a campaign effort to protect their tribal lands. The world watched as Energy Transfer Partners (ETP), the company building the pipeline, destroyed Native artifacts and sacred sites, and as police deployed tear gas and sprayed protesters with water in temperatures below freezing.
ETP’s bottom line and reputation were damaged during the fight against DAPL. Besides increasingly militarized law enforcement, the oil and gas industry has retaliated by criminalizing similar types of protests against fossil fuel infrastructure. However, the tireless work of Native Americans and environmental advocates has resulted in a recent victory in March 2020, when a federal judge ordered a halt to the pipeline’s production and an extensive new environmental review of DAPL.
Just days ago, on July 6, 2020, a federal judge ruled that DAPL must shut down until further environmental review can assess potential hazards to the landscape and water quality of the Tribe’s water source. This is certainly a victory for the Standing Rock Sioux Tribe and other environmental defenders, but the decision is subject to appeal.
Since the DAPL conflict began, the industry has been hastily coordinating state-level legislation in anticipation of resistance to other notable national gas transmission pipelines, more locally concerning projects like Class II Oil and Gas Waste Injection Wells, and miles of gas gathering pipelines that transport increasing streams of waste – as well as oil and gas – to coastal processing sites.
The following “critical infrastructure” bills have already been enacted:
| STATE | BILL | TITLE | DATE PASSED | |
| West Virginia | HB 4615 | NEW PENALTIES FOR PROTESTS NEAR GAS AND OIL PIPELINES | 3/25/20 | |
| South Dakota | SB 151 | NEW PENALTIES FOR PROTESTS NEAR PIPELINES AND OTHER INFRASTRUCTURE | 3/18/20 | |
| Kentucky | HB 44 | NEW PENALTIES FOR PROTESTS NEAR PIPELINES AND OTHER INFRASTRUCTURE | 3/16/20 | |
| Wisconsin | AB 426 | NEW PENALTIES FOR PROTESTS NEAR GAS AND OIL PIPELINES | 11/21/19 | |
| Missouri | HB 355 | NEW PENALTIES FOR PROTESTS NEAR GAS AND OIL PIPELINES | 7/11/19 | |
| Texas | HB 3557 | NEW CRIMINAL AND CIVIL PENALTIES FOR PROTESTS AROUND CRITICAL INFRASTRUCTURE | 6/14/19 | |
| Tennessee | SB 264 | NEW PENALTIES FOR PROTESTS NEAR GAS AND OIL PIPELINES | 5/10/19 | |
| Indiana | SB 471 | NEW PENALTIES FOR PROTESTS NEAR CRITICAL INFRASTRUCTURE | 5/6/19 | |
| North Dakota | HB 2044 | HEIGHTENED PENALTIES FOR PROTESTS NEAR CRITICAL INFRASTRUCTURE | 4/10/19 | |
| Louisiana | HB 727 | HEIGHTENED PENALTIES FOR PROTESTING NEAR A PIPELINE | 5/30/18 | |
| Oklahoma | HB 1123 | NEW PENALTIES FOR PROTESTS NEAR CRITICAL INFRASTRUCTURE | 5/3/17 | |
There are an additional eight bills proposed and under consideration in these six states:
| STATE | PENDING | TITLE | DATE PROPOSED |
| Louisiana | HB 197 | NEW PENALTIES FOR PROTESTS NEAR CRITICAL INFRASTRUCTURE | 2/24/20 |
| Minnesota | HF 3668 | NEW PENALTIES FOR PROTESTS NEAR GAS AND OIL PIPELINES | 2/24/20 |
| Mississippi | HB 1243 | NEW PENALTIES FOR PROTESTS NEAR CRITICAL INFRASTRUCTURE | 2/19/20 |
| Alabama | SB 45 | NEW PENALTIES FOR PROTESTS NEAR GAS AND OIL PIPELINES | 2/4/20 |
| Minnesota | HF 2966 | NEW PENALTIES FOR PROTESTS NEAR OIL AND GAS PIPELINES | 1/31/20 |
| Minnesota | SF 2011 | NEW PENALTIES FOR PROTESTS NEAR GAS AND OIL PIPELINES | 3/4/19 |
| Ohio | SB 33 | NEW PENALTIES FOR PROTESTS NEAR CRITICAL INFRASTRUCTURE | 2/12/19 |
| Illinois | HB 1633 | NEW PENALTIES FOR PROTESTS NEAR CRITICAL INFRASTRUCTURE | 1/31/19 |
Activists and organizations like the American Civil Liberties Union (ACLU) are framing their opposition to such legislation as an attempt to stave off the worst Orwellian instincts of our elected officials, whether they are in Columbus or Mar-a-Lago. On the other hand, industry and prosecutors are framing these protests as terroristic acts that threaten national security, which is why sentencing comes with a felony conviction and up to ten years in prison. The view of the FBI’s deputy assistant director and top official in charge of domestic terrorism John Lewis is that, “In recent years, the Animal Liberation Front and the Earth Liberation Front have become the most active, criminal extremist elements in the United States … the FBI’s investigation of animal rights extremists and ecoterrorism matters is our highest domestic terrorism investigative priority.”
It shocked many when last week, two protesters in the petrochemical-laden “Cancer Alley” region of Louisiana were arrested and charged under the state’s felony “terrorist” law. Their crime? Placing boxes of nurdles – plastic pellets that are the building blocks of many single-use plastic products – on the doorsteps of fossil fuel lobbyists’ homes. To make matters more ridiculous, the nurdles were illegally dumped by the petrochemical company Formosa Plastics.[2] This is outrageous indeed, but is the sort of legally-sanctioned oppression that fossil fuel industry lobbyists have been successfully advocating for years.
American Fuel & Petrochemical Manufacturers (AFPM) stated in a letter of support for ALEC’s legislative efforts:
“In recent years, there has been a growing and disturbing trend of individuals and organizations attempting to disrupt the operation of critical infrastructure in the energy, manufacturing, telecommunications, and transportation industries. Energy infrastructure is often targeted by environmental activists to raise awareness of climate change and other perceived environmental challenges. These activities, however, expose individuals, communities, and the environment to unacceptable levels of risk, and can cause millions of dollars in damage … As the private sector continues to expand and maintain the infrastructure necessary to safely and reliably deliver energy and other services to hundreds of millions of Americans, policymakers should continue to consider how they can help discourage acts of sabotage … Finally, it will also hold organizations both criminally and vicariously liable for conspiring with individuals who willfully trespass or damage critical infrastructure sites.”
Those organizations deemed ‘criminally and vicariously liable’ would in some states face fines an order of magnitude greater than the actual individual, which would cripple margin-thin environmental groups around the country, and could amount to $100,000 to $1,000,000. The AFPM’s senior vice president for federal and regulatory affairs Derrick Morgan referred to these vicarious organizations as “inspiring … organizations who have ill intent, want to encourage folks to damage property and endanger lives …”
Oklahoma Oil & Gas Association (OKOGA) wrote in a fear-mongering letter to Oklahoma Governor Mary Fallin that such legislation was necessary to “protect all Oklahomans from risk of losing efficient and affordable access to critical services needed to power our daily lives.”
One of the most disturbing aspects of this legislation is that it could, according to the testimony and additional concerns of ACLU of Ohio’s Chief Lobbyist Gary Daniels, equate “‘impeding’ and ‘inhibiting’ the ‘operations’ of a critical infrastructure site” with acts as innocuous as Letters to the Editor, labor strikes or protests, attending and submitting testimony at hearings, or simply voicing your concern or objections to the validity of industry claims and its proposals with emails, faxes, phone calls, or a peaceful protest outside critical infrastructure that raises the concern of site security. Mr. Daniels noted in his additional written testimony that the latter, “may prove inconvenient to the site’s staff, under SB 250 they would be an F3 [Third Degree Felony], and that is without someone even stepping foot on or near the property, as physical presence is not required to be guilty of criminal mischief, as found in/defined in Sec. 2907.07(A)(7) of the bill.”
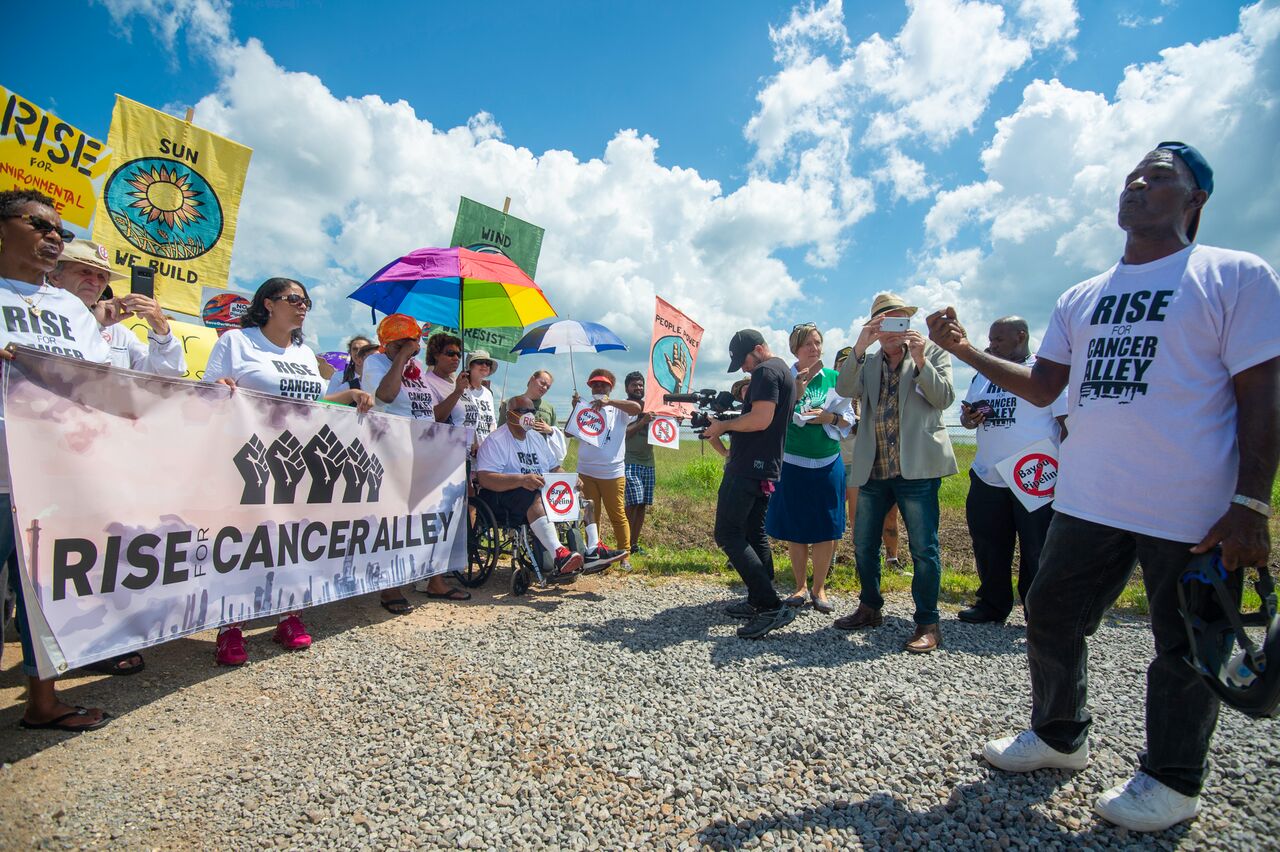
Figure 3. A rally held by the Louisiana-based nonprofit RISE St. James.
This connection, when enshrined into law, will have a chilling effect on freedom of speech and assembly, and will stop protests or thoughtful lines of questioning before they even start. As the Ohio Valley Environmental Coalition (OVEC) put it in their request for residents to ask the governor to veto the now-enacted HB 4615, such a bill is unnecessary, duplicative, deceitful, un-American, unconstitutional, and “will further crowd our jails and prisons.”
To combat such industry-friendly legislation that erodes local government control in Ohio, lawmakers like State Senator Nikki Antonio are introducing resolutions like SR 221, which would, “abolish corporate personhood and money-as-speech doctrine” made law by the Supreme Court of the United States’ rulings in Citizens United v. FEC and Buckley v. Valeo. After all, the overarching impact of ALEC’s efforts and those described below furthers privatized, short-term profit and socialized, long-term costs, and amplifies the incredibly corrosive Citizen’s United decision a little over a decade ago.
Simultaneously, there is an effort to criminalize protest activities through “riot boosting acts,” increased civil liability and decreased police liability, trespassing penalties, and new sanctions for protestors who conceal their identities (by wearing a face mask, for example).
The following bills have already been enacted:
| STATE | BILL | TITLE | DATE PASSED |
| South Dakota | SB 189 | EXPANDED CIVIL LIABILITY FOR PROTESTERS AND PROTEST FUNDERS | 3/27/19 |
| West Virginia | HB 4618 | ELIMINATING POLICE LIABILITY FOR DEATHS WHILE DISPERSING RIOTS AND UNLAWFUL ASSEMBLIES | 3/10/18 |
| North Dakota | HB 1426 | HEIGHTENED PENALTIES FOR RIOT OFFENCES | 2/23/17 |
| North Dakota | HB 1293 | EXPANDED SCOPE OF CRIMINAL TRESPASS | 2/23/17 |
| North Dakota | HB 1304 | NEW PENALTIES FOR PROTESTERS WHO CONCEAL THEIR IDENTITY | 2/23/17 |
In addition, the following bills have been proposed and are under consideration:
| STATE | PENDING | TITLE | DATE PROPOSED |
| Rhode Island | H 7543 | NEW PENALTIES FOR PROTESTERS WHO CONCEAL THEIR IDENTITY | 2/12/20 |
| Oregon | HB 4126 | HARSH PENALTIES FOR PROTESTERS WHO CONCEAL THEIR IDENTITY | 1/28/20 |
| Tennessee | SB 1750 | NEW PENALTIES FOR PROTESTERS WHO CONCEAL THEIR IDENTITY | 1/21/20 |
| Ohio | HB 362 | NEW PENALTIES FOR PROTESTERS WHO CONCEAL THEIR IDENTITY | 10/8/19 |
| Pennsylvania | SB 887 | NEW PENALTIES FOR PROTESTS NEAR “CRITICAL INFRASTRUCTURE” | 10/7/19 |
| Massachusetts | HB 1588 | PROHIBITION ON MASKED DEMONSTRATIONS | 1/17/19 |
All the while, the Bundy clan of Utah pillage – and at times – hold our public lands hostage, and white male Michiganders enter the state capital in Lansing armed for Armageddon, because they feel that COVID-19 is a hoax. We imagine that it isn’t these types of folks that West Virginia State Representatives John Shott and Roger Hanshaw had in mind when they wrote and eventually successfully passed HB 4618, which eliminated police liability for deaths while dispersing riots and unlawful assemblies.
Contrarily, South Dakota’s SB 189, or “Riot Boosting Act,” was blocked by the likes of US District Judge Lawrence L. Piersol, who wrote:
“Imagine that if these riot boosting statutes were applied to the protests that took place in Birmingham, Alabama, what might be the result? … Dr. King and the Southern Christian Leadership Conference could have been liable under an identical riot boosting law.”
FracTracker collaborated with Crude Accountability on a report documenting increasing reprisals against environmental activists in the US and Eurasia. Read the Report.
Despite Judge Piersol’s ruling, South Dakota (SB 151) joined Kentucky (HB 44) and West Virginia (HB 4615) in passing some form of ALEC’s bill since the COVID-19 epidemic took hold of the US. This is classic disaster capitalism. As former Barack Obama Chief of Staff Rahm Emanuel once said, “You never want a serious crisis to go to waste, and what I mean by that is it’s an opportunity to do things you think you could not do before.”
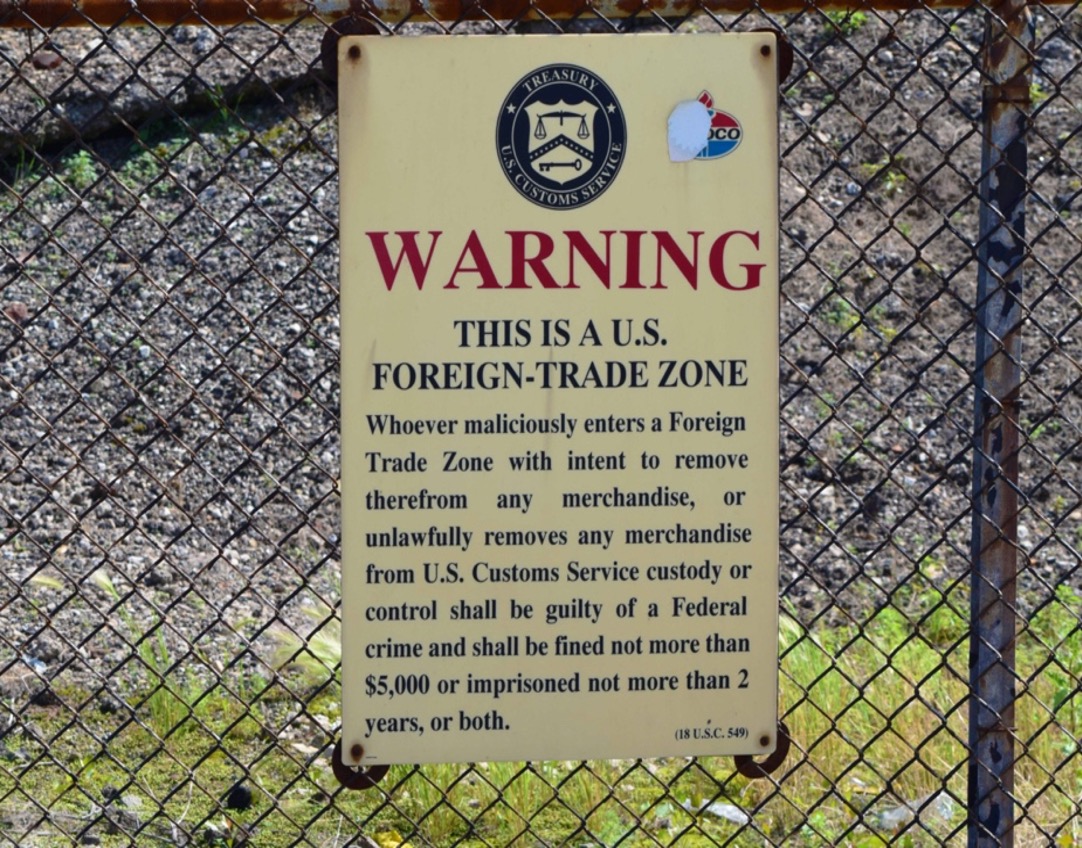
Figure 4. Photo of US Treasury Department signage outlining the warning associated with BP’s Whiting, IN, oil refinery designated a Foreign Trade Zone (FTZ). Photo by Ted Auch July 15th, 2015
In all fairness to Mr. Emanuel, he was referring to the Obama administration’s support for the post-2008 bipartisan Wall Street bailout. However, it is critical that we acknowledge the push for critical infrastructure legislation has been most assuredly bipartisan, with Democratic Governors in Kentucky, Louisiana, and Wisconsin signing into law their versions on March 16th of this year, in May of 2018, and in November of 2019, respectively.
According to the International Center for Not-for-Profit Law, 11 states have passed some version of ALEC’s bill, with the first uncoincidentally being a series of three bills signed in February of 2017 by North Dakota Governor Burgum, targeting “Heightened Penalties for Riot Offences” (HB 1426), “Expanded Scope of Criminal Trespass” (HB 1293), and “New Penalties for Protestors Who Conceal Their Identity” (HB 1304), with at least one member of ALEC’s stable of elected officials, Rep. Kim Koppelman, proudly displaying his affiliation in his biography on the North Dakota Legislative Branch’s website. Mr. Koppelman, along with Rep. Todd Porter out of Mandan, also cosponsored two of these bills.
In Columbus, Ohio, there are several pieces of legislation being pushed in concert with ALEC-led efforts. These include the recently submitted HB 362, that would “create the crime of masked intimidation.” Phil Plummer and George F. Lang sponsor the bill, with the latter being the same official who introduced HB 625, a decidedly anti-local control bill that would preempt communities from banning plastic bags. Most of the general public and some of the country’s largest supermarket chains have identified plastic bag bans as a logical next step as they wrestle with their role in the now universally understood crimes plastics have foisted on our oceans and shores. As Cleveland Scene’s Sam Allard wrote, “bill mills” and their willing collaborators in states like Ohio cause such geographies to march “boldly, with sigils flying in the opposite direction” of progress, and a more renewable and diversified energy future.
With respect to Plummer and Lang’s HB 362, two things must be pointed out:
1) It is eerily similar to North Dakota’s HB 1304 that created new penalties for protestors who conceal their identity, and
2) The North Dakota bill was conveniently signed into law by Governor Burgum on February 23rd, 2017, who had set the day prior as the “deadline for the remaining [DAPL] protesters to leave an encampment on federal land near the area of the pipeline company’s construction site.”
So, when elected officials as far away as Columbus copy and paste legislation passed in the aftermath of the DAPL resistance efforts, it is clear the message they are conveying, and the audience(s) they are trying to intimidate.
Plummer and Lang’s HB 362 would add a section to the state’s “Offenses Against the Public Peace,” Chapter 2917, that would in part read:
No person shall wear a mask or disguise in order to purposely do any of the following:
(A) Obstruct the execution of the law;
(B) Intimidate, hinder, or interrupt a person in the performance of the person’s legal duty; or
(C) Prevent a person from exercising the rights granted to them by the Constitution or the laws of this state.
Whoever violates this proposed section is guilty of masked intimidation. Masked intimidation is a first degree misdemeanor. It was critical for the DAPL protestors to protect their faces during tear gas and pepper spray barrages, from county sheriffs and private security contractors alike.
At the present moment, masks are one of the few things standing between COVID-19 and even more death. Given these realities, it is stunning that our elected officials have the time and/or interest in pushing bills such as HB 362 under the thin veil of law and order.
But judging by what one West Virginia resident and former oil and gas industry draftsman,[3] wrote to us recently, elected officials do not really have much to lose, given how little most people think of them:
“Honestly, it doesn’t seem to matter what we do. The only success most of us have had is in possibly slowing the process down and adding to the cost that the companies incur. But then again, the increase in costs probably just gets passed down to the consumers. One of the biggest drawbacks in my County is that most, if not all, of the elected officials are pro drilling. Many of them have profited from it.”
The oil, gas, and petrochemical industries are revealing their weakness by scrambling to pass repressive legislation to counteract activists. But social movements around the world are determined to address interrelated social and environmental issues before climate chaos renders our planet unlivable, particularly for those at the bottom of the socioeconomic ladder. We hope that by shining a light on these bills, more people will become outraged enough to join the fight against antidemocratic legislation.
This is Part I of a two-part series on concerning legislation related to the oil, gas, and petrochemical industries. Part II focuses on bills that would weaken environmental regulations in Ohio, Michigan, and South Dakota.
By Ted Auch, PhD, Great Lakes Program Coordinator and Shannon Smith, Manager of Communications & Development
[1] See Naomi Klein’s concept of the Shock Doctrine for similar trends.
[2] The community-based environmental organization RISE St. James has been working tirelessly to prevent Formosa Plastics from building one of the largest petrochemical complexes in the US in their Parish. Sharon Lavigne is a leading member of RISE St. James, and is an honored recipient of the 2019 Community Sentinel Award for Environmental Stewardship. Read more on Sharon’s work with RISE St. James here.
[3] This individual lives in Central West Virginia, and formerly monitored Oil & Gas company assets in primarily WV, PA, NY, VA, MD & OH, as well as the Gulf Coast. Towards the end of this individual’s career, they provided mapping support for the smart pigging program, call before you dig, and the pipeline integrity program.
As a spring 2020 intern with FracTracker, my work mostly involved mapping gathering lines in West Virginia and Ohio. Gathering lines are pipelines that transport oil and gas from the wellhead to either compressor stations or storage/processing facilities. The transmission pipelines (which are often larger in diameter than gathering lines) take the oil and gas from the processing facilities to other storage facilities/compressor stations, or to distribution pipelines which go to end users and consumers. As you can see from Figure 2 in the map of Doddridge County, WV, many gathering lines eventually converge at a compressor station. You can think of gathering lines like small brooks and streams that feed transmission pipelines. The transmission lines are the main arteries, like a river, moving larger quantities of gas and oil over longer distances.
The main project and goal of my internship was to record as many gathering pipelines as I could find in Ohio and West Virginia, since gathering lines are not generally mapped and therefore not easily available for the public to view. For example, the National Pipeline Mapping System’s public map viewer (created by the Department of Transportation Pipeline and Hazardous Materials Safety Administration) has a note stating, “It does not contain gas gathering or distribution pipelines.” Mapping gathering lines makes this data accessible to the public and will allow us to see the bigger picture when it comes to assessing the environmental impact of pipelines.
After collecting gathering line location data, I performed GIS analysis to determine the amount of acreage of land that has been clearcut due to gathering pipeline installations.
Another analysis we could perform using this data is to count the total number of waterways that the gathering lines cross/interact with and assess the quality of water and wildlife in areas with higher concentrations of gathering pipelines.
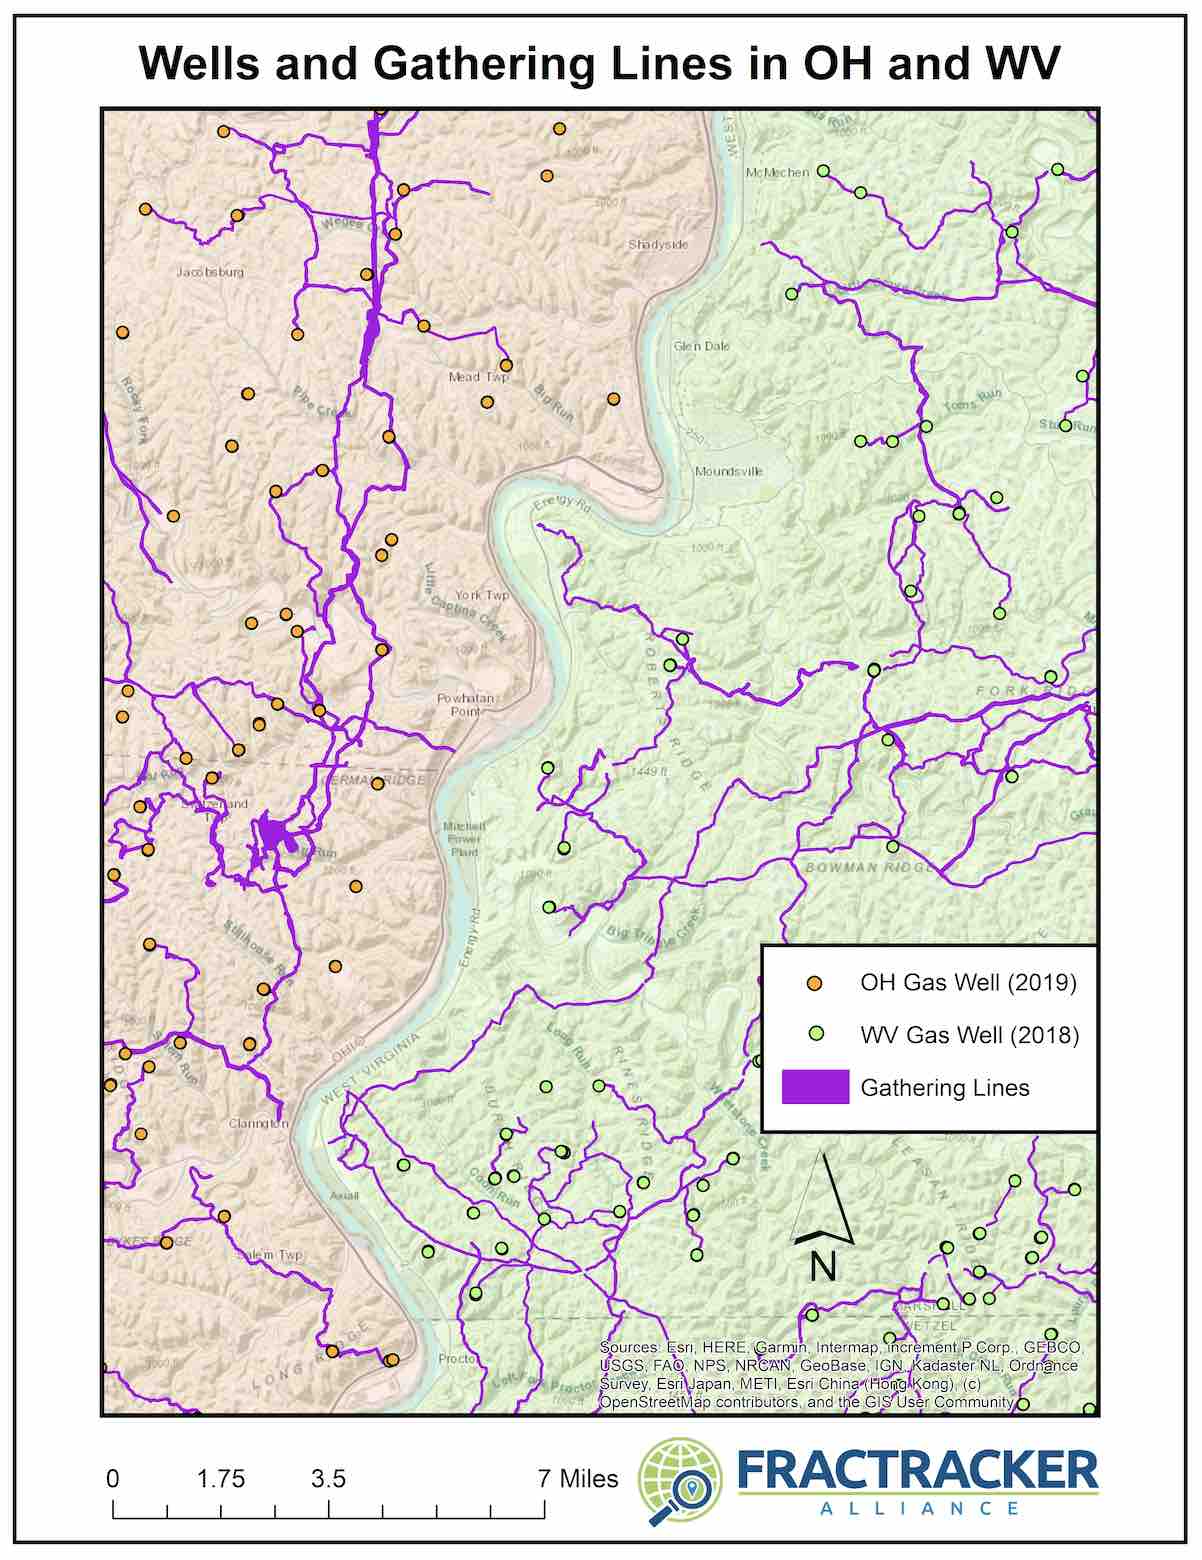
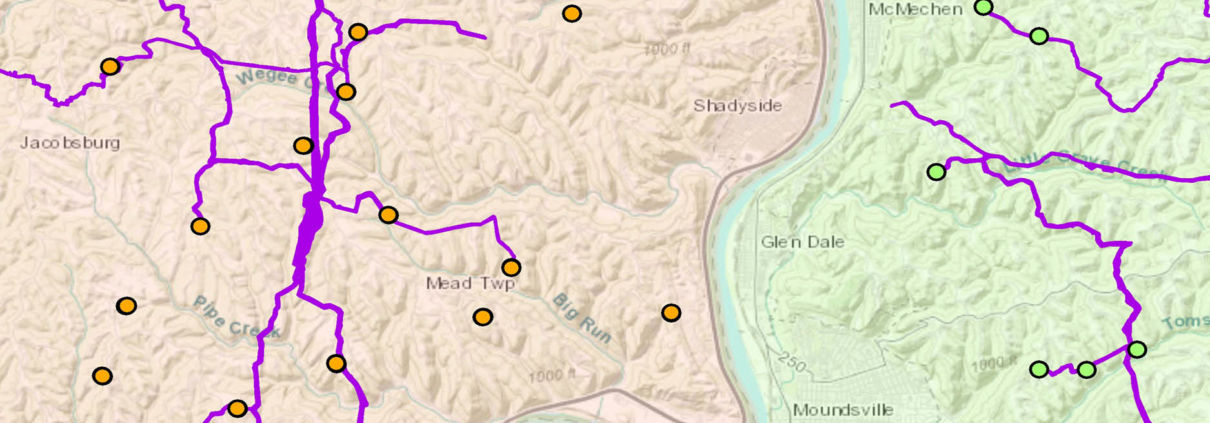
Figure 1. This map shows an overview of gathering line pipelines in the Powhatan Point, Ohio and Moundsville, West Virginia of the Ohio River Valley.
I worked with an aerial imagery BaseMap layer (a BaseMap is the bottommost layer when viewing a map), a county boundaries layer, production well location points, and compressor station location points. I then traced lines on the earth that appeared to be gathering lines by creating polygon shapefiles in the GIS application ArcMap.
My methodology and process of finding the actual routes of the gathering lines included examining locations at various map scale ranges to find emerging line patterns of barren land that connect different production well points on the map. I would either concentrate on looking for patterns along well pad location points and look for paths that may connect those points, or I would begin at the nearest gathering line I had recorded to try to find off-shoot paths off of those pipelines that may connect to a well pad, compressor station or previously recorded gathering line.
I did run into a few problems during my search for gathering lines. Sometimes, I would begin to trace a gathering line path, only to either loose the path entirely, or on further inspection, find that it was a power line path. Other times when using the aerial imagery basemap, the gathering line would flow into an aerial photo from a year prior to the pipeline installation and I would again lose the path. To work around these issues, I would first follow the gathering line trail to its end point before I started tracing the path. I would also view the path very closely in various scale ranges to ensure I wasn’t tracing a road, waterway, or powerline pathway.
In the three months that I was working on recording gathering pipeline paths in Ohio and West Virginia, I found approximately 29,103 acres (3,494 miles) of barren land clearcut by gathering pipelines. These total amounts are not exact since not all gathering lines can be confirmed. There are still more gathering lines to be recorded in both Ohio and West Virginia, but these figures give the reader an idea of the land disturbance caused by gathering lines, as shown in Figures 1 and 2.
In Ohio, I recorded approximately 10,083 acres (641 miles) with the average individual gathering pipeline taking up about 45 acres of land. With my gathering line data and data previously recorded by FracTracker, I found that there are 28,490 acres (1,690 miles) of land spanning 9 counties in southeastern Ohio that have been cleared and used by gathering lines.
For West Virginia, I was able to record approximately 19,020 acres (1,547 miles) of gathering lines, with the average gathering line taking up about 48 acres of space each. With previous data recorded in West Virginia by FracTracker, the total we have so far for the state is 22,897 acres (1,804 miles), although that is only accounting for the 9 counties in northern West Virginia that are recorded.
Figure 2. This aerial view map shows connecting gathering line pipelines that cover a small portion of Doddridge County, WV.
I was shocked to see how many gathering lines there are in these rural areas. Not only are they very prevalent in these less populated communities, but it was surprising to see how concentrated and close together they tend to be. When most people think of pipelines, they think of the big transmission pipeline paths that cross multiple states and are unaware of how much land that the infrastructure of these gathering pipelines also take up.
It was also very eye-opening to find that there are at least 29,000 acres of land in Ohio and West Virginia that were clearcut for the installation of gathering lines. It is even more shocking that these gathering pipelines are not being recorded or mapped and that this data is not publicly available from the National Pipeline Mapping System. While driving through these areas you may only see one or two pipelines briefly from your car, but by viewing the land from a bird’s eye perspective, you get a sense of the scale of this massive network. While the transmission pipeline arteries tend to be bigger, the veins of gathering lines displace a large amount of land as well.
I was also surprised by the sheer number of gathering lines I found that crossed waterways, rivers, and streams. During this project, it wasn’t unusual at all to follow a gathering line path that would cross water multiple times. In the future, I would be interested to look at the number of times these gathering pipelines cross paths with a stream or river, and the impact that this has on water quality and surrounding environment. I hope to continue to record gathering lines in Ohio and West Virginia, as well as Pennsylvania, so that we may learn more about this infrastructure and the impact it may have on the environment.
I first heard of FracTracker three years ago when I was volunteering with an environmental group called Keep Wayne Wild in Ohio. Since learning about FracTracker, I have been impressed with their eye-opening projects and their ability to make the gas and oil industry more transparent. A few years after first hearing about FracTracker, and as my interest in the GIS field continued to grow, I began taking GIS classes and reached out to them for this internship opportunity.
By Trevor Oatts, FracTracker Spring 2020 Data & GIS Intern

FracTracker Alliance has released a new national map, filled with energy and petrochemical data. Explore the map, continue reading to learn more, and see how your state measures up!
This map has been updated since this blog post was originally published, and therefore statistics and figures below may no longer correspond with the map
The items on the map (followed by facility count in parenthesis) include:
For oil and gas wells, view FracTracker’s state maps.
This map is by no means exhaustive, but is exhausting. It takes a lot of infrastructure to meet the energy demands from industries, transportation, residents, and businesses – and the vast majority of these facilities are powered by fossil fuels. What can we learn about the state of our national energy ecosystem from visualizing this infrastructure? And with increasing urgency to decarbonize within the next one to three decades, how close are we to completely reengineering the way we make energy?
The “power plant” legend item on this map contains facilities with an electric generating capacity of at least one megawatt, and includes independent power producers, electric utilities, commercial plants, and industrial plants. What does this data reveal?

Power plants by energy source. Data from EIA.
In terms of the raw number of power plants – solar plants tops the list, with 2,916 facilities, followed by natural gas at 1,747.
In terms of megawatts of electricity generated, the picture is much different – with natural gas supplying the highest percentage of electricity (44%), much more than the second place source, which is coal at 21%, and far more than solar, which generates only 3% (Figure 1).

Figure 1. Electricity generation by source in the United States, 2019. Data from EIA.
This difference speaks to the decentralized nature of the solar industry, with more facilities producing less energy. At a glance, this may seem less efficient and more costly than the natural gas alternative, which has fewer plants producing more energy. But in reality, each of these natural gas plants depend on thousands of fracked wells – and they’re anything but efficient.
The cost per megawatt hour of electricity for a renewable energy power plants is now cheaper than that of fracked gas power plants. A report by the Rocky Mountain Institute, found “even as clean energy costs continue to fall, utilities and other investors have announced plans for over $70 billion in new gas-fired power plant construction through 2025. RMI research finds that 90% of this proposed capacity is more costly than equivalent [clean energy portfolios, which consist of wind, solar, and energy storage technologies] and, if those plants are built anyway, they would be uneconomic to continue operating in 2035.”
The economics side with renewables – but with solar, wind, geothermal comprising only 12% of the energy pie, and hydropower at 7%, do renewables have the capacity to meet the nation’s energy needs? Yes! Even the Energy Information Administration, a notorious skeptic of renewable energy’s potential, forecasted renewables would beat out natural gas in terms of electricity generation by 2050 in their 2020 Annual Energy Outlook.
This prediction doesn’t take into account any future legislation limiting fossil fuel infrastructure. A ban on fracking or policies under a Green New Deal could push renewables into the lead much sooner than 2050.
In a void of national leadership on the transition to cleaner energy, a few states have bolstered their renewable portfolio.

Figure 2. Electricity generation state-wide by source, 2019. Data from EIA.
One final factor to consider – the pie pieces on these state charts aren’t weighted equally, with some states’ capacity to generate electricity far greater than others. The top five electricity producers are Texas, California, Florida, Pennsylvania, and Illinois.
In 2018, approximately 28% of total U.S. energy consumption was for transportation. To understand the scale of infrastructure that serves this sector, it’s helpful to click on the petroleum refineries, crude oil rail terminals, and crude oil pipelines on the map.

Transportation Fuel Infrastructure. Data from EIA.
The majority of gasoline we use in our cars in the US is produced domestically. Crude oil from wells goes to refineries to be processed into products like diesel fuel and gasoline. Gasoline is taken by pipelines, tanker, rail, or barge to storage terminals (add the “petroleum product terminal” and “petroleum product pipelines” legend items), and then by truck to be further processed and delivered to gas stations.
The International Energy Agency predicts that demand for crude oil will reach a peak in 2030 due to a rise in electric vehicles, including busses. Over 75% of the gasoline and diesel displacement by electric vehicles globally has come from electric buses.
China leads the world in this movement. In 2018, just over half of the world’s electric vehicles sales occurred in China. Analysts predict that the country’s oil demand will peak in the next five years thanks to battery-powered vehicles and high-speed rail.
In the United States, the percentage of electric vehicles on the road is small but growing quickly. Tax credits and incentives will be important for encouraging this transition. Almost half of the country’s electric vehicle sales are in California, where incentives are added to the federal tax credit. California also has a “Zero Emission Vehicle” program, requiring electric vehicles to comprise a certain percentage of sales.
We can’t ignore where electric vehicles are sourcing their power – and for that we must go back up to the electricity generation section. If you’re charging your car in a state powered mainly by fossil fuels (as many are), then the electricity is still tied to fossil fuels.
Many of the oil and gas infrastructure on the map doesn’t go towards energy at all, but rather aids in manufacturing petrochemicals – the basis of products like plastic, fertilizer, solvents, detergents, and resins.
This industry is largely concentrated in Texas and Louisiana but rapidly expanding in Pennsylvania, Ohio, and West Virginia.
On this map, key petrochemical facilities include natural gas plants, chemical plants, ethane crackers, and natural gas liquid pipelines.

Petrochemical infrastructure. Data from EIA.
Natural gas processing plants separate components of the natural gas stream to extract natural gas liquids like ethane and propane – which are transported through the natural gas liquid pipelines. These natural gas liquids are key building blocks of the petrochemical industry.
Ethane crackers process natural gas liquids into polyethylene – the most common type of plastic.
The chemical plants on this map include petrochemical production plants and ammonia manufacturing. Ammonia, which is used in fertilizer production, is one of the top synthetic chemicals produced in the world, and most of it comes from steam reforming natural gas.
As we discuss ways to decarbonize the country, petrochemicals must be a major focus of our efforts. That’s because petrochemicals are expected to account for over a third of global oil demand growth by 2030 and nearly half of demand growth by 2050 – thanks largely to an increase in plastic production. The International Energy Agency calls petrochemicals a “blind spot” in the global energy debate.

Petrochemical development off the coast of Texas, November 2019. Photo by Ted Auch, aerial support provided by LightHawk.
Investing in plastic manufacturing is the fossil fuel industry’s strategy to remain relevant in a renewable energy world. As such, we can’t break up with fossil fuels without also giving up our reliance on plastic. Legislation like the Break Free From Plastic Pollution Act get to the heart of this issue, by pausing construction of new ethane crackers, ensuring the power of local governments to enact plastic bans, and phasing out certain single-use products.
Mapped out, this web of fossil fuel infrastructure seems like a permanent grid locking us into a carbon-intensive future. But even more overwhelming than the ubiquity of fossil fuels in the US is how quickly this infrastructure has all been built. Everything on this map was constructed since Industrial Revolution, and the vast majority in the last century (Figure 3) – an inch on the mile-long timeline of human civilization.
Figure 3. Global Fossil Fuel Consumption. Data from Vaclav Smil (2017)
In fact, over half of the carbon from burning fossil fuels has been released in the last 30 years. As David Wallace Wells writes in The Uninhabitable Earth, “we have done as much damage to the fate of the planet and its ability to sustain human life and civilization since Al Gore published his first book on climate than in all the centuries—all the millennia—that came before.”
What will this map look like in the next 30 years?
A recent report on the global economics of the oil industry states, “To phase out petroleum products (and fossil fuels in general), the entire global industrial ecosystem will need to be reengineered, retooled and fundamentally rebuilt…This will be perhaps the greatest industrial challenge the world has ever faced historically.”
Is it possible to build a decentralized energy grid, generated by a diverse array of renewable, local, natural resources and backed up by battery power? Could all communities have the opportunity to control their energy through member-owned cooperatives instead of profit-thirsty corporations? Could microgrids improve the resiliency of our system in the face of increasingly intense natural disasters and ensure power in remote regions? Could hydrogen provide power for energy-intensive industries like steel and iron production? Could high speed rail, electric vehicles, a robust public transportation network and bike-able cities negate the need for gasoline and diesel? Could traditional methods of farming reduce our dependency on oil and gas-based fertilizers? Could zero waste cities stop our reliance on single-use plastic?
Of course! Technology evolves at lightning speed. Thirty years ago we didn’t know what fracking was and we didn’t have smart phones. The greater challenge lies in breaking the fossil fuel industry’s hold on our political system and convincing our leaders that human health and the environment shouldn’t be externalized costs of economic growth.
Pennsylvania’s fracking industry is producing record amounts of toxic waste — where does it all go?
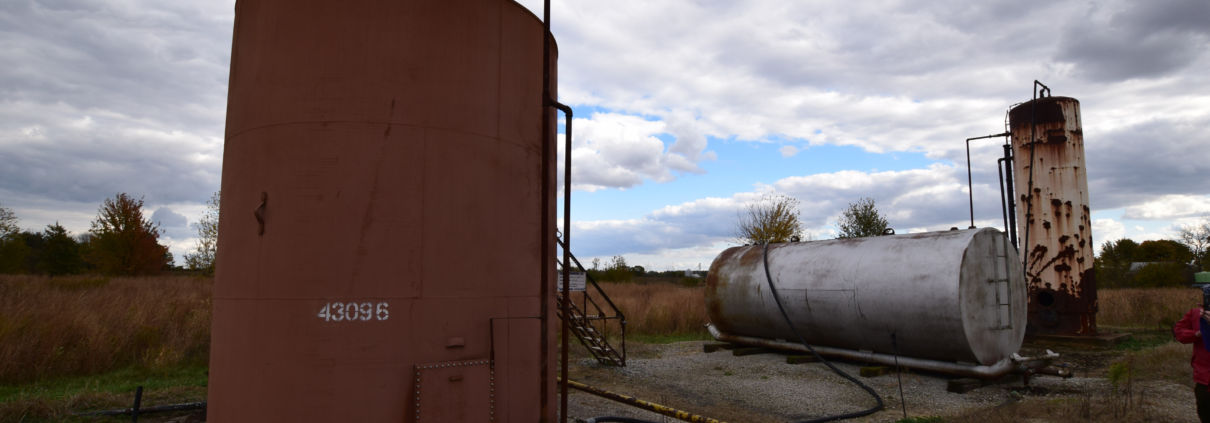
Drilling for methane and other fossil fuels is an energy-intensive process with many associated environmental costs. In addition to the gas that is produced through high volume hydraulic fracturing (“unconventional drilling,” or “fracking”), the process generates a great deal of waste at the drill site. These waste products may include several dozen tons of drill cutting at every well that is directionally drilled, in addition to liner materials, contaminated soil, fracking fluid, and other substances that must be removed from the site.
In 2018, Pennsylvania’s oil and gas industry (including both unconventional and conventional wells) produced over 2.9 billion gallons (nearly 69 million barrels) of liquid waste, and 1,442,465 tons of solid waste. In this article, we take a look at where this waste (and its toxic components) end up and how waste values have changed in recent years. We also explore how New York State, despite its reputation for being anti-fracking, isn’t exempt from the toxic legacy of this industry.
According to a study by Physicians, Scientists and Engineers, over 80% of all waste from oil and gas drilling stays within the state of Pennsylvania. But once drilling wastes are sent to landfills, is that the end of them? Absolutely not!
Drilling waste also gets into the environment through secondary means. According to a recent report by investigative journalists at Public Herald, on average, 800,000 tons of fracking waste from Pennsylvania is sent to Pennsylvania landfills. When this waste is sent to landfills, radioactivity and other chemicals can percolate through the landfill, and are collected as leachate, which is then shipped to treatment plants.
Public Herald documented how fourteen sewage treatment plants in Pennsylvania have been permitted by Pennsylvania’s Department of Environmental Protection (PA DEP) to process and discharge radioactive wastes into more than a dozen Pennsylvania waterways.
Public Herald’s article includes an in-depth analysis of the issue. Their work is supported by a map of the discharge sites, created by FracTracker.
Pennsylvania Department of Environmental Protection maintains a rich database of oil and gas waste and production records associated with their Oil and Gas Reporting Website. The changes in waste disposal from Pennsylvania’s unconventional drilling reveal a number of interesting stories.
Let’s look first at overall unconventional drilling waste.
According to data from the federal Energy Information Administration, gas production in Pennsylvania began a steep increase around 2010, with the implementation of high volume hydraulic fracturing in the Marcellus Shale (see Figure 1). The long lateral drilling techniques allowed industry to exploit exponentially more of the tight shale via single well than was ever before possible with conventional, vertical drilling.
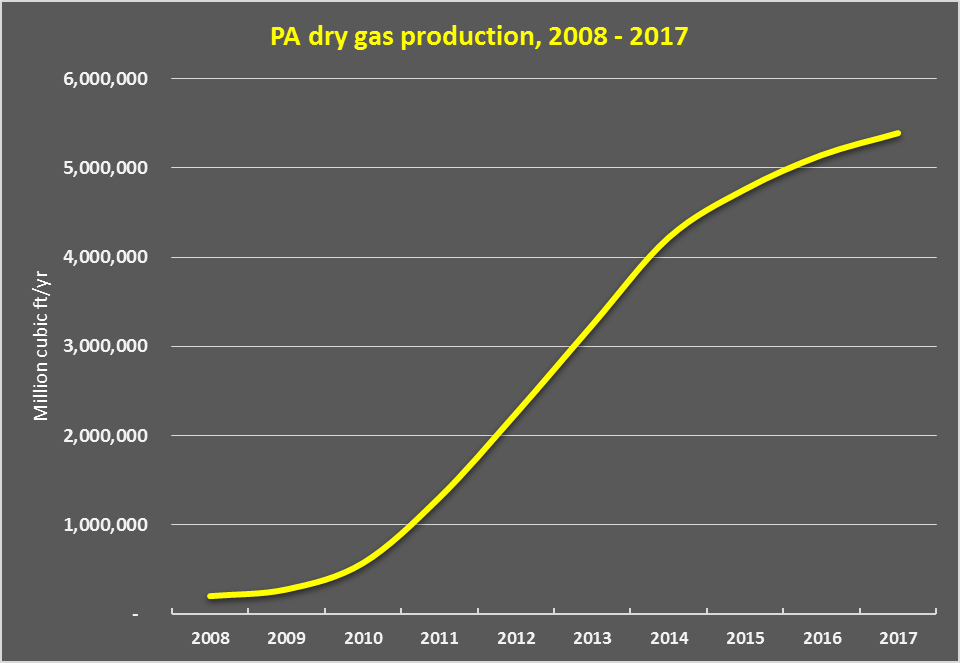
Figure 1. Data summary from FracTracker.org, based on EIA data.
The more recently an individual well is drilled, the more robust the production. We see an overall increase in gas production over time in Pennsylvania over the past decade. Paradoxically, the actual number of new wells drilled each year in the past 4-5 years are less than half of the number drilled in 2011 (see Figure 2).
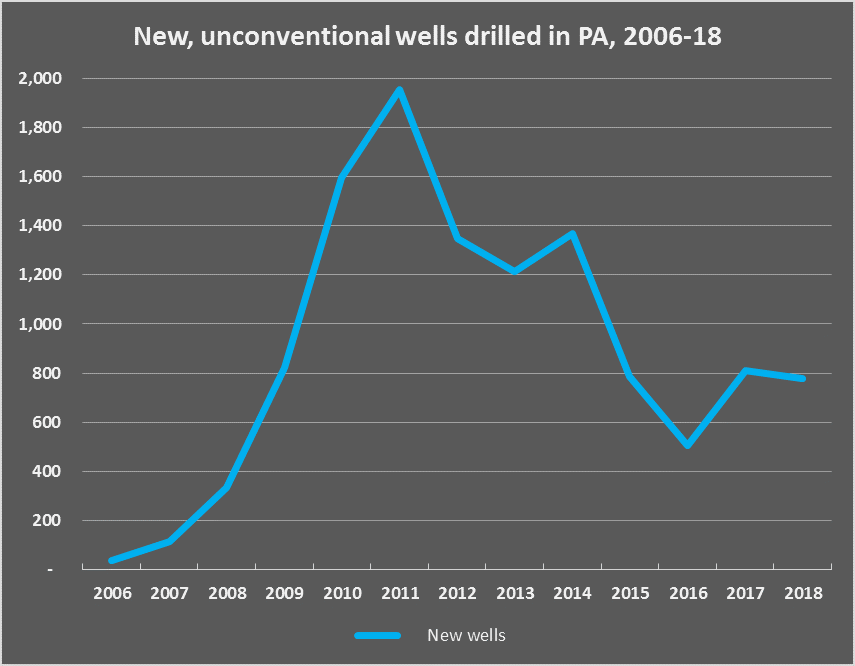
Figure 2: Data summary from FracTracker.org, based on PA DEP data
Why is this? The longer laterals —some approaching 3 miles or more—associated with new wells allow for more gas to be extracted per site.
With this uptick in gas production values from the Marcellus and Utica Formations come more waste products, including copious amounts drilling waste, “produced water,” and other byproducts of intensive industrial operations across PA’s Northern Tier and southwestern counties.
When we look at the available gas production data compared with data on waste products from the extraction process, some trends emerge. First of all, it’s readily apparent that waste production does not track directly with gas production in a way one would expect.
Recall that dry gas production has increased annually since 2006 (see Figure 1). However, the reported waste quantities from industry have not followed that same trend.
In the following charts, we’ve split out waste from unconventional drilling by solid waste in tons (Figure 3) and liquid waste, in barrels (Figure 4).
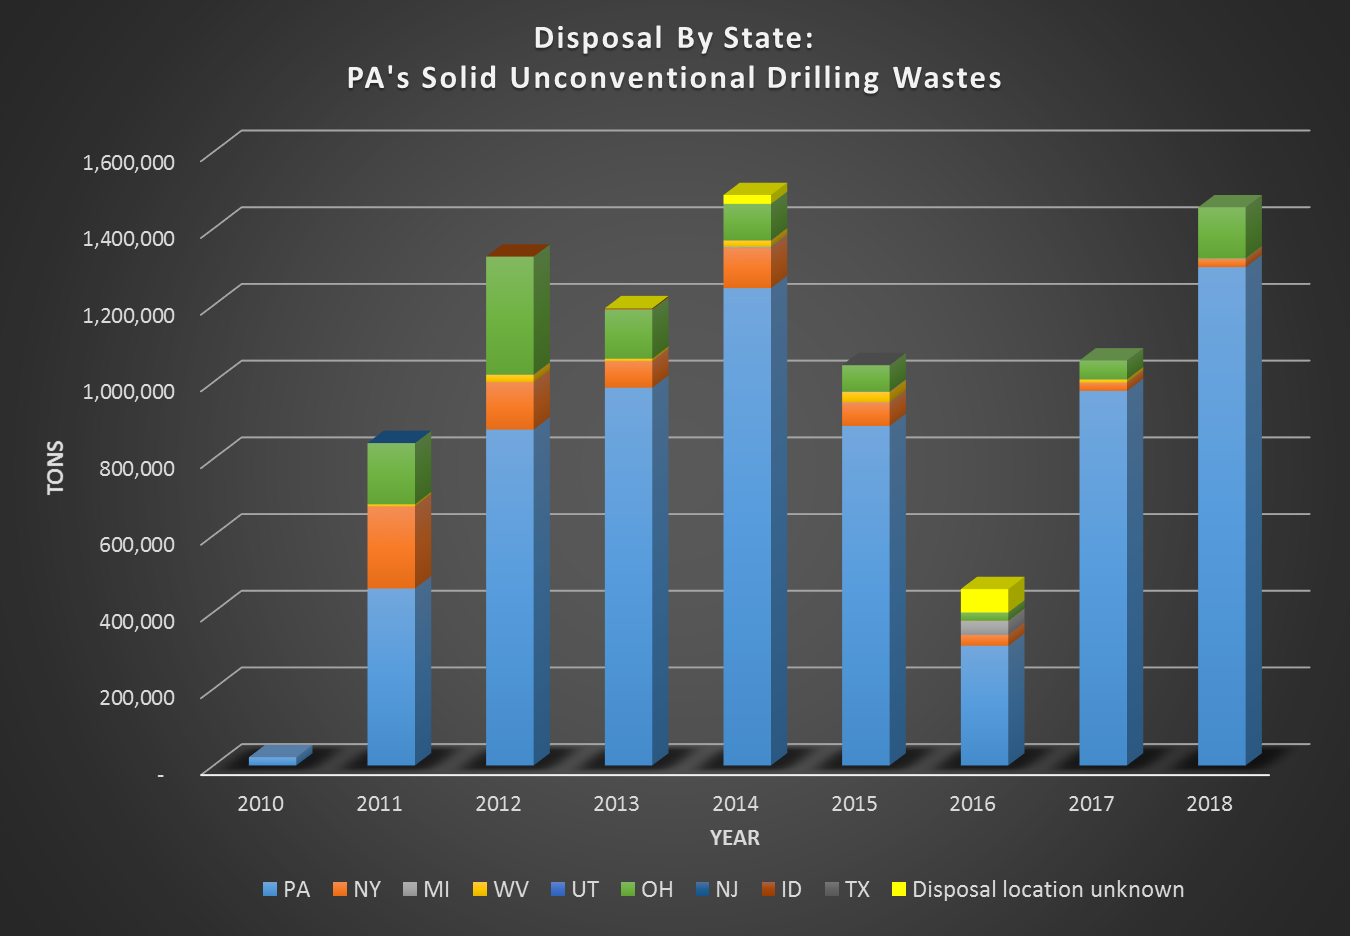
Figure 3: Annual tonnage of solid waste from the unconventional oil and gas industry, organized by the state it is disposed in. Data source: PA DEP, processed by FracTracker Alliance
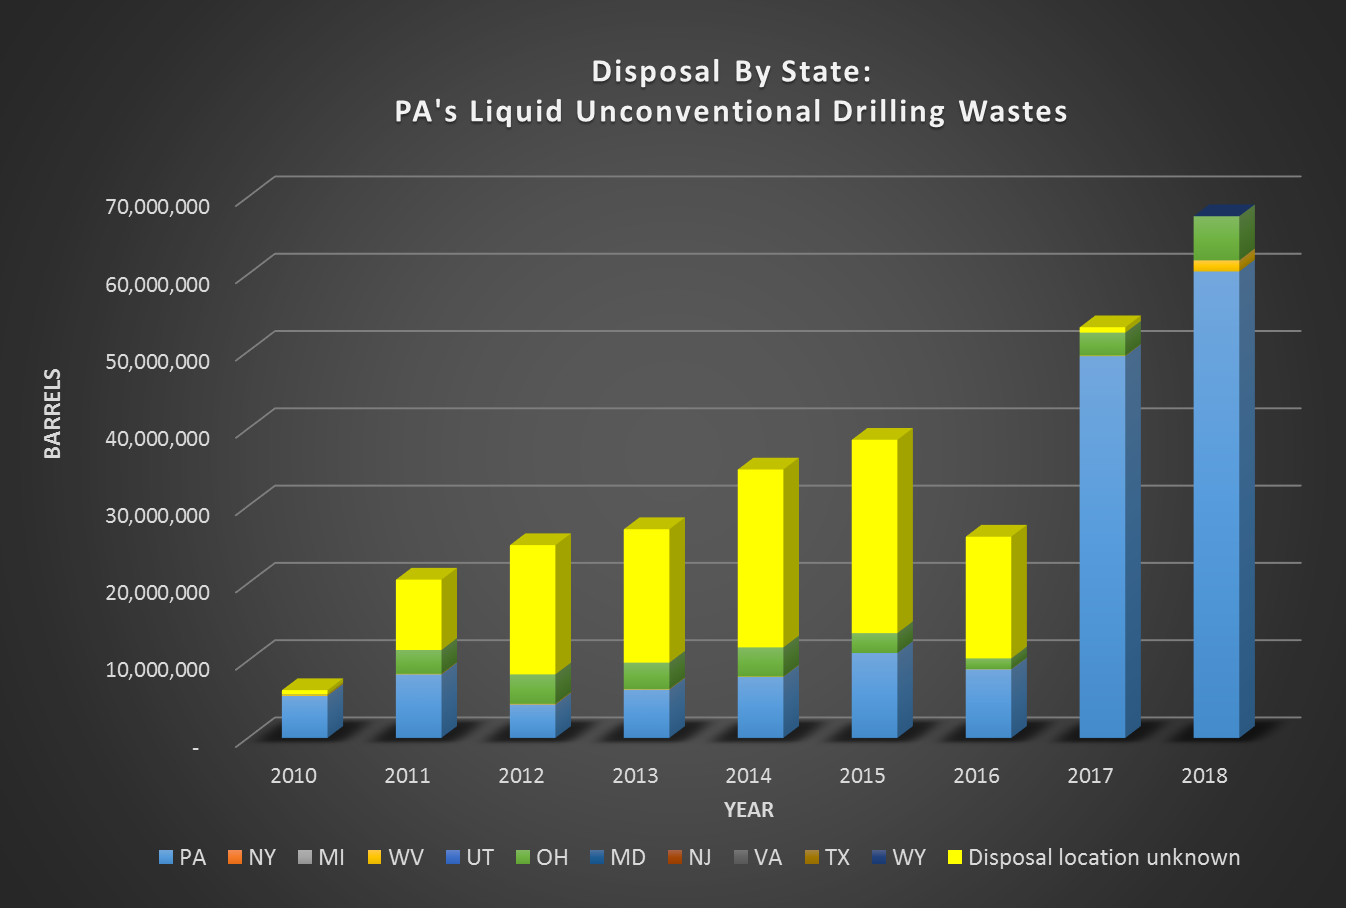
Figure 4: Annual volume of liquid waste from the unconventional oil and gas development, organized by state it is disposed in. One barrel is equivalent to 42 gallons. Data source: PA DEP, processed by FracTracker Alliance
Note the striking difference in disposal information for solid waste, compared with liquid waste, coming from Pennsylvania.
Until just the last year, often more than 50% of the known liquid waste generated in PA was disposed of at unknown locations. The PA DEP waste report lists waste quantity and method for these unknown sites, depending on the year: “Reuse without processing at a permitted facility,” “Reuse for hydraulic fracturing,” “Reuse for diagnostic purposes,” “Reuse for drilling or recovery,” “Reuse for enhanced recovery,” and exclusively in more recent years (2014-2016), “Reuse other than road-spreading.”
In 2011, of the 20.5 million barrels of liquid waste generated from unconventional drilling, about 56% was allegedly reused on other drilling sites. However, over 9 million barrels—or 44% of all liquid waste—were not identified with a final destination or disposal method. Identified liquid waste disposal locations included “Centralized treatment plant for recycle,” which received about a third of the non-solid waste products.
In 2012, the quantity of the unaccounted-for fracking fluid waste dropped to about 40%. By 2013, the percentage of unaccounted waste coming from fracking fluid dropped to just over 21%, with nearly 75% coming from produced fluid, which is briny, but containing fewer “proprietary”—typically undisclosed—chemicals.
By 2017, accounting had tightened up further. PA DEP data show that 99% of all waste delivered to undisclosed locations was produced fluid shipped to locations outside of Pennsylvania. By 2018, all waste disposal was fully accounted for, according to DEP’s records.
In looking more closely at the data, we see that:
Despite a reputation for being resistant to the fracking industry, for most of this decade, the state of New York has been accepting considerable amounts of fracking waste from Pennsylvania. The greatest percentage shipped to New York State is in the form of drilling waste solids that go to a variety of landfills throughout Central and Western New York.
Looking closely at the bar charts above, it’s easy to notice that the biggest recipients of Pennsylvania’s unconventional liquid drilling waste are Pennsylvania itself, Ohio, as well as a significant quantity of unaccounted-for barrels between 2011 and 2016 (“Disposal location unknown”). The data for disposal of solid waste in New York tells a different story, however. In this case, Pennsylvania, Ohio, and New York State all play a role. We’ll take a look specifically at the story of New York, and illustrate the data in the interactive map that follows.
In this map, source locations in Pennsylvania are symbolized with the same color marker as the facility in New York that received the waste from the originating well pad. In the “Full Screen” view, use the “Layers” drop down menu to turn on and off data from separate years.
View map full screen | How FracTracker maps work
From the early days of unconventional drilling in Pennsylvania, New York State’s landfills provided convenient disposal sites due to their proximity to the unconventional drilling occurring in Pennsylvania’s Northern tier of counties. Pennsylvania and Ohio took the majority of solid wastes from unconventional drilling waste from Pennsylvania. New York State, particularly between 2011-2015, was impacted far more heavily than all other states, combined (Figure 5, below).
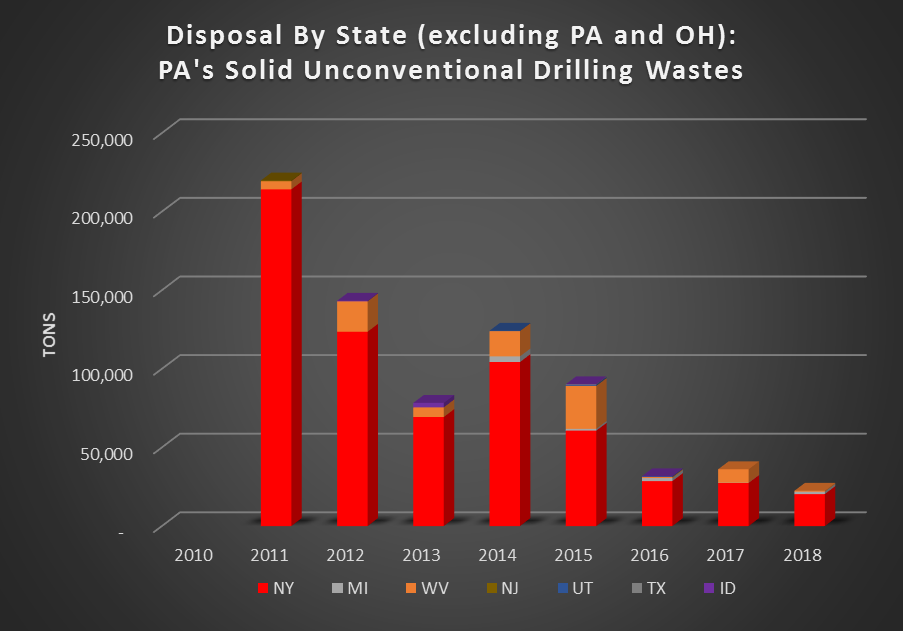
Figure 5: Known disposal locations (excluding PA and OH) of Pennsylvania’s solid waste. Data source: PA DEP, processed by FracTracker Alliance
Here’s the breakdown of locations in New York to where waste was sent. Solid waste disposal into New York’s landfills also dropped by half, following the state’s ban on unconventional drilling in 2014. Most of the waste after 2012 went to the Chemung County Landfill in Lowman, New York, 10 miles southeast of Elmira.
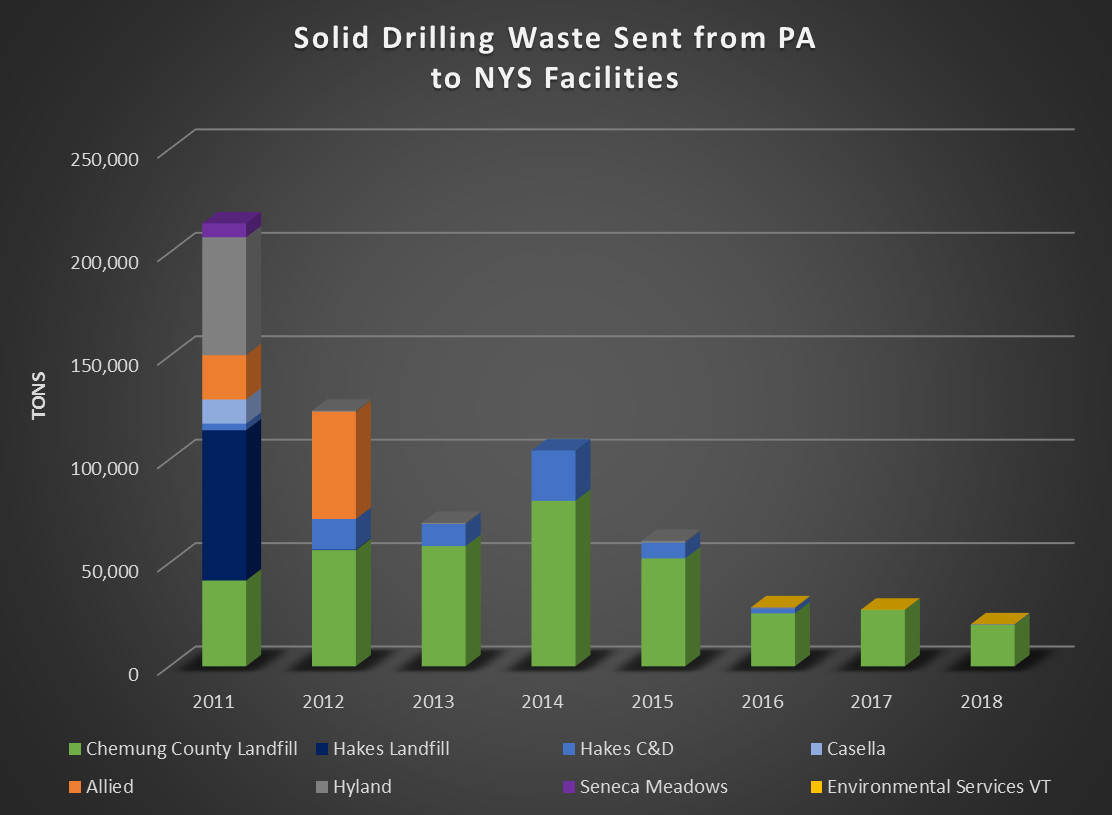
Figure 6: Solid waste from unconventional drilling, sent to facilities in NYS. Data source: PA DEP, processed by FracTracker Alliance
The fate of New York State’s landfill leachate that originates from unconventional drilling waste is a core concern, since landfill waste is not inert. If drilling waste contains radioactivity, fracking chemicals, and heavy metals that percolate through the landfill, and the resulting leachate is sent to municipal wastewater treatment plants, will traditional water treatment methods remove those wastes? If not, what will be the impact on public and environmental health in the water body that receives the “treated” wastewater? In Pennsylvania, for example, a case is currently under investigation relating to pollution discharges into the Monongahela River near Pittsburgh. “That water was contaminated with diesel fuels, it’s alleged, carcinogens and other pollutants,” said Rich Bower, Fayette County District Attorney.
Currently, a controversial expansion of the Hakes Landfill in Painted Post, New York is in the news. Sierra Club and others were concerned about oversight of radium and radon in the landfill’s leachate and air emissions, presumably stemming from years of receiving drill cuttings. The leachate from the landfill is sent to the Bath Wastewater Treatment plant, which is not equipped to remove radioactivity. “Treated” wastewater from the plant is then discharged into the Cohocton River, a tributary of the Chesapeake Bay. In April 2019, these environmental groups filed a law suit against Hakes C&D Landfill and the Town of Campbell, New York, in an effort to block the expansion.
Similar levels of radioactivity in leachate have also been noted in leachate produced at the Chemung County Landfill, according to Gary McCaslin, President of People for a Healthy Environment, Inc.
In recent years, much of the solid unconventional waste arriving in New York State has gone to the Chemung County Landfill (see Figure 6, above). Over the course of several years, this site requested permission to expand significantly from 180,000 tons per year to 417,000 tons per year. However, by 2016, the expansion was deemed unnecessary, and according, the plans were put on hold, in part “…because of a decline in the amount of waste being generated due to a slower economy and more recycling than when the expansion was first planned years ago.” The data in Figure 5 above also parallel this story, with unconventional drilling waste disposed in New York State dropping from over 200,000 tons in 2011 to just over 20,000 tons in 2018.
The story about liquid unconventional drilling waste exported from Pennsylvania to states other than Ohio is not completely clear (see Figure 7, below). Note that the data indicate more than a 2000% increase in waste liquids going from Pennsylvania to West Virginia after 2017. While it has not been officially documented, FracTracker has been anecdotally informed that a great deal of waste was already going to West Virginia, but that the record-keeping prior to 2018 was simply not strongly enforced.
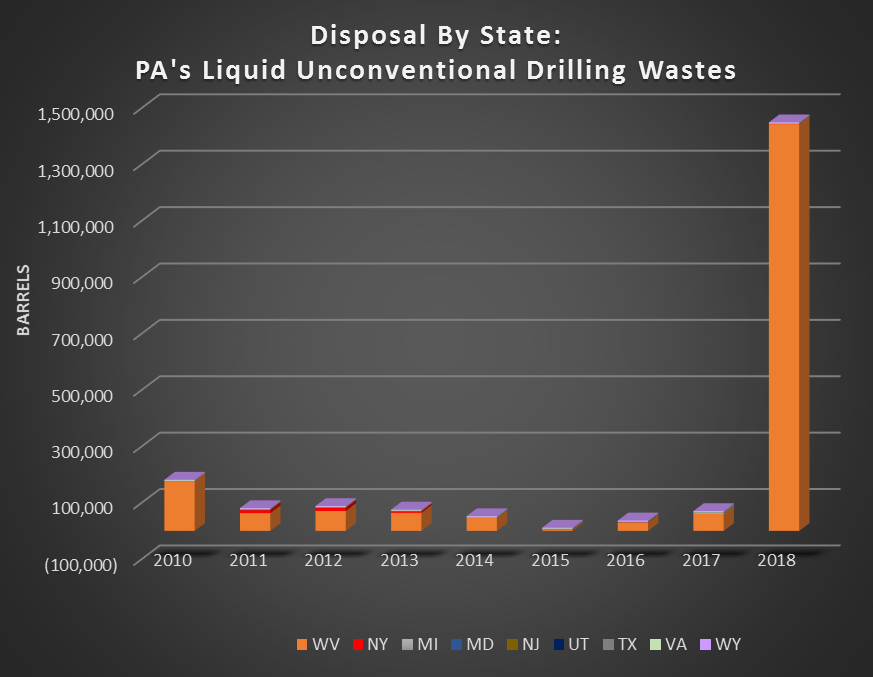
Figure 7: Known disposal locations (excluding Pennsylvania and Ohio) of Pennsylvania’s liquid waste. Data source: PA DEP, processed by FracTracker Alliance
Beginning in the very early years of the Pennsylvania unconventional fracking boom, a variety of landfills in New York State have also accepted liquid wastes originating in Pennsylvania, including produced water and flowback fluids (see Figure 8, below).
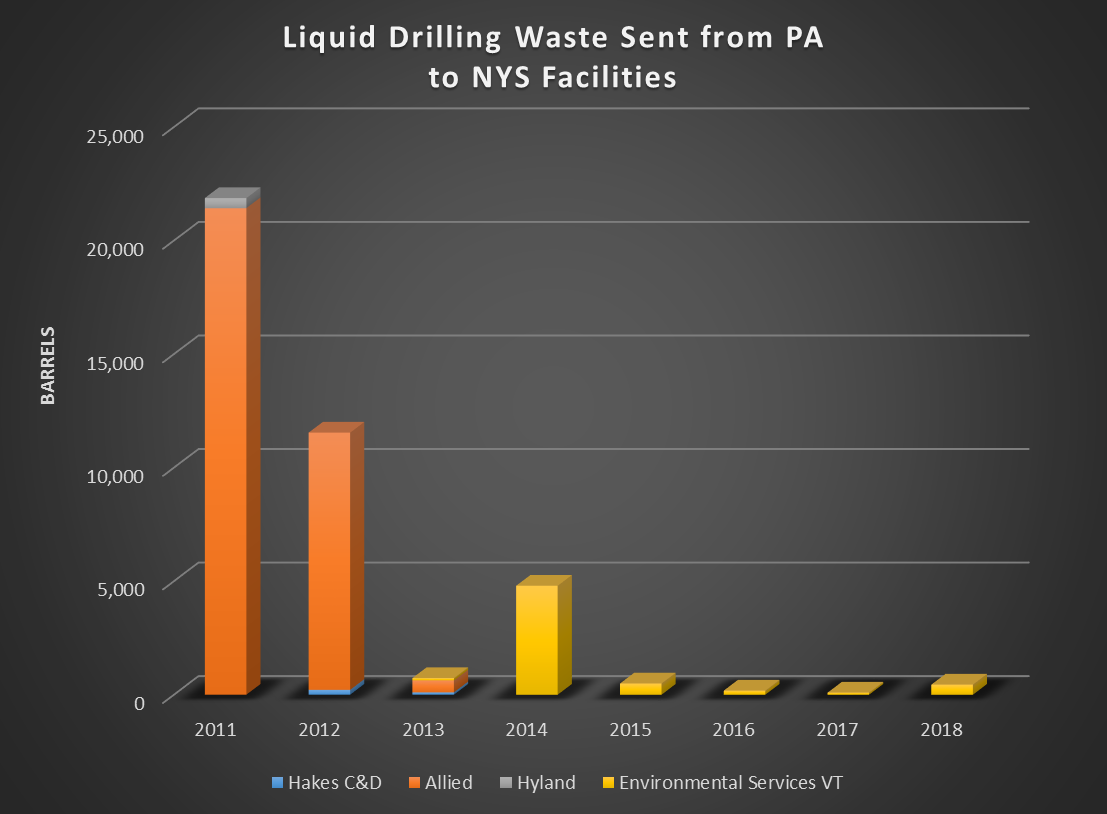
Figure 8: Liquid waste from unconventional drilling, sent to facilities in New York State. Data source: PA DEP, processed by FracTracker Alliance
In addition, while this information doesn’t even appear in the PA DEP records (which are publicly available back to 2010), numerous wastewater treatment plants did accept some quantity, despite being fully unequipped to process the highly saline waste before it was discharged back into the environment.
One such facility was the wastewater treatment plant in Cayuga Heights, Tompkins County, which accepted more than 3 million gallons in 2008. Another was the wastewater treatment plant in Auburn, Cayuga County, where the practice of accepting drilling wastewater was initially banned in July 2011, but the decision was reversed in March 2012 to accept vertical drilling waste, despite strong public dissent. Another wastewater treatment plant in Watertown, Jefferson County, accepted 35,000 gallons in 2009.
Fortunately, most New York State wastewater treatment plant operators were wise enough to not even consider adding a brew of unknown and/or proprietary chemicals to their wastewater treatment stream. Numerous municipalities and several counties banned fracking waste, and once the ban on fracking in New York State was instituted in 2014, nearly all importation of liquid unconventional drilling waste into the state ceased.
Nevertheless, conventional, or vertical well drilling also generates briny produced water, which the New York State Department of Environmental Conservation (DEC) permits communities in New York to accept for ice and dust control on largely rural roads. These so-called “beneficial use determinations” (BUDs) of liquid drilling waste have changed significantly over the past several years. During the height of the Marcellus drilling in around 2011, all sorts of liquid waste was permitted into New York State (see FracTracker’s map of affected areas) and was spread on roads. As a result, the chemicals—many of them proprietary, of unknown constituents, or radioactive—were indirectly discharged into surface waters via roadspreading.
Overall, in the years after the ban in 2014 on high volume hydraulic fracturing was implemented, restrictions on Marcellus waste coming into New York have strengthened. Very little liquid waste entered New York’s landfills after 2013, and what did come in was sent to a holding facility owned by Environmental Services of Vermont. This facility is located outside Syracuse, New York.
Fortunately, not long after these issues of fracking fluid disposal at wastewater treatment facilities in New York State came to light, the practice was terminated on a local level. The 2014 ban on fracking in New York State officially prevented the disposal of Marcellus fluids in municipal wastewater treatment facilities and required extra permits if it were to be road-spread.
In New York State, the State Senate—after 8 years of deadlock—in early May 2019, passed key legislation that would close a loophole that had previously allowed dangerous oil and gas waste to bypass hazardous waste regulation. Read the press release from Senator Rachel May’s office here. However, despite strong support from both the Senate, and the Assembly, as well as many key environmental groups, the Legislature adjourned for the 2019 session without bringing the law to a final vote. Said Elizabeth Moran, of the New York Public Interest Research Group (NYPIRG), “I want to believe it was primarily a question of timing… Sadly, a dangerous practice is now going to continue for at least another year.”
See Earthworks’ recent three part in-depth reporting on national, New York, and Pennsylvania oil and gas waste, with mapping support by FracTracker Alliance.
As long as hydrocarbon extraction continues, the issues of waste disposal—in addition to carbon increases in the atmosphere from combustion and leakage—will result in impacts on human and environmental health. Communities downstream and downwind will bear the brunt of landfill expansions, water contamination, and air pollution. Impacts of climate chaos will be felt globally, with the greatest impacts at low latitudes and in the Arctic.
Transitioning to net-zero carbon emissions cannot be a gradual endeavor. Science has shown that in order to stay under the 1.5 °C warming targets, it must happen now, and it requires the governmental buy-in to the Paris Climate Agreement by every economic power in the world.
No exceptions. Life on our planet requires it.
We have, at most, 12 years to make a difference for generations to come.
By Karen Edelstein, Eastern Program Coordinator, FracTracker Alliance
![]()
216 Franklin St, Suite 400, Johnstown, PA 15901
Phone: +1 (717) 303-0403 | info@fractracker.org
FracTracker Alliance is a 501(c)3 non-profit: Tax identification number: 80-0844297


