The Mountaineer State: Where Politics, a Fossil Fuel Legacy, and Fracking Converge
Introduction
The Mountaineer State is one of the most stunningly beautiful states in all the United States, despite its complicated and unique relationship with fossil fuels dating back to the West Virginia Coal Wars of 1912 to 1921. This relationship has compromised the state’s distinctive ecosystems and its social cohesion. Instead of remediating or preventing the impacts of fossil fuels, the state’s elected officials have exploited them for political and monetary gain. Understanding this history and the potential next steps in the march of the fossil fuel industry will help those who continue to fight for an alternative future for West Virginia. At the same time, it is critical that we identify legislation that would perpetuate fossil fuel dependence, the individuals who are behind said legislation, and the current extent of the fossil fuel industry, especially considering the developing Appalachian Storage and Trading Hub (ASTH) that is supported by the elected officials in in D.C. and Charleston.
Ohio Power’s Mitchell (Foreground) and Kammer (Background) Coal Power Plants, Marshall County, Combined Capacity 2,345 MegaWatts. Photo by Ted Auch, aerial assistance provided by LightHawk
Impeding Fossil Fuel Developments Threaten West Virginia Once Again
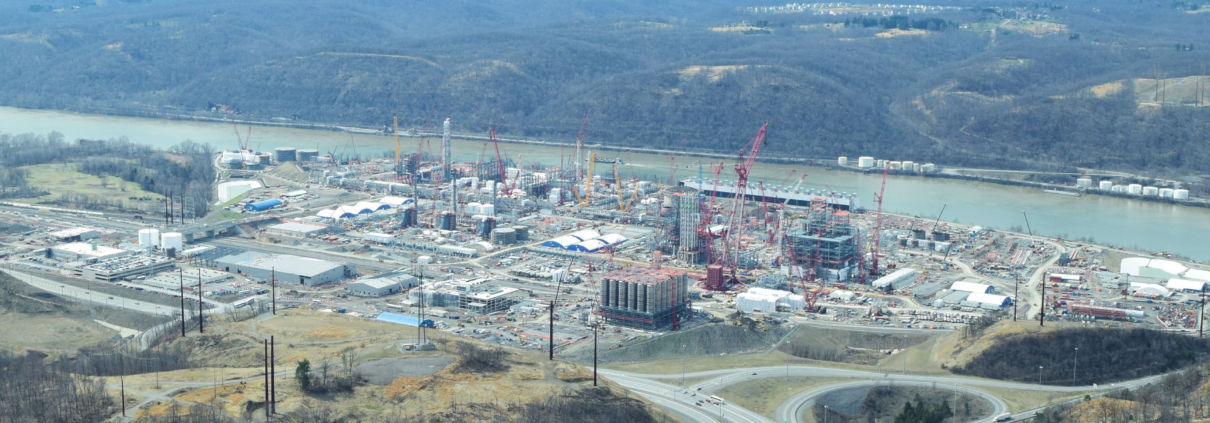
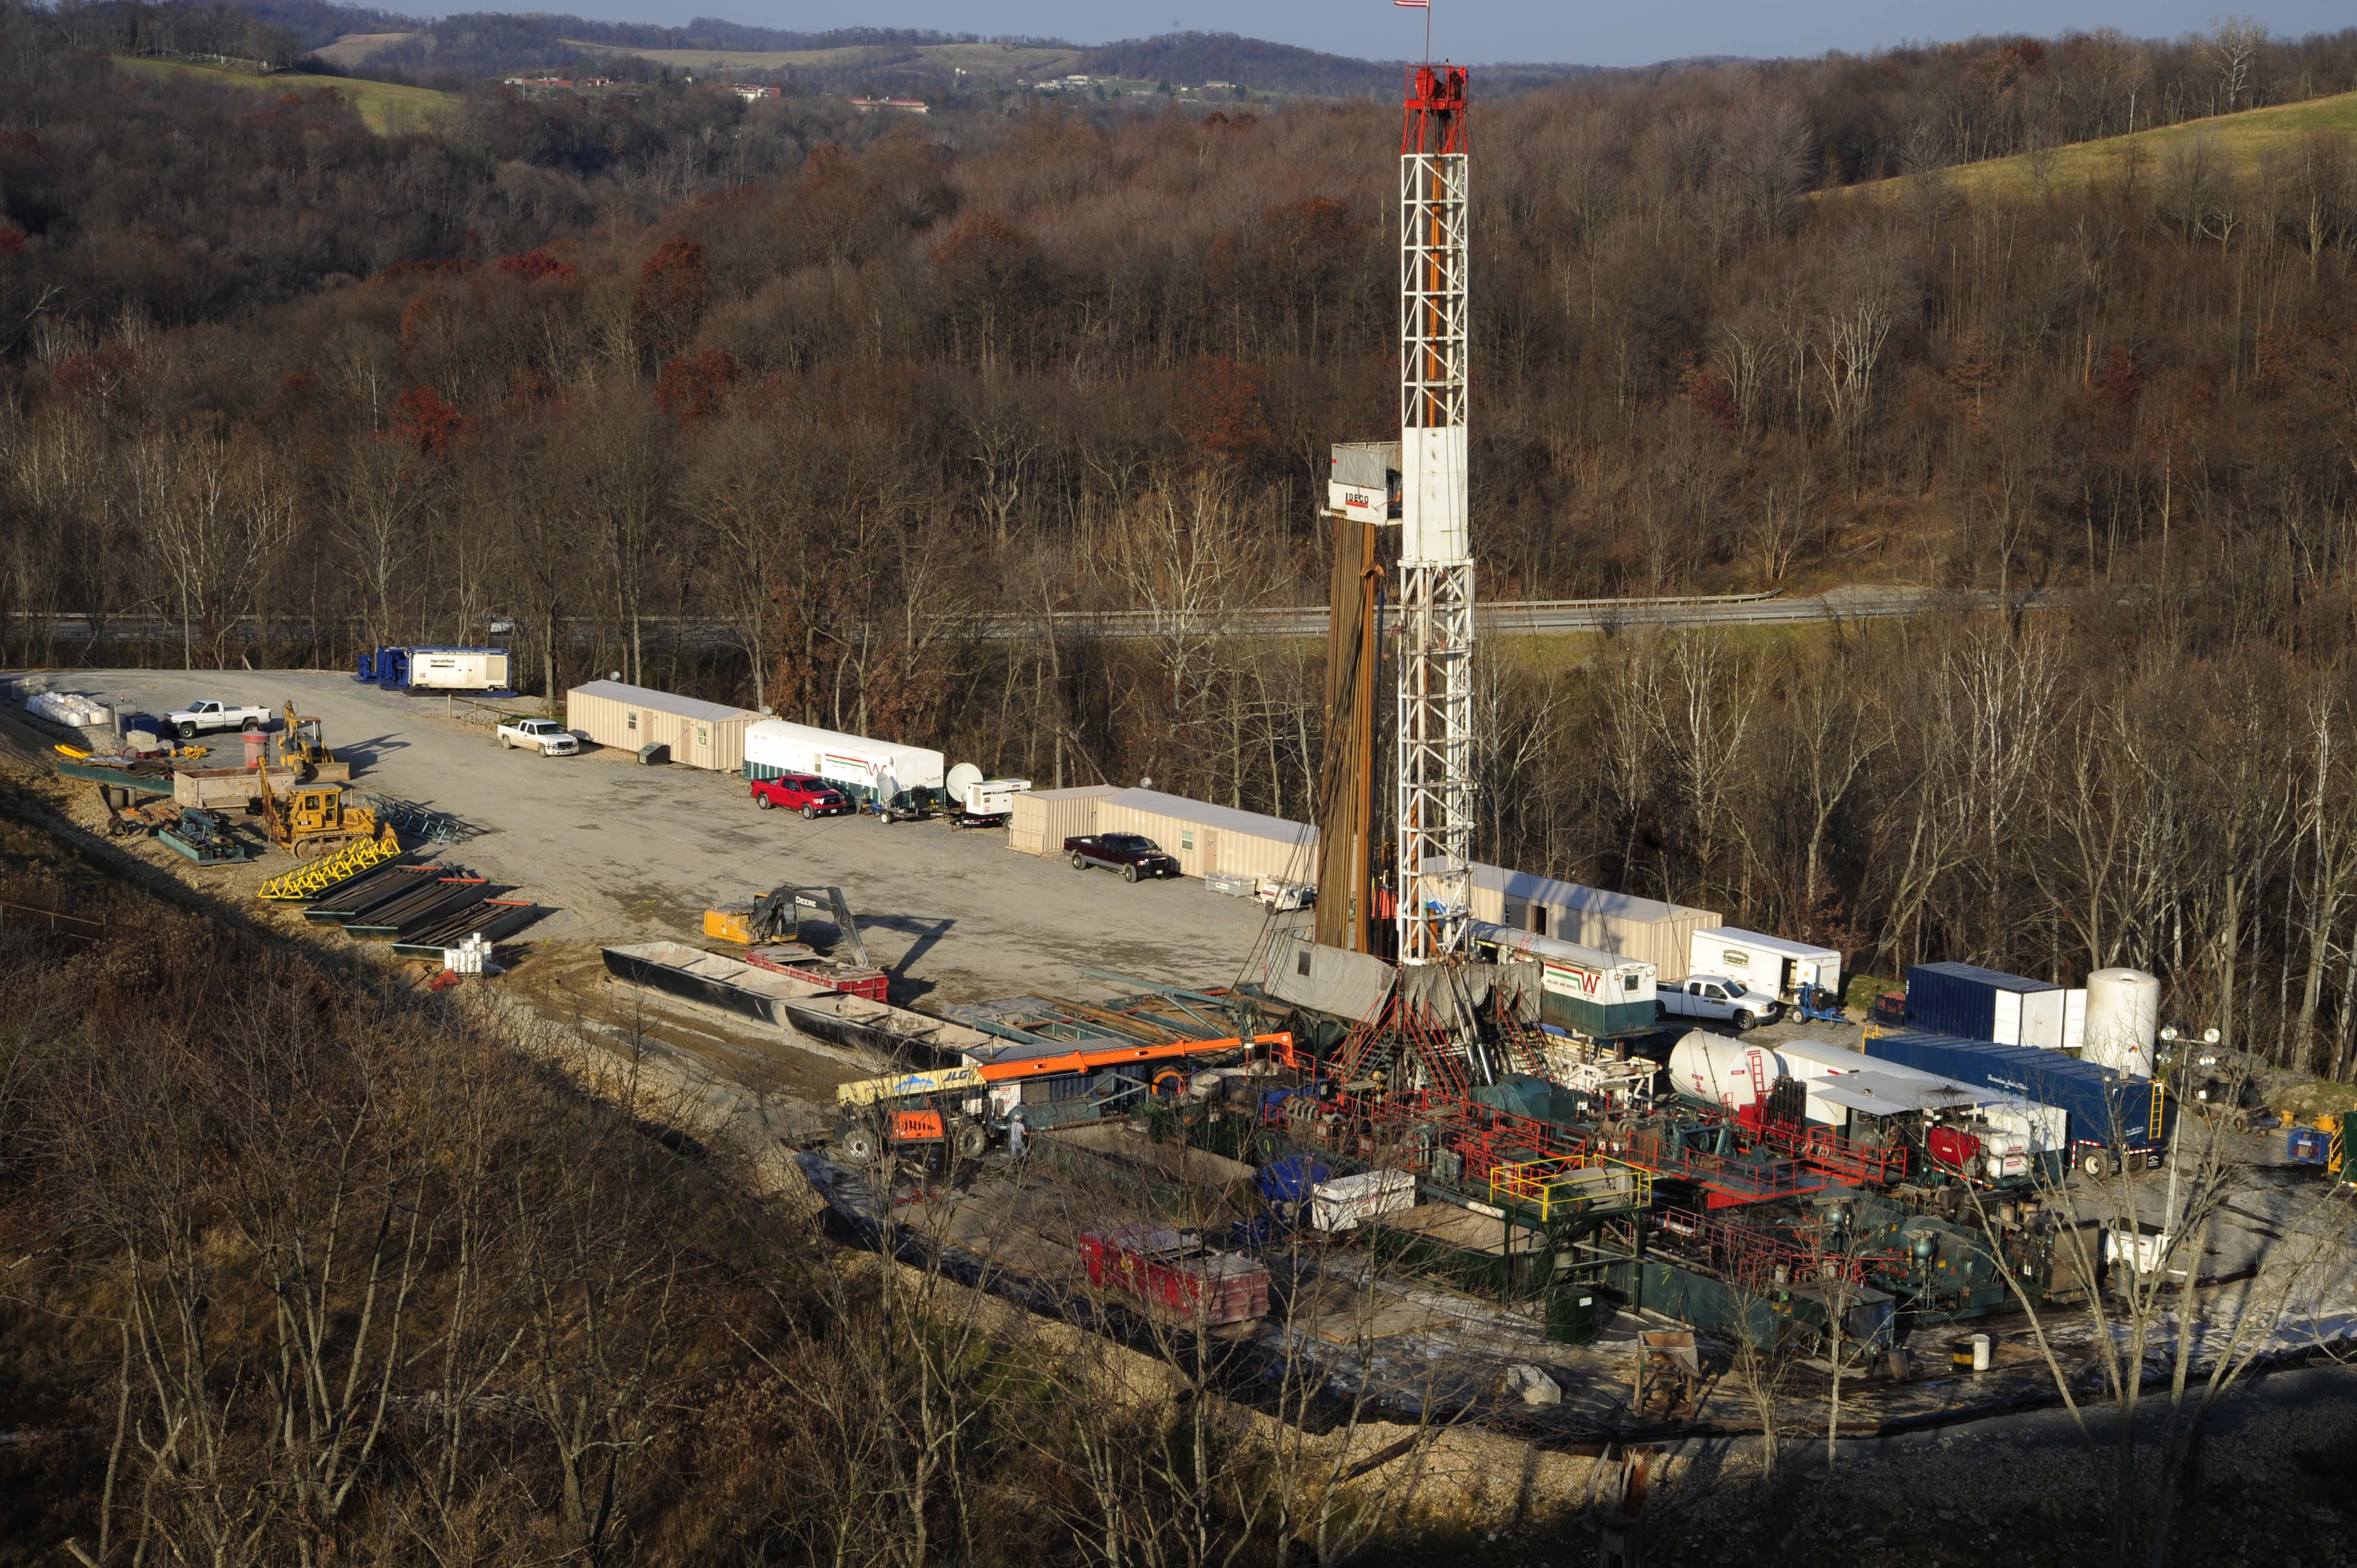
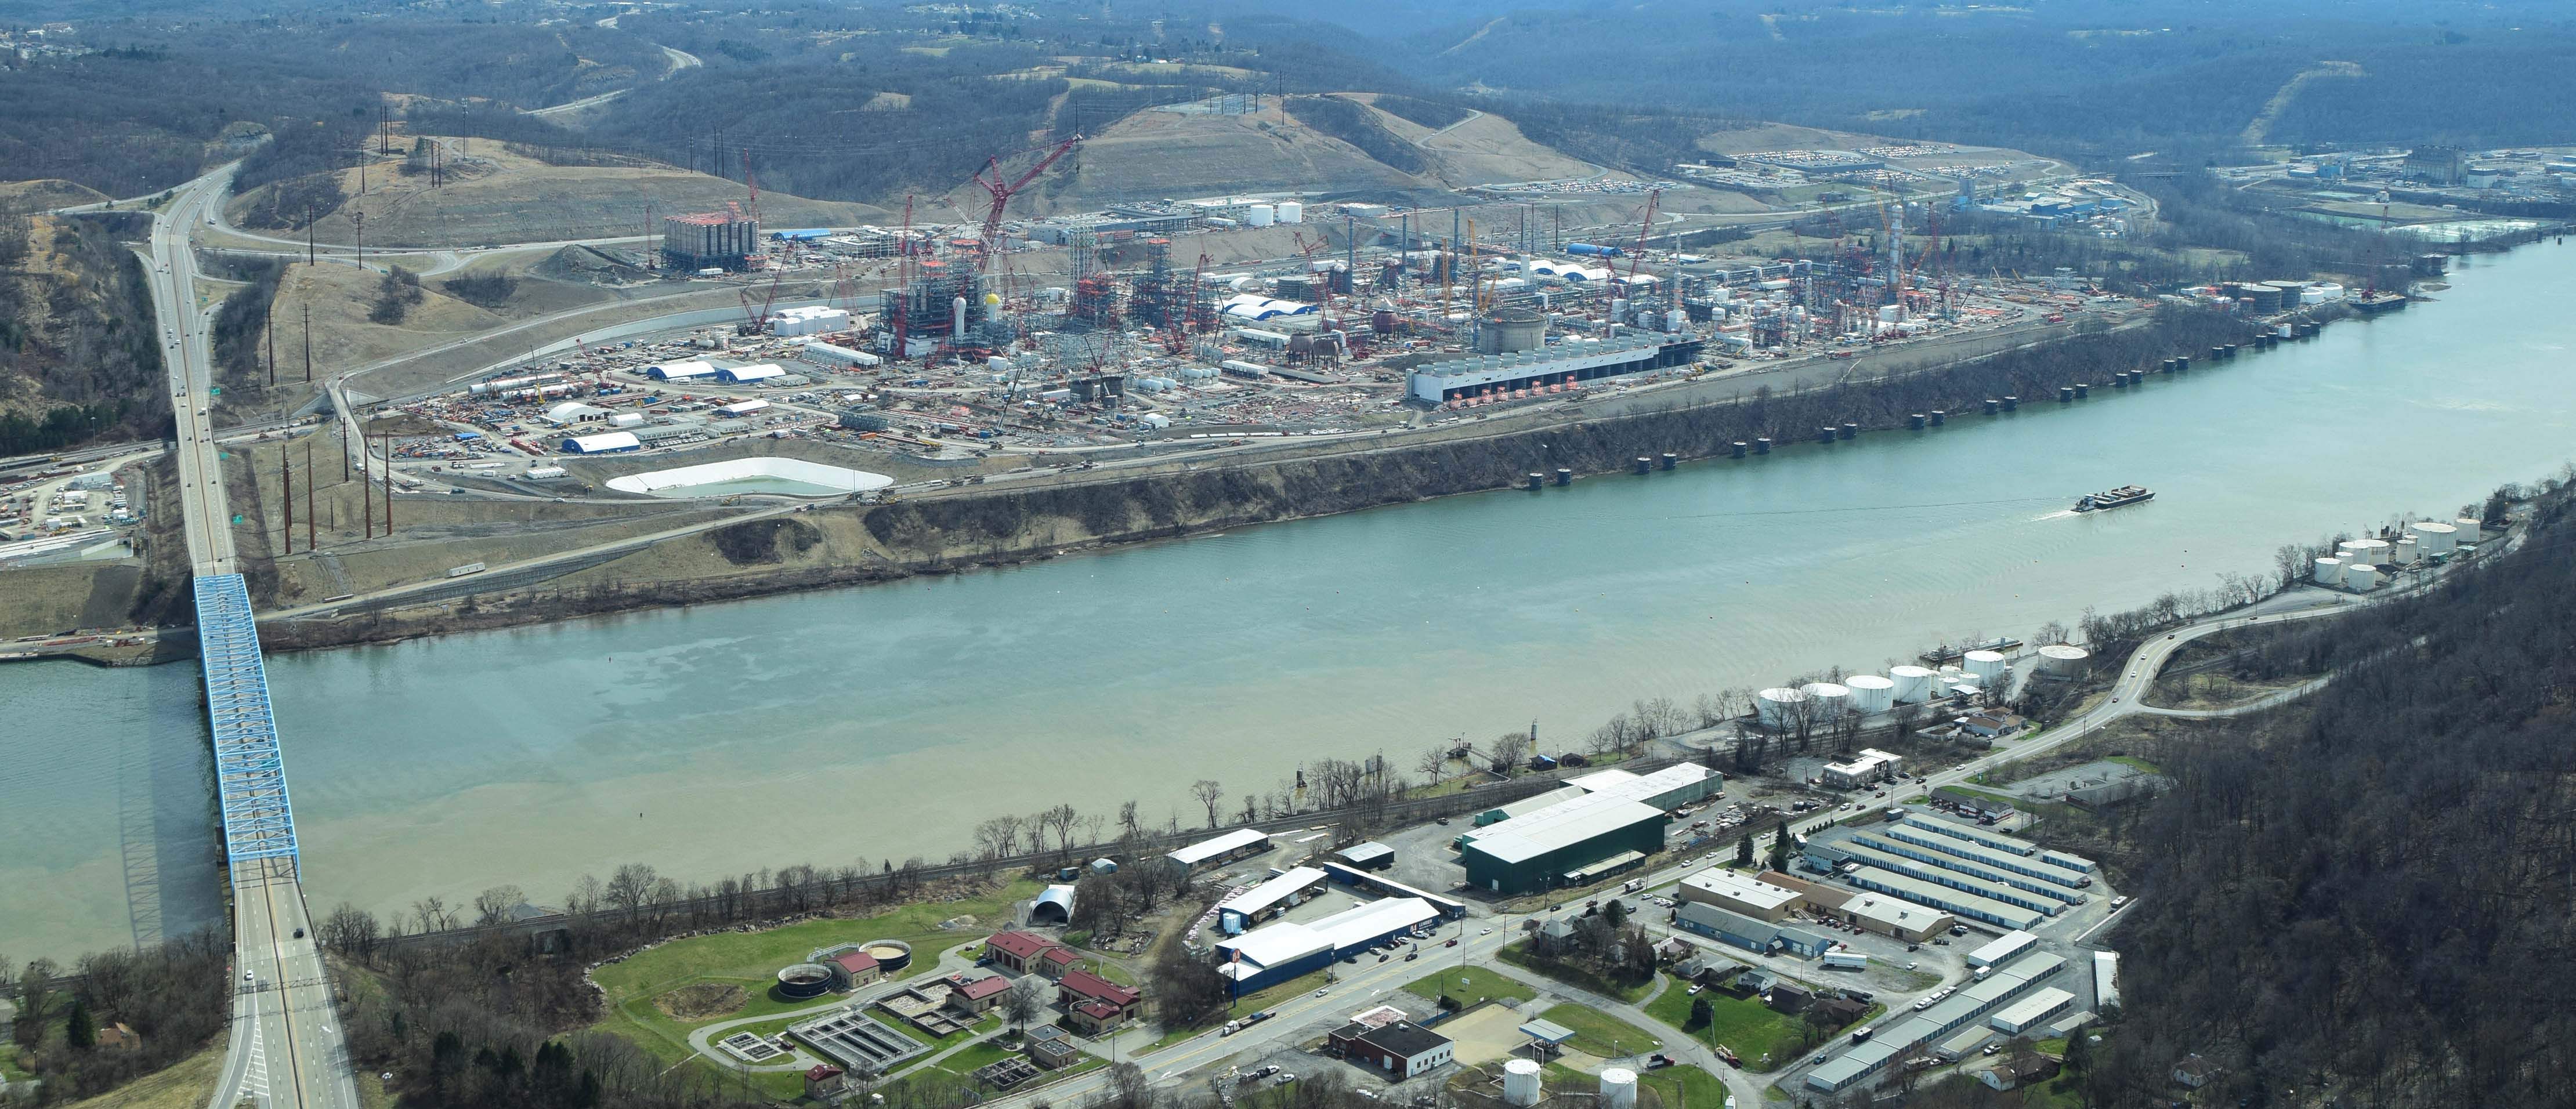
West Virginia has a rich, complicated, and occasionally violent history with coal mining and now is at the vanguard of the High Volume Hydraulic Fracturing (HVHF) revolution. It also happens to sit at the heart of what Appalachian governors, senators, and even land-grant universities are touting is the panacea for all that ails the region: the Appalachian Storage and Trading Hub (ASTH), a key part of the Ohio River Valley petrochemical build out. This puts West Virginia in a peculiar position, with one foot longingly in the past with coal mining and one moving forward with investments in fracking and now the ASTH.
On the one hand, there is local optimism about King Coal’s return, stoked by Donald Trump and industry friends like Robert Murray. A closer look reveals they are sending decidedly different messages to Appalachian coal miners and their families, with the former stating repeatedly that he would bring coal back, and the latter agreeing but offering the caveat that “Trump can’t bring jobs back . . . [because] many of those jobs were lost to technology rather than regulation.”
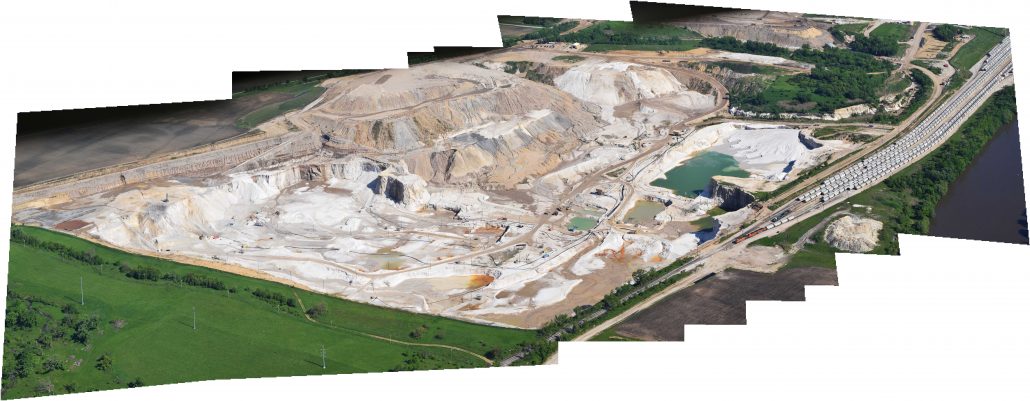
Murray Energy’s Consolidation Coal Mine, Marshall County
This is not to suggest that there are hard feelings between Trump and Murray; a Document Investigations publication reveals an invitation from Murray Energy to host a Trump fundraiser on July 24, 2019 in Wheeling, West Virginia at WesBanco Arena with a cover charge of $150.00 made payable to Trump Victory, Donald Trump and the Republican National Committee’s joint presidential campaign fundraising. West Virginia Governor Jim Justice (who is uncoincidentally a leading booster of the ASTH) indicated he would be in attendance. Additionally, Murray in his rescheduling letter to the West Virginia governor indicated, “Present with us will be Governors Mike DeWine of Ohio, Jim Justice of West Virginia, and Matt Bevins of Kentucky; Senators Shelley Moore Capito and Rob Portman of these states; and Congressman Bill Johnson and Dave McKinley and the House Speaker and Senate President form the two states.”
Declining Jobs, Increasing Automation
After at least seventeen years of 5% declines in net coal production, and 3% increases in hiring, the coal mining industry in West Virginia had had enough. Starting in 2012, they turned the tide on labor by leaning into the automation revolution and in the process, mine labor has declined by 8% per year since then. Automation and an increasing reliance on more blunt methods of mining, including strip-mining and/or Mountaintop Removal, have allowed the mining industry to increase productivity per labor hour by 5.8% to 6.3% per year since 2012, according to data compiled by US Department of Labor’s Office of Mine Safety and Health Administration. All of these savings translate into Mergers And Acquisitions as well as hefty profits for the likes of Murray, private equity and large institutional investors that have no interest in the welfare of Appalachia, its people, and the constant undertone of labor vs. capital throughout the region.
Even with all the corporate, state, and federal subsidies we have still had a rash of bankruptcies in the last three months. Most recently, Revelation Energy and its affiliate Blackjewel, experts in “Vulture Capitalism,” filed for Chapter 11 on July 1st of this year causing countless bounced paychecks among their 1,700 employees across Virginia, Wyoming, Kentucky, and West Virginia.
So while King Coal continues to paint federal regulations as excessively burdensome and the primary impediment to their expansion, it is clear that the enemy of coal miners is not regulations, but rather automation and the urgent attempt to squeeze every last drop of profitability out of a dying industry. even as coal production nationally declines by nearly double digits annually, a signal that the end is near, mining companies are able to continue generating reliable profits thanks to automation and artificial intelligence. This might be why private equity climate change denying titans like Stephen Schwarzman are investing so heavily in the likes of MIT’s School of Artificial Intelligence. The growing discrepancy between coal production and coal jobs was pointed out in a recent Columbia University report on the failure of states, counties, and communities to prepare themselves for the day when their status as “company towns”[1] will switch from a point of pride to a curse. The Columbia researchers pointed out that:
“Employment in the coal mining industry declined by over 50 percent in West Virginia, Ohio, and Kentucky between 2011 and 2016. State-level impacts mask even more severe effects at local levels. In Mingo County, West Virginia, coal mining employed over 1,400 people at the end of 2011. By the end of 2016, that number had fallen below 500. Countywide, employment fell from 8,513 to 4,878 over this period . . . suggesting there could be important labor market spillovers from mining to the broader economy.”
A Bloody History Haunts West Virginia’s Coal Fields
The last time West Virginia experienced “important labor market spillovers” was during the West Virginia Coal Wars of 1912 to 1921. West Virginia University Press, in summarizing the book “Life, Work, and Rebellion in the Coal Fields: The Southern West Virginia Miners, 1880-1922” by David Alan Corbin, describes this violent moment in the state’s history:
“Between 1880 and 1922, the coal fields of southern West Virginia witnessed two bloody and protracted strikes, the formation of two competing unions, and the largest armed conflict in American labor history – a week-long battle between 20,000 coal miners and 5,000 state police, deputy sheriffs, and mine guards. These events resulted in an untold number of deaths, indictments of over 550 coal miners for insurrection and treason, and four declarations of martial law. Corbin argues that these violent events were collective and militant acts of aggression interconnected and conditioned by decades of oppression. His study goes a long way toward breaking down the old stereotypes of Appalachian and coal-mining culture”
The Coal Wars culminated in the August 1921 Battle of Blair Mountain, the largest labor uprising in United States history which resulted in a deadly standoff between 10,000 armed coal miners and 3,000 strikebreakers called the Logan Defenders. The battle resulted in a casualty range of 20 to 100 as well as the treason conviction of some 22+ United Mine Workers of America members. This crushed the union, and the larger effect was a chill throughout Appalachia for more than a decade.
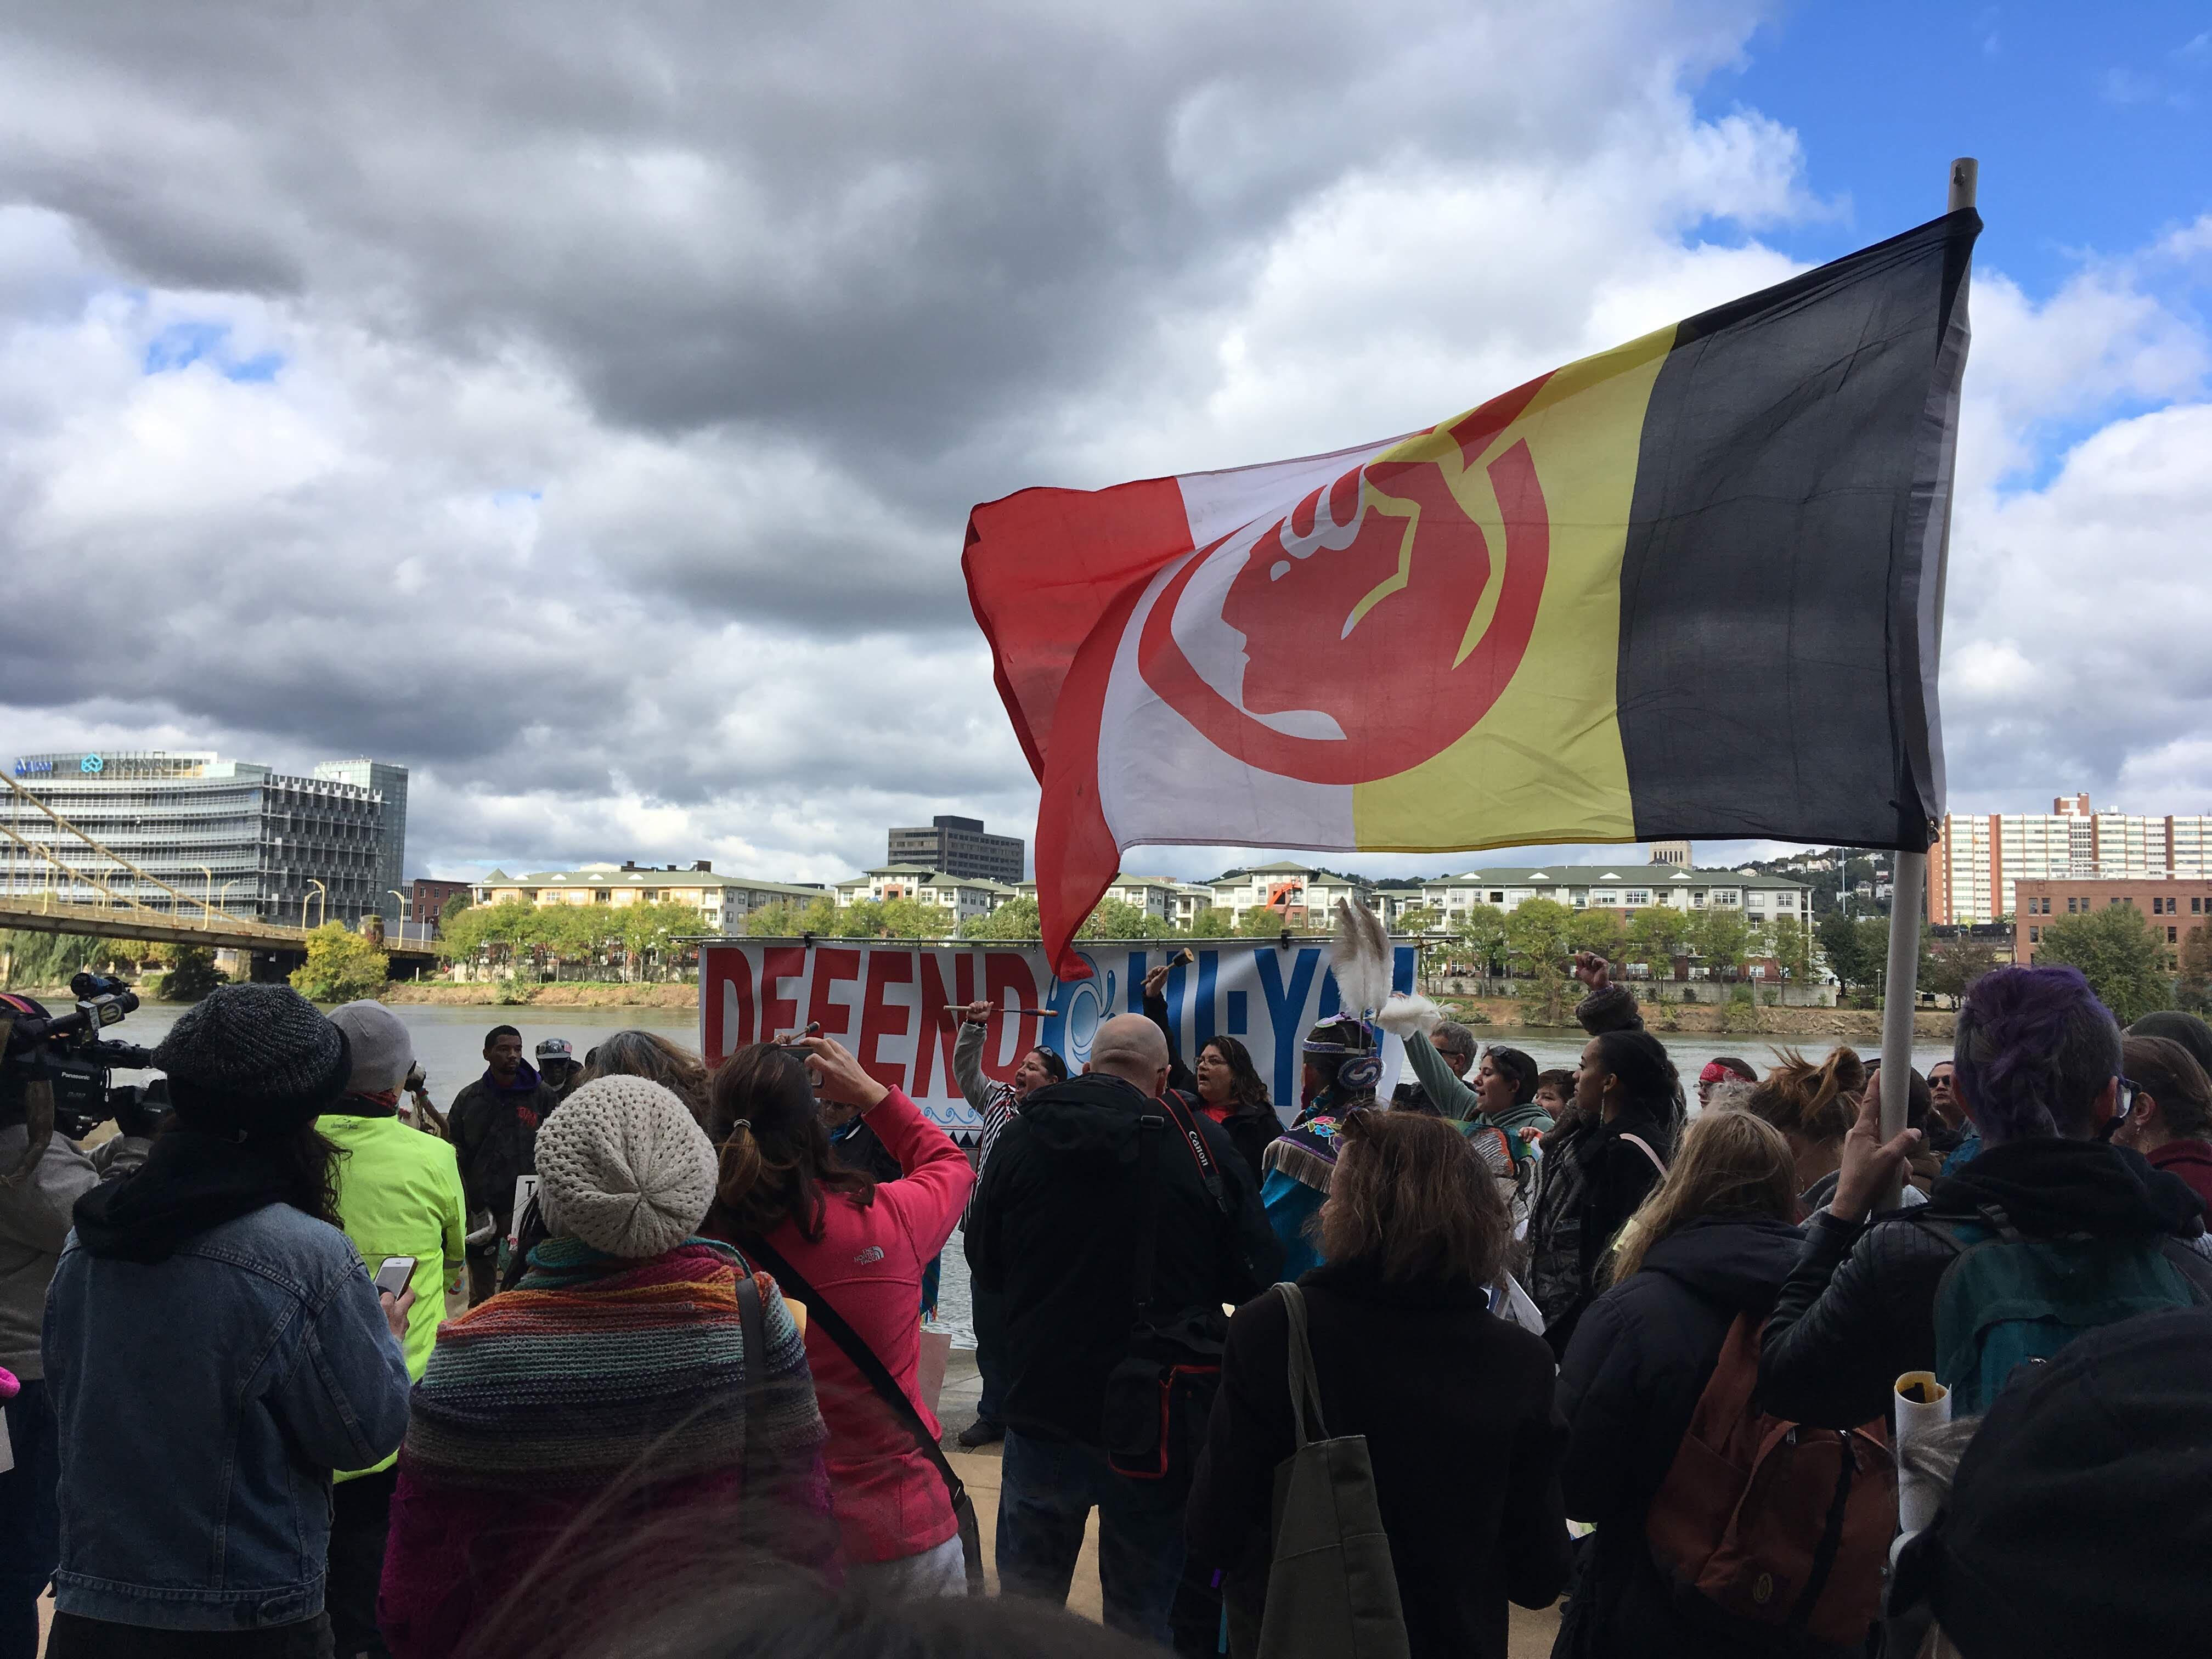
A similar chill is beginning to percolate as part of the fear around resistance or questioning of the ASTH and its myriad tentacles. This chill is coupled with a growing ambivalence and resignation to the most recent colonization of the Ohio River Valley by yet another iteration of the fossil fuel industrial complex.
How Can Appalachia Escape the Tight Grip of the Hydrocarbon Industrial Complex?
The state’s historical labor strife is worth mentioning to emphasize that Appalachia has been thrown under the “natural resource curse” bus before, and it has not responded kindly (see documentary “Harlan County USA” directed by Barbara Kopple). This might be why industry stakeholders fund the likes of the Koch Brothers-backed American Legislative Executive Council in efforts to pass dubiously titled “critical infrastructure” bills that they’ve written in states including the ASTH states of Ohio, Pennsylvania, Kentucky, and West Virginia. [2] It also might be why West Virginia Senator Manchin is trying to separate himself from his prior optimism about the supposed $84 billion China would invest in ASTH related projects across the state and his willingness to compromise the safety of his own constituents for the sake of profiteering state-backed firms in China, Saudi Arabia, and Thailand.
It won’t be long before we start to hear echoes of Florence Reece’s 1931 labor resistance anthem “Which Side Are You On?” echoing out from every peak and holler in West Virginia in reference to Manchin and Justice. Their milquetoast response to questioning around the viability of the ASTH prompted the West Virginia Gazette editorial page to write:
“So far, the entire project, which was hailed as the salvation of West Virginia’s economy at the time, looks like nothing but smoke and confetti. There’s been no movement and the Justice administration rarely mentions it unless asked. The reply has typically been a guarded ‘it’s happening’ and not much else. It’s time for state government to level with the people of West Virginia on what exactly is happening here. Not only did the announcement raise false hopes, but the question of national security is valid and important. We urge the governor or someone in his administration to give an official update on the project.”


In the interim, West Virginia’s elected officials continue to prop up coal as the Mountaineer State’s salvation. But the gig will be up eventually. It appears that there are two ways to exit this zero-sum relationship with the fossil fuel industry according to the neoliberal economic model we espouse here in the United States: 1) A Glide Path strategy that will allow West Virginia to methodically transition to a more diversified economy, or 2) an extremely painful Jump Condition type transition over a much shorter period of time that will likely last no more than a couple of years and leave West Virginians very angry and looking for someone to blame.
Those of us that accept climate change as fact, advocate for the Green New Deals of the world, and work towards a renewable energy future can easily dismiss either pathway’s impacts on Appalachia with the mantra, “Hey, they [Appalachia] made their bed now they have to lie in it!” However, this would be counter to the social contract narrative we have created for this country and would be incredibly hypocritical given that the primary steroid that fueled American Exceptionalism/Capitalism was cheap and abundant domestic fossil fuels. As Kim Kelly of Teen Vogue so perfectly put it in laying out her very personal connections to the struggle between the need to pay bills and the environmental impacts of fossil fuel reliant jobs: “Make no mistake: The coal miner and pipeline worker know about the environmental costs of their labor, but when faced with the choice of feeding their kids or putting down their tools in the name of saving the planet, the pressures of capitalism tend to win; their choice is made for them.”
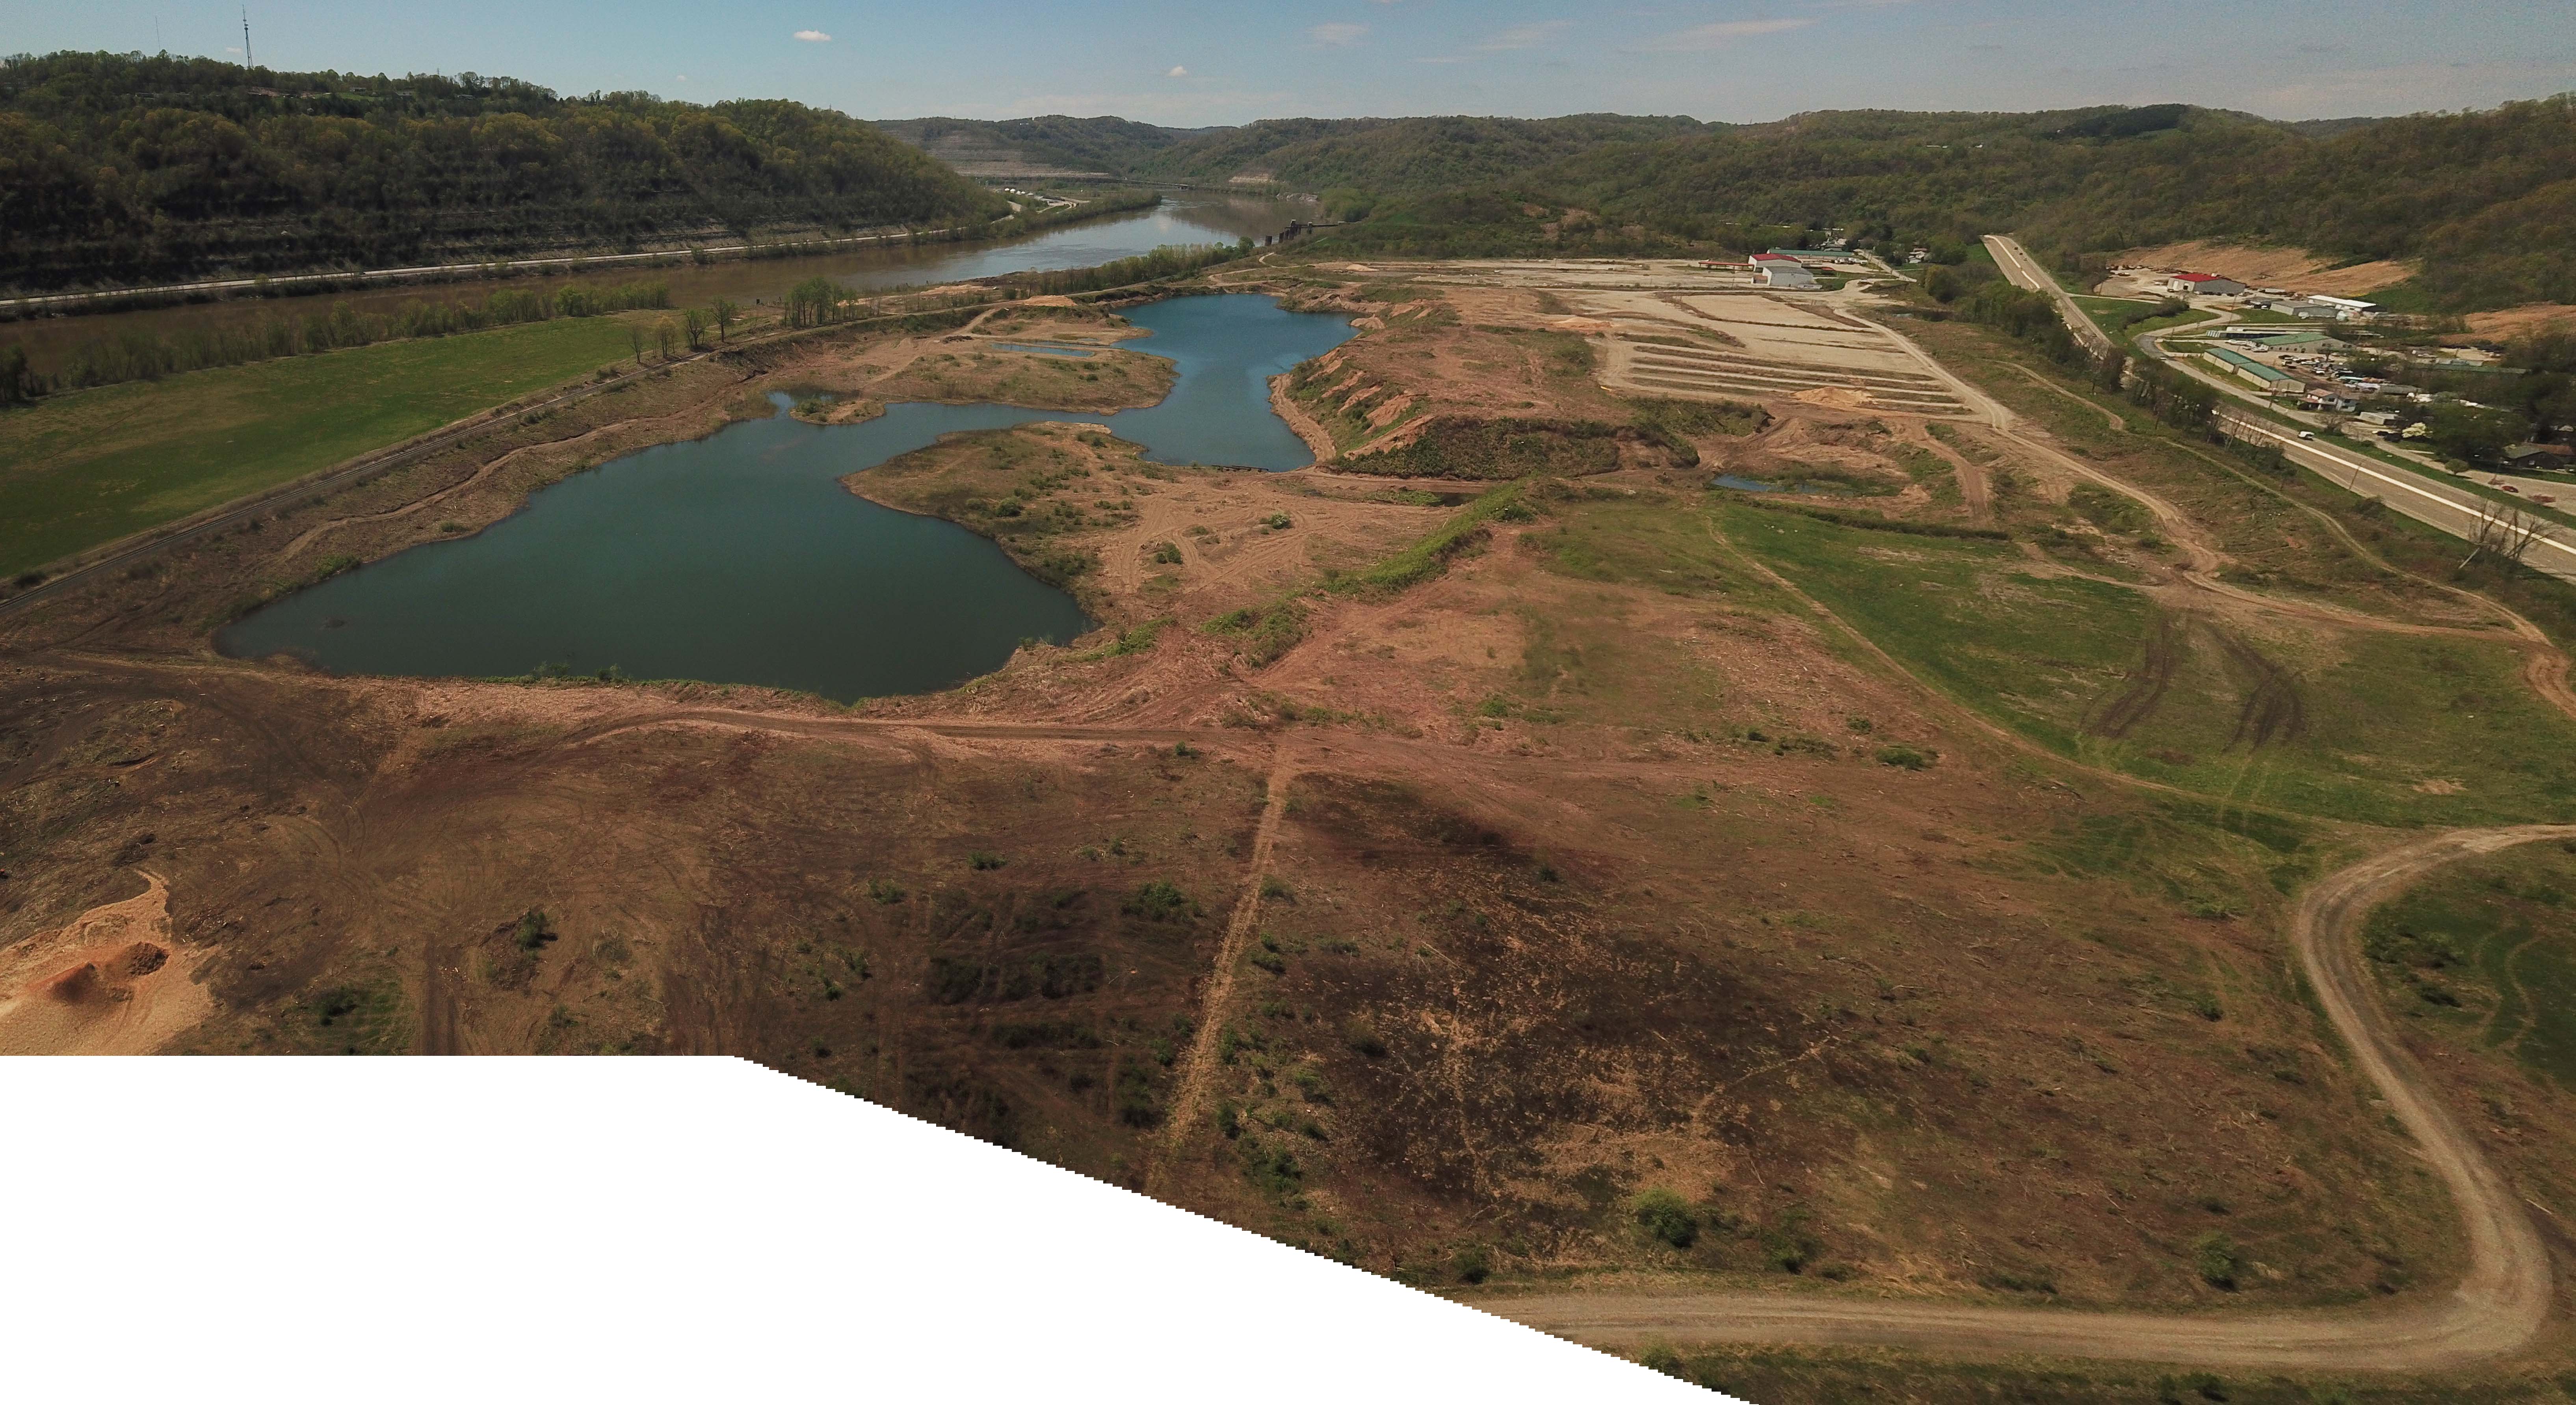
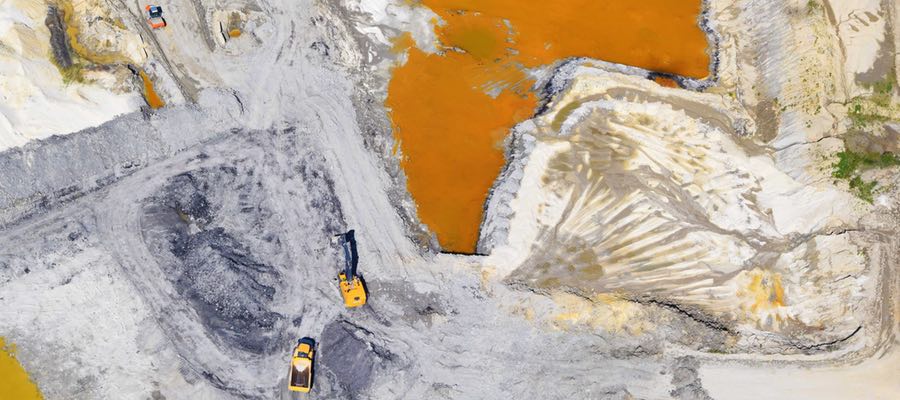
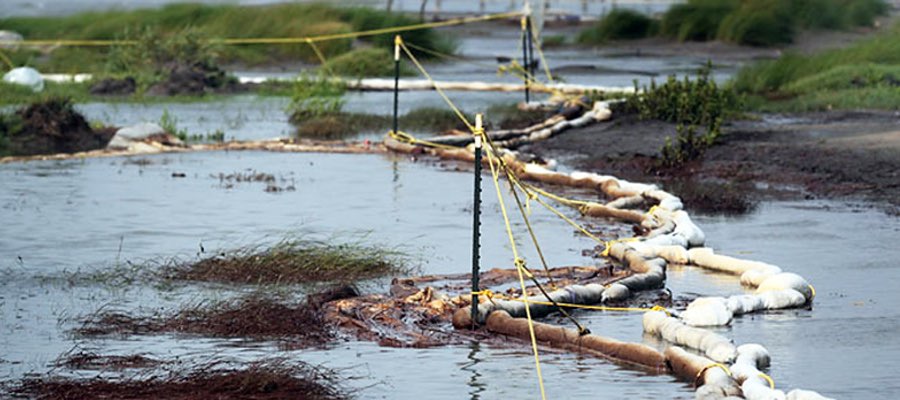
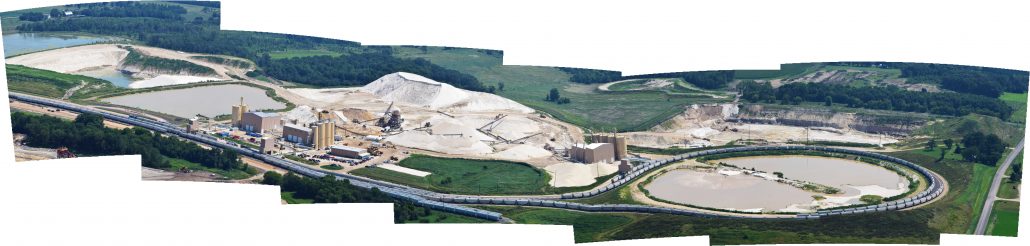
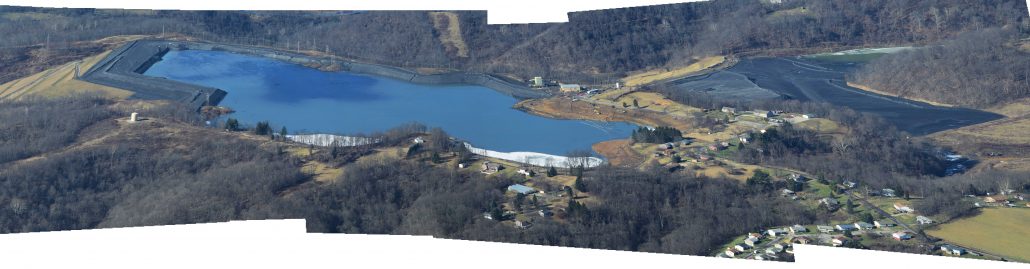
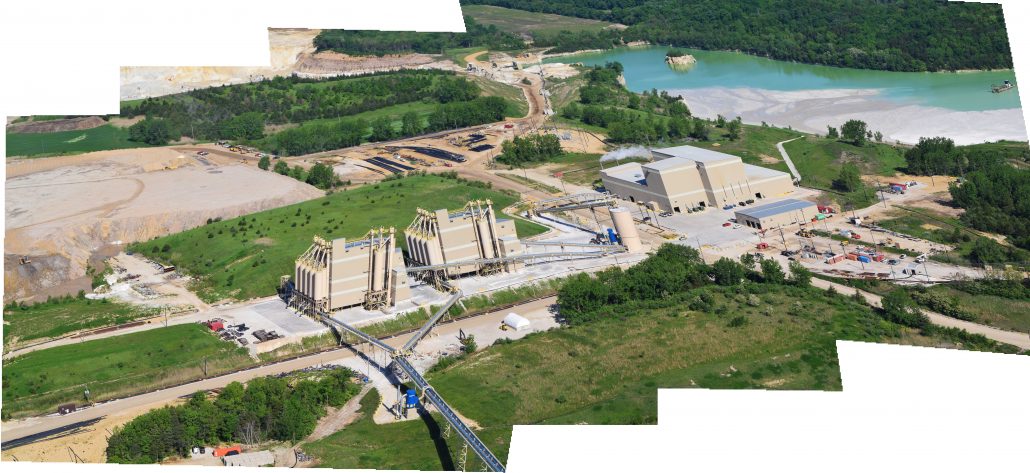
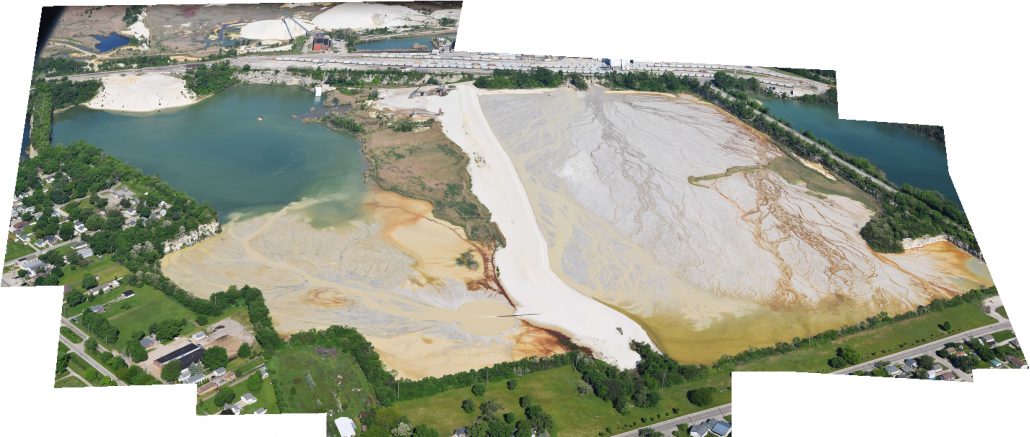
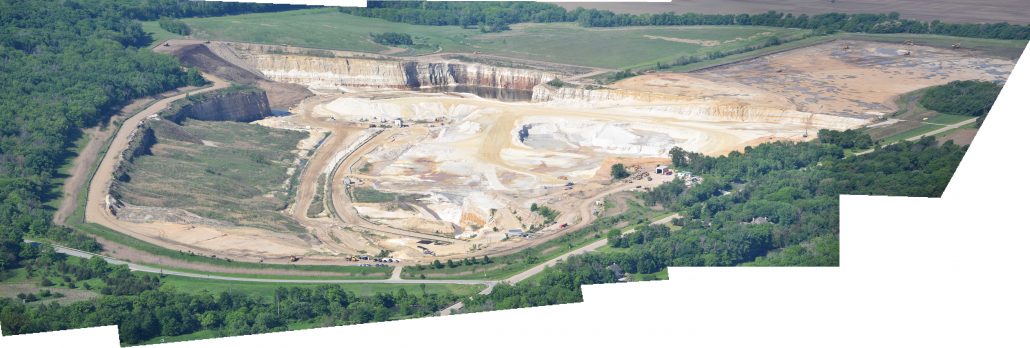
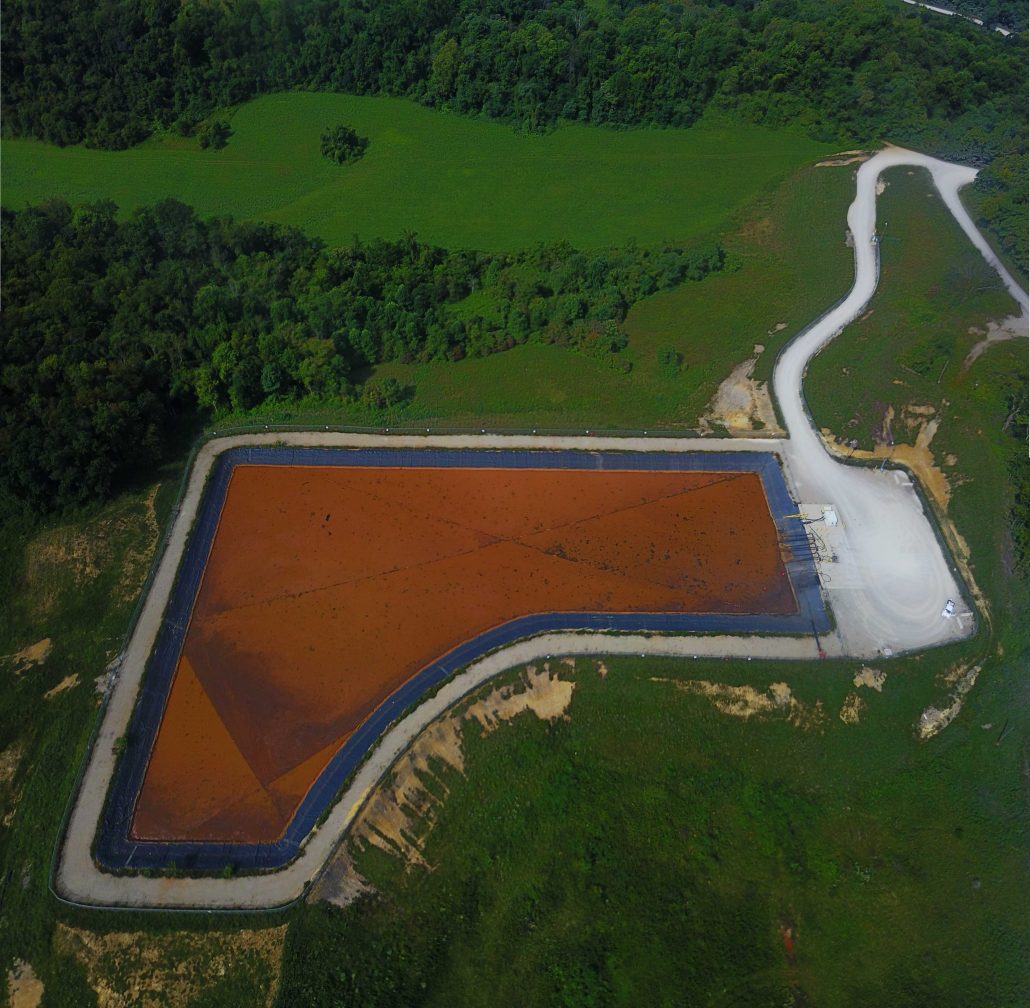
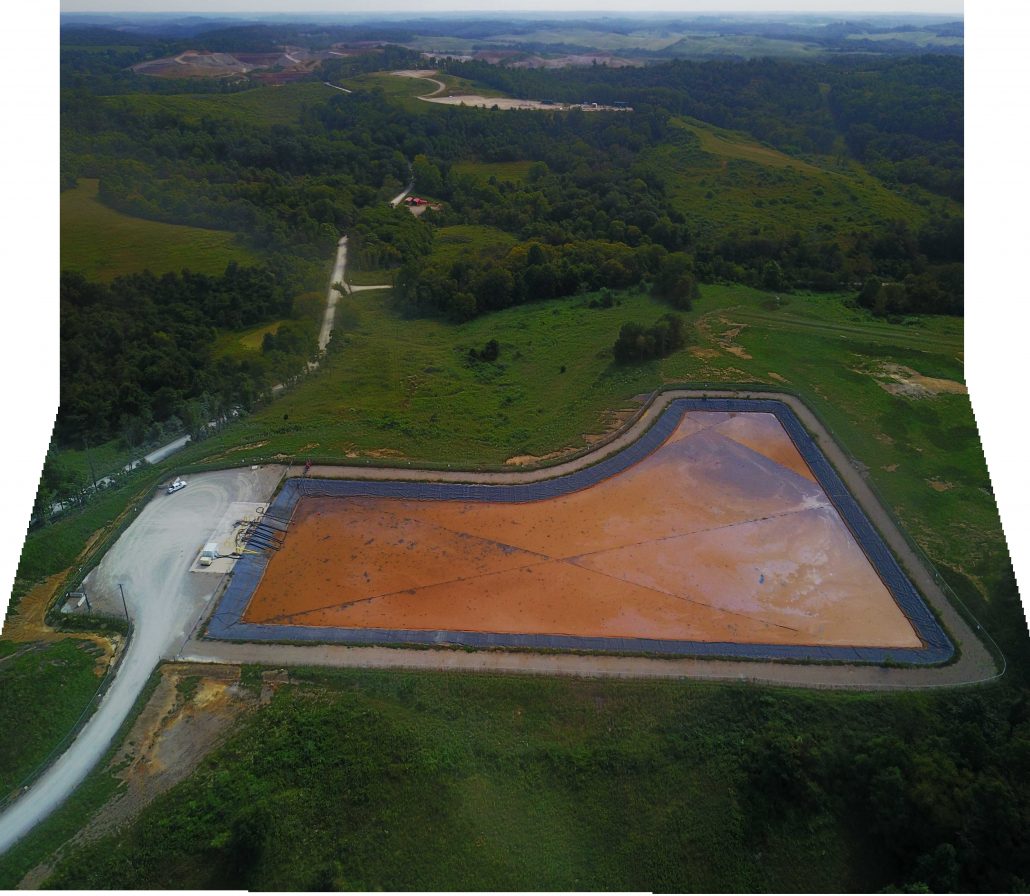
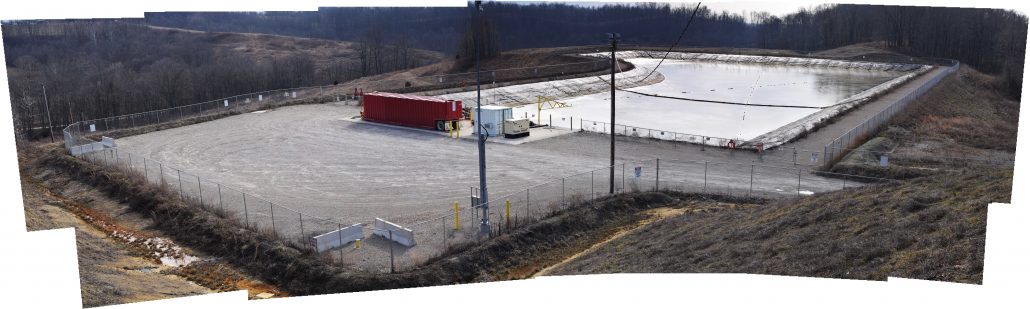
Cravat Coal Mine Slurry Pond, Marshall County, West Virginia
Americans rationalize our dependence on fossil fuels on one hand, while simultaneously hectoring those who work tirelessly to get the stuff out of the ground and invest in the companies that employ them by way of 401Ks or other investment vehicles. This hypocrisy is not lost on Appalachia nor should it be. Climate advocates should work with states like West Virginia to transition to a more just future that does not include a doubling down on fossil fuels by way of the ASTH and fracking. If not, the social and political divisions in this country will pale in comparison to what will likely result from a piecemeal and confrontational transition away from the fossil fuel industrial complex that we’ve been told we can’t live without.
Furthermore, we can’t address these issues without acknowledging the selective interventionist policy our government has deployed in the name of “nation building” in the Middle East and elsewhere. Folks like John Perkins, Naomi Klein, and Joseph Stiglitz have demonstrated that our interventionist policy is just a poor cover for the true modus operandi which would be resource control from Saudi Arabia to the most recent example being the effort by the Trump administration to foment opposition to Venezuelan leader Nicholas Maduro. If the latter example isn’t primarily about oil than why do the bi-partisan sanctions include exceptions to allow Chevron, Halliburton, and Schlumberger to continue to operate in Venezuela?
A Path Forward
The Green New Deal is a first step in establishing a path forward for the decarbonization of the US economy and it correctly includes calls for a transition that “would ensure protections for coal miners and other impacted fossil fuel workers.” While mostly nebulous and aspirational at this point, the Green New Deal offers much needed hope and guidance towards a future where economic growth is decoupled from CO2 emissions. Yet, it will have to address the underlying issues associated with economic inequality and the fact that states like West Virginia will have to be involved in the decision-making process rather than having the Green New Deal foisted on them. Otherwise, the Mountaineer State’s politicians in D.C. and Charleston will continue to get away with toying with their constituents’ hopes and dreams with proclamations that the ASTH and rumored infrastructure proposals will provide salvation. In reality, the ASTH is just another corporatist stunt to optimize shareholder return on the backs of Appalachians. This tension was summarized beautifully and succinctly by United Mine Workers of America spokesman Phil Smith who told Reuters, “We’ve heard words like ‘just transition’ before, but what does that really mean? Our members are worried about putting food on the table.”
As Joel Magnuson wrote in his revolutionary text “Mindful Economics”:
“ . . . the need to maximize profits for a relatively small section of the U.S. population has shaped the development of America’s most powerful institutions . . . the need for higher profits and endless growth has intensified environmental destruction, resource depletion, instability, social and political inequality, and even global warming. These problems have become systemic and solutions therefore require long-term systemic change . . . [and the development of] alternative institutions. As these alternatives evolve and grow, they will place the U.S. economy on a path to a new system. Systemic change will come about gradually by the will of people who purposefully steer the development of the economic institutions in their communities in a positive and healthy direction. To this end Mindful Economics lays a foundation for building new alternatives that are democratic, locally-based and ecologically sustainable. Such alternatives are not only viable, they can be found all across the United States. Through a network of alternative institutions, people can begin to build alternatives to capitalism and provide hope for future generations.”
Ecotrust’s Conservation Economy website offers a road map for how Appalachia can move towards an alternative future that “integrates Social, Natural, and Economic Capital” (see the pattern map below). Appalachia has been stripped of much of its economic capital but it still has a bountiful supply of social and natural capital!
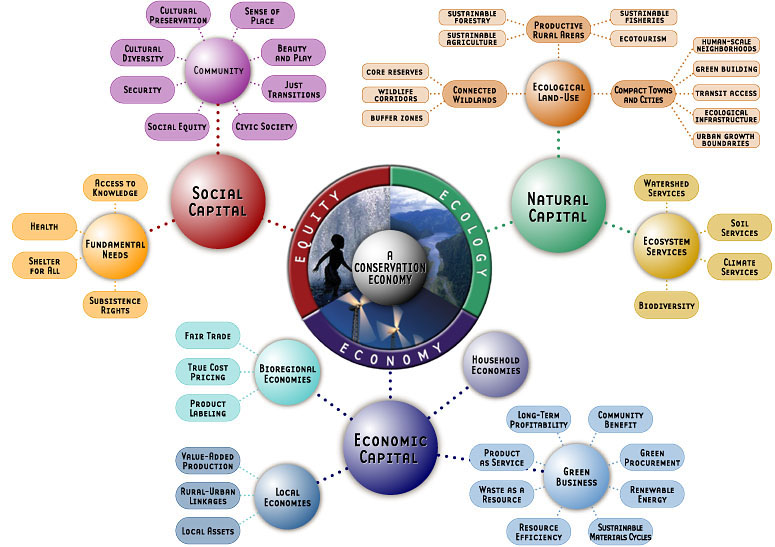
Conservation Economy’s Pattern Map
The Map
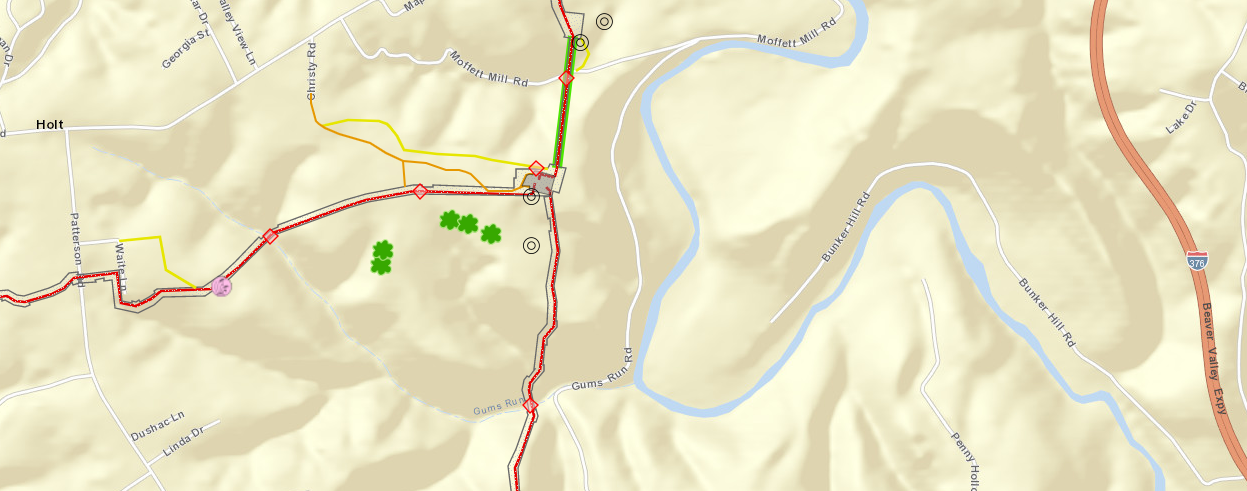
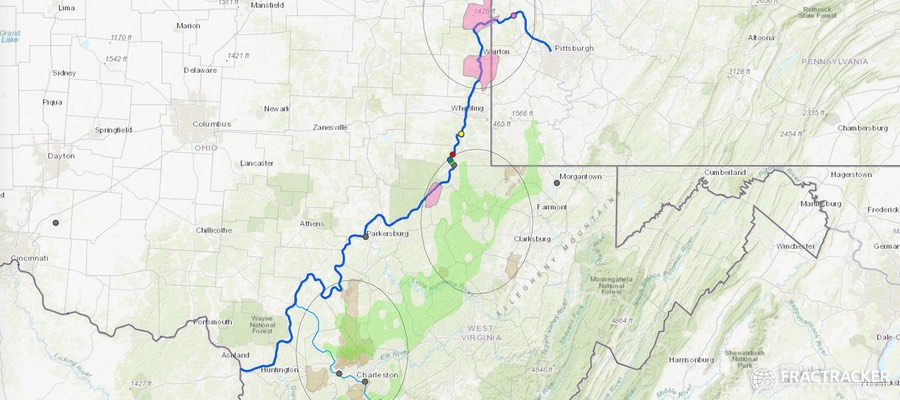
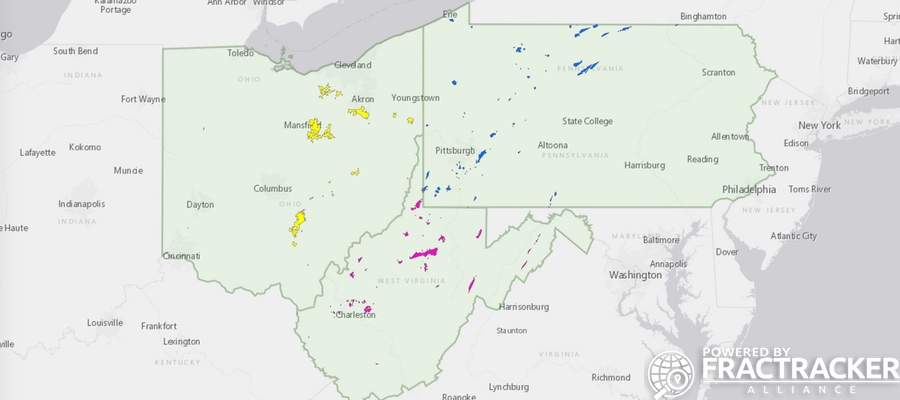
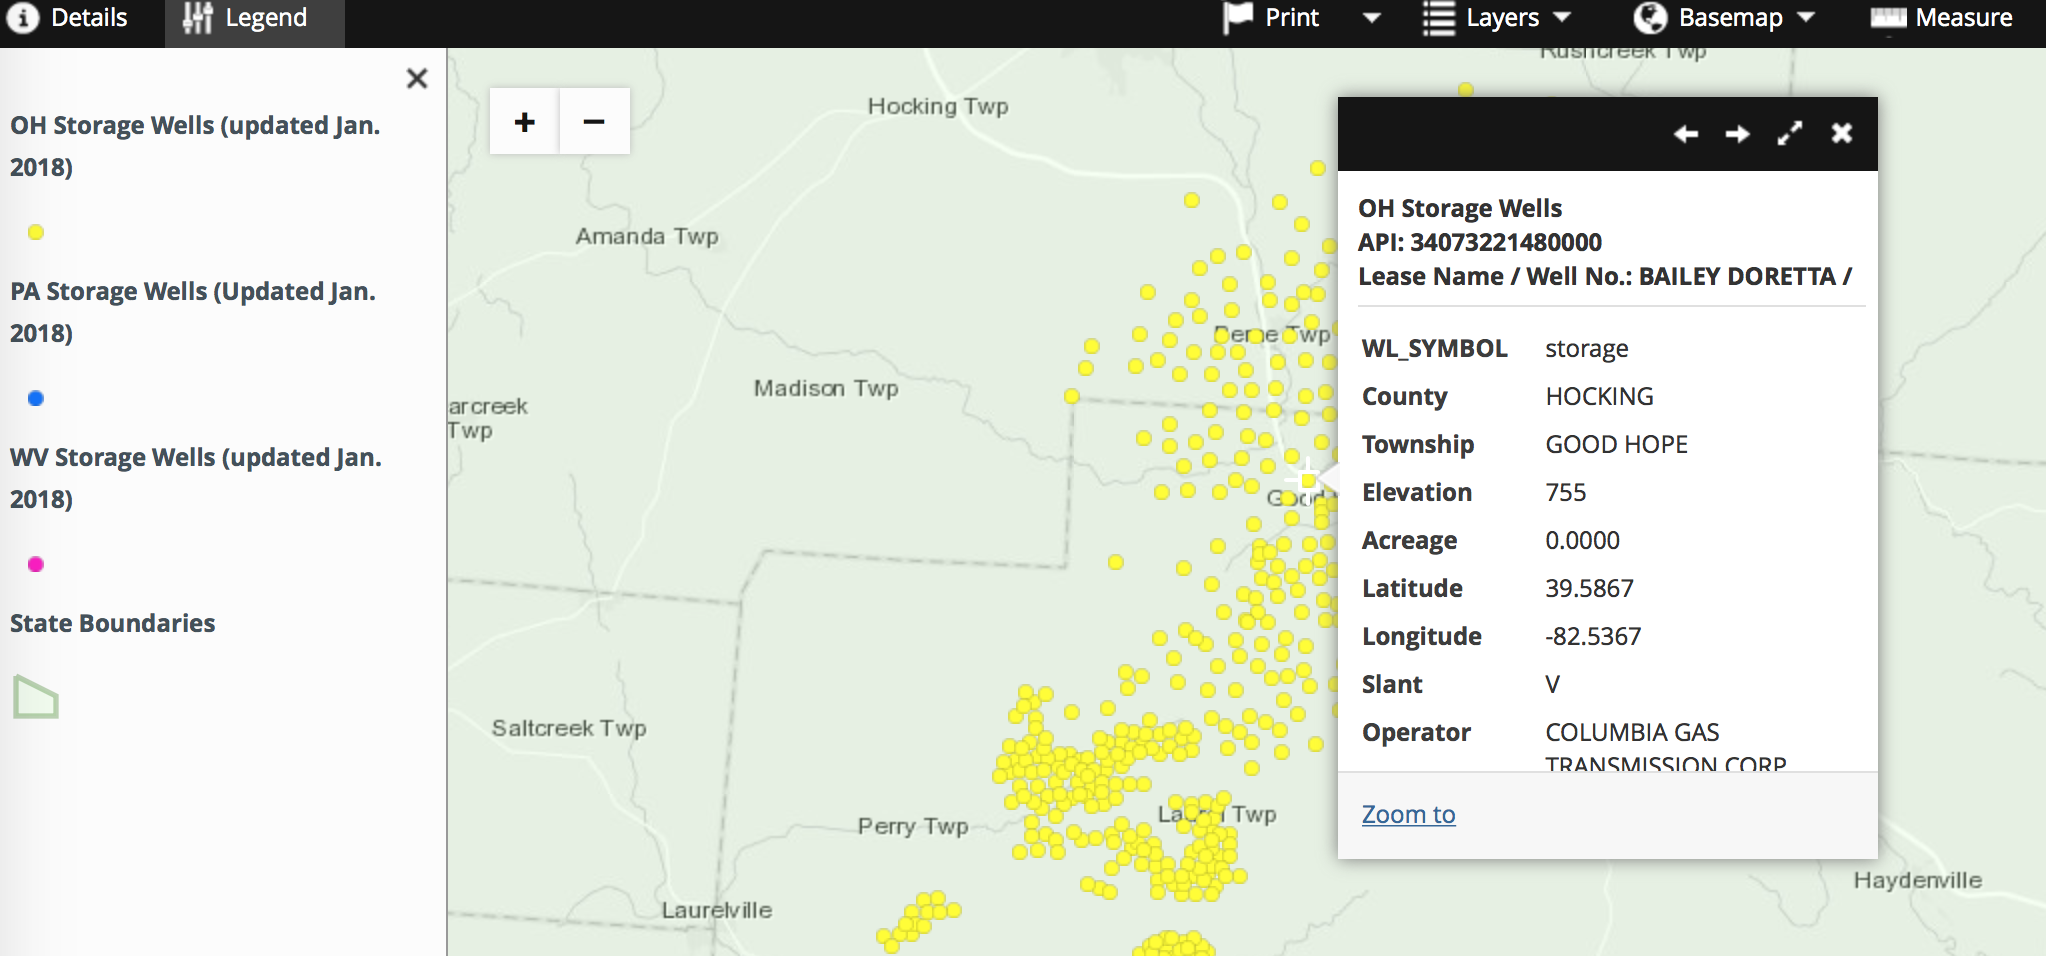
We constructed a map that illustrates West Virginia’s past, present, and future dependence on fossil fuels. The map shows 16,864 oil, gas, and coal parcels as well as those that are rumored to be of interest to the fossil fuel industrial complex in the near future. The parcels average 164 acres in size and amount to 2,770,310 acres or 4,329 square miles. These parcels amount to 17.9% of West Virginia but are largely concentrated in the counties of Boone, Kanawha, Logan, Wyoming, McDowell, Mingo, and Fayette.
Also included in this map are:
- annual production data for 880 mines between 2001 and 2017 and
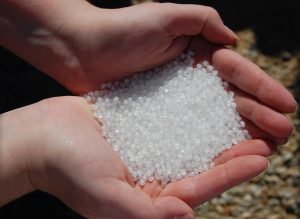
- annual oil, natural gas, and natural gas liquid (NGL) production for 3,689 unconventional wells between 2002 and 2018.
A sizeable portion of the parcel query we conducted, especially the rumored ones, occurred as a result of insight from Ohio Valley Environmental Coalition (OVEC) community organizer Alex Cole and his extensive network of contacts along the Ohio River Valley.
View map fullscreen | How FracTracker maps work
By Ted Auch, Great Lakes Program Coordinator, FracTracker Alliance with invaluable data compilation assistance from Gary Allison
[1] If you aren’t familiar with this term I would refer you to Columbia University’s data for Boone County, West Virginia: “The numbers suggest that about a third of Boone County’s revenues directly depended on coal in the form of property taxes on coal mines and severance taxes. In 2015, 21 percent of Boone County’s labor force and 17 percent of its total personal income were tied to coal. Coal property (including both the mineral deposit and industrial equipment) amounted to 57 percent of Boone County’s total property valuation. Property taxes on all property generated about half of Boone County’s general fund budget, which means that property taxes just on coal brought in around 30 percent of the county’s general fund. Property taxes on coal also funded about $14.2 million of the $60.3 million school budget (24 percent). In total, coal-related property taxes generated approximately $21 million for Boone County’s schools, the county government, and specific services.”
[2] ALEC finalized their “Model Policy” in December, 2017, and gave it the ultimate Orwellian title of “Critical Infrastructure Protection Act.” Many elected officials throughout the fossil fuel network’s Heartland have introduced this legislation nearly verbatim, including Ohio State Senator Frank Hoagland’s S.B. 33, which represents much of Ohio’s Ohio River Valley, where the ASTH would have its most pronounced impacts.


