One of the many services that FracTracker offers is access to oil and gas photos. These have been contributed to our website by partners & FracTracker staff and can be used free of charge for non-commercial purposes. Please site the photographer if one is listed, however.
Over the last few months we have added additional oil and gas photos to the following location-based albums – and more photos and videos are coming soon! Click on the links below to explore:
If you would like to contribute photos or videos to this collection, please email us the files along with information on how to credit the photographer to: info@fractracker.org.
While I must commend the State for looking into this important issue, much more needs to be done, and I have serious concerns about the validity of several aspects of this study. Since the report is almost 200 pages long, I will summarize its findings and my critiques below.
Marcellus shale cuttings are radioactive: pgs. 17, 139, 142, 154
We do not know if there is a long term problem: pg. 19
About 30 million tons of waste in next few decades: pg. 176
Landfill liners leak: pg. 20
Owning & operating their own landfill would be expensive & risky for gas companies: pgs. 186-7
Toxicity and biotic risk from drill cuttings is uncharted territory: pg. 78
Landfill leachate is toxic to plants & invertebrates: pgs. 16, 95, 97
Other landfills also have radioactive waste: pgs. 14-15
We have no idea if this will get worse: pgs. 96, 154
If all systems at landfills work as designed, leachate might not affect ground water: pg. 41
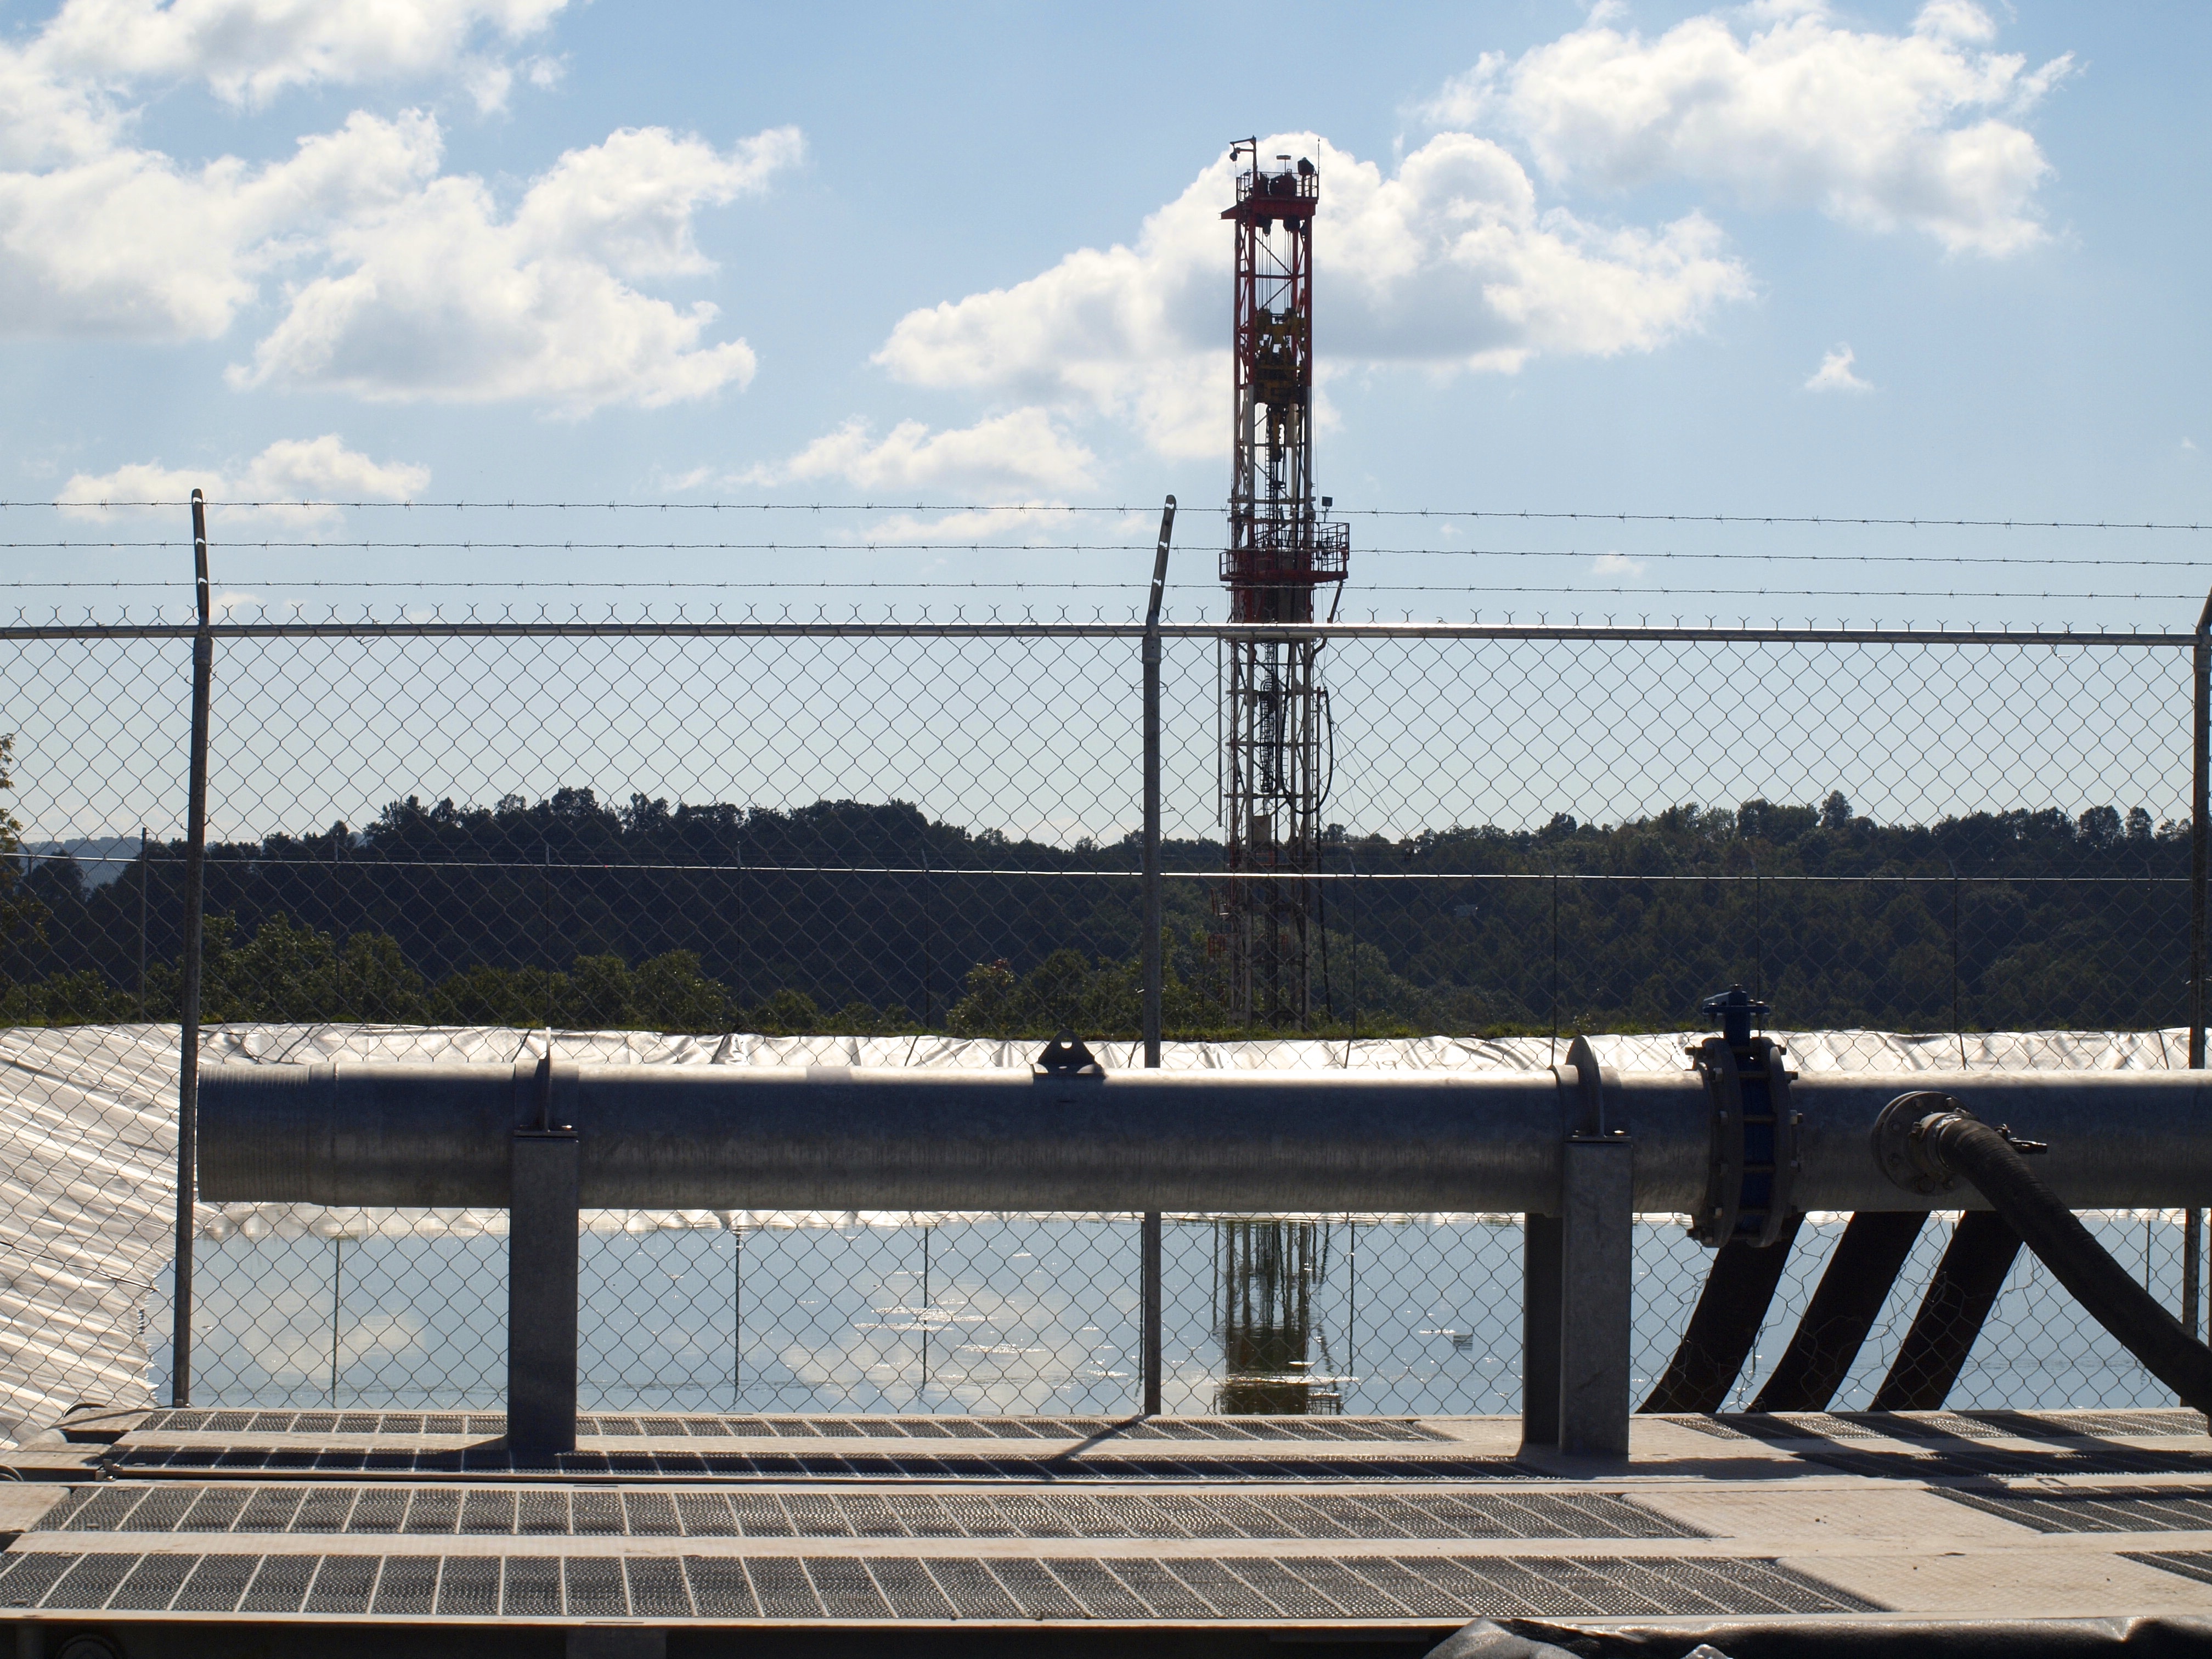
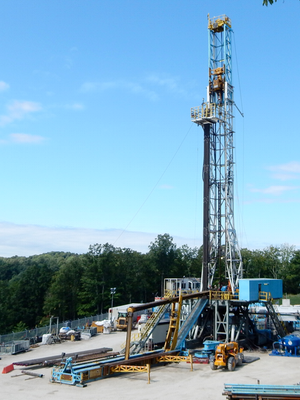
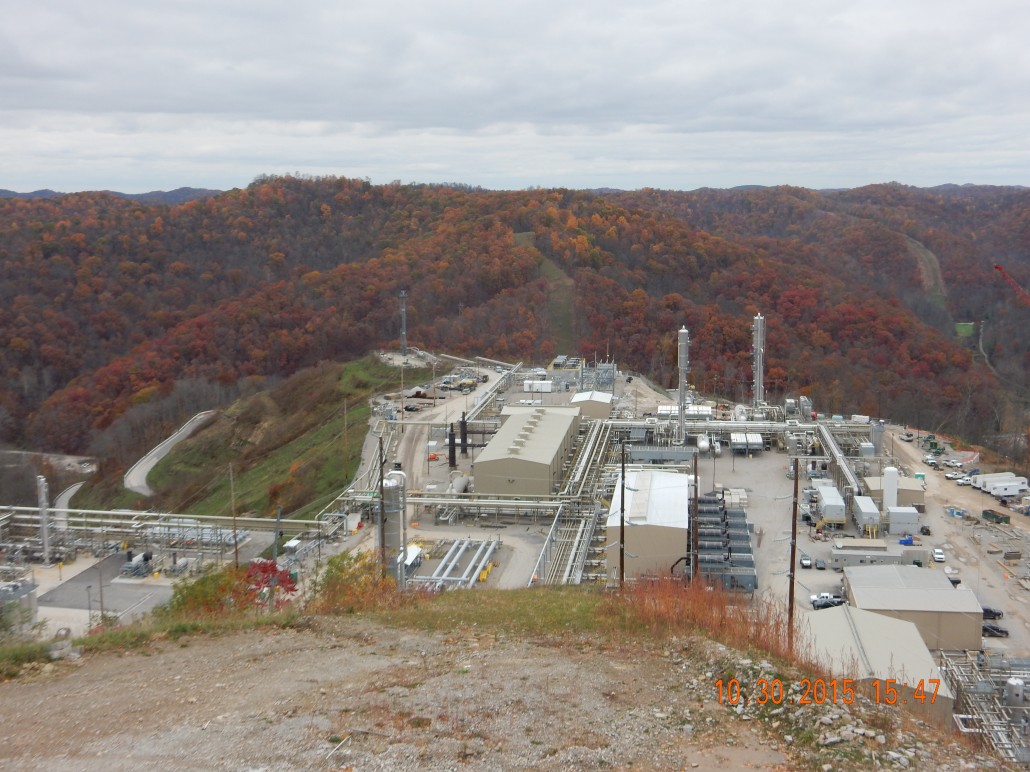
Introduction
Drilling rig behind a wastewater pond in West Virginia
Any formal report comprised of 195 pages generated by a reputable school like Marshall University with additional input from Glenville State College – supported by over 2,300 pages of semi-raw data and graphs and charts and tables – requires some serious investigation prior to making comprehensive and final conclusions. However, some initial observations are needed to provide independent perspective and to help reflect on how sections of this report might be interpreted.
The overarching perspective that must be kept in mind is that the complete study was first limited by exactly what the legislature told the WV Department of Environmental Protection DEP to do. Secondly, the DEP then added other research guidelines and determined exactly what needed to be in the study and what did not belong. There were also budget and time constraints. The most constricting factor was the large body of existing data possessed by the DEP that was provided to the researchers and report writers. Because of the time restrictions, only a small amount of additional raw data could be added.
And most importantly, similar to the WVU Water Research Institute (WVU WRI) report from two years ago, it must be kept in mind that these types of studies, initiated by those elected to our well-lobbied legislature and funded and overseen by a state agency, do not occur in a political power vacuum. It was surely anticipated that the completed report might have the ability to affect the growing natural gas industry – which is supported by most in the political administration. Therefore, we must be cautious here. The presence and influence of political and economic factors need to be considered. Also, for universities to receive research contracts and government paid study requests, the focus must include keeping the customer satisfied.
My comments below on the report’s methods and findings are organized into three broad and overlapping categories:
GOOD – positive aspects, good suggestions, important observations
GENERAL – general comments
FLAW – problems, flaws, limitations
MOVING FORWARD – my suggestions & recommendations
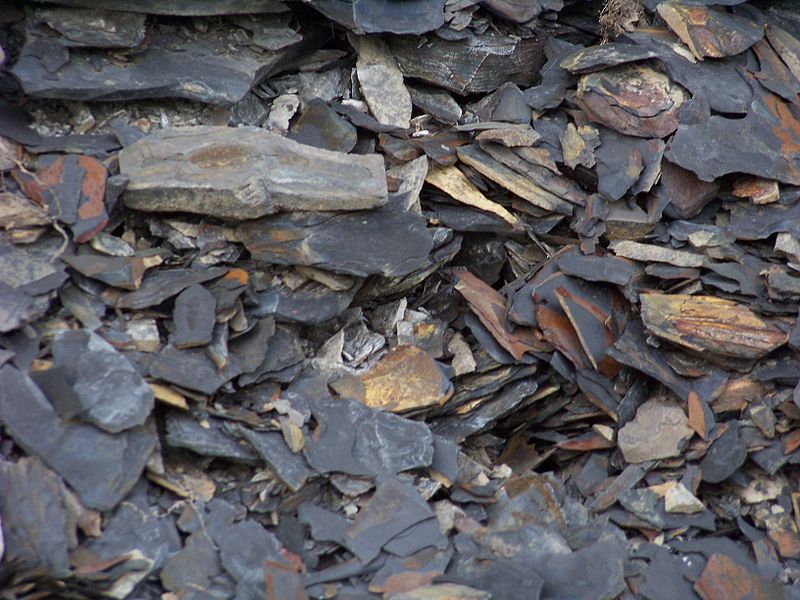
I. Water Quality: EPA Test Protocols & Datasets
Marcellus Shale (at the surface)
GENERAL It is obvious that a very smart and well-trained set of researchers put a lot of long, detailed thought into analyzing all of the available data. There must be tens of thousands of data points. Meticulous attention was put into how to assemble all of the existing years’ worth of leachate chemical and radiological information.
GOOD There is an elaborate and detailed discussion of how to best analyze everything and how to utilize the best statistical methods and generate a uniform and integrated report. This was made difficult with non-uniform time intervals, some non-detect values, and some missing items. The researchers used a credible process, explaining how they applied the various appropriate statistical analysis methods to all the data. They provided some trends and observations and draw some conclusions.
FLAW 1 The most glaring flaw and the greatest limitation pertaining to the data sets is the nature of the very data set, which was provided to the researchers from the DEP. It is to the commendable credit of the DEP that the leachate at landfills receiving black shale drill cuttings from the Marcellus and other shale formations were, from the beginning, required to start bi-monthly testing of leachate samples at landfills that were burying drill waste products. And in general, when compared to on-site disposal as done for conventional wells, it was initially a good requirement to have the drill cuttings put into some type of landfill; that way we could keep track of where the drill cuttings are located when there are future problems.
To the best of my knowledge, until the states in the Marcellus region started allowing massive quantities of black shale waste material to be put into local landfills, we have never knowingly deposited large quantities of known radioactive industrial waste products into generic municipal waste landfills. The various waste products and drill cuttings of Marcellus black shales have been known for decades by geologists and radiochemists to be radioactive. We know better than to depose of hazardous radioactive waste in an improper way. Therefore, it is very understandable that we might not know how to best solve the problems of this particular waste product. This was and still is new territory.
FLAW 2 All of the years of leachate test samples were processed for radioactivity using what is called the clean drinking water test protocols, also referred to as the EPA 900 series. Three years ago, given the unfamiliarity of regulatory agencies with the uniqueness of this waste problem, we chose the wrong test protocol for assessing leachate samples. We speculated that the commonly used and familiar clean drinking water test procedure would work. So now we have a massive set of test results all derived from using the wrong test protocol for the radiologicals. Fortunately, all of the chemistry test results should still be reasonably useful and accurate.
At first, three years ago, this was understandable and possibly not an intentional error. Now it is widely known by hydrogeologists and radiochemists, however, that the plain EPA 900 series of test methods for determining the radioactivity of contaminated liquids do not work on liquids with high TDS — Total Dissolved Solids. Method 900.0 is designed for samples with low dissolved solid like finished drinking water supplies.
Despite this major and significant limitation, the effort by Marshall University still has some utility. For example, doing comparisons between and among the various landfills accepting drill waste might provide some interesting observations and correlations. It is clearly known now, however, that the protocols that were used for all samples from the start when testing for gross alpha, gross beta and radium-226 and radium-228 in leachate, can only result in very inaccurate, under-reported data. Therefore, it is not possible to draw any valid conclusions on several very important topics, including:
surface water quality,
potential ground water contamination,
exposure levels at landfills and public health implications,
and policy and regulations considerations.
Labs certified to test for radiological compounds and elements are very familiar with the 900 series of EPA test procedures. These protocols are intended to be used on clean drinking water. They are not intended to be used on “sludgy” waters or liquids contaminated with high dissolved solids like all the many liquid wastes from black shale operations like flowback and produced water and brines and leachate. The required lab process for sample size, preparation, and testing will guarantee that the results will be incorrect.
In no place in the final 195 page report have I seen any discussion of which EPA test protocol was used for the newer samples and why was it used. It has also not yet been seen in the 2,300+ pages of supportive statistical and analytical results, either. The fact that the wrong protocol was used three years ago is very understandable. However, this conventional EPA 900 series was still being used on the additional very recent (done in fall of 2014 and spring of 2015) samples that were included in the final report. The researchers, without any justification or discussion or explanations continued to use the wrong test protocol.
The clean drinking water procedures should have been used along with the 901.1M (gamma spec) process, for comparison. It is understandable for the new data to be consistent and comparable with the very large existing dataset that a case could be made for using the incorrect protocol and the proper one also. There should have been a detailed discussion of what and why any test method was being used, however. That discussion is usually one of the first topics investigated and explained in the Methods section. Having that type of discussion and justification seems to represent a basic science method and accepted research process – and that omission is a serious flaw.
MOVING FORWARD We all know that if we want to bake an appetizing and attractive cake we must use the correct measuring cups for the ingredients. If we want to take our child’s temperature we need an accurate thermometer. When our doctor helps us understand our blood test results, we all want to be confident the right test was used at the lab. The proper test instrument, recently calibrated and designed for the specific sample, is crucial to get useable test results from which conclusions can be drawn and policy enacted.
It seems that the best suggestion so far to test high TDS liquids similar to leachate would be to use what is referred to as Gamma-ray Spectrometry with a high purity germanium instrument with at least a 21-day hold period (30 days are better), while the sample is sealed then counted for at least 16 hours. Many of the old leachate test results indicate high uncertainties that might be attributed to short hold times and short counting times. This procedure is referred to as the 901.1 M (modified). If the sample is sealed, the sample will reach about 99% equilibrium after 30 days. Radon 222 (a gas) must not be allowed to escape.
The potential environmental impacts to water quality section of this report seems to demonstrate that if you do not want to find out something, there are always justifiable options to avoid some inconvenient facts. Given the very narrow scope as defined, some the Marshall University folks did not seem to have the option to stray into important scientific foundational assumptions and, for the most part, just had to work with the stale data sets given to them. All of which, as we have known for close to a year now, have used the wrong test protocol. Therefore we have incorrect results of limited value.
II. Marcellus is Radioactive
GOOD 1 Of course, geologists have known that the Marcellus Shale is radioactive for many decades, but also for decades there has been great reluctance by the natural gas exploration and production companies to acknowledge this fact to the public. And finally we now have a public report that clearly and unambiguously states that Marcellus shale is radioactive. Interestingly enough, it was not much more than a year ago that some on the WV House of Delegates Judiciary Committee, seemed to be echoing the industry’s intentional deception by declaring that:
…it was only dirt and rock…
So this report represents progress and provides a very valuable contribution to beginning to recognize some of the potential problems with shale wastes and their disposal challenges.
GOOD 2 Another very important advance is that finally after eight years of drilling here in Wetzel County, we now have a test sample from near the horizontal bore. The WVU WRI study researchers were never given access to any samples taken from the horizontal bore material itself, however. That was, of course, what they were supposed to have been allowed to do, but they were only given access to study material from the vertical section of the well bore. This report describes how we are getting closer to actually testing good samples of the black shale. It seems that we have gotten closer – but let’s see how close.
Page 11 describes that only three Antero wells in Doddridge County were chosen as the place to try to obtain samples from the horizontal bore. Considering that over 1,000 deviated/horizontal wells or wells with laterals have been drilled in the past few years, that number represents a very small fraction of wells drilled: less than .3%. Even if a high quality sample could have been obtained it might be a challenge to extrapolate test results to the waste being produced from the other wells in WV. These limitations are completely ignored in the report, however. Given the available documentation from the DEP, this seems to be a serious flaw that compromises the reliability of the entire report.
III. Samples From Vertical vs. Horizontal Well Bores
FLAW The actual samples tested from at least two of the three wells used in the study do not seem to be from the horizontal bore material. The sample from the third well might have come from the horizontal bore, but just barely. There is no way to know for sure. I will try to show this within the below chart using information provided by Antero to DEP Office of Oil & Gas. This information is in state records on Antero’s well plats, which become part of the well work application and also part of the final permit.
Table 1. Details about the samples taken from three Antero wells in Doddridge County, WV – and my concerns about the sampling process*
Antero well ID
API #
Sample’s drilling depth
Marcellus depth**
Horizontal bore length**
Comments / Issues
Morton 1H
47-017-06559
6,856 ft.
7,900 TVD***
10,600 ft.
~1,044 ft. short of reaching Marcellus formation
McGee 2H
47-017-06622
6,506 ft.
6,900 TVD
8,652 ft.
~394 ft. short of reaching Marcellus
Wentz1 H
47-017-06476
8,119 ft.
7,900 TVD
8,300 ft.
Just drilled into Marcellus by 219 ft.
* Original chart found on page 11 of report
** Based on information from Antero’s well plat
*** TVD = Total Vertical Depth
Antero is an active driller in Doddridge County. If any company knows where to find the Marcellus formation it is that company. Well plats are very detailed, technical documents provided to the DEP by the operator regarding the well location, watershed, and leased acres and property boundaries. We need to trust that the information on those plats is accurate and has been reviewed and approved by the permitting agency. Those plats also give the depth of the Marcellus and the length and heading of the lateral or horizontal bore. The Marshall University report gives the drilling depth when the sample was taken on the surface. Using these available well plat records from the DEP it appears that at two of the wells the sample (and its test results included in the report) came from material produced when the experienced drilling operator was not yet into the shale formation.
On the third well, Wentz 1H, the numbers seem to indicate that the sample was taken when the driller said that they were just barely within the shale layer – by 219 feet. Since the drill cuttings take some time to return to the surface from over 7,000 feet down, drilling just a few hundred feet would not at all guarantee that the returned cuttings were totally from the black shale. The processing of the drill cuttings at the shaker table and separator and centrifuge and the mixing in the tubs all cast some doubt on whether the sample, wherever it was taken from, was truly from the horizontal bore material.
On page 11 there is a clear and unambiguous statement:
Three representative sets of drill cuttings from the horizontal drilling activities within the Marcellus Shale formation were collected.
A successful attempt to get three such samples might have then allowed an appropriate waste characterization to be done as needed to accomplish the five required research topics listed in the report’s cover letter. Only an accurate chemical and radiological waste characterization would have allowed scientifically justifiable conclusions to be formulated and then allow for accurate legislation and regulations. It does not seem that West Virginia yet has the required scientific data upon which to confidently formulate laws and regulations to protect public health with regard to shale waste disposal.
Would it not seem prudent – if one wanted a good, representative sample – to make absolutely sure that the operator was, in fact, drilling in the black shale and that the cuttings returning to the surface were, in fact, from the Marcellus bore? That approach would have been eminently defensible and easily accomplished by just waiting for drilling to progress into the lateral bore far enough that the drill cuttings returning to the surface were in fact from the black shale. There might be plausible explanations for this apparent inconsistency or error. Of course, it might be speculated that the Antero-provided information on the well plats is incorrect and not intended to be accurate, or perhaps the driller is not really sure yet where the Marcellus layer starts. There may be many other possible scenarios of explanations. Time will tell.
IV. Research Observations Review
Landfill disposal of drill cuttings
GOOD There are a number of recommendations and suggestions in the study on landfills and leachate related conditions. It seems that a number of these proposals are very accurate and should be implemented. For example:
The report clearly restates that drill cuttings are known to contain radioactive compounds. Since all landfill liners will eventually leak, and since landfills already have ground water test wells for monitoring for potential ground water contamination due to leaking liners, then the well samples should be tested for radiological isotopes. Good idea. They are not required to do that now, but this recommendation should be implemented immediately (pgs. 17 and 21).
GOOD The report recommends that the Publicly Owned Treatment Works (POTW) or in the case of Wetzel County, the on-site wastewater treatment plants, should also test their effluent for radioactive isotopes. This is very important since there is no way to efficiently filter out many of the radioactive isotopes. Such contaminants will pass through traditional wastewater treatment plants.
It is also very useful that the report recommends that all the National Pollution Discharge Elimination System (NPDES) limits at the POTWs be reviewed and required to take into consideration the significantly more challenging chemical and radiological makeup of the shale waste products.
V. Economic Considerations on an Industry Supported Mono-Fill
The legislature asked that the DEP evaluate the feasibility of the natural gas industry to build, own, or operate its own landfill solely for the disposal of the known radioactive waste. This request seems to be a very reasonable approach, since for decades we have only put known radioactive waste products into dedicated landfills that are exclusively and specifically designed for the long term storage of the special waste material.
The discussion of the economic considerations is extremely complete and detailed. They are given in Appendix I and take into consideration a very thorough economic feasibility study of such a proposed endeavor. This section seems to have been compiled by a very talented professional team.
FLAW However, some of the basic assumptions are a bit askew. For example:
The initial Abstract of the financial analysis states that two new landfills would be needed because we do not want to have the well operators to drive any further than they do now. Interesting. This seems to be not too different than a homeowner while in search for privacy and quiet, builds a home far out into the country and then expects the public sewage lines to be extended miles to his new home so he would not have to incur the cost of a septic system. Homebuilders in rural settings should know they will have to incur expenses for their waste disposal needs. Should gas companies expect that communities to provide cheap waste disposal for them?
More than 15 pages later, the most important aspect is clearly stated that, “…the most salient benefit of establishing a separate landfill sited specifically to receive (radioactive) drill cuttings would be the preservation of existing disposal capacity of existing fills for future waste disposal”. Meaning for my (our) grandchildren. See page 175.
Comprehensive and sound financial details later explain that having the natural gas operators build, operate, and eventually close their own radioactive waste depository landfill would involve a lot of their capital and involve some risk to them. It is stated that their money would be better used drilling more wells. The conclusion then seems to be that, all around, it is simply cheaper and less risky for the gas industry to put all their waste products into our Municipal Waste Landfills, and later residents should incur the costs and risk to build another land fill for their household garbage when needed.
VI. Report Omissions
Within the report section dealing with the leachate test results, it is casually mentioned that not only do the landfills receiving shale waste materials have radioactive contaminated leachate, but the other tested landfills do, as well. However, rather than raising a very red flag and expressing concern over a problem that no one has looked into, the report implies we should not worry about any radioactive waste because it might be in all landfills (pg. 139).
Nowhere within the radiological discussion is there any mention of what might be called speciation of radioactive isotopes. The report does state that the test for both gross alpha and gross beta, are considered a “scanning procedure.” The speciation process is sort of a slice and dice procedure, showing exactly what isotopes are responsible for the activity that is being indicated. This process, however, does not seem to have been done on the landfill leachate test samples. The general scanning process cannot do that. Appendix H, pages 141-142, contains detailed facts on radiation dose, risk, and exposure. This might have been a good place to also discuss the proper EPA testing protocols, used or not used, and why.
A short discussion of the DEP-required landfill entrance radiation monitors is included on page 146. The installed monitors are the goalpost type. Trucks drive between them at the entrance and when they cross the scales. It seems that the report should have emphasized that that type of monitor will primarily only detect high-energy gamma radiation. However what is omitted on page 144 is that the primary form of decay for radium-226 is releasing alpha particles. The report is ambiguous in saying the decay products of radium-226 include both alpha particles and some gamma radiation, but radium-266 is not a strong gamma emitter. It is very unlikely that a normal steel enclosed roll-off box would ever trip the alarm setting with a load of drill cuttings. However those monitors are still useful since they will detect the high-energy gamma radiation from a truck carrying a lot of medical waste (pg. 17).
It is stated on page 144 that the greatest health risk due to the presence of radium-226 is the fact that its daughter product is radon-222. Radium-226 has a half-life of 1,600 years, compared to radon’s 3.8 days. This difference might seem to imply that radon is less of a concern. Given the multitude of radium-226 going into our landfills means that we will be producing radon for a very long time.
https://www.fractracker.org/a5ej20sjfwe/wp-content/uploads/2015/05/Drill-cuttings-at-landfill-3894-crop-e1432757459333.jpg400899FracTracker Alliancehttps://www.fractracker.org/a5ej20sjfwe/wp-content/uploads/2025/09/2025-Wordmark-Logo.pngFracTracker Alliance2015-08-18 09:06:432020-03-12 14:04:17Landfill Disposal of WV Oil and Gas Waste – A Report Review
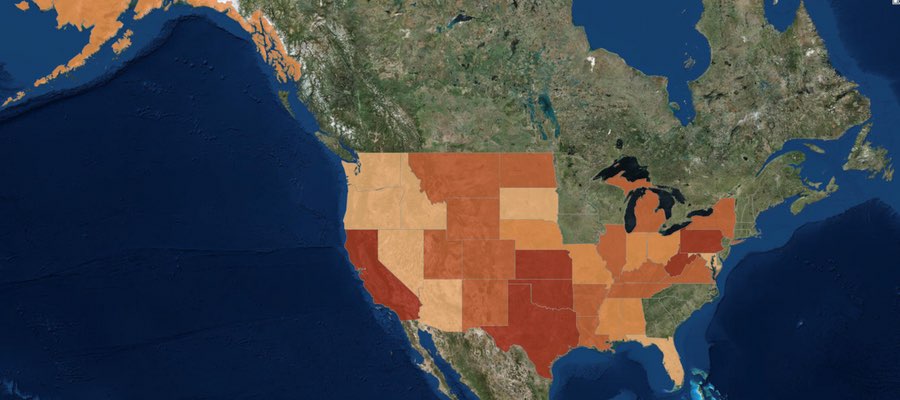
In February 2014, the FracTracker Alliance produced our first version of a national well data file and map, showing over 1.1 million active oil and gas wells in the United States. We have now updated that data, with the total of wells up to 1,666,715 active wells accounted for.
Density by state of active oil and gas wells in the United States. Click here to access the legend, details, and full map controls. Zoom in to see summaries by county, and zoom in further to see individual well data. Texas contains state and county totals only, and North Carolina is not included in this map.
While 1.7 million wells is a substantial increase over last year’s total of 1.1 million, it is mostly attributable to differences in how we counted wells this time around, and should not be interpreted as a huge increase in activity over the past 15 months or so. Last year, we attempted to capture those wells that seemed to be producing oil and gas, or about ready to produce. This year, we took a more inclusive definition. Primarily, the additional half-million wells can be accounted for by including wells listed as dry holes, and the inclusion of more types of injection wells. Basically anything with an API number that was not described as permanently plugged was included this time around.
Data for North Carolina are not included, because they did not respond to three email inquiries about their oil and gas data. However, in last year’s national map aggregation, we were told that there were only two active wells in the state. Similarly, we do not have individual well data for Texas, and we use a published list of well counts by county in its place. Last year, we assumed that because there was a charge for the dataset, we would be unable to republish well data. In discussions with the Railroad Commission, we have learned that the data can in fact be republished. However, technical difficulties with their datasets persist, and data that we have purchased lacked location values, despite metadata suggesting that it would be included. So in short, we still don’t have Texas well data, even though it is technically available.
Wells by Type and Status
Each state is responsible for what their oil and gas data looks like, so a simple analysis of something as ostensibly straightforward as what type of well has been drilled can be surprisingly complicated when looking across state lines. Additionally, some states combine the well type and well status into a single data field, making comparisons even more opaque.
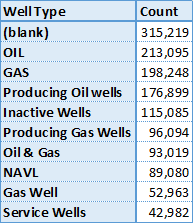
Top 10 of 371 published well types for wells in the United States.
Among all of the oil producing states, there are 371 different published well types. This data is “raw,” meaning that no effort has been made to combine similar entries, so “gas, oil” is counted separately from “GAS OIL,” and “Bad Data” has not been combined with “N/A,” either. Conforming data from different sources is an exercise that gets out of hand rather quickly, and utility over using the original published data is questionable, as well. We share this information, primarily to demonstrate the messy state of the data. Many states combine their well type and well status data into a single column, while others keep them separate. Unfortunately, the most frequent well type was blank, either because states did not publish well types, or they did not publish them for all of their wells.
There are no national standards for publishing oil and gas data – a serious barrier to data transparency and the most important takeaway from this exercise…
Wells by Location
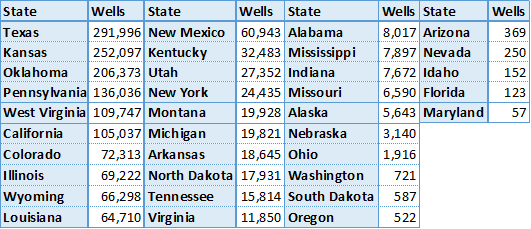
Active oil and gas wells in 2015 by state. Except for Texas, all data were aggregated published well coordinates.
There are oil and gas wells in 35 of the 50 states (70%) in the United States, and 1,673 out of 3,144 (53%) of all county and county equivalent areas. The number of wells per state ranges from 57 in Maryland to 291,996 in Texas. There are 135 counties with a single well, while the highest count is in Kern County, California, host to 77,497 active wells.
With the exception of Texas, where the data are based on published lists of well county by county, the state and county well counts were determined by the location of the well coordinates. Because of this, any errors in the original well’s location data could lead to mistakes in the state and county summary files. Any wells that are offshore are not included, either. Altogether, there are about 6,000 wells (0.4%) are missing from the state and county files.
Wells by Operator
There are a staggering number of oil and gas operators in the United States. In a recent project with the National Resources Defense Council, we looked at violations across the few states that publish such data, and only for the 68 operators that were identified previously as having the largest lease acreage nationwide. Even for this task, we had to follow a spreadsheet of which companies were subsidiaries of others, and sometimes the inclusion of an entity like “Williams” on the list came down to a judgement call as to whether we had the correct company or not.
No such effort was undertaken for this analysis. So in Pennsylvania, wells drilled by the operator Exco Resources PA, Inc. are not included with those drilled by Exco Resources PA, Llc., even though they are presumably the same entity. It just isn’t feasible to systematically go through thousands of operators to determine which operators are owned by whom, so we left the data as is. Results, therefore, should be taken with a brine truck’s worth of salt.
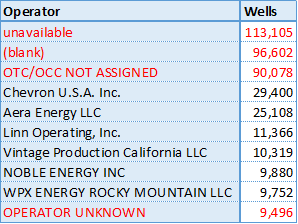
Top 10 wells by operator in the US, excluding Texas. Unknown operators are highlighted in red.
Texas does publish wells by operator, but as with so much of their data, it’s just not worth the effort that it takes to process it. First, they process it into thirteen different files, then publish it in PDF format, requiring special software to convert the data to spreadsheet format. Suffice to say, there are thousands of operators of active oil and gas wells in the Lone Star State.
Not counting Texas, there are 39,693 different operators listed in the United States. However, many of those listed are some version of “we don’t know whose well this is.” Sorting the operators by the number of wells that they are listed as having, we see four of the top ten operators are in fact unknown, including the top three positions.
Summary
The state of oil and gas data in the United States is clearly in shambles. As long as there are no national standards for data transparency, we can expect this trend to continue. The data that we looked for in this file is what we consider to be bare bones: well name, well type, well status, slant (directional, vertical, or horizontal), operator, and location. In none of these categories can we say that we have a satisfactory sense of what is going on nationally.
Click on the above button to download the three sets of data we used to make the dynamic map (once you are zoomed in to a state level). The full dataset was broken into three parts due to the large file sizes.
https://www.fractracker.org/a5ej20sjfwe/wp-content/uploads/2015/08/2015Update-Feature.jpg400900Matt Kelso, BAhttps://www.fractracker.org/a5ej20sjfwe/wp-content/uploads/2025/09/2025-Wordmark-Logo.pngMatt Kelso, BA2015-08-03 14:19:532020-07-21 10:30:051.7 Million Wells in the U.S. – A 2015 Update
This article was originally posted on 10 July 2015, and then updated on 22 January 2016 and 16 February 2016.
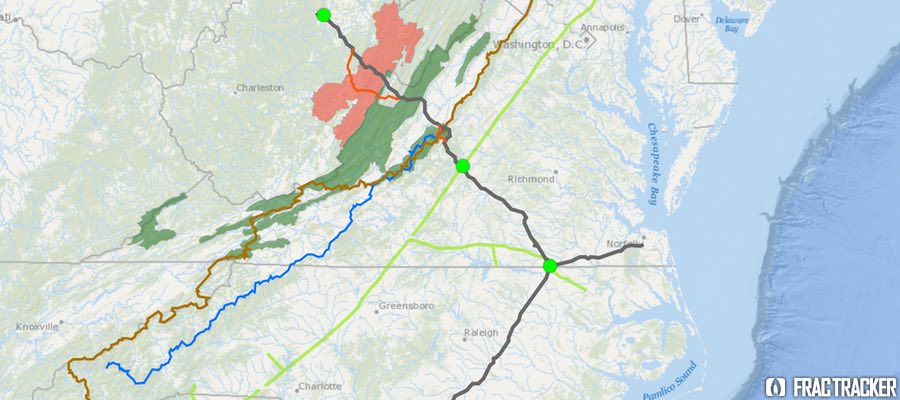
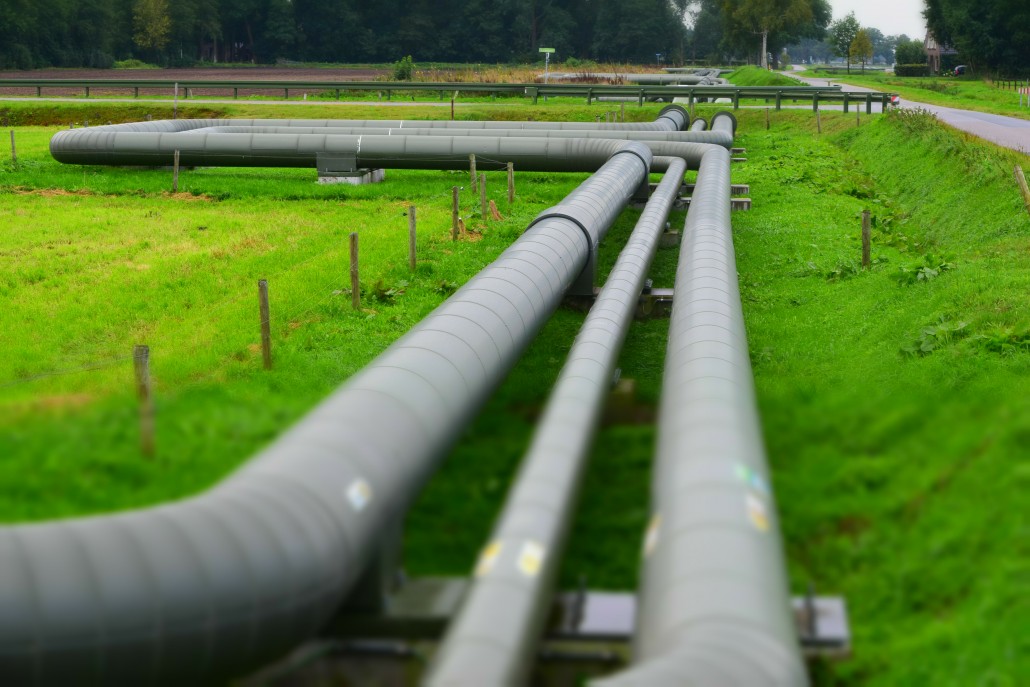
Proposed Pipeline to Funnel Marcellus Gas South
In early fall 2014, Dominion Energy proposed a $5 billion pipeline project, designed provide “clean-burning gas supplies to growing markets in Virginia and North Carolina.” Originally named the “Southeast Reliability Project,” the proposed pipeline would have a 42-inch diameter in West Virginia and Virginia. It would narrow to 36 inches in North Carolina, and narrow again to 20 inches in the portion that would extend to the coast at Hampton Roads. Moving 1.5 billion cubic feet per day of gas, with a maximum allowable operating pressure of 1440 psig (pounds per square inch gage), the pipeline would be designed for larger customers (such as manufacturers and power generators) or local gas distributors supplying homes and businesses to tap into the pipeline along the route, making the pipeline a prime mover for development along its path.
The project was renamed the Atlantic Coast Pipeline (ACP) when a coalition of four major US energy companies—Dominion (45% ownership), Duke Energy (40%), Piedmont Natural Gas (15%), and AGL Resources (5%)— proposed a joint venture in building and co-owning the pipeline. Since then, over 100 energy companies, economic developers, labor unions, manufacturers, and civic groups have joined the new Energy Sure Coalition, supporting the ACP. The coalition asserts that the pipeline is essential because the demand for fuel for power generation is predicted more than triple over the next 20 years. Their website touts the pipeline as a “Path to Cleaner Energy,” and suggests that the project will generate significant tax revenue for Virginia, North Carolina, and West Virginia.
Lew Ebert, president of the North Carolina Chamber of Commerce, optimistically commented:
Having the ability to bring low-cost, affordable, predictable energy to a part of the state that’s desperately in need of it is a big deal. The opportunity to bring a new kind of energy to a part of the state that has really struggled over decades is a real economic plus.
Unlike older pipelines, which were designed to move oil and gas from the Gulf Coast refineries northward to meet energy demands there, the Atlantic Coast Pipeline would tap the Marcellus Shale Formation in Ohio, West Virginia and Pennsylvania and send it south to fuel power generation stations and residential customers. Dominion characterizes the need for natural gas in these parts of the country as “urgent,” and that there is no better supplier than these “four homegrown companies” that have been economic forces in the state for many years.
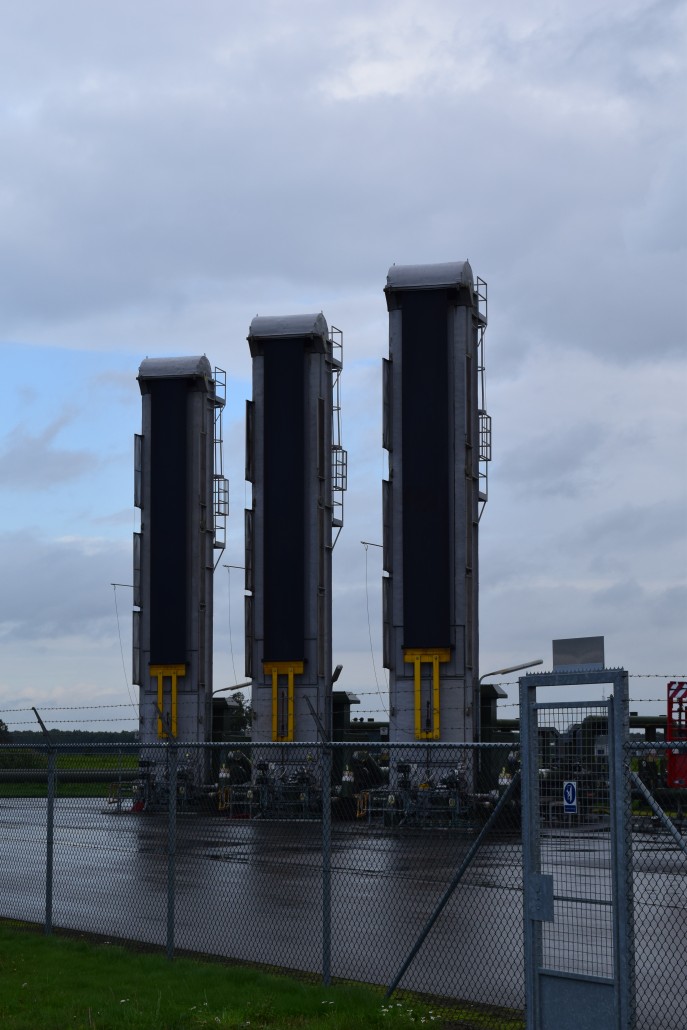
In addition to the 550 miles of proposed pipeline for this project, three compressor stations are also planned. One would be at the beginning of the pipeline in West Virginia, a second midway in County Virginia, and the third near the Virginia-North Carolina state line. The compressor stations are located along the proposed pipeline, adjacent to the Transcontinental Pipeline, which stretches more than 1,800 miles from Pennsylvania and the New York City Area to locations along the Gulf of Mexico, as far south as Brownsville, TX.
In mid-May 2015, in order to avoid requesting Congressional approval to locate the pipeline over National Park Service lands, Dominion proposed rerouting two sections of the pipeline, combining the impact zones on both the Blue Ridge Parkway and the Appalachian Trail into a single location along the border of Nelson and Augusta Counties, VA. National Forest Service land does not require as strict of approvals as would construction on National Park Service lands. Dominion noted that over 80% of the pipeline route has already been surveyed.
Opposition to the Pipeline on Many Fronts
The path of the proposed pipeline crosses topography that is well known for its karst geology feature—underground caverns that are continuous with groundwater supplies. Environmentalists have been vocal in their concern that were part of the pipeline to rupture, groundwater contamination, along with impacts to wildlife could be extensive. In Nelson County, VA, alone, 70% of the property owners in the path of the proposed pipeline have refused Dominion access for survey, asserting that Dominion has been unresponsive to their concerns about environmental and cultural impacts of the project.
On the grassroots front, 38 conservation and environmental groups in Virginia and West Virginia have combined efforts to oppose the ACP. The group, called the Allegany-Blue Ridge Alliance (ABRA), cites among its primary concerns the ecologically-sensitive habitats the proposed pipeline would cross, including over 49.5 miles of the George Washington and Monongahela State Forests in Virginia and West Virginia. The “alternative” version of the pipeline route would traverse 62.7 miles of the same State Forests. Scenic routes, including the Blue Ridge Parkway and the Appalachian Scenic Trail would also be impacted. In addition, it would pose negative impacts on many rural communities but not offset these impacts with any longer-term economic benefits. ABRA is urging for a programmatic environmental impact statement (PEIS) to assess the full impact of the pipeline, and also evaluate “all reasonable, less damaging” alternatives. Importantly, ABRA is urging for a review that explores the cumulative impacts off all pipeline infrastructure projects in the area, especially in light of the increasing availability of clean energy alternatives.
Environmental and political opposition to the pipeline has been strong, especially in western Virginia. Friends of Nelson, based in Nelson County, VA, has taken issue with the impacts posed by the 150-foot-wide easement necessary for the pipeline, as well as the shortage of Department of Environmental Quality staff that would be necessary to oversee a project of this magnitude.
Do gas reserves justify this project?
Dominion, an informational flyer, put forward an interesting argument about why gas pipelines are a more environmentally desirable alternative to green energy:
If all of the natural gas that would flow through the Atlantic Coast Pipeline is used to generate electricity, the 1.5 billion cubic feet per day (bcf/d) would yield approximately 190,500 megawatt-hours per day (mwh/d) of electricity. The pipeline, once operational, would affect approximately 4,600 acres of land. To generate that much electricity with wind turbines, utilities would need approximately 46,500 wind turbines on approximately 476,000 acres of land. To generate that much electricity with solar farms, utilities would need approximately 1.7 million acres of land dedicated to solar power generation.
Nonetheless, researchers, as well as environmental groups, have questioned whether the logic is sound, given production in both the Marcellus and Utica Formations is dropping off in recent assessments.
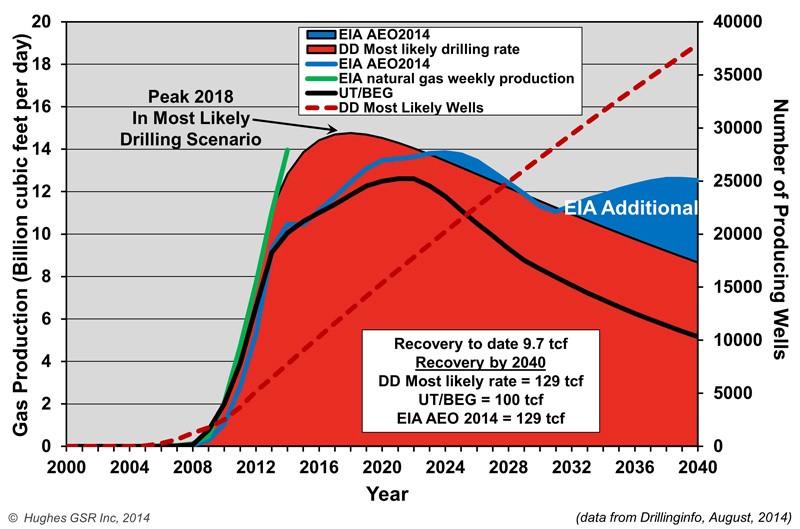
Both Nature, in their article Natural Gas: The Fracking Fallacy, and Post Carbon Institute, in their paper Drilling Deeper, took a critical look at several of the current production scenarios for the Marcellus Shale offered by EIA and University of Texas Bureau of Economic Geology (UT/BEG). All estimates show a decline in production over current levels. The University of Texas report, authored by petroleum geologists, is considerably less optimistic than what has been suggested by the Energy Information Administration (EIA), and imply that the oil and gas bubble is likely to soon burst.
Natural Gas Production Projections for Marcellus Shale
David Hughes, author of the Drilling Deeper report, summarized some of his findings on Marcellus productivity:
Field decline averages 32% per year without drilling, requiring about 1,000 wells per year in Pennsylvania and West Virginia to offset.
Core counties occupy a relatively small proportion of the total play area and are the current focus of drilling.
Average well productivity in most counties is increasing as operators apply better technology and focus drilling on sweet spots.
Production in the “most likely” drilling rate case is likely to peak by 2018 at 25% above the levels in mid-2014 and will cumulatively produce the quantity that the Energy Information Administration (EIA) projected through 2040. However, production levels will be higher in early years and lower in later years than the EIA projected, which is critical information for ongoing infrastructure development plans.
Five out of more than 70 counties account for two-thirds of production. Eighty-five percent of production is from Pennsylvania, 15% from West Virginia and very small amounts from Ohio and New York. (The EIA has published maps of the depth, thickness and distribution of the Marcellus shale, which are helpful in understanding the variability of the play.)
The increase in well productivity over time reported in Drilling Deeper has now peaked in several of the top counties and is declining. This means that better technology is no longer increasing average well productivity in these counties, a result of either drilling in poorer locations and/or well interference resulting in one well cannibalizing another well’s recoverable gas. This declining well productivity is significant, yet expected, as top counties become saturated with wells and will degrade the economics which have allowed operators to sell into Appalachian gas hubs at a significant discount to Henry hub gas prices.
The backlog of wells awaiting completion (aka “fracklog”) was reduced from nearly a thousand wells in early 2012 to very few in mid-2013, but has increased to more than 500 in late 2014. This means there is a cushion of wells waiting on completion which can maintain or increase overall play production as they are connected, even if the rig count drops further.
Current drilling rates are sufficient to keep Marcellus production growing on track for its projected 2018 peak (“most likely” case in Drilling Deeper).
Post Carbon Institute estimates that Marcellus predictions overstate actual production by 45-142%. Regardless of the model we consider, production starts to drop off within a year or two after the proposed Atlantic Coast Pipeline would go into operation. This downward trend leads to some serious questions about whether moving ahead with the assumption of three-fold demand for gas along the Carolina coast should prompt some larger planning questions, and whether the availability of recoverable Marcellus gas over the next twenty years, as well as the environmental impacts of the Atlantic Coast Pipeline, justify its construction.
Next steps
The Federal Energy Regulatory Commission, FERC, will make a final approval on the pipeline route later in the summer of 2015, with a final decision on the pipeline construction itself expected by fall 2016.
UPDATE #1: On January 19, 2016, the Richmond Times-Dispatch reported that the United States Forest Service had rejected the pipeline, due to the impact its route would have on habitats of sensitive animal species living in the two National Forests it is proposed to traverse.
UPDATE #2: On February 12, 2016, Dominion Pipeline Company released a new map showing an alternative route to the one recently rejected by the United States Forest Service a month earlier. Stridently condemned by the Dominion Pipeline Monitoring Coalition as an “irresponsible undertaking”, the new route would not only cross terrain the Dominion had previously rejected as too hazardous for pipeline construction, it would–in avoiding a path through Cheat and Shenandoah Mountains–impact terrain known for its ecologically sensitive karst topography, and pose grave risks to water quality and soil erosion.
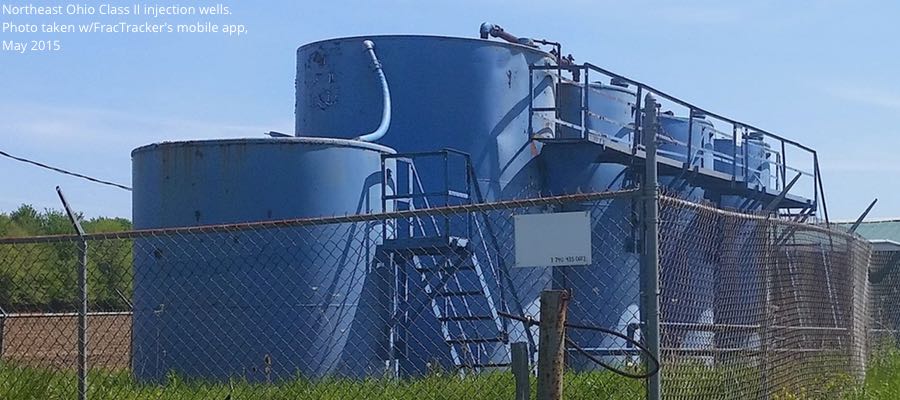
Waste disposal is an issue that causes quite a bit of consternation even amongst those that are pro-fracking. The disposal of fracking waste into injection wells has exposed many “hidden geologic faults” across the US as a result of induced seismicity, and it has been linked recently with increases in earthquake activity in states like Arkansas, Kansas, Texas, and Ohio. Here in OH there is growing evidence – from Ashtabula to Washington counties – that injection well volumes and quarterly rates of change are related to upticks in seismic activity.
Origins of Fracking Waste
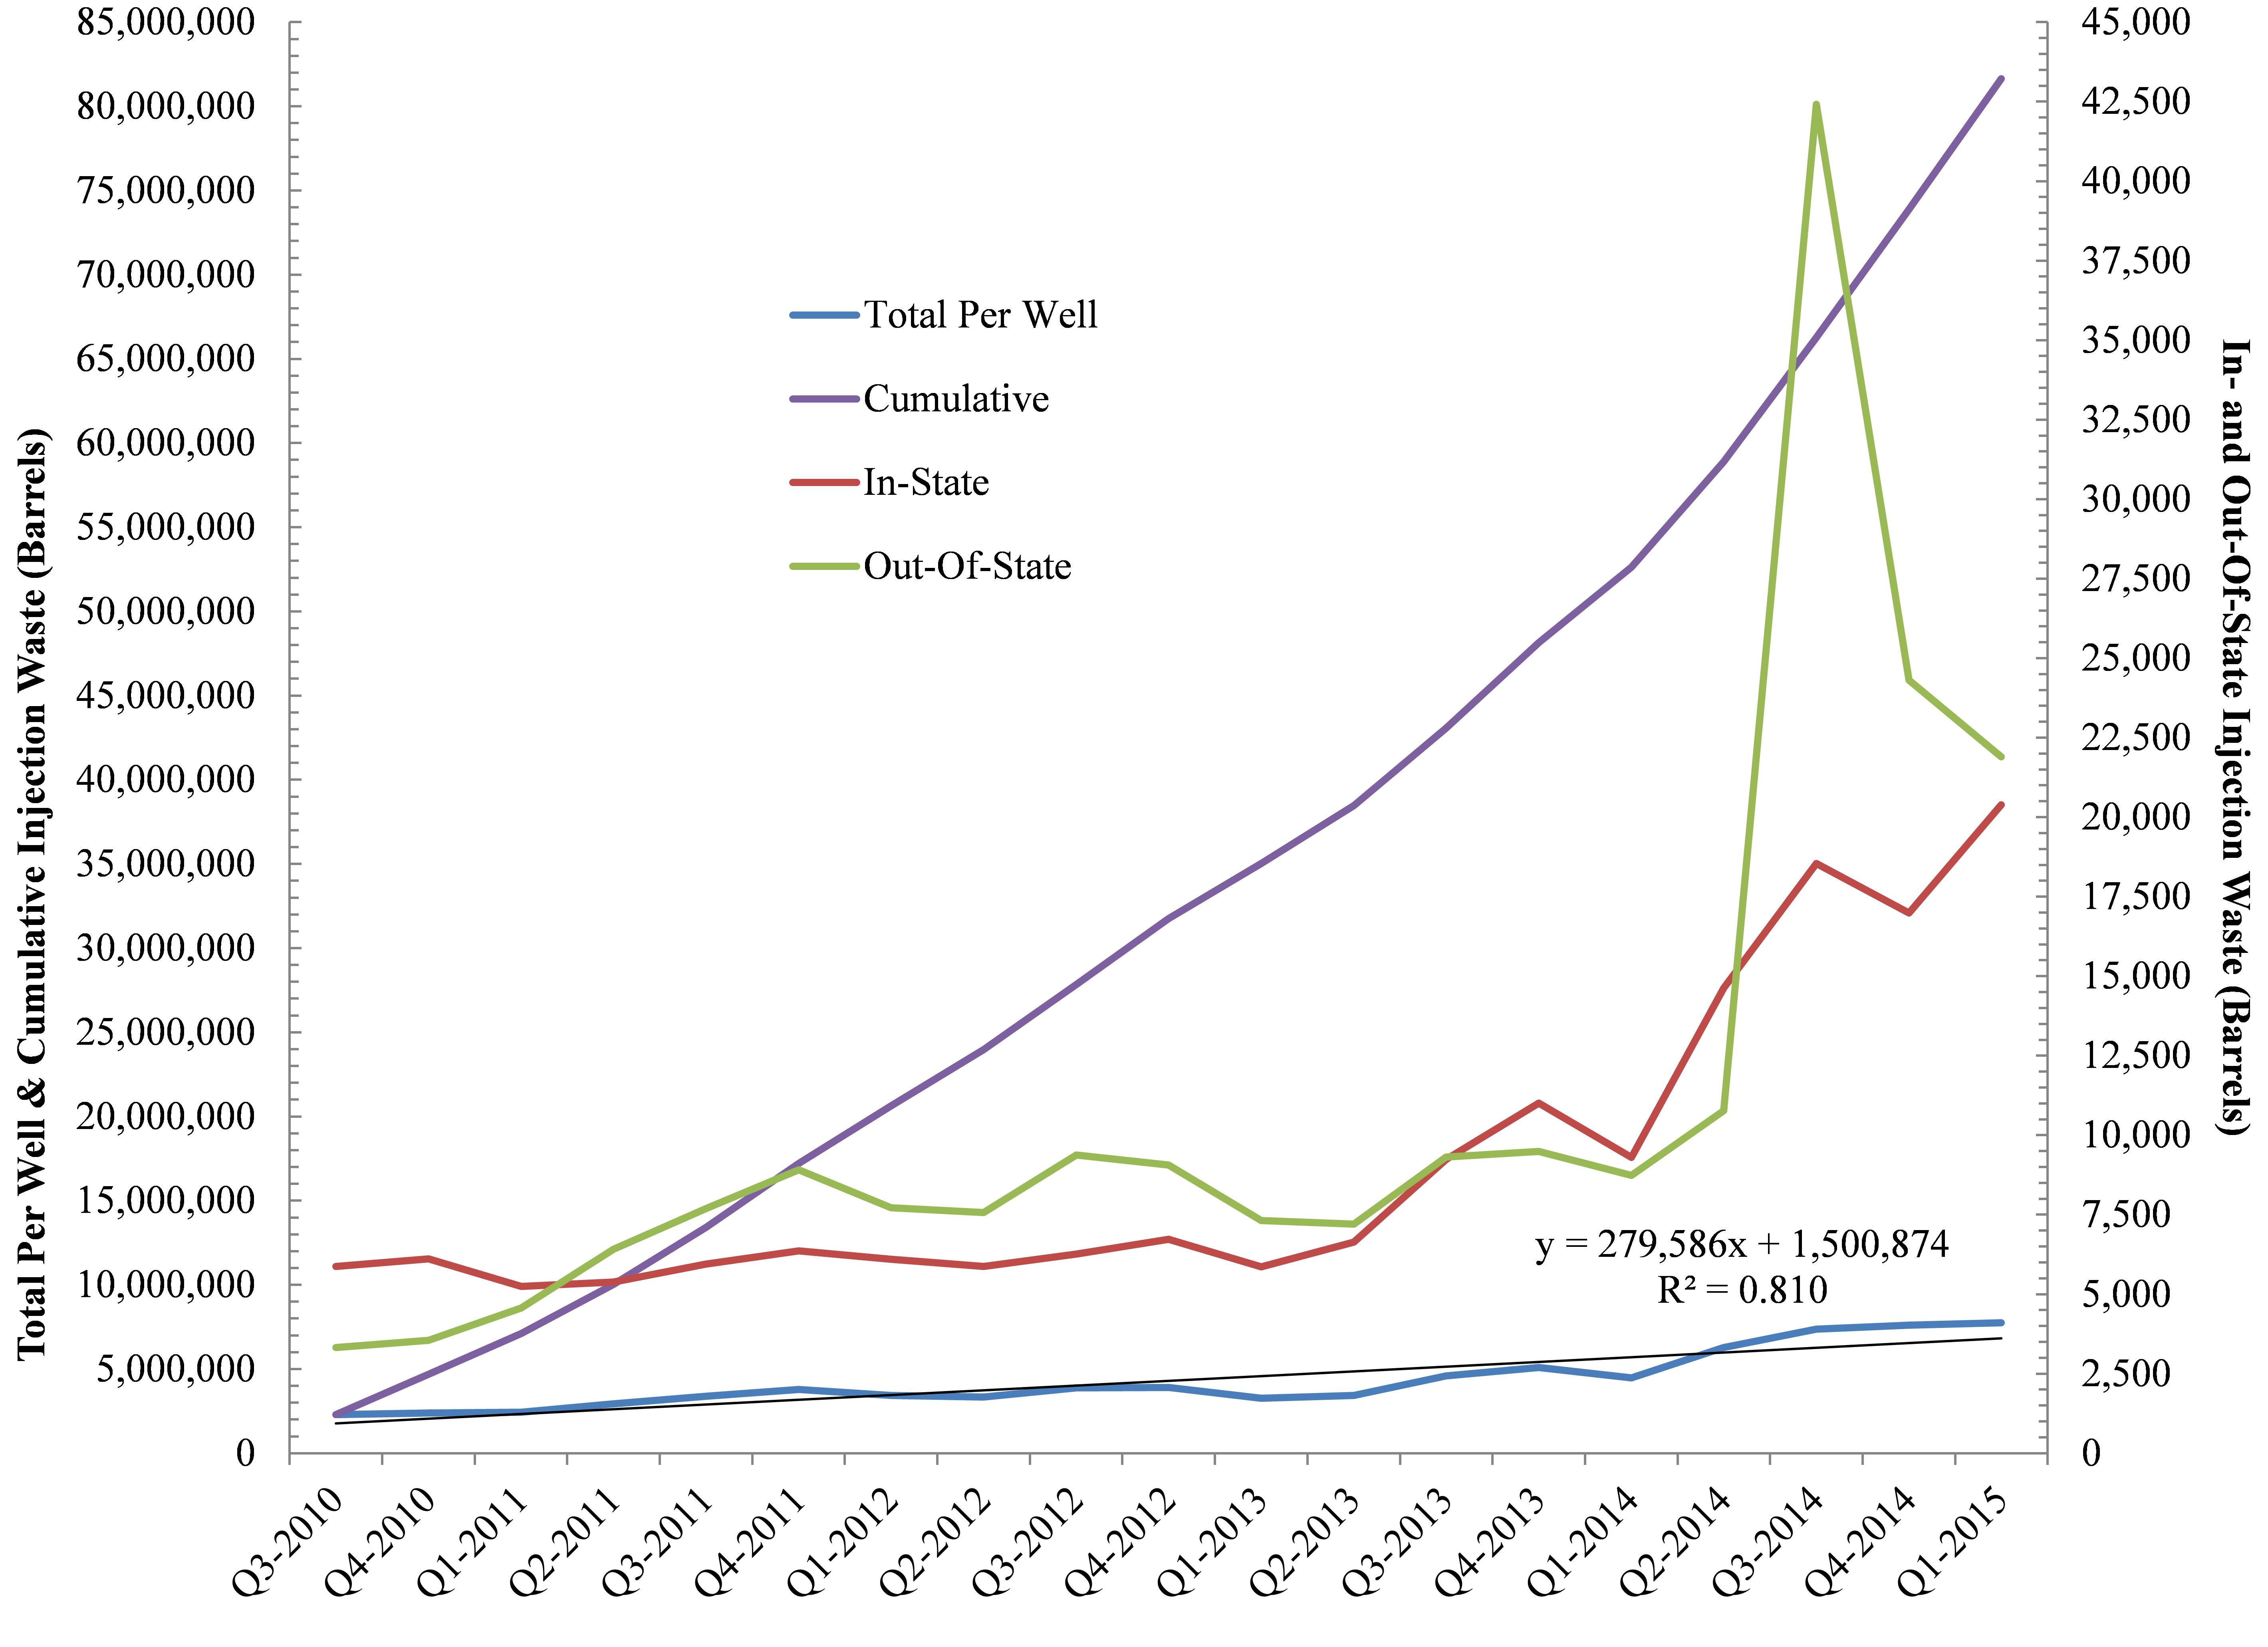
Furthermore, as part of this analysis we wanted to understand the ratio of Ohio’s Class II waste that has come from within Ohio and the proportion of waste originating from neighboring states such as West Virginia and Pennsylvania. Out of 960 Utica laterals and 245+ Class II wells, the results speak to the fact that a preponderance of the waste is coming from outside Ohio with out-of-state shale development accounting for ≈90% of the state’s hydraulic fracturing brine stream to-date. However, more recently the tables have turned with in-state waste increasing by 4,202 barrels per quarter per well (BPQPW). Out-of-state waste is only increasing by 1,112 BPQPW. Such a change stands in sharp contrast to our August 2013 analysis that spoke to 471 and 723 BPQPW rates of change for In- and Out-Of-State, respectively.
Brine Production
Figure 1. Ohio Class II Injection Well trends In- and Out-Of-State, Cumulatively, and on Per Well basis (n = 248).
For every gallon of freshwater used in the fracking process here in Ohio the industry is generating .03 gallons of brine (On average, Ohio’s 758 Utica wells use 6.88 million gallons of freshwater and produce 225,883 gallons of brine per well).
Back in August of 2013 the rate at which brine volumes were increasing was approaching 150,000 BPQPW (Learn more, Fig 5), however, that number has nearly doubled to +279,586 BPQPW (Note: 1 barrel of brine equals 32-42 gallons). Furthermore, Ohio’s Class II Injection wells are averaging 37,301 BPQPW (1.6 MGs) per quarter over the last year vs. 12,926 barrels BPQPW – all of this between the initiation of frack waste injection in 2010 and our last analysis up to and including Q2-2013. Finally, between Q3-2010 and Q1-2015 the exponential increase in injection activity has resulted in a total of 81.7 million barrels (2.6-3.4 billion gallons) of waste disposed of here in Ohio. From a dollars and cents perspective this waste has generated $2.5 million in revenue for the state or 00.01% of the average state budget (Note: 2.5% of ODNR’s annual budget).
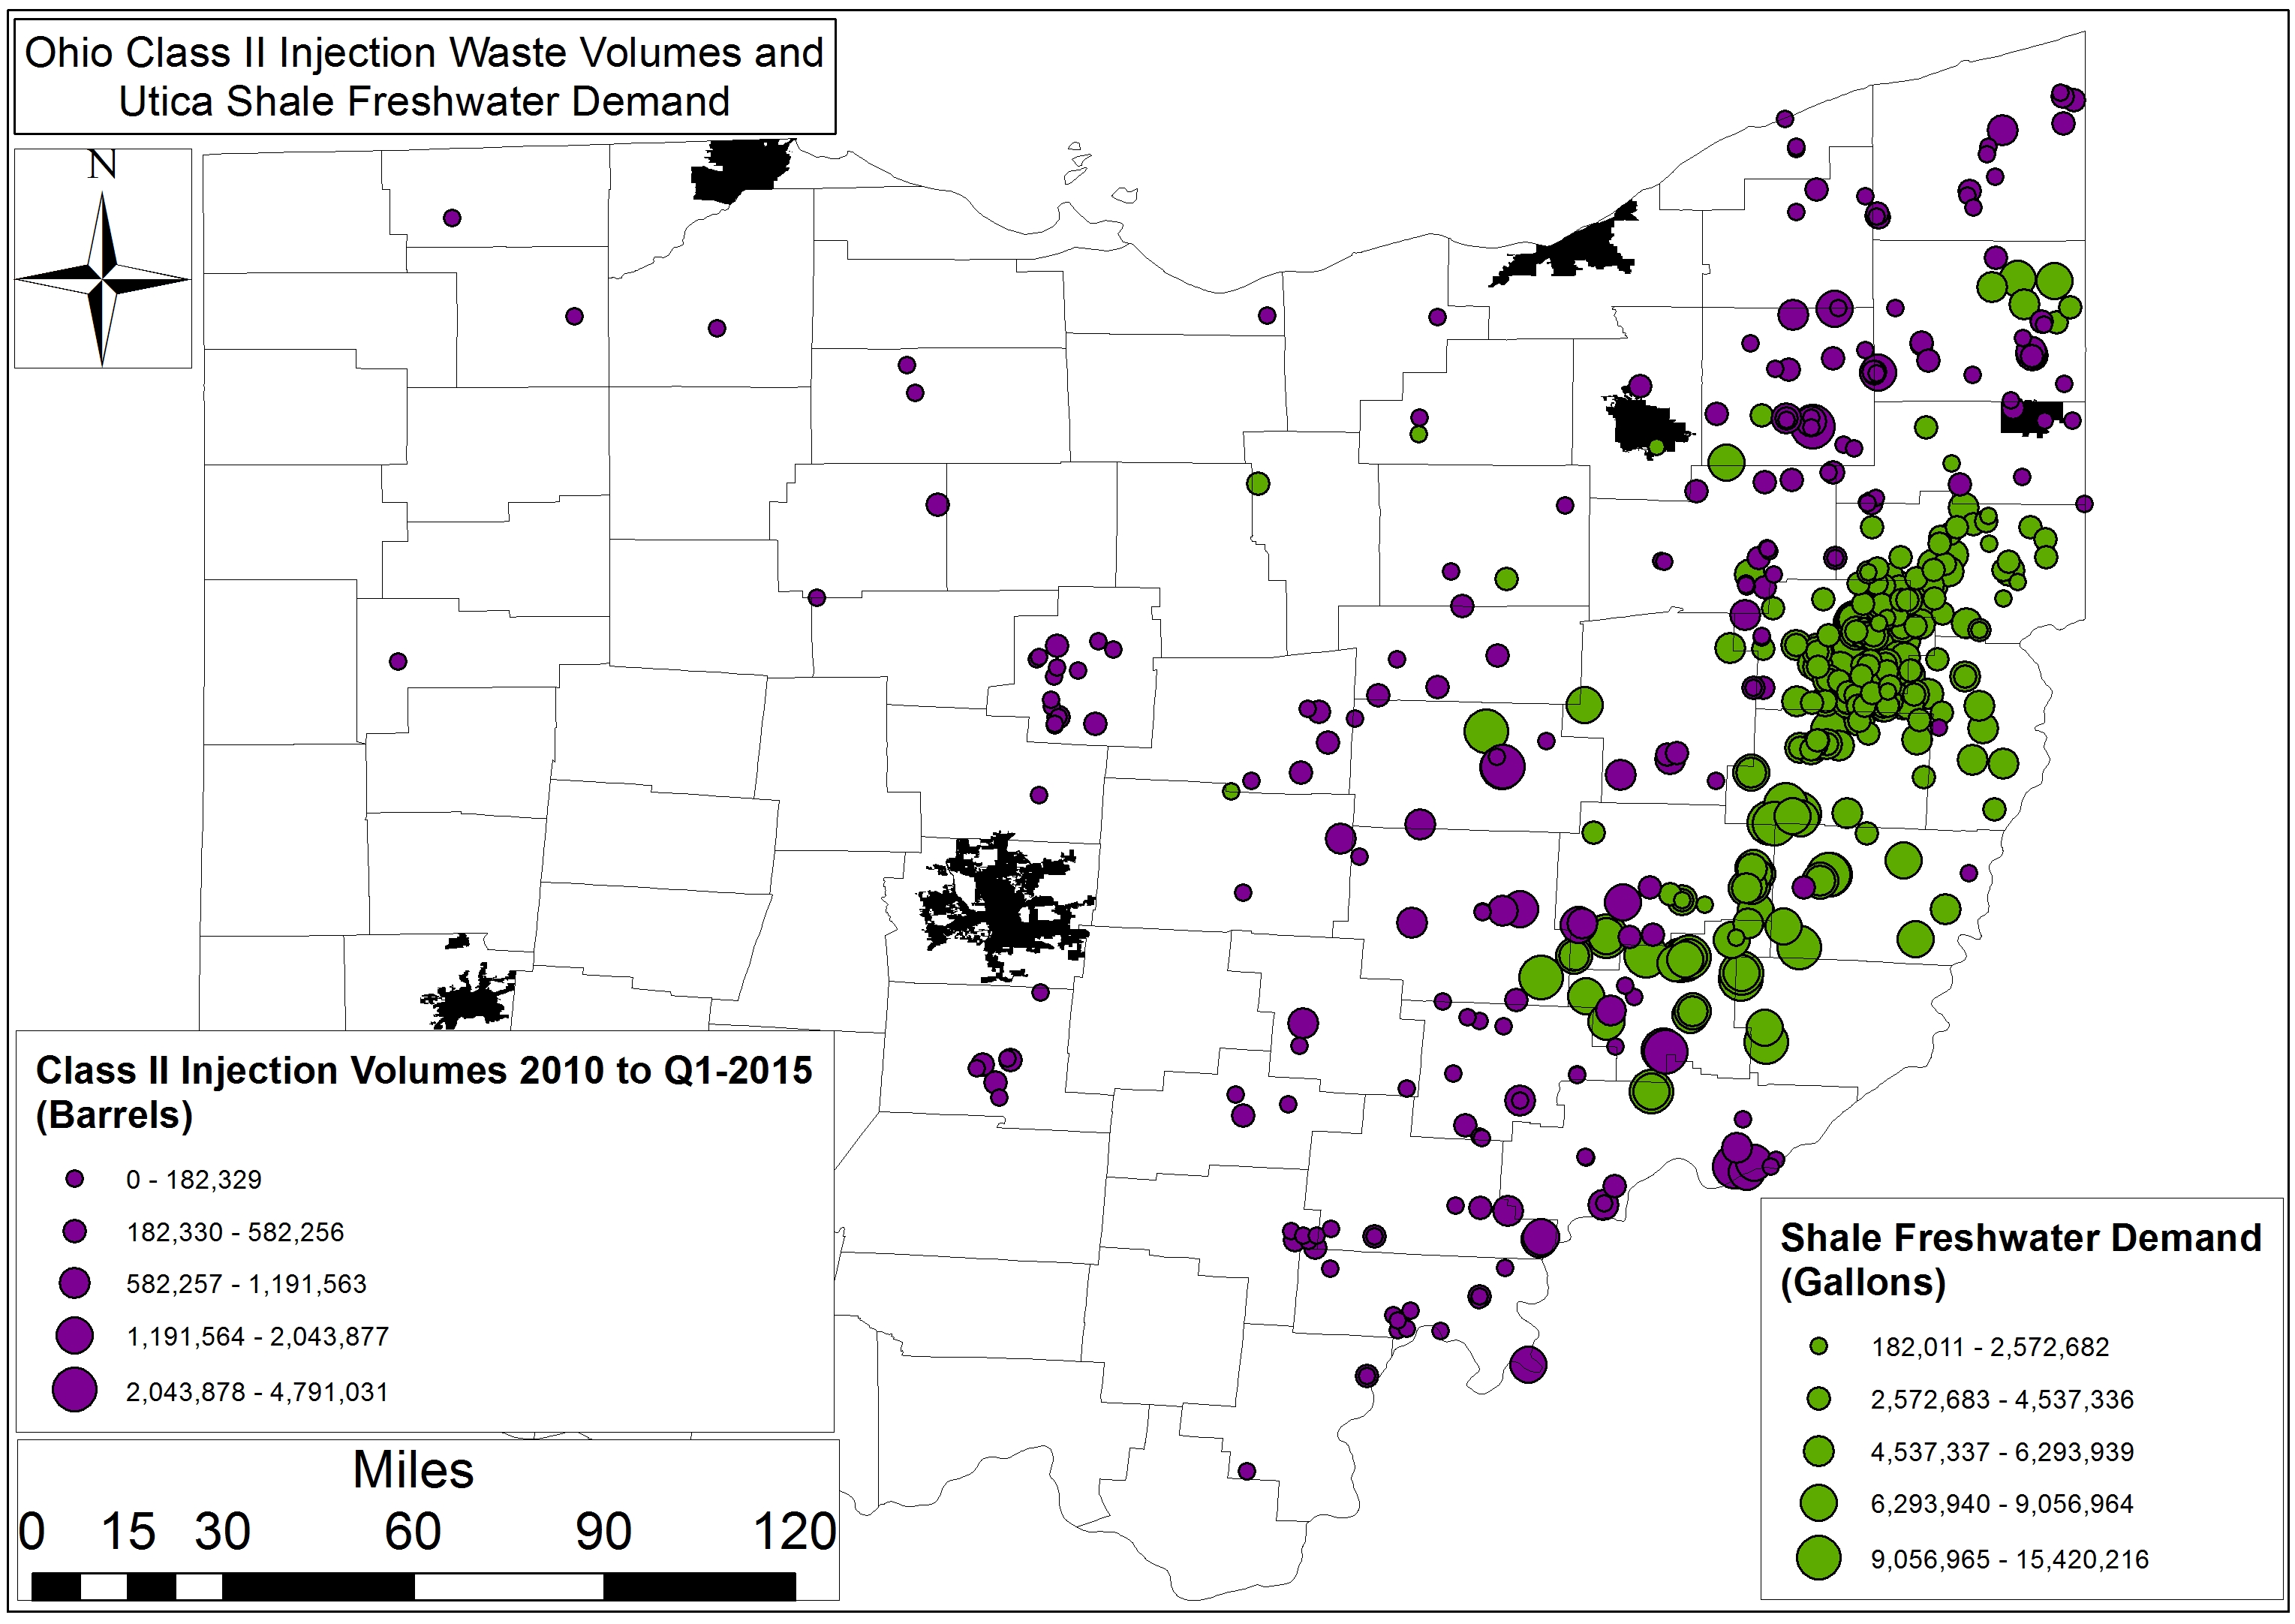
Freshwater Demand Growing
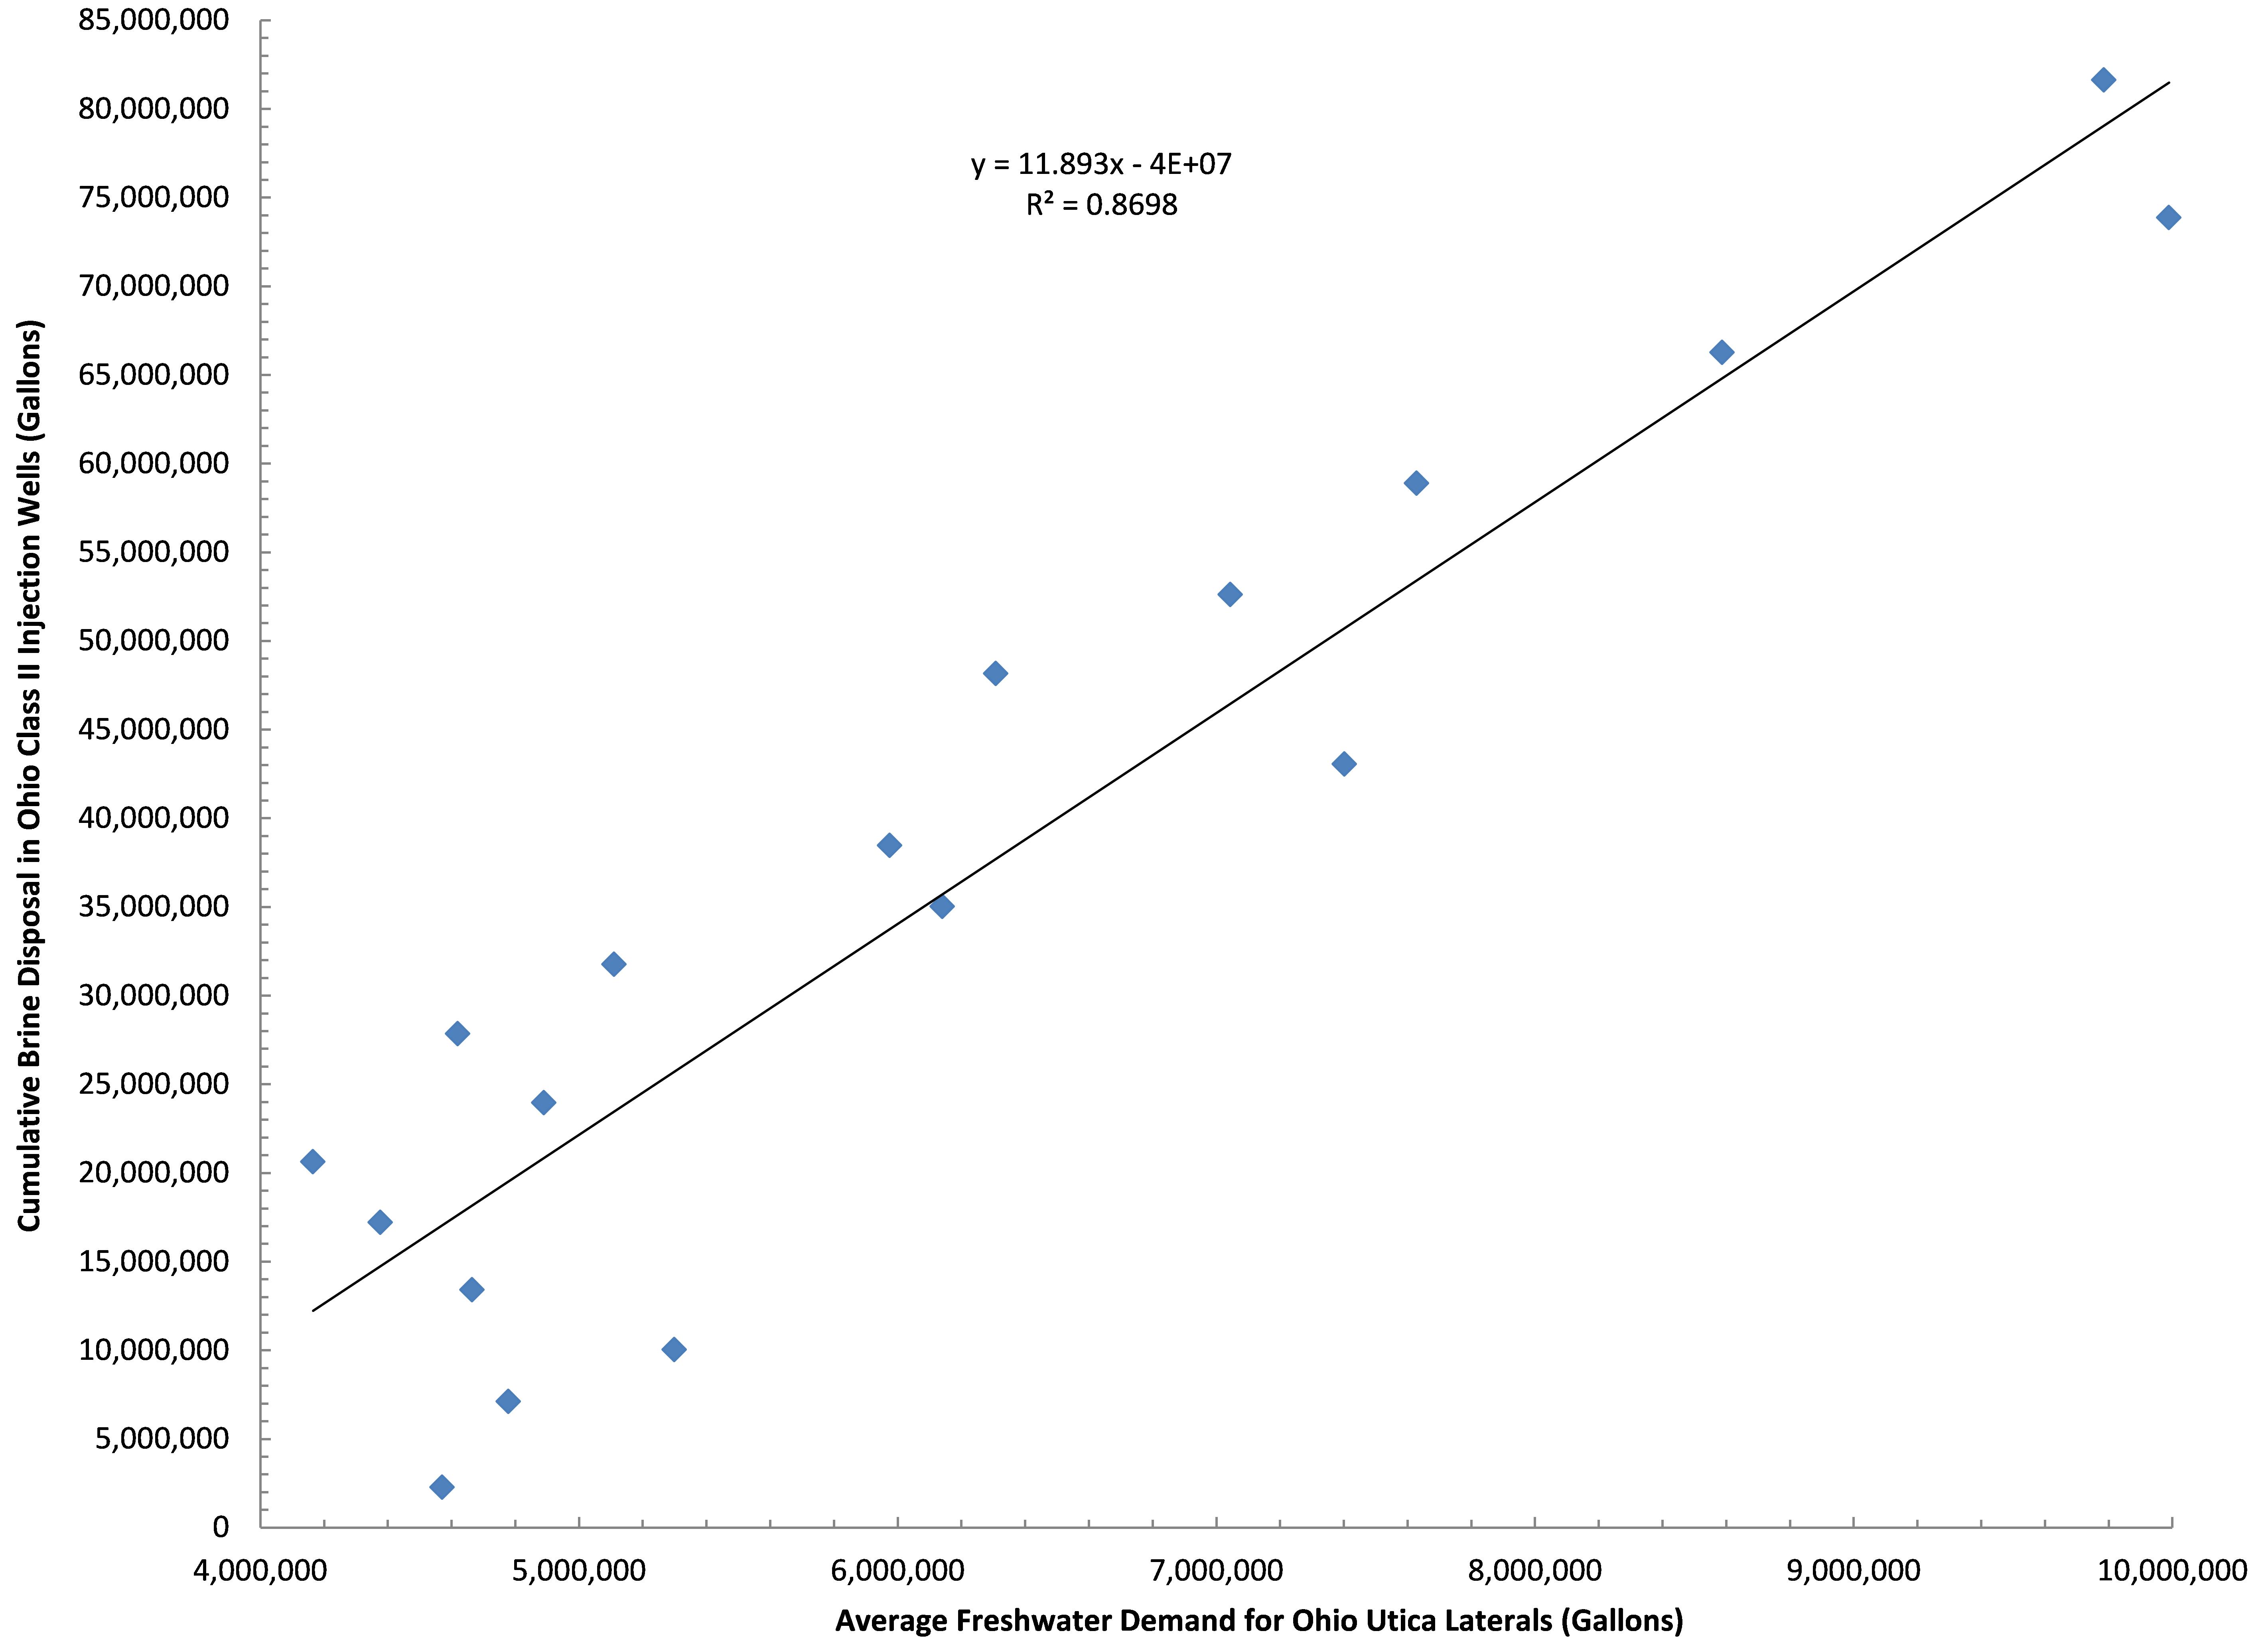
Figure 2. Ohio Class II Injection Well disposal as a function of freshwater demand by the shale industry in Ohio between Q3-2010 and Q1-2015.
The relationship between brine (waste) produced and freshwater needed by the hydraulic fracturing industry is an interesting one; average freshwater demand during the fracking process accounts for 87% of the trend in brine disposal here in Ohio (Fig. 2). The more water used, the more waste produced. Additionally, the demand for OH freshwater is growing to the tune of 405-410,000 gallons PQPW, which means brine production is growing by roughly 12,000 gallons PQPW. This says nothing for the 450,000 gallons of freshwater PQPW increase in West Virginia and their likely demand for injection sites that can accommodate their 13,500 gallons PQPW increase.
Where will all this waste go? I’ll give you two guesses, and the first one doesn’t count given that in the last month the ODNR has issued 7 new injection well permits with 9 pending according to the Center For Health and Environmental Justice’s Teresa Mills.
https://www.fractracker.org/a5ej20sjfwe/wp-content/uploads/2015/07/Injection-Feature.jpg400900Ted Auch, PhDhttps://www.fractracker.org/a5ej20sjfwe/wp-content/uploads/2025/09/2025-Wordmark-Logo.pngTed Auch, PhD2015-07-09 14:54:002020-07-21 10:30:05OH Class II Injection Wells – Waste Disposal and Industry Water Demand
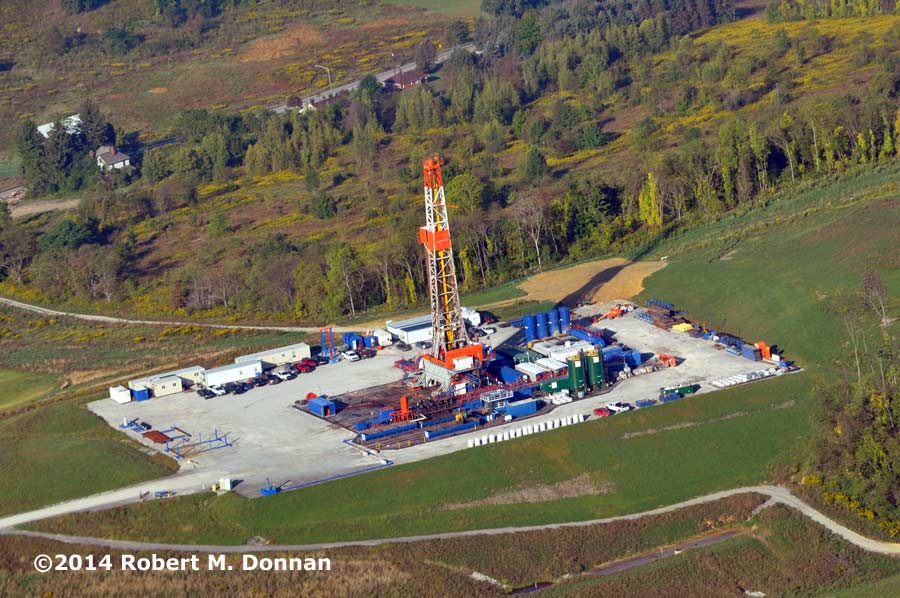
We were recently asked if there is a reliable way to determine what constituents are being housed in certain types of oil and gas storage containers. While there is not typically a simple and straightforward response to questions like this, some times we can provide educated guesses based on a few photos, placards, or a trip to the site.
One way to become better informed is to follow the trucks. The origins of the trucks will determine whether the current stage in the extraction process is drilling or fracturing (the containers cannot be for both unless they are delivering fresh water). Combine that with good side-view photos of the trucks will tell you if they are heavier going into the site or heavier leaving. Look for the clearance between the rear tires and the frame. Tanker trucks can typically carry 4000 gallons or 100 barrels.
For a quick guide to oil and gas storage containers, see the “quiz” we have compiled below:
Storage Container Quiz
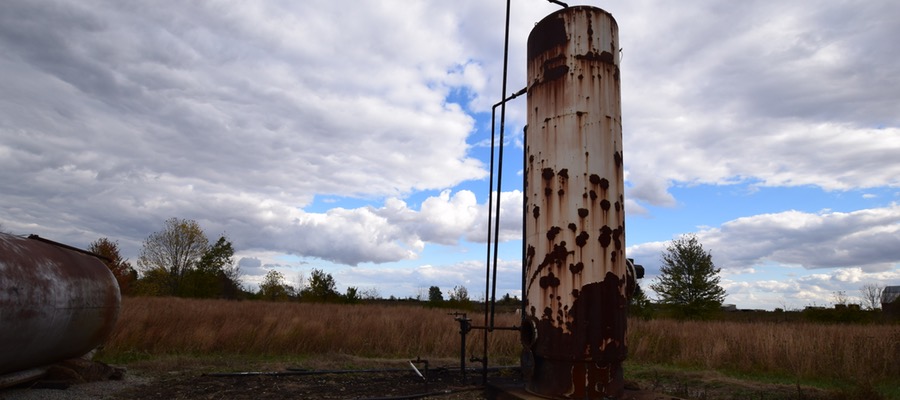
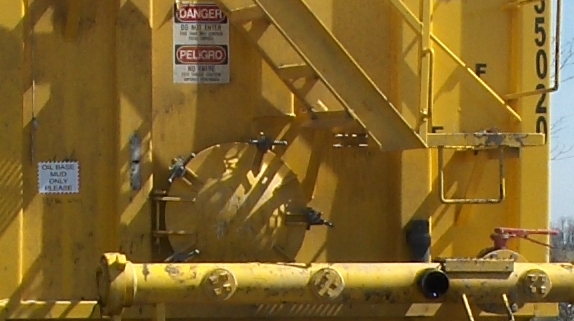
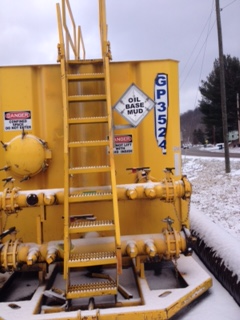
1. What is in this yellow tank?
Q1: Photo 1
Q1: Photo 2 (same tank zoomed in)
Answer: This yellow 500-barrel wheelie storage tank in photos 1 and 2 is a portable storage tank, identified in the placard in photo 2 as having held oil base drill mud at one time. Drillers prefer to keep certain tanks identified for specific purposes if at all possible. This is especially true if they have paid extra to get a tank “certified clean” to use for fresh water storage. A certified clean tank does not mean that the water is potable (drinkable).
Other storage containers that hold fresh water are shown below:
Shark Tanks
Shark Tanks from the sky
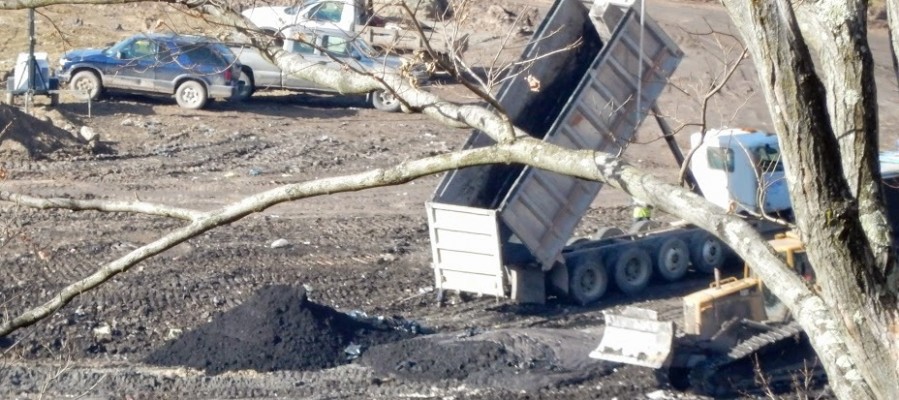
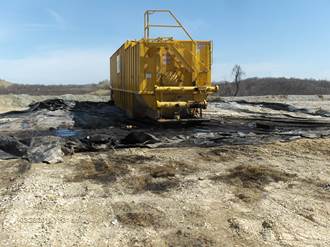
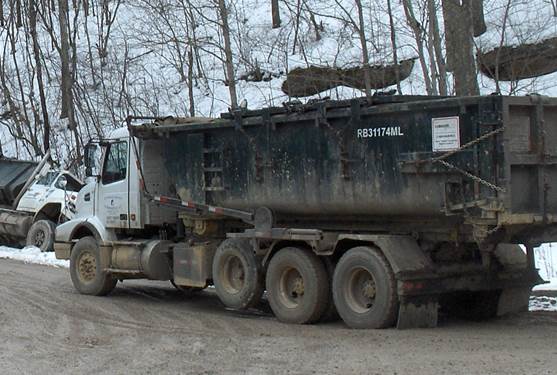
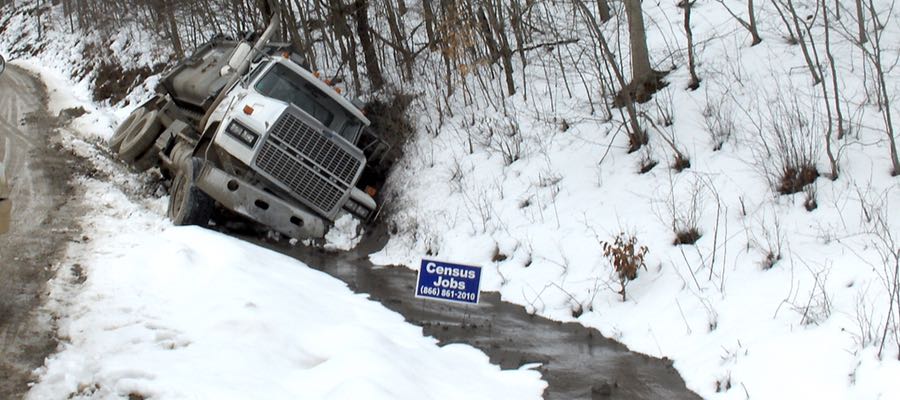
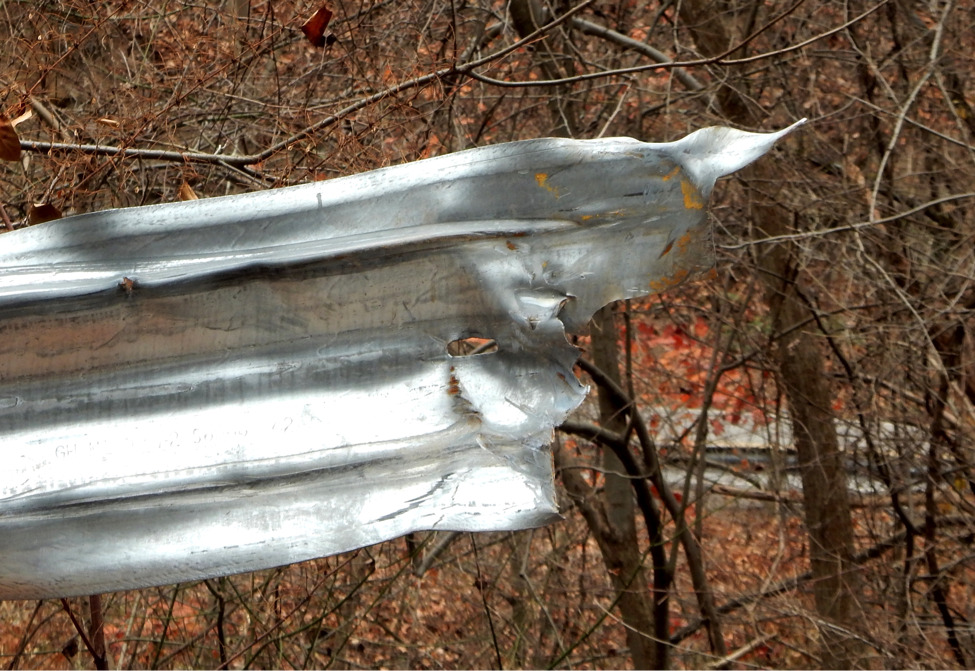
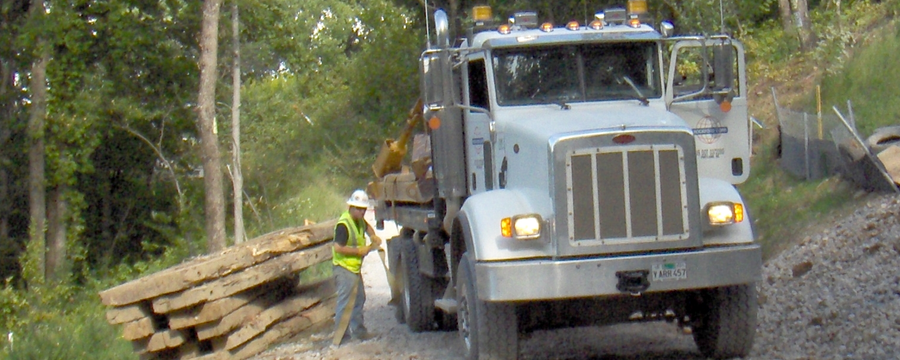
2. What is this truck transporting?
Q2: Truck
Answer: This type of truck is normally used to haul solid waste – such as drill cuttings going to a landfill. Some trucks, however do not make it the whole way to the landfill before losing some of their contents as shown below.
Truck spill in WV
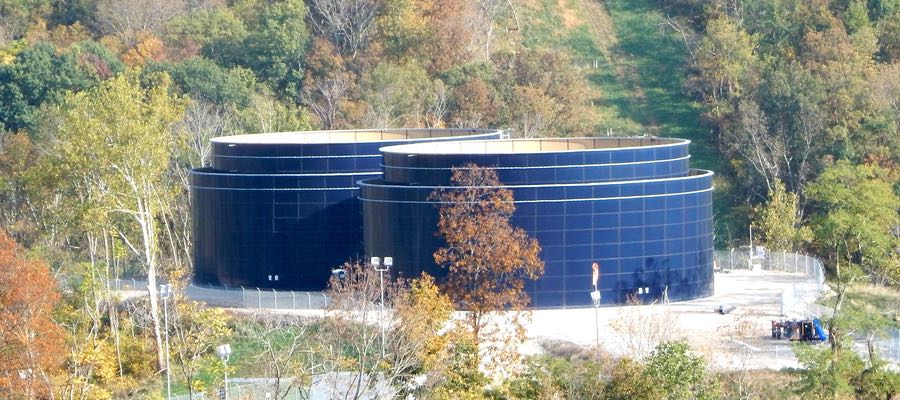
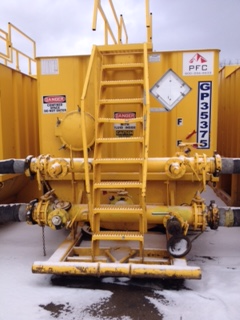
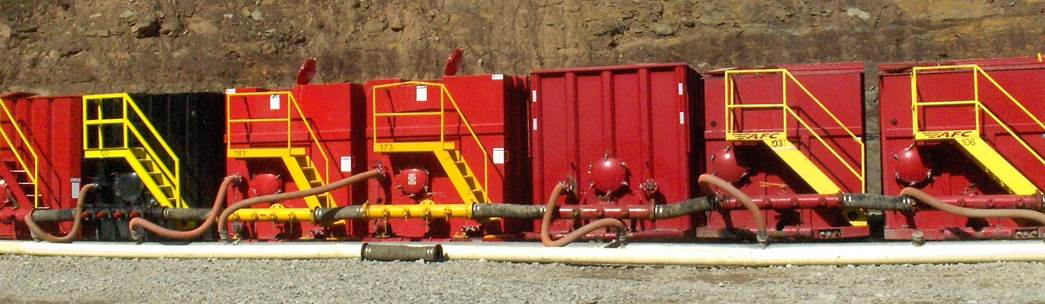
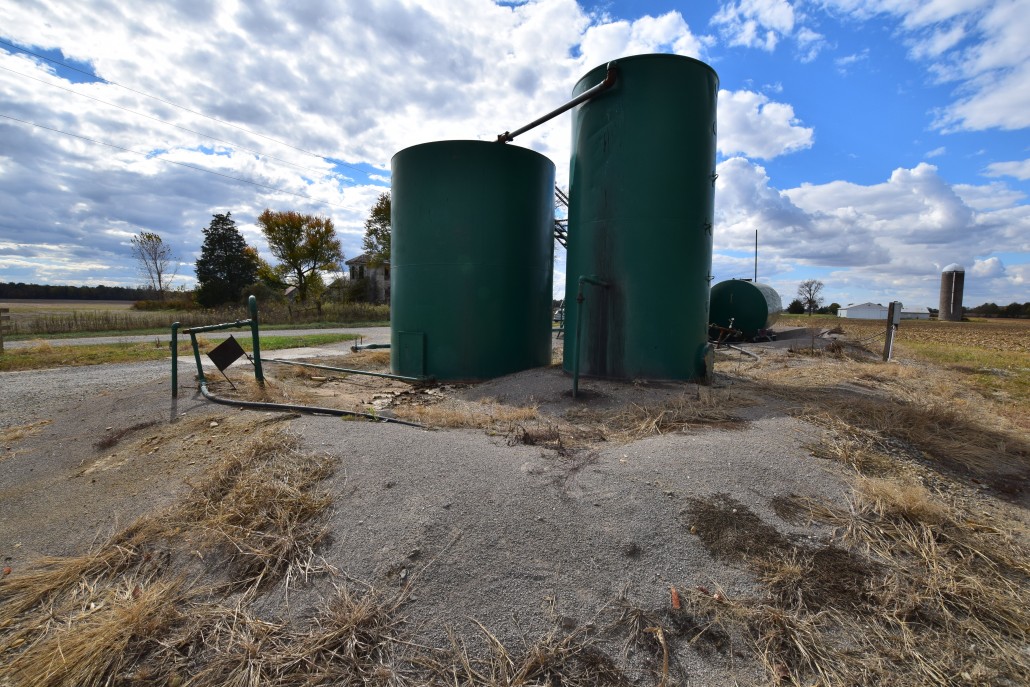
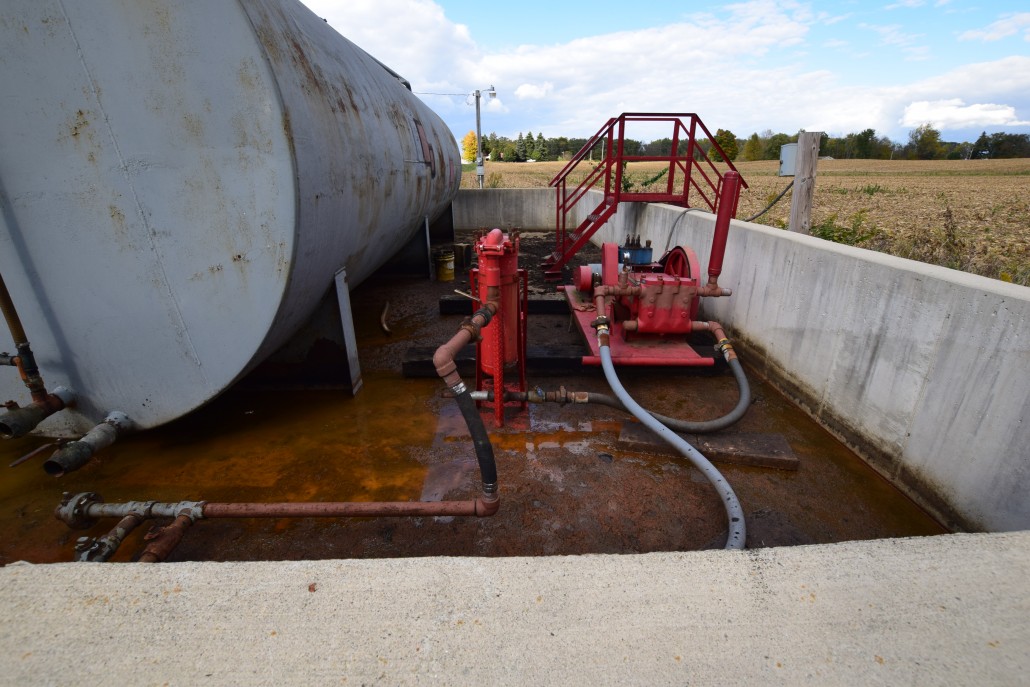
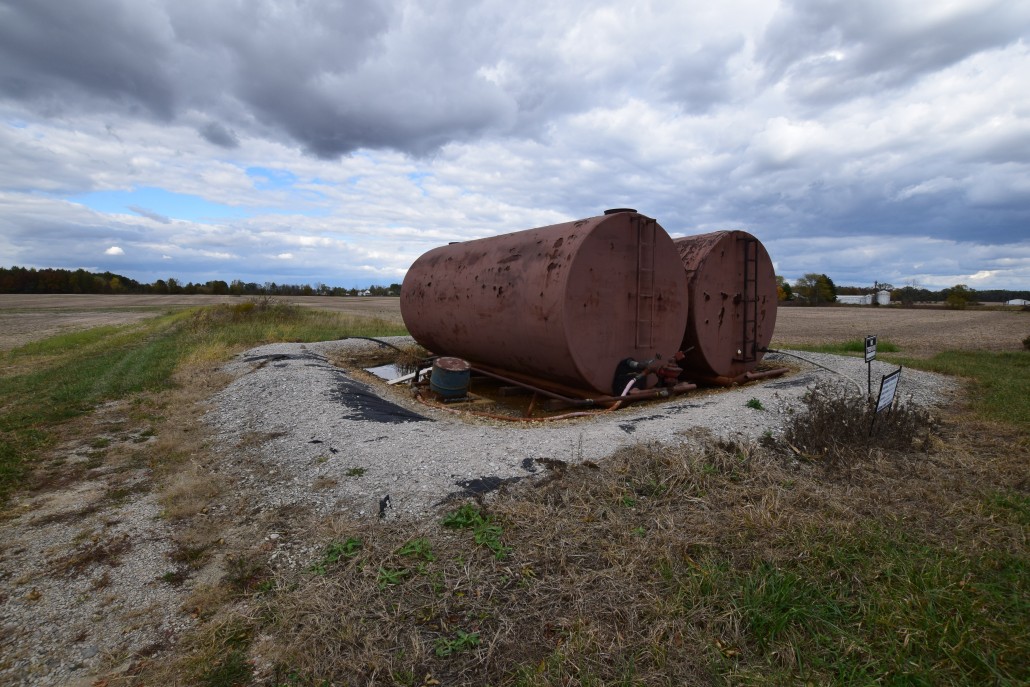
3. How about these yellow tanks?
Q3: Photo 1
Q3: Photo 2
Answer: The above storage containers are 500-barrel liquid storage tanks, also called “frac” tanks.
In photo 2 you can see that at least one tank is connected to others on either side of it. In this case you need to look at the overall operation to see what process is occurring nearby — or what had just finished — to determine what might be in the container presently.
The name plate on photo 1 says “drill mud,” which means that at one time that container might have held exactly that. Now, however, that container would likely have very little to do with drilling waste or drill cuttings. The “GP” and the number on the sign refers to Great Plains and the tank’s number. These type of tanks do not have official placards on them for the purposes of DOT labeling since they are never moved with any significant liquid in them.
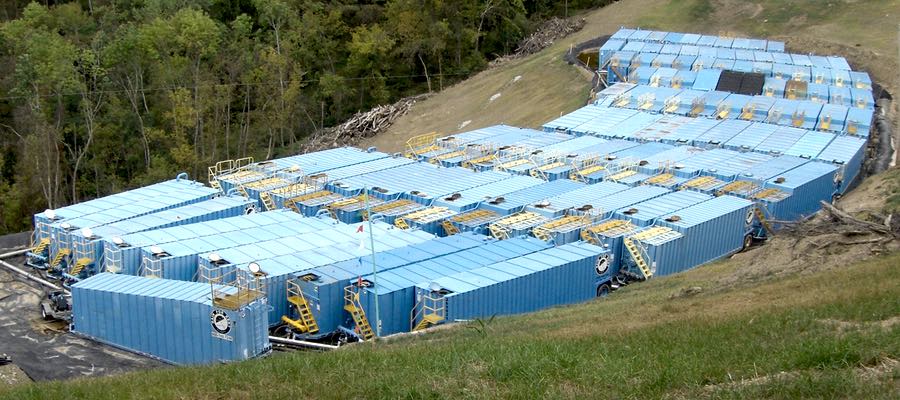
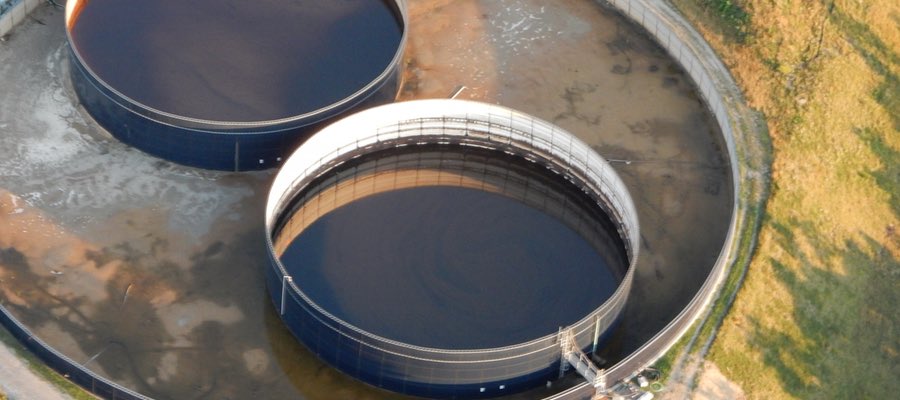
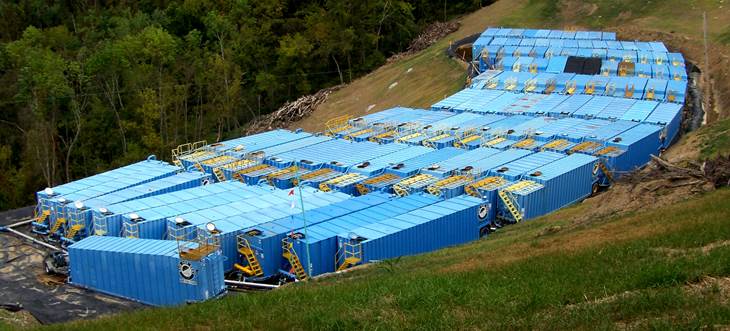
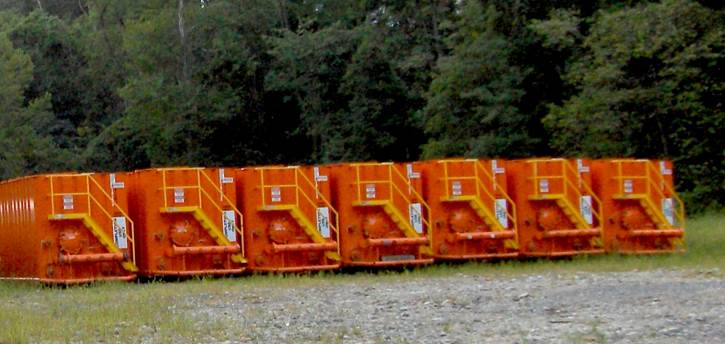
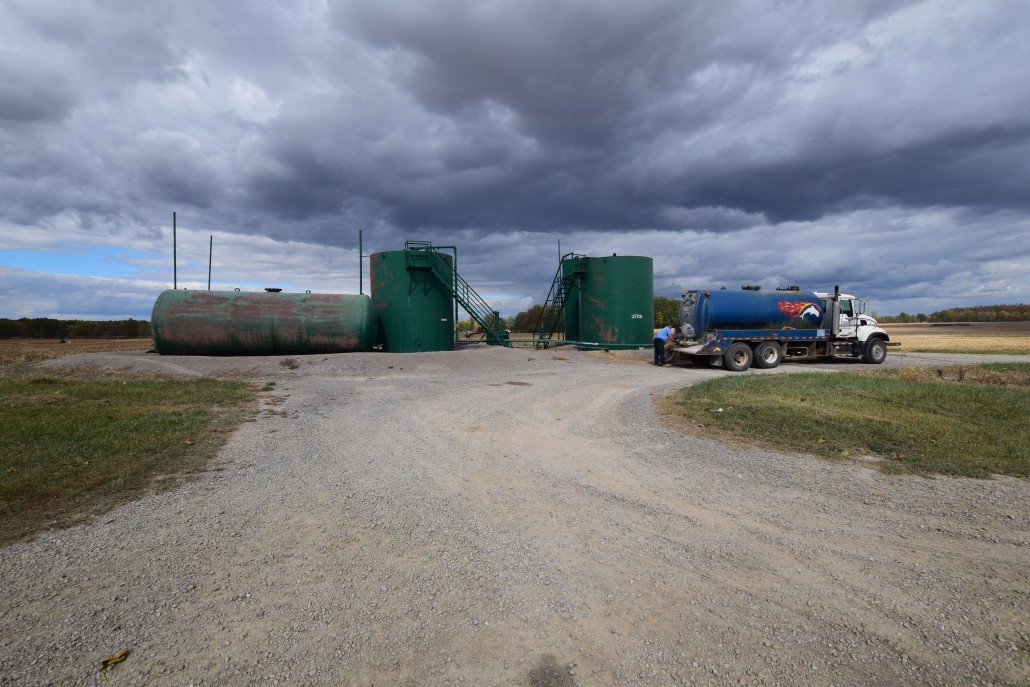
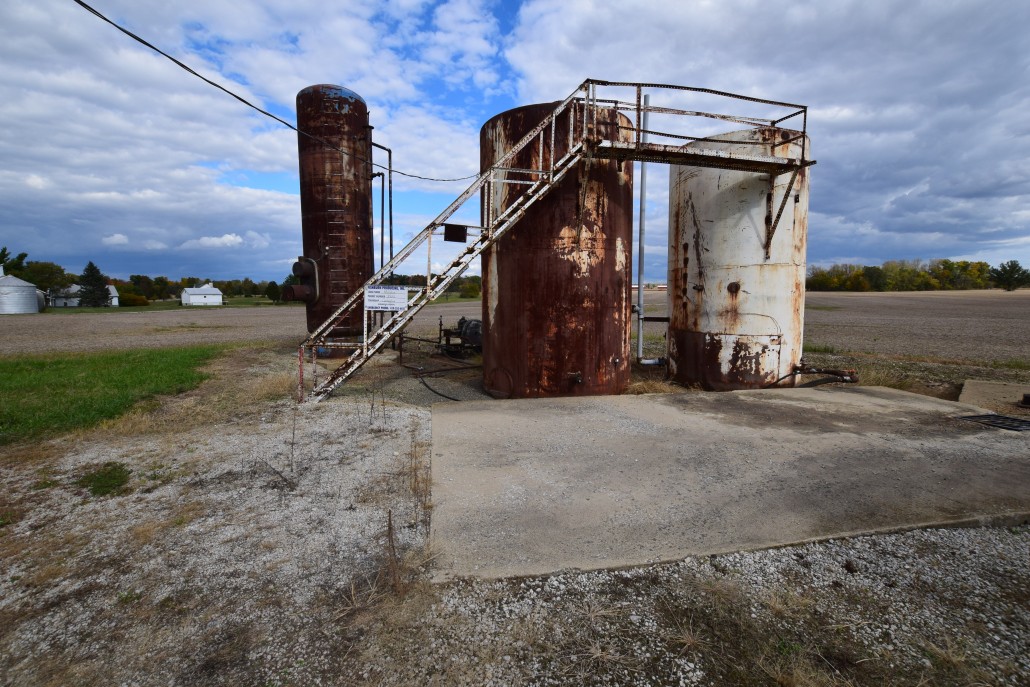
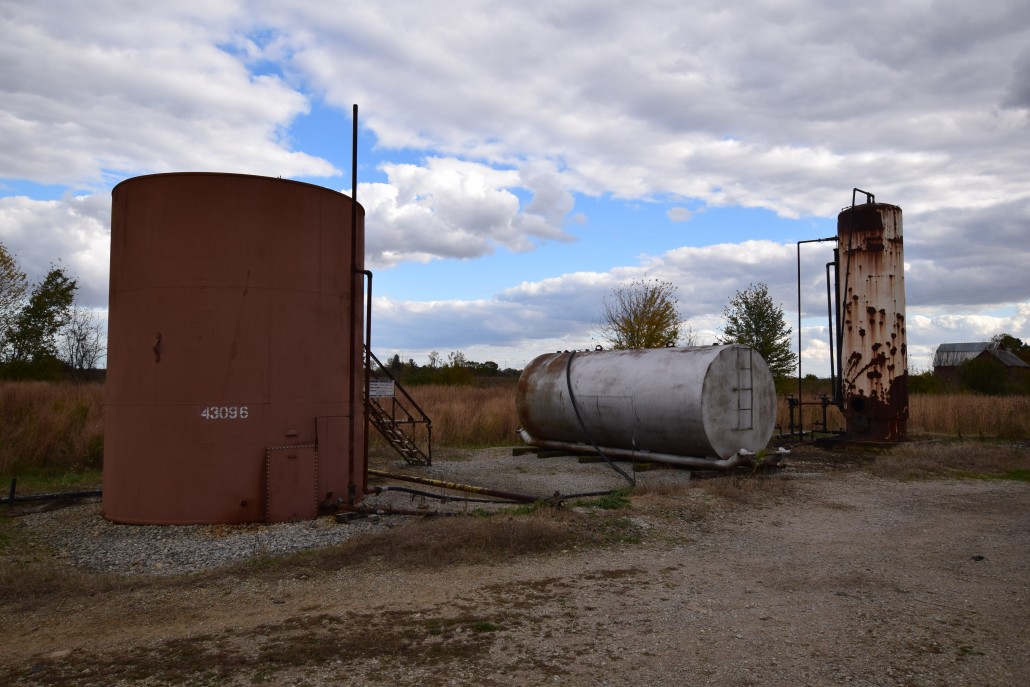
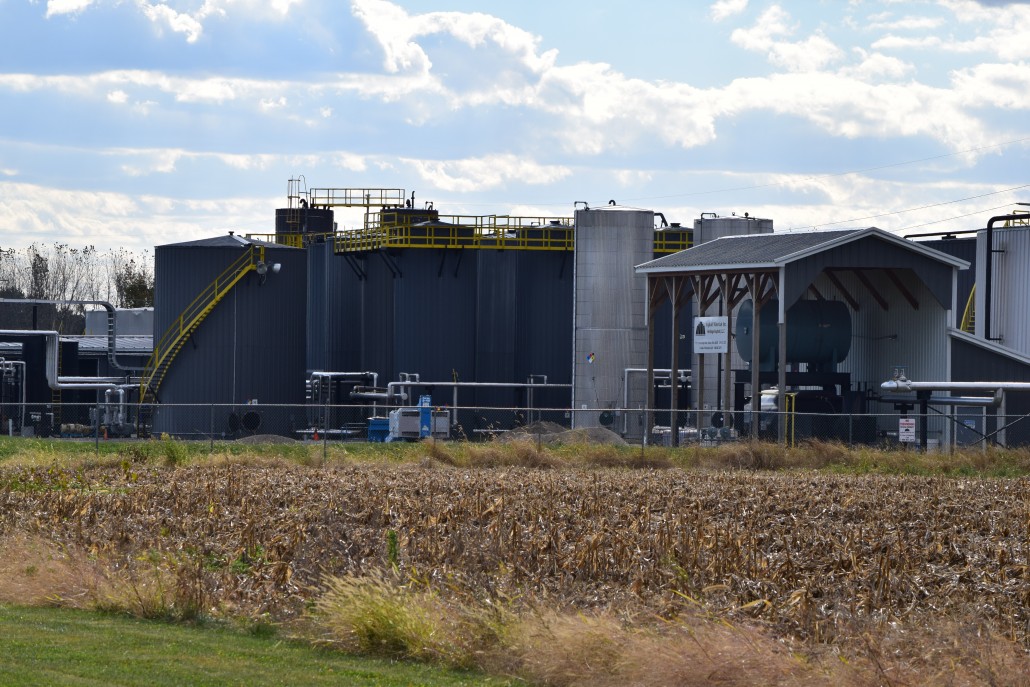
4: What about these miscellaneous tanks?
Q4: Photo 1 – Tank farm with 103 blue tanks
Q4: Photo 2 – Red tanks with connecting hoses
Q4: Photo 3 – Red tanks, no connections
Answer: There is no way to know – unless you have been closely following the process in your neighborhood and know the current stage of the well pad’s drilling process. Tank farms are usually just for storage unless there is some type of filtering and processing equipment on site. The drilling crews (for either horizontal or vertical wells) do not mix their fluids with the fracturing crew. That does not mean that one tank farm could not store a selection of flowback brine—or produced water, or drilling fluids. They would be stored in separate tanks or tank groups that are connected together – usually with flex hoses.
Since I am in the area often, I know that the tanks in photos 1 and 2 were storing fresh water. Both sets were associated with a nearby hydraulic fracturing operation, which has very little to do with the drilling process. You will never see big groups of tanks like this on a well pad that is currently being drilled.
The third set of tanks with no connections on an in-production well pad are probably just empty and storing air – but not fresh air. These tanks are just sitting there, waiting for their next assignment – storage only, not in use. Notice that there are no connecting pipes like in photo 2. The tanks in photo 3 could have held any of the following: fresh water, flowback, brine, mixed fracturing fluids, or condensate. Only the operator would know for certain.
https://www.fractracker.org/a5ej20sjfwe/wp-content/uploads/2015/02/Storage-Feature.jpg400900Guest Authorhttps://www.fractracker.org/a5ej20sjfwe/wp-content/uploads/2025/09/2025-Wordmark-Logo.pngGuest Author2015-02-17 15:41:102020-07-21 10:32:09Name that oil and gas storage container [quiz]
Wetzel County in northwestern West Virginia is remarkable for its steep, knobby hills and long narrow winding valleys – providing residents and visitor alike with beautiful views. Along with these scenic views, however, comes difficult roadways and dangerous traveling.
Two two-lane roads traverse the county from the west, along the Ohio River, to the east. There are very few connecting roads going north-south between these two main highways, and only one of them is semi-paved. This road is called Barker Run Road — treacherous, steep and winding. There is at least a 400-foot change in elevation in about ½ mile at one point, with multiple switchbacks.
Switchbacks have a reputation for swallowing up the long trailer component of the tractor-trailer combos, which now comprise a larger part of the traffic on Barker Run Road. Many of these trucks are heading to the HG Energy drilling sites on the ridges at the top. HG Energy has a significant footprint up there. On the east ridge there are four well pads in place and two additional pads being completed to the east, and two large ones on the ridge to the west of Barker Run Road. All that traffic must use Barker Run Road. Until the recent expansion of natural gas exploration in the area, however, I had never seen a tractor and trailer come up either side of the very steep road.
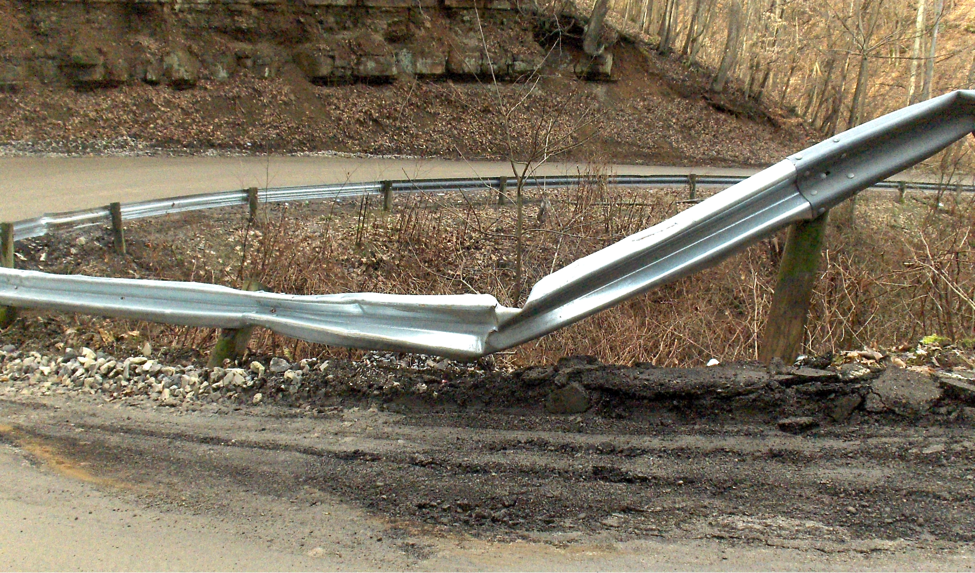
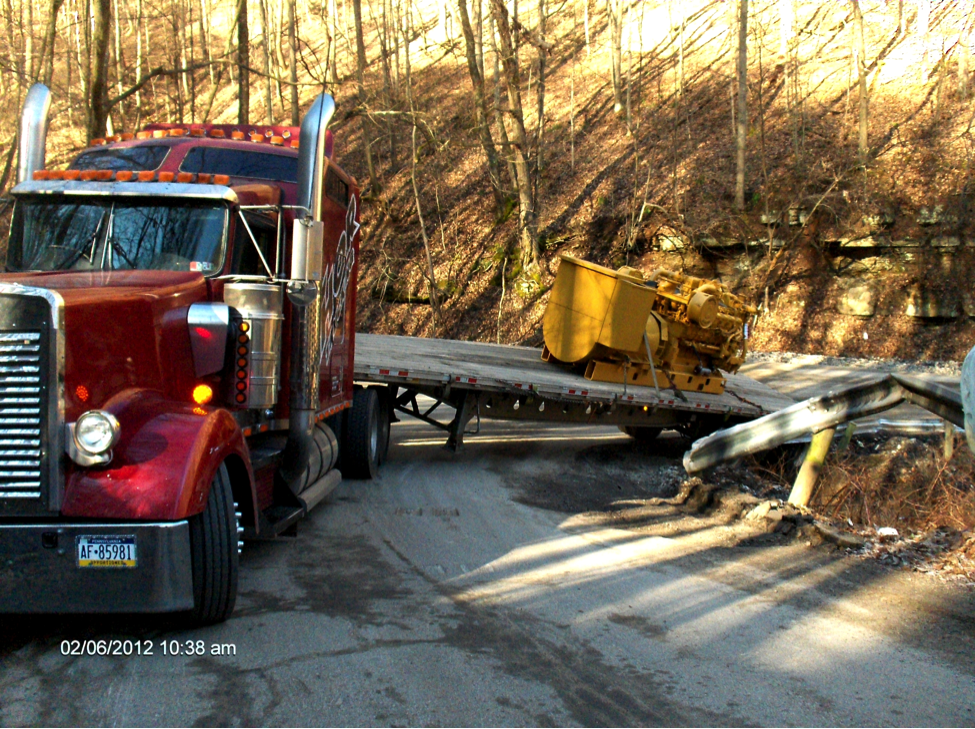
The first casualty caused by the large, long trailer trucks needed to service these well pads is always the full-time sentinels of our traffic safety – our faithful guard rails that are designed to take a beating before we and our vehicle descend over the hillside sideways or rolling over. A good example of a damaged but still useful guardrail is shown below from February on 2012 – wrinkled but useful. The very sharp turn in the roadway is also obvious here.
Figure 1. Switchback curve on Barker Run Road has seen its share of damage from the increase in truck traffic.
After leaving Route 7 heading south on Barker Run Road, one encounters a particularly sharp and steep switchback curve as shown in Figure 1. It is this kind of turn that is so sharp that it allows the driver of an overlong truck to be able to look back and check the lug nuts on the rear wheels.
On a few occasions, I have been able to actually witness the attempt of our full-time guards as they try to keep a truck somewhat close to the roadway. The below photo shows that the guardrail was barely able to keep the trailer from going completely over the hillside. The truck was stuck, causing the road to be closed for hours till help could arrive (Figure 2, below).
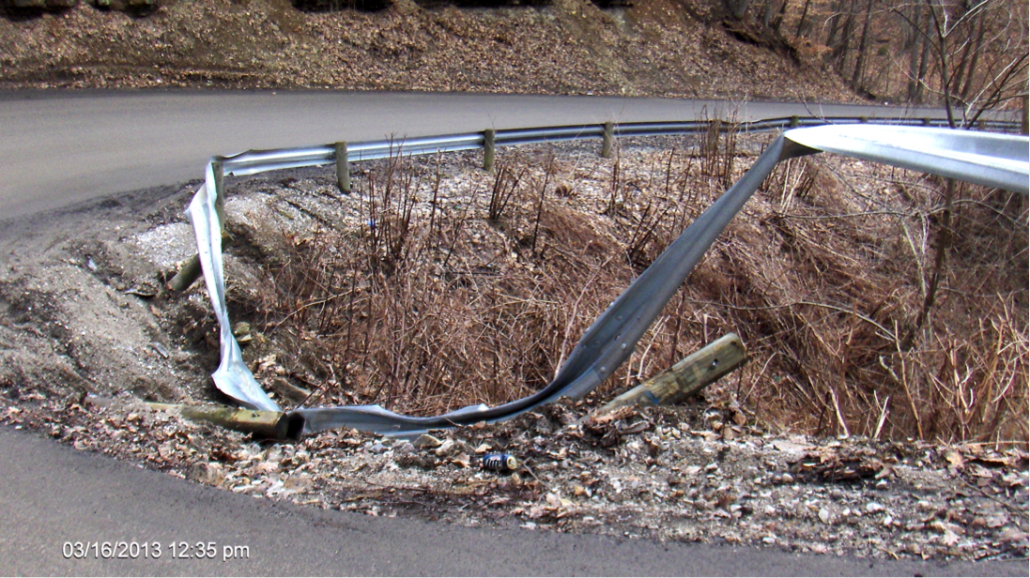
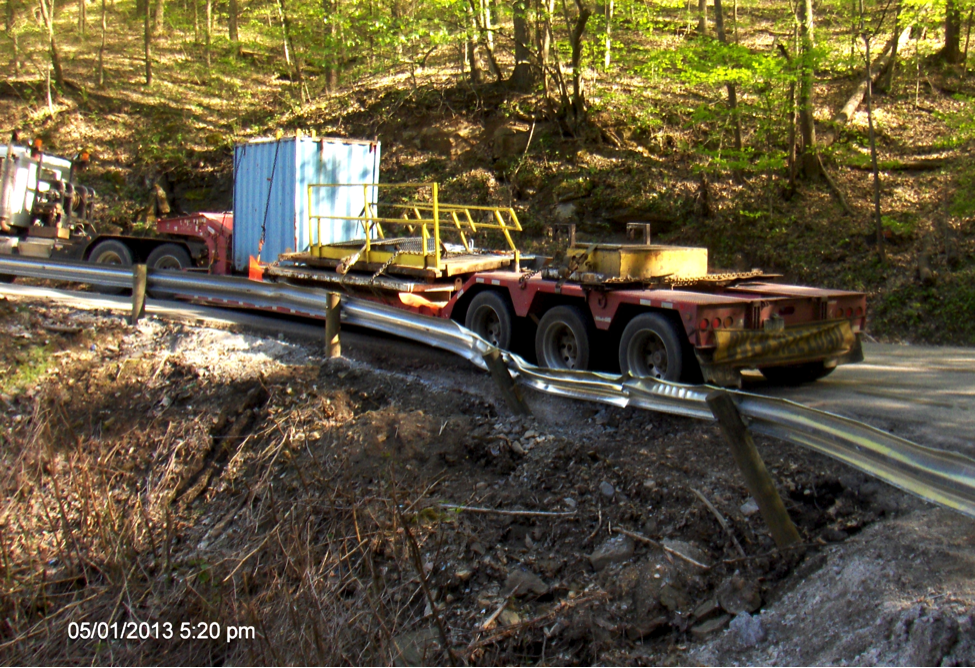
When that incident was over, the photo below from a few weeks later, on March 16, 2013, shows the final damaged rail (Figure 3). The guardrail and posts were replaced and were largely intact when the rail was pushed over again in May of 2013 by another oversized truck trying to get up the hill and around the turn (Figure 4). Ongoing impacts with the guardrail eventually rendered it useless. Figure 5 below is a photo taken in August of 2013.
Infrastructure Damage & Costs
When the Marcellus shale gas drilling began here in Wetzel County eight years ago, it quickly became apparent that the rapidly expanding Chesapeake Energy drilling footprint in north central Wetzel County was leaving scars in the neighborhood, particularly on the roadways. The most visible damages were the road signs, guardrails, and pavement. These effects resulted in a three-layer, road bonding program implemented by the West Virginia Department of Highways. The stipulation requires that any of the large natural gas drillers or operators must post a $1-million bond to cover them statewide, or a single highway district bond for $250,000. This bonding only applies to secondary roads. The third option is to post a bond for fixed, limited miles along specific roads. Some of the pipeline contractors who might be working in a smaller area will use the latter option. Since the DOH generally knows which companies are using the roads, the department usually knows who to approach to pay for damage. In a few cases the companies have reported the damage to the Highway department, and at other times the truckers’ insurance companies report an accident or insurance claim. .
During a recent conversation with a WV-DOH representative, I was told that he quite frequently gets good cooperation from the gas industry companies in paying for damages. He said this is true even when a number of different companies and dozens of their subcontractors are using the same road.
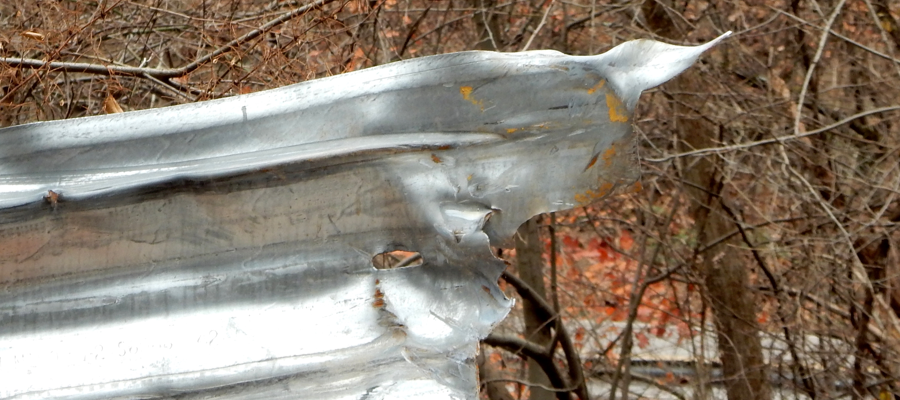
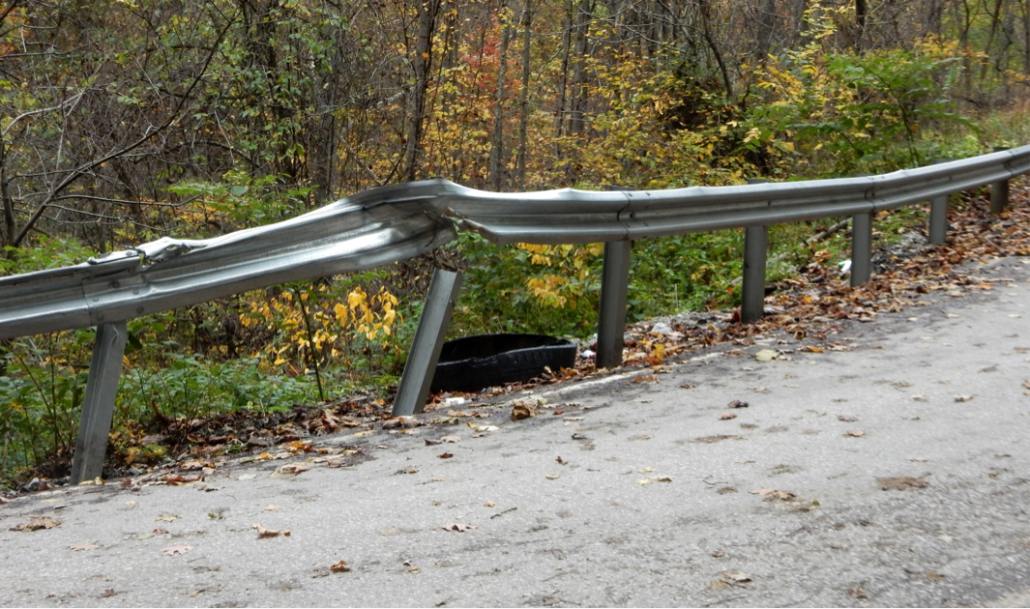
Usually the guardrails just need to be fixed or replaced and new posts installed. Sometimes it is not critical that it be done immediately. However, at times the repairs should be done now. A good example of when repairs are needed soon is shown below in Figure 7, right. This remnant is the shredded, mangled, twisted remains of the stubborn effort of the steel to stop a truck.
The rail has now been totally sliced open, making it an extraordinary danger to the traveling public. As we enter the winter season with a bit of snow and ice on this steep road above this section, any of my neighbors could slide into this. I am optimistic that it will be replaced soon and have had several conversations with the WV-DOH to speed up the process.
https://www.fractracker.org/a5ej20sjfwe/wp-content/uploads/2014/12/Guardrail-Feature.png400900FracTracker Alliancehttps://www.fractracker.org/a5ej20sjfwe/wp-content/uploads/2025/09/2025-Wordmark-Logo.pngFracTracker Alliance2014-12-15 14:55:032020-07-21 10:34:09Where have all the guardrails gone?
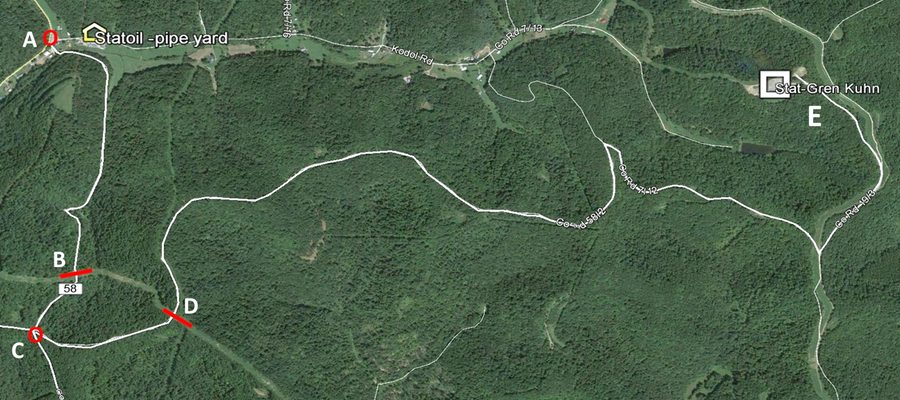
Recently, I was observing how Statoil was managing their gas well traffic, how well it was moving, and whether local residential traffic was being significantly delayed.
Figure 1. Road map referred to throughout text
In Wetzel County, WV, gas trucks travel 4.5 miles from a Statoil pipe yard (Fig 1. Location A) in Uniontown to the Statoil Kuhn well pad (E). This trip can take at least 15 minutes for each truck. Rockford is also doing pipeline work along this route (B and D).
The roadway Statoil is using, even though it is small gravel lane, is a public route. Routine well pad traffic was moving between the pad and pipe yard. When I attempted to travel out to the well pad, I noticed some issues around the pipeline crossing. A large truck was blocking the road and all traffic was stopped. At 3:59 pm, a large dump truck hauling drill cuttings left the well pad coming towards the pipeline. Statoil personnel radioed the flagger at the pipe yard to stop traffic there.
The dump truck was stopped at the pipeline crossing, point D at 4:09 pm, where the road was blocked. It was not until 4:34 pm that traffic was finally able to proceed. This section of road was closed for 35 minutes, as was the lower road at the pipe yard.
For the past few days, Statoil has been stopping all traffic as soon as any truck leaves the well pad, whether the pipeliners have the road blocked or not.
Associated Issues
There are three serious factors that significantly hamper traffic flow along this route:
Statoil’s Kugh Well Pad
Statoil has flagger-radio personnel stationed at the pipe yard and at the pad, but not at the top of the hill (C) about a mile from the pipe yard. As a result, there was no way to allow any local traffic to come up the hill even when they intend to continue heading west or southeast. With a flagger-radio at the top of the hill, local traffic could be up the hill and long gone before any large trucks got to there. (Note: After a few weeks a traffic person was then stationed at the top of the hill).
Not all Statoil subcontractors trucks are equipped with CB radios, so it is impossible to track their progress or location on this road.
Rockford and Statoil do not use any common radio band. They do not appear to communicate with each other even though they are working along this same truck route.
This traffic block incident luckily did not include emergency vehicle traffic. If there had been any accident on or near the well pad or the pipeline right of way, no one would have been able to get through. It would seem that it is in the best interest of the companies and their employees to make sure the road is clear, all the time. When I discussed this with the tool pusher* on the well pad, he agreed. He was also concerned that there was no helicopter landing area nearby in the event of a serious accident. He runs a safe well drilling operation but wanted to be certain that an emergency vehicle could get through.
* A tool pusher is the boss man who runs the whole drilling operation as a subcontractor to the gas operator.
Sometimes we all need to be more patient. Enforcement of environmental regulations against a corporation rarely happens, and environmental enforcement against an oil and gas corporation is truly an amazing rarity. These do not come our way with any degree of frequency. However, here is one where an operator was finally fined – and in West Virginia.
The enforcement and fine in Tyler County, WV is especially amazing since it follows just weeks after the Trans Energy guilty pleas and fines totaling $600,000 for three violations of the Clean Water Act in Marshall County, WV.
On October 5, 2014, Jay-Bee Oil and Gas Company was fined $240,000
for violations at its Lisby Pad in Tyler County, WV.
Now, finally, after about a year and a half of deplorable operating conditions on one of the worse (readily visible) well pads that we have seen in years, some enforcement action has finally happened.
Findings of Fact
Jay-Bee Oil & Gas, Inc. owns and operates natural gas well sites known as Lisby / TI-03, RPT8, RPT5, Coffman, W701, TI213, McIntyre, and Hurley, which are located in West Virginia. Here is the timeline for inspections and complaints related to this site:
March 28, 2014 – Personnel from the Division of Air Quality (DAQ) conducted an inspection at the Lisby / TI-03 Well Pad in response to a citizen odor complaint.
April 1, 2014 – Personnel from the DAQ conducted a follow-up inspection at the Lisby 1 T1-03 Well Pad. Visible emissions were observed from the permanent production storage tanks.
April 17, 2014 – Personnel from the DAQ conducted a follow-up inspection at the Lisby 1 TI-03 well pad in response to additional citizen odor complaints
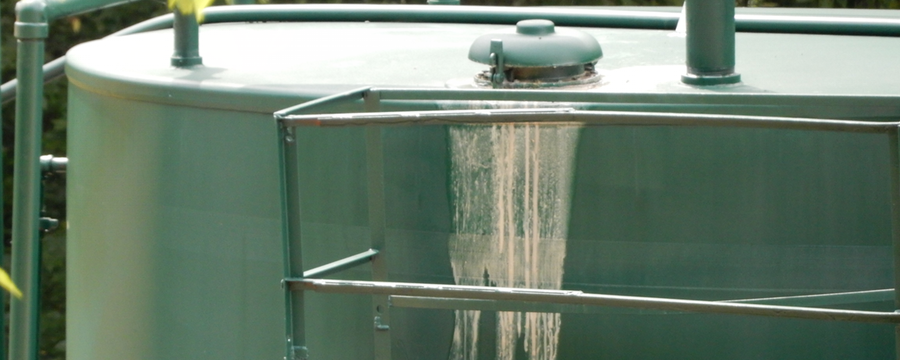
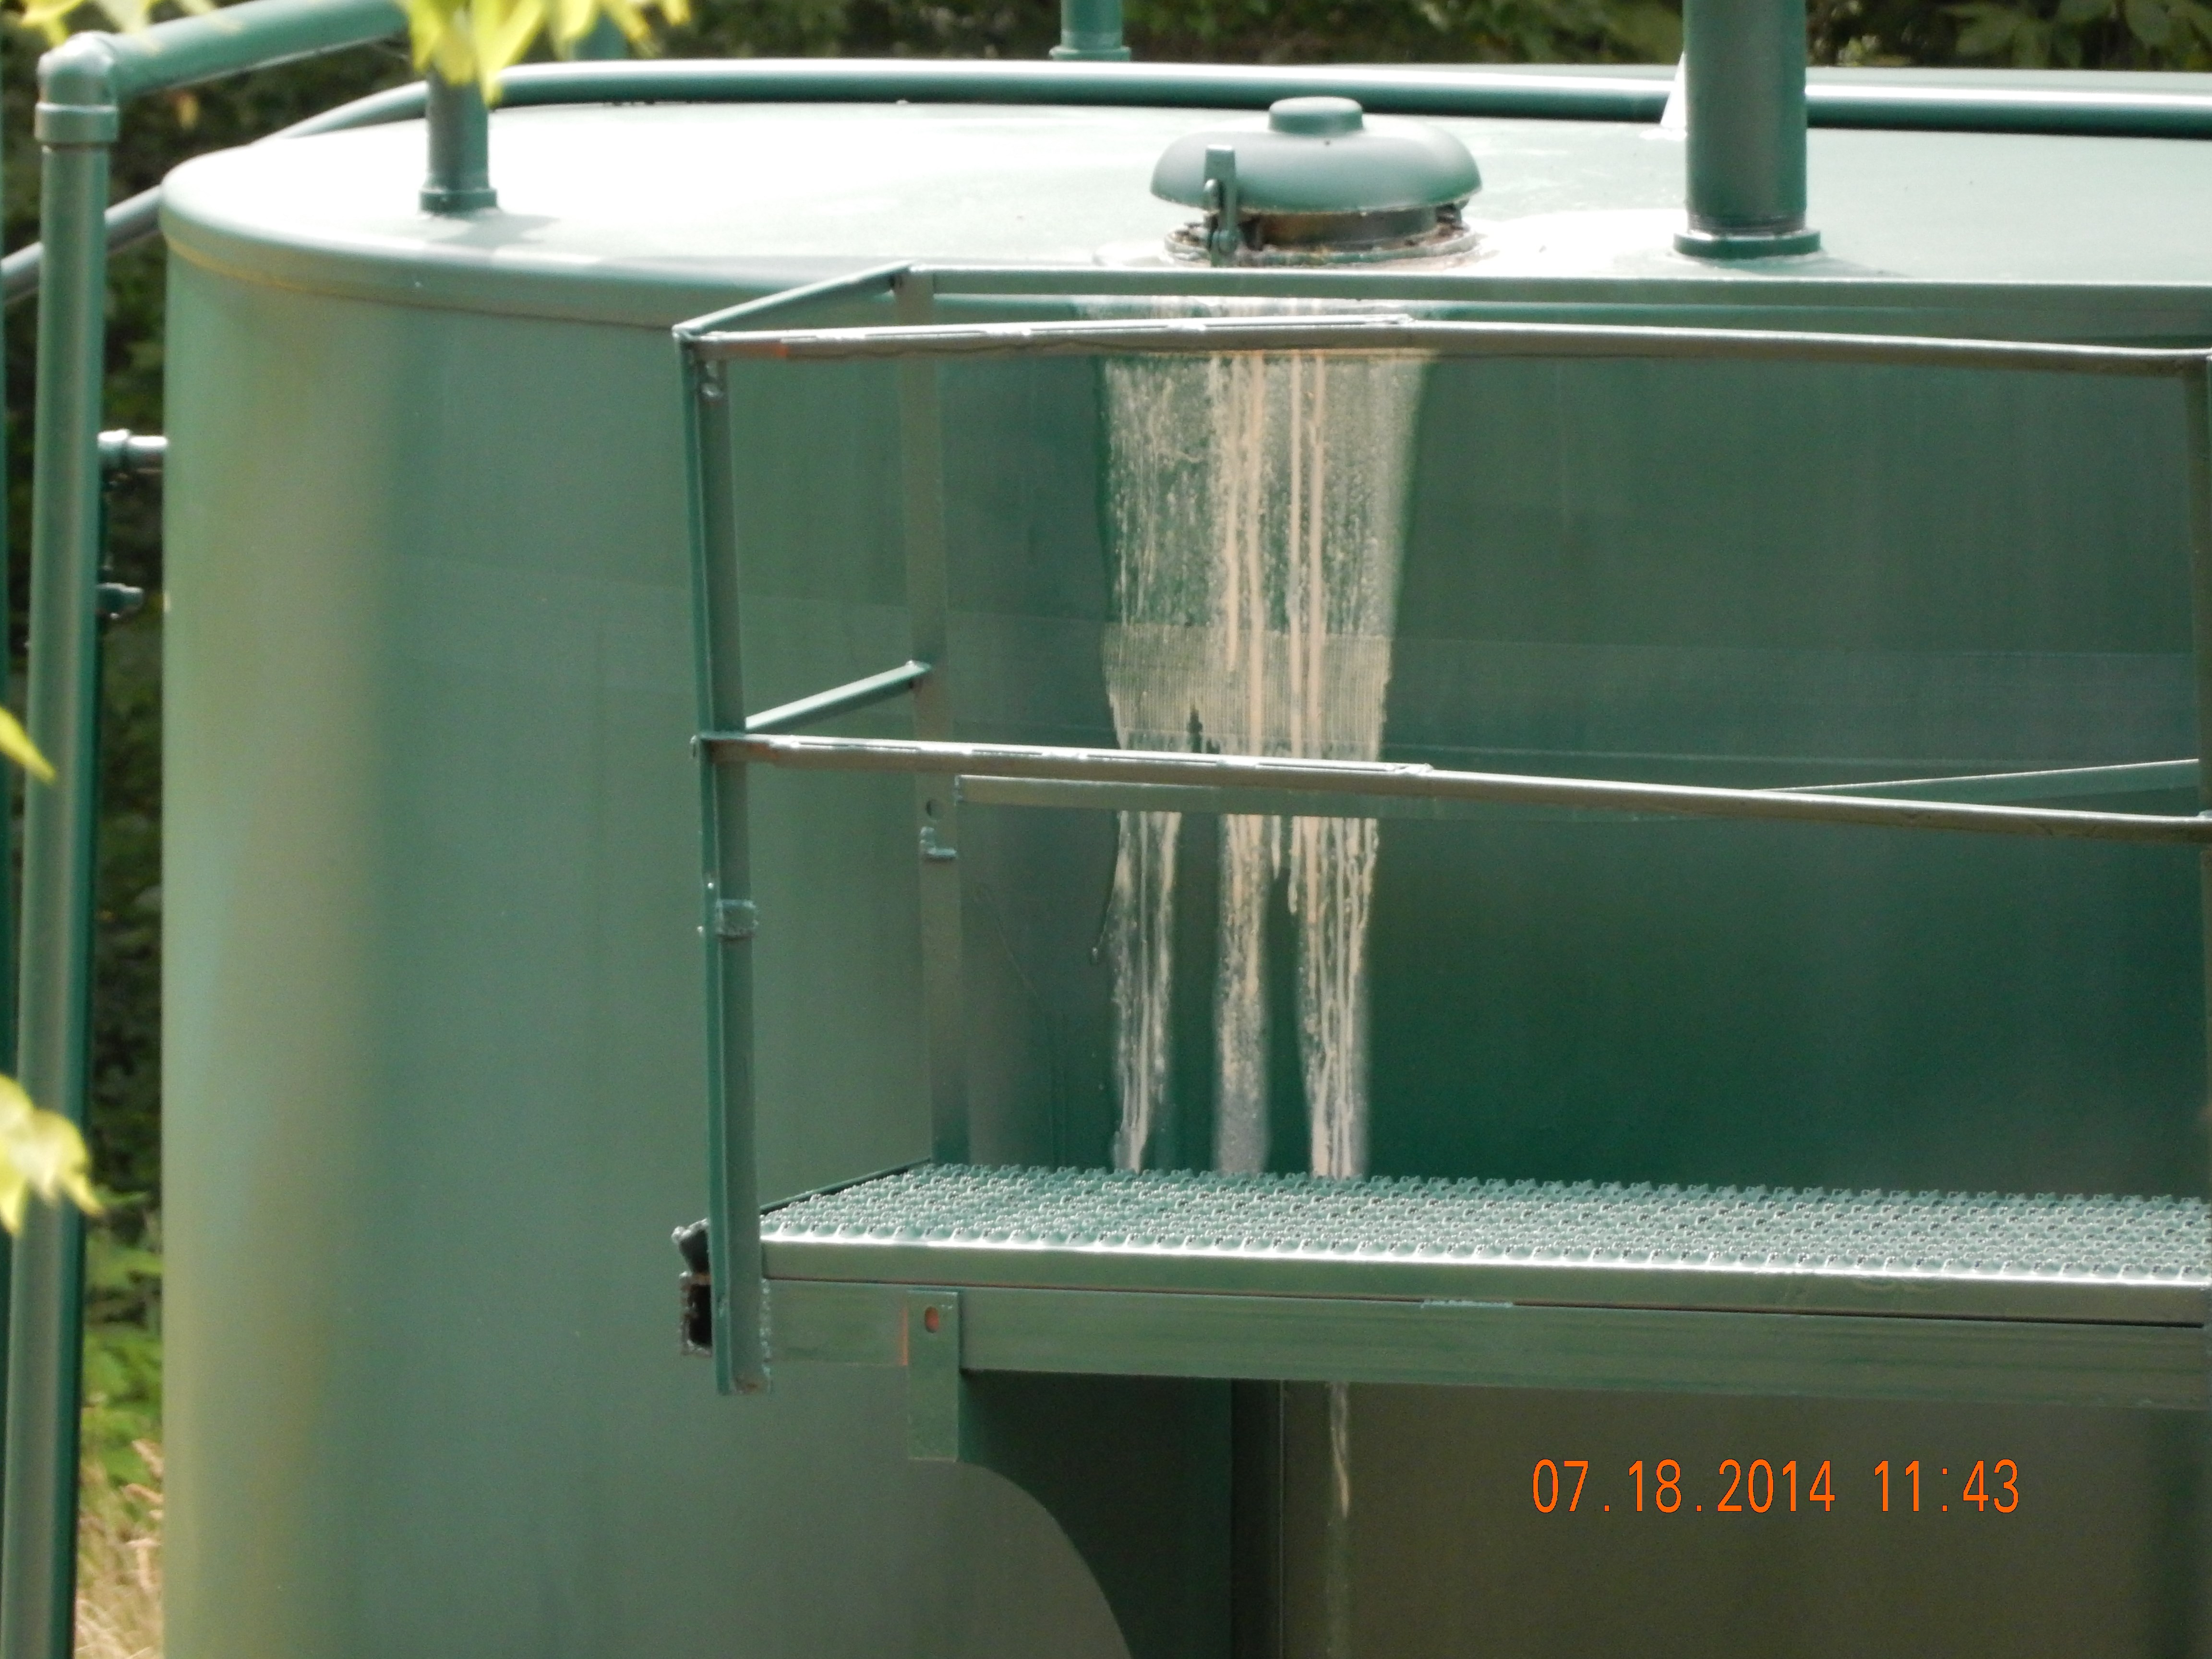
July 18, 2014 – In response to a citizen complaint, personnel from the DAQ conducted an inspection at the Lisby 1 T1-03 Well Pad. Objectionable odors and visible emissions were observed from the thief hatch of one of the permanent production storage tanks. A visible liquid leak was also observed on a pipe located at the tank nearest to the vapor recovery unit.
September 30, 2014 – Jay-Bee Oil and Gas Company agrees to pay a total civil administrative penalty of two hundred forty thousand dollars ($240,000) to resolve the violations described in this Order (PDF).
Of Note
This enforcement action was not done by the WVDEP Office of Oil & Gas, who seem to only politely try to encourage the drillers to somewhat improve their behavior. The WVDEP Department of Air Quality issued this Notice of Violation and enforcement.
Most of this air quality enforcement process started because of the continued, asphyxiating, toxic gas fumes that poured off the Jay-Bee Lisby pad for months. The residents were forced to move away and have not returned due to lack of confidence that it is safe to live in this area yet. These residents join the growing ranks of others, who are now referred to as Marcellus refugees.
Inadequate vapor recovery system lead to residue forming on tank from escaping fumes
Additional Resources
Below are links to some of the newspaper articles on the same mismanaged well pad:
I regularly visit the Jay Bee Lisby pad on Big Run in Tyler County, WV. Given its significant and continuing problems over the past year, and also due to the total absence of any environmental enforcement, it is important to give all those JB well pads extra attention. In fact, I happened upon a few new issues during my recent visits and site inspections on Sept. 11, 2014 and again on Oct. 1st.
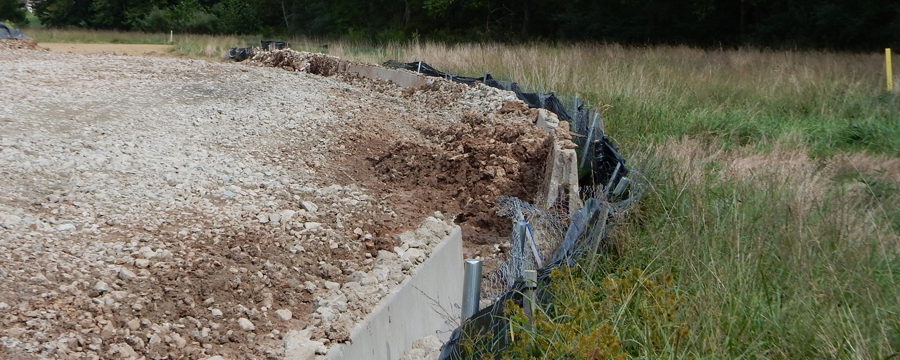
There seems to be an effort by Jay-Bee to literally bury their evidence in a ditch along their poorly constructed well pad. New dirt has recently been put into the low area along the jersey barriers (photo above). It appears that they are trying now to build some type of well pad, whereas most drillers usually build a proper well pad before they drill the wells.
An additional issue is the orange fluid pouring out of the well pad (photos below). While I have conducted my own sampling of this contaminant, regulatory sampling should be conducted soon to find out the nature of this fluid and its source from the Jay Bee Lisby pad.
Orange Liquid Seeping from Lisby Pad
Orange Liquid Close Up
Given the many spills at this pad, this issue is not surprising. However, we still need to find out what this is, as it will not be going away on its own. JB should not be allowed to bury its evidence before they are required to test and reclaim the whole area.
Please keep in mind that the law might allow a driller to force a well pad on a land owner to recover the gas, and to also locate it next to a stream, but it does not give them the right to contaminate and pollute private property – which has been done here numerous times.
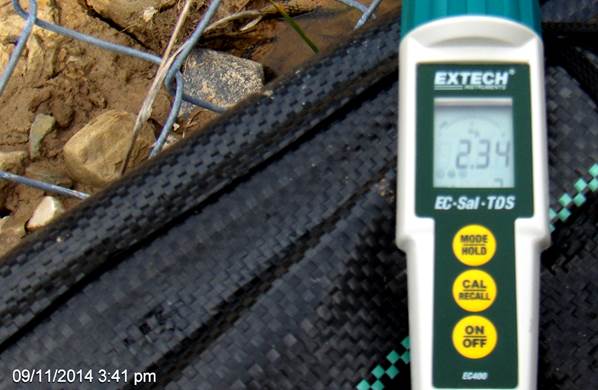
Readings from conductivity meter
When I sampled the fluid from the puddle below the orange stream and tested its conductivity, the meter read ~2.34 millisiemens – or 2340 microsiemens (photo right).
The orange fluid continues to flow under the fence and beyond their limits of disturbance. However, given the wide area covered in sludge after the January explosion, it is hard to say where their limits of disturbance actually stop.
By Bill Hughes, WV Community Liaison, FracTracker Alliance
Read more Field Diary articles here.


