Pittsburgh, Pennsylvania – Jan. 29 – FracTracker Alliance has released a detailed environmental impact assessment (EIA), including digital maps, of the Falcon Ethane Pipeline being built to feed Shell Appalachia’s ethylene cracker plant in Beaver County, PA.
FracTracker’s Falcon Public EIA Project offers a rich series of interactive maps and articles detailing the Falcon’s proposed route through PA, WV, and OH, likely impacts to waterways, potential blast zones, ecological footprint, proximity to hazardous industrial areas, and more.
Given the issues associated with Mariner East 2 – a PA-based natural gas liquids pipeline whose history has been fraught with citations, public scrutiny is a crucial facet of pipeline construction. The Falcon Public EIA Project represents the first time that public stakeholders have been given such a significant amount of time and detail to investigate a proposed pipeline, including access to specific location information. Public comments are being accepted by the PA Department of Environmental Protection on the Falcon’s permit until February 20th.
“Companies are generally not required to publicly disclose GIS data when applying for permits,” remarked Kirk Jalbert, project lead and Manager of Community Based Research and Engagement at FracTracker. “While concerned citizens can stitch together paper maps provided by companies in their applications, that process can be complex and very labor intensive.”
Early access to what is being proposed for the Falcon pipeline will enable nearby communities to better understand how its construction and the associated ethane cracker facility, which will produce 1 million tons of ethylene annually for making plastics, will affect their lives. Upon analyzing the data, FracTracker uncovered a number of particularly noteworthy statistics, for example:
There are 97.5 miles of pipeline proposed to be built through 22 townships in 3 states.
2,000 properties have been surveyed; 765 easements executed.
Falcon will intersect 319 streams and 174 wetlands, with hundreds more proximate to work areas.
550 family residences, 20 businesses, 240 groundwater wells, 12 public parks, 5 schools, 6 daycare centers, and 16 emergency response centers are within potential risk areas.
“Extreme levels of risk and injustice are commonplace in petrochemical pipeline siting, as well as in where their contents come from and how they get used. This project provides context for the importance of reducing these impacts, both for curtailing environmentally unfriendly plastics as well as for moving away from fossil fuel dependencies,” said Brook Lenker, Executive Director of FracTracker.
The Falcon Public EIA Project is meant to expand public dialogue about what should be included in EIAs and how they should apply to petrochemical pipelines. The project also serves as a model for how regulatory agencies can be more transparent with data when engaging the public. This is especially important in the case of the Falcon pipeline, which will be exempt from Federal Energy Regulatory Commission (FERC) scrutiny and, therefore, not be subject to a full environmental impact assessment.
https://www.fractracker.org/a5ej20sjfwe/wp-content/uploads/2018/01/Falcon-Public-EIA-Project-Feature-1.jpg400900FracTracker Alliancehttps://www.fractracker.org/a5ej20sjfwe/wp-content/uploads/2025/09/2025-Wordmark-Logo.pngFracTracker Alliance2018-01-29 07:45:292021-04-15 15:01:56Wingspan of the Falcon Pipeline
In this segment of the Falcon Public EIA Project, we first focus on the route of the pipeline and prior routes that were considered. We take a closer look at the properties along the route that required easement agreements from landowners. Finally, we locate facilities that will be built as part of the project, such as metering stations and shut-off valves, as well as the pipeline’s construction areas and access roads.
Quick Falcon Facts
97.5 miles of proposed pipeline (an additional 200+ miles surveyed during the process)
2,000 parcels of land surveyed; 765 easements executed; 469 will be needed to execute the route
1,273 acres required for construction space; 650 acres for the permanent right-of-way
Map of Falcon pipeline routes, properties, and facilities
The following map will serve as our guide in breaking down these first components. Expand the map full-screen to explore its contents in greater depth. Some layers only become visible at closer zoom levels. Click the “details” tab in full-screen mode to read how the different layers were created.
Pipeline operators must consider a variety of factors when searching for a viable right of way (ROW) for their project—the continuous stretch of land needed to construct, maintain, and operate the pipeline. This process begins with reviewing data and maps made available by federal, state, and local agencies in order to identify features that would complicate the project. These might include such things as protected wetlands, drinking water sources, abandoned mines, or heavily populated areas.
A second step is to conduct manual field surveys along their planned route. During this stage, engineers do precise measurements to determine how the pipeline will cross individual properties as well as locate site-specific concerns that need to be accounted for, such as the presence of endangered species or archeological sites. FracTracker previously produced a guide to pipeline surveying, which can be found here.
The process of finding a viable pipeline route can undergo dozens of revisions and take months or years to complete. The example image seen below, taken from our interactive map at the top of the page, shows a few of the many different 50ft. ROWs considered by Shell. These were documented every few months as the data changed.
A section of the Falcon route with prior routes considered
The most recent route is highlighted in red, totaling 97.5 miles (Shell’s original press releases stated 94 miles). Segments that represent alternative routes considered in certain places are shown in blue (these earlier divergences total 19 miles). Other areas surveyed at some point in the process are shown in dotted purple (totaling 91.3 miles). Given that the route has changed very little in recent months, as well as the fact that Shell has submitted their permit applications for project, we believe that the route in red is likely the route proposed to regulatory agencies.
Note that, in the interactive map, there is an additional “Air Liquide” pipeline (this is the name of a gas products company) proposed by Shell that will run from the ethane cracker south for about .5 miles. Based on comments made by Shell at public hearings, we assume this will be a nitrogen pipeline feeding the plant from an unknown source.
Acquiring Easements
Perhaps the most significant factor that can determine a pipeline route is finding landowners amenable to having their land surveyed and, ultimately, willing to sign easements to allow the pipeline on their property. In some instances, pipeline companies can be granted eminent domain as a “public utility” to take land by force (ME2). However, Shell has stated publicly that eminent domain in not an option for Falcon, due to the fact that the pipeline services a private facility. FracTracker previously produced a guide for landowners who might be approached by pipeline operators seeking to survey their properties.
The Falcon pipeline will have a permanent ROW of 50ft that will cross 10 municipalities in Pennsylvania, 12 townships in Ohio, as well as northern Hancock County, West Virginia. More than 2,000 individual parcels of land were surveyed across this region. Of those 2,000, Shell approached landowners for 765 unique parcels at some point in the process to obtain easements, either for the pipeline ROW itself or for access roads.
To date, Shell has executed 572 easements. Of these, 469 will be needed to execute the current proposed route. However, as of this time, 14 parcels along the proposed route are still listed as “landowner contacted,” meaning that the easement has not yet been executed. The image below is a page from Shell’s permit applications to the PA DEP listing properties pending in Pennsylvania.
Pending PA easements from Shell’s permit applications
Media sources have reported on some of the details of Shell’s Pipeline easement agreements. In some instances, contracts stated a transactional price of $10 per linear foot as a “placeholder” to get the process started. In other cases, Shell has paid landowners as much as $75 per linear foot of pipeline. These agreements also state that Shell reserved the right to “lay, construct, test, maintain, inspect, operate, repair, renew, relocate, replace, substitute, change the size of, upgrade, alter, mark, protect and remove or abandon in place” any pipelines on the property. Below is an example of how our interactive map represents these parcels and their status. For instance, executed easements are in green and pending or stalled agreements in yellow.
Parcels along the Falcon route and their easement status
Valves & Metering Stations
Pipelines require a number of facilities to properly manage the flow and pressure of gas from one end of the line to another. For instance, metering stations are installed to measure how much gas is in the pipeline system at given points. Falcon has five “pads” where metering stations will be located. Three of these are co-located at the origin points of the pipeline (the MarkWest separator facilities) and a fourth at the ethane cracker end-point. However, the fifth meter stations will be located where the two legs of the pipeline meet in northeast Raccoon Township, Beaver County, PA. This site is called the “Junction” meter pad.
Shut-off valves will also placed along the route—18 in all for Falcon—in order to section off lengths of the pipeline that can be turned off as needed. These valves will be located at fairly regular intervals of 8-10 miles in most places, but are also found just before and after sensitive locations, such as the Oho River crossing and areas and where the lines juncture.
The Risks of Proximity
Metering stations and shut-off valves bring particular risks. For instance, when valves are closed at a section of pipeline for maintenance, or in the event of an emergency, excess gasses must vented to relieve pressure. This is one reason why communities have become concerned about the location of these facilities, such as with a Mariner East 2 pipeline valve in West Goshen Township, PA. Similarly, the Falcon pipelines’ valve in New Somerset, OH, is especially close to residential areas, seen below.
A proposed Falcon shut-off valve site in New Somerset, Ohio
Workspaces & Access Roads
Finally, pipeline operators must identify in their permit applications the “workspace” needed for construction. Shell’s temporary ROW for workspace is approximately 100ft in most stretches along the Falcon’s route, similar to what is shown in the image below. Site-specific conditions, such as road, railroad crossings, and buildings make the workspace narrower in some instances, but much larger workspaces will be needed around sites like metering stations and shut-off valves.
A typical pipeline workspace; this one from the Mariner East 2
The locations of access roads must also be identified in permit applications. Access roads come in two categories and typically require a 25ft ROW. Temporary access roads are used during the construction process and often utilize existing private driveways, farm roads, or are built after clearing land acquired in the easement process. Permanent roads allow long-term access to facilities, such as valves and pumping stations, as well as for bringing in equipment to maintain the pipeline’s ROW. Shell’s plan proposes 111 temporary access roads (28 miles) and 21 permanent access roads (2.3 miles).
Shell’s permit applications state that the total disturbed workspace needed for construction and access roads is approximately 1,273 acres. About half of this will remain cleared for the permanent right-of-way and permanent access roads.
A Closer Look
When a pipeline project is subject to regulatory review, alternative routes are typically offered up by the operator for consideration in weighing different costs and benefits. Major reroutes typically deviate from the proposed route for significant distances in order to avoid significant impediments such as large cities or protected lands. Minor alternatives are shorter in length and used to avoid specific areas of concern, such as a protected wetland. An alternative route might also be selected in order to utilize an existing ROW from other pipelines.
Ohio River Crossing
As noted, there are a number of places along the Falcon route where we see examples of major route changes. Many of these reroutes appear to be due to landowners along the preferred path not signing easements for one reason or another. One of the more significant change occurred at the location where the Falcon crosses the Ohio River in Hancock County, West Virginia, seen below. For many months, Shell’s maps showed a planned crossing south of the current proposed route, but later took a dramatic diversion to the north, apparently due to an easement not having been executed for a single property. What is notable about the new route is that it utilizes property owned by the popular Mountaineer Casino, Racetrack, and Resort.
The current and former Falcon route crossing the Ohio River
Fort Cherry Golf Course Reroute
In another instance, we see a reroute near the Fort Cherry Golf Course in McDonald, Washington County, PA. An earlier route took the Falcon straight through the course, whereas the current proposed route goes further east, disrupting a smaller number of fairways. Notice in the image below that a temporary access road for the pipeline’s construction will also still utilize Fort Cherry Golf Course’s driveway.
The current and former Falcon routes crossing the Ft. Cherry Golf Course
Montour Trail Intersections
Finally, we bring attention to what appears to be some of the few remaining properties with easements not yet settled in order to begin construction. As noted in the excerpt from Shell’s permit application at the top of this page, a number of parcels owned by the Montour Trail Council have a status of: “in negotiation and depended on submitted crossing permit applications,” presumably meaning they would agree to the easement if PA DEP approved Shell’s permits.
Falcon intersections with the Montour Trail
The Montour Trail is a 46-mile long multi-use non-motorized recreational rail-trail located in Washington and Allegheny County, PA, used by more than 400,000 people annually. It also makes up part of the Great Allegheny Passage (GAP), a trail system that stretches over 335 miles from Pittsburgh to Washington, DC. The trail is managed by the nonprofit Montour Trail Council with support from state agencies such as the Pennsylvania Department of Conservation and Natural Resources (DCNR).
We were surprised to find that the Montour Trail will be crossed by the Falcon in 9 locations: 5 by the pipeline itself, 3 by temporary access roads, and 1 by a permanent access road, as illustrated in the image above. Two of the pipeline intersections will be executed using HDD boring. The trail and its intersection with the Falcon can be seen by activating these layers on FracTracker’s interactive map, as illustrated in the image above.
In this final section of the Falcon Public EIA Project, we explore the Falcon pipeline’s entanglements with a region already impacted by a long history of energy development. Featured in this article are where the Falcon pipeline intersects underground mining facilities, strip mines, other hazardous pipelines, active oil and gas wells, as well as a very large compressor station. We utilize this information to locate spaces where cumulative development also has the potential for compounded risk.
Quick Falcon Facts
20 miles of the Falcon run through under-mined areas; 5.6 miles through active mines
18 miles of the Falcon run through surface-mined areas; also coal slurry waste site
Shares a right-of-way with Mariner West pipeline for 4 miles in Beaver County
11 well pads, as well as a compressor station, are within the potential impact radius
Map of Falcon relative to mined areas and other energy-related development
The following map will serve as our guide in breaking down where the Falcon intersects areas that have experienced other forms of energy development. Expand the map full-screen to explore its contents in greater depth. Some layers only become visible as you zoom in. A number of additional features of the map are not shown by default, but can be turned on in the “layers” tab. These include information on geological features, water tables, soil erosion characteristics, as well as drinking reservoir boundaries. Click the “details” tab in full-screen mode to read how the different layers were created.
The Falcon pipeline intersects a surprising number of active and inactive/abandoned mine lands. While the location of active mines is fairly easy to obtain from mine operators, finding data on abandoned mines is notoriously difficult. State agencies, such as the Pennsylvania Department of Environmental Protection (DEP), have digitized many legacy maps, but these resources are known to be incomplete and inaccurate in many locations.
AECOM’s engineers used data layers on active and abandoned mine lands maintained by state agencies in OH, WV, and PA. FracTracker obtained this data, as well, as shown on the interactive map. Shell states in their permits that AECOM’s engineers also went through a process of obtaining and digitizing paper maps in areas with questionable mine maps.
Shell states that their analysis shows that 16.8 miles of the Falcon pipeline travel through under-mined areas. Our analysis using the same dataset suggests the figure is closer to 20 miles. Of these 20 miles of pipeline:
5.6 miles run through active coal mines and are located in Cadiz Township, OH (Harrison Mining Co. Nelms Mine); Ross Township, OH (Rosebud Mining Co. Deep Mine 10); and in Greene Township, PA (Rosebud Mining Co. Beaver Valley Mine).
More than 18 miles run through areas that have been historically surface-mined (some overlapping under-mined areas).
Of those 18 miles, 1.5 miles run through an active surface mine located in Cadiz Township, OH, managed by Oxford Mining Company.
Beaver Valley Mine
The Beaver Valley Mine in Greene Township, PA, appeared to be of particular importance in Shell’s analysis. Of the three active mines, Shell maintained an active data layer with the mine’s underground cell map for reference in selecting routes, seen in the image below. Note how the current route changed since the map was originally digitized, indicating that a shift was made to accommodate areas around the mine. The FracTracker interactive map shows the mine based on PA DEP data, which is not as precise as the mine map AECOM obtained from Rosebud Mining.
Digitized map of Beaver Valley Mine
Rosebud Mining idled its Beaver Valley Mine in 2016 due to declining demand for coal. However, Rosebud appears to be expanding its workforce at other mines in the area due to changing economic and political circumstances. We don’t know exactly why this particular mine was highlighted in Shell’s analysis, or why the route shifted, as it is not directly addressed in Shell’s permit applications. Possibilities include needing to plan around areas that are known to be unfit for the pipeline, but also perhaps areas that may be mined in the future if the Beaver Valley Mine were to restart operations.
Coal Slurry Site, Imperial PA
As discussed in other segments of the Falcon Public EIA Project, Shell intends to execute 19 horizontal directional drilling (HDD) operations at different sites along the pipeline. A cluster of these are located in Allegheny and Washington counties, PA, with extensive historical surface mining operations. A 2003 DEP report commented on this region, stating:
All of the coal has been underground mined. Most of the coal ribs and stumps (remnants from the abandoned underground mine) have been surface mined… The extensive deep mining, which took place from the 1920’s through the 1950’s, has had a severe effect on groundwater and surface water in this watershed.
Shell’s applications note that AECOM did geotechnical survey work in this and other surface-mined areas co-located with proposed HDD operations, concluding that the ”majority of rock encountered was shale, sandstone, limestone, and claystone.” However, at one proposed HDD (called “HOU-06”) the Falcon will cross a coal waste site identified in the permits as “Imperial Land Coal Slurry” along with a large Palustrine Emergent (PEM) wetland along Potato Garden Run, seen below.
A Falcon HDD crossing under a wetland and coal slurry site
Foreign Pipelines
In addition to its entanglements with legacy coal mining, the Falcon will be built in a region heavily traveled by oil and gas pipelines. More than 260 “foreign pipelines” carrying oil, natural gas, and natural gas liquids, were identified by AECOM engineers when selecting the Falcon’s right-of-way (note that not all of these are directly crossed by the Falcon).
Owners of these pipelines run the gamut, including companies such as Williams, MarkWest, Columbia, Kinder Morgan, Energy Transfer Partners, Momentum, Peoples Gas, Chesapeake, and Range Resources. Their purposes are also varied. Some are gathering lines that move oil and gas from well pads, others are midstream lines connecting things like compressor stations to processing plants, others still are distribution lines that eventually bring gas to homes and businesses. FracTracker took note of these numbers and their significance, but did not have the capacity to document all of them for our interactive map.
Shared Rights-of-Way
However, we did include one pipeline, the Mariner West, because of its importance in the Falcon’s construction plans. Mariner West was built in 2011-2013 as part of an expanding network of pipelines initially owned by Sunoco Pipeline but now operated by Energy Transfer Partners. The 10-inch pipeline transports 50,000 barrels of ethane per day from the Separator plant in Houston, PA, to processing facilities in Canada. Another spur in this network is the controversial Mariner East 2.
Mariner West is pertinent to the Falcon because the two pipelines will share the same right-of-way through a 4-mile stretch of Beaver County, PA, as shown below.
The Falcon and Mariner West sharing a right-of-way
Reuse of existing rights-of-way is generally considered advantageous by pipeline operators and regulatory agencies. The logistics of sharing pipelines can be complicated, however. As noted in Shell’s permit applications:
Construction coordination will be essential on the project due to the numerous parties involved and the close proximity to other utilities. Accurate line location was completed; however, verification will also be key, along with obtaining proper crossing design techniques from the foreign utilities. A meeting with all of pipeline companies will be held to make sure that all of the restrictions are understood prior to starting construction, and that they are documented on the construction alignment sheets/bid documents for the contractor(s). This will save a potential delay in the project. It will also make working around the existing pipelines safe.
Shell’s attention to coordinating with other utility companies is no doubt important, as is their recognition of working near existing pipelines as a safety issue. There are elevated risks with co-located pipelines when they come into operation. This was seen in a major pipeline accident in Salem Township, PA, in 2016. One natural gas line exploded, destroying nearby homes, and damaged three adjacent pipelines that took more than a year to come back online. These findings raise the question of whether or not Class Location and High Consequence Area assessments for the Falcon should factor for the exponential risks of sharing a right-of-way with Mariner West.
Oil & Gas Extraction
The remaining features included on our map relate to oil and gas extraction activities. The Falcon will carry ethane from the three cryogenic separator plants at the pipeline’s source points. But the wet, fracked gas that supplies those plants also comes from someplace, and these are the many thousands of unconventional gas wells spread across the Marcellus and Utica shale.
We found 11 unconventional oil and gas pads, hosting a combined 48 well heads, within the Falcon’s 940-foot PIR. We also found a large compressor station operated by Range Resources, located in Robinson Township, PA. This is shown below, along with a nearby gas pad.
A well pad and compressor station in Falcon’s PIR
We noted these well pads and the compressor station because Class Location and HCA risk analysis may account for proximity to occupied businesses and homes, but does not always consider a pipeline’s proximity to other high-risk industrial sites. Nevertheless, serious incidents have occurred at well pads and processing facilities that could implicate nearby hazardous liquid pipelines. By the same measure, an accident with the Falcon could implicate one of these facilities, given they are all within the Falcon’s blast zone.
FracTracker began monitoring Falcon’s construction plans in December 2016, when we discovered a significant cache of publicly visible GIS data related to the pipeline. At that time, FracTracker was looking at ways to get involved in the public discussion about Shell’s ethane cracker and felt we could contribute our expertise with mapping pipelines. Below we describe the methods we used to access and worked with this project’s data.
Finding the Data
Finding GIS data for pipeline projects is notoriously difficult but, as most research goes these days, we started with a simple Google search to see what was out there, using basic keywords, such as “Falcon” (the name of the pipeline), “ethane” (the substance being transported), “pipeline” (the topic under discussion), and “ArcGIS” (a commonly used mapping software).
In addition to news stories on the pipeline’s development, Google returned search results that included links to GIS data that included “Shell” and “Falcon” in their names. The data was located in folders labeled “HOUGEO,” presumably the project code name, as seen in the screenshot below. All of these links were accessed via Google and did not require a password or any other authentication to view their contents.
Shell’s data on the Falcon remained publicly available at this link up to the time of the Falcon Public EIA Project‘s release. However, this data is now password protected by AECOM.
Google search results related to Falcon pipeline data
Viewing the Data
The HOUGEO folder is part of a larger database maintained by AECOM, an engineering firm presumably contracted to prepare the Falcon pipeline construction plan. Data on a few other projects were also visible, such as maps of the Honolulu highway system and a sewer works in Greenville, NC. While these projects were not of interest to us, our assessment is that this publicly accessible server is used to share GIS projects with entities outside the company.
Within the HOUGEO folder is a set of 28 ArcGIS map folders, under which are hundreds of different GIS data layers pertaining to the Falcon pipeline. These maps could all be opened simply by clicking on the “ArcGIS Online map viewer” link at the top of each page. Alternatively, one can click on the “View in: Google Earth” link to view the data in Google Earth or click on the “View in: ArcMap” link to view the data in the desktop version of the ArcGIS software application. No passwords or credentials are required to access any of these folders or files.
As seen in the screenshot below, the maps were organized topically, roughly corresponding to the various components that would need to be addressed in an EIA. The “Pipeline” folder showed the route of the Falcon, its pumping stations, and work areas. “Environmental” contained data on things like water crossings and species of concern. “ClassLocations” maps the locations of building structures in proximity to the Falcon.
The HOUGEO GIS folders organized by topic
Archiving the Data
After viewing the Falcon GIS files and assessing them for relevancy, FracTracker went about archiving the data we felt was most useful for our assessing the project. The HOUGEO maps are hosted on a web server meant for viewing GIS maps and their data, either on ArcOnline, Google Earth, or ArcMap. The GIS data could not be edited in these formats. However, viewing the data allowed us to manually recreate most of the data.
For lines (e.g. the pipeline route and access roads), points (e.g. shutoff valves and shut-off valves), and certain polygons (e.g. areas of landslide risk and construction workspaces), we archived the data by manually recreating new maps. Using ArcGIS Desktop software, we created a new blank layer and manually inputted the relevant data points from the Falcon maps. This new layer was then saved locally so we could do more analysis and make our own independent maps incorporating the Falcon data. In some cases, we also archived layers by manually extracting data from data tables underlying the map features. These tables are made visible on the HOUGEO maps simply by clicking the “data table” link provided with each map layer.
Other layers were archived using screen captures of the data tables visible in the HOEGEO ArcOnline maps. For instance, the table below shows which parcels along the route had executed easements. We filtered the table in ArcGIS Online to only show the parcel ID, survey status, and easement status. Screen captures of these tables were saved as PDFs on our desktop, then converted to text using optical character recognition (OCR), and the data brought into Microsoft Excel. We then recreated the map layer by matching the parcel IDs in our newly archived spreadsheet to parcel IDs obtained from property GIS shapefiles that FracTracker purchased from county deeds offices.
Transparency & Caveats
FracTracker strives to maintain transparency in all of its work so the public understands how we obtain, analyze, and map data. A good deal of the data found in the HOUGEO folders are available through other sources, such as the U.S. Geological Survey, the Department of Transportation, and the U.S. Census, as well as numerous state and county level agencies. When possible, we opted to go to these original sources in order to minimize our reliance on the HOUGEO data. We also felt it was important to ensure that the data we used was as accurate and up-to-date as possible.
For instance, instead of manually retracing all the boundaries for properties with executed easements for the Falcon’s right-of-way, we simply purchased parcel shapefiles from county deeds and records offices and manually identified properties of interest. To read more on how each data layer was made, open any of our Falcon maps in full-screen mode and click the “Details” tab in the top left corner of the page.
Finally, some caveats. While we attempted to be as accurate as possible in our methods, there are aspects of our maps where a line, point, or polygon may deviate slightly in shape or location from the HOUGEO maps. This is the inherent downside of having to manually recreate GIS data. In other cases, we spent many hours correcting errors found in the HOUGEO datasets (such as incorrect parcel IDs) in order to get different datasets to properly match up.
FracTracker also obtained copies of Shell’s permit applications in January by conducting a file review at the PA DEP offices. While these applications — consisting of thousands of pages — only pertain to the areas in Pennsylvania where the Falcon will be built, we were surprised by the accuracy of our analysis when compared with these documents. However, it is important to note that the maps and analysis presented in the Falcon Public EIA Project should be viewed with potential errors in mind.
A review of WV and OH drilling activity and its proximity to schools and medical facilities
Schools and hospitals represent places where vulnerable populations may be put at risk if they are located close to oil and gas activity. Piggybacking on some elegant work from PennEnvironment (2013) and Physicians, Scientists, and Engineers (PSE) Healthy Energy (PDF) in Pennsylvania, below is an in-depth look at the proximity of unconventional oil and gas (O&G) activity to schools and hospitals in Ohio and West Virginia.
Ohio Schools and Medical Facilities
In Ohio, presently there are 13 schools or medical facilities within a half-mile of a Utica and/or Class II injection well and an additional 344 within 2 miles (Table 1 and map below). This number increases to 1,221 schools or medical facilities when you consider those within four miles of O&G related activity.
Map of OH Drilling and Disposal Activity Near Schools, Medical Facilities
Table 1. Number of OH schools and hospitals within certain distances from Utica wells
Utica
Class II Injection
Well Distance (Miles)
Schools
Medical Facilities
Schools
Medical Facilities
0.5
3
1
9
0
0.5-1
19 (22)
9 (10)
16 (25)
13 (13)
1-2
79 (101)
41 (51)
88 (113)
79 (92)
2-3
84 (185)
49 (100)
165 (278)
122 (214)
3-4
85 (270)
79 (179)
168 (446)
112 (326)
4-5
92 (362)
63 (242)
196 (642)
166 (492)
5-10
388 (750)
338 (580)
796 (1,438)
584 (1,076)
Ohio’s rate of Utica lateral permitting has jumped from an average of 39 per month all-time to 66 per month in the last year. OH’s drilling activity has also begun to spread to outlying counties[1]. As such, we thought a proactive analysis should include a broader geographic area, which is why we quantified the number of schools and medical facilities within 5 and 10 miles of Utica and Class II activity (Figures 1 and 2). To this end we found that ≥50% of Ohio’s schools, both public and private, are within 10 miles of this industry. Similarly 50% of the state’s medical facilities are within 10 miles of Utica permits or Class II wells.
Footnote 1: Eleven counties in Ohio are currently home to >10 Utica permits, while 23 are home to at least 1 Utica permit.
Figures 1, 2a, 2b (above). Click to expand.
Grade Level Comparisons
With respect to grade level, the majority of the schools in question are elementary schools, with 40-50 elementary schools within 2-5 miles of Ohio Utica wells. This number spikes to 216 elementary schools within ten miles of Utica permits along with an additional 153 middle or high Schools (Figure 3). Naturally, public schools constitute most of the aforementioned schools; there are approximately 75 within five miles of Utica permits and 284 within ten miles of Utica activity (Figure 4).
Figures 3 and 4 (above). Click to expand.
Public Schools in Ohio
We also found that ~4% of Ohio’s public school students attend a school within 2 miles of the state’s Utica and/or Class II Injection wells (i.e., 76,955 students) (Table 2). An additional 315,362 students or 16% of the total public school student population, live within five miles of O&G activity.
Table 2. Number of students in OH’s public schools within certain distances from Utica and Class II Injection wells
Utica
Class II Injection
Well Distance (Miles)
# Schools
# Students
Avg
# Schools
# Students
Avg
0.5
3
1,360
453
7
3,312
473
<1
21
7,910
377
19
7,984
420
<2
96
35,390
376
90
41,565
462
<3
169
67,713
401
215
104,752
487
<4
241
97,448
404
350
176,067
503
<5
317
137,911
435
505
254,406
504
<10
600
280,330
467
1,126
569,343
506
(Note: Ohio’s population currently stands at 11.59 million people; 2,007,667 total students).
The broadest extent of our study indicates that 42% of Ohio students attend school within ten miles of a Utica or Class II Injection well (Figure 5). As the Ohio Utica region expands from the original 11 county core to include upwards of 23-25 counties, we expect these 5-10 mile zones to be more indicative of the type of student-Utica Shale interaction we can expect to see in the near future.
Photos of drilling activity near schools, and Figure 5 (above). Click to expand.
Private Schools in Ohio
At the present time, less than one percent of Ohio’s private school students attend a school within 2 miles of Utica and/or Class II Injection wells (specifically, 208 students). An additional 11,873 students or 11% of the total student population live within five miles. When you broaden the extent, 26% of Ohio’s private primary and secondary school students attend school daily within ten miles of a Utica or Class II Injection well. Additionally, the average size of schools in the immediate vicinity of Utica production and waste activity ranges between 11 and 21 students, while those within 2-10 miles is 112-159 students. Explore Table 3 for more details.
Table 3. Number of students in Ohio’s private schools within certain distances from Utica and Class II Injection.
Utica
Class II Injection
Distance from Well (Miles)
# Schools
# Students
Avg
# Schools
# Students
Avg
0.5
.
.
.
1
.
.
<1
.
.
.
2
25
13
<2
2
22
11
9
186
21
<3
7
874
125
30
4,460
149
<4
12
1,912
159
45
6,303
140
<5
21
2,471
118
61
9,610
158
<10
60
6,727
112
135
20,836
154
West Virginia Schools and Students
Twenty-eight percent (81,979) of West Virginia’s primary and secondary school students travel to a school every day that is within two miles of the state’s Marcellus and/or Class II Injection wells.
Compared with Ohio, 5,024 more WV students live near this industry (Table 4). An additional 97,114 students, or 34% of the West Virginia student population, live within 5 miles of O&G related wells. The broadest extent of our study indicates that more than 90% of West Virginia students attend school daily within 10 miles of a Marcellus and/or Class II Injection well.
Figure 6. West Virginia primary and secondary schools, Marcellus Shale wells, and Class II Injection wells (Note: Schools that have not reported enrollment figures to the WV Department of Education are highlighted in blue). Click image to expand.
It is worth noting that 248 private schools of 959 total schools do not report attendance to the West Virginia Department of Education, which means there are potentially an additional 69-77,000 students in private/parochial or vocational technology institutions unaccounted for in this analysis (Figure 6). Finally, we were not able to perform an analysis of West Virginia’s medical facility inventory relative to Marcellus activity because the West Virginia Department of Health and Human Resources admittedly did not have an analogous, or remotely complete, list of their facilities. The WV DHHR was only able to provide a list of Medicaid providers and the only list we were able to find was not verifiable and was limited to hospitals only.
Table 4. Number of students in WV schools within certain distances from Shale and Class II Injection wells
Marcellus
Class II Injection
Distance from Well (Miles)
#
Sum
Avg
#
Sum
Avg
0.5
19
5,674
299
1
.
.
<1
52 (71)
16,992 (22,666)
319
5 (6)
1,544
257
<2
169 (240)
52,737 (75,403)
314
16 (22)
5,032 (6,576)
299
<3
133 (373)
36,112 (111,515)
299
18 (40)
6,132 (12,708)
318
<4
88 (461)
25,037 (136,552)
296
21 (61)
5,235 (17,943)
294
<5
56 (517)
15,685 (152,237)
295
26 (87)
8,913 (26,856)
309
<10
118 (635)
37,131 (189,368)
298
228 (315)
69,339 (96,195)
305
Note: West Virginia population currently stands at 1.85 million people; 289,700 total students with 248 private schools of 959 total schools not reporting attendance, which means there are likely an additional 69-77,000 students in Private/Parochial or Vocational Technology institutions unaccounted for in this analysis.
Conclusion
A Trump White House will likely mean an expansion of unconventional oil and gas activity and concomitant changes in fracking waste production, transport, and disposal. As such, it seems likely that more complex and broad issues related to watershed security and/or resilience, as well as related environmental concerns, will be disproportionately forced on Central Appalachian communities throughout Ohio and West Virginia.
Will young and vulnerable populations be monitored, protected, and educated or will a Pruitt-lead EPA pursue more laissez-faire tactics with respect to environmental monitoring? Stay Tuned!
Analysis Methods
The radii we used to conduct this assessment ranged between ≤ 0.5 and 5-10 miles from a Utica or Marcellus lateral. This range is larger than the aforementioned studies. The point of using larger radii was to attempt to determine how many schools and students, as well as medical facilities, may find themselves in a more concentrated shale activity zone due to increased permitting. Another important, related issue is the fact that shale O&G exploration is proving to be more diffuse, with the industry exploring the fringes of the Utica and Marcellus shale plays. An additional difference between our analysis and that of PennEnvironment and PSE Healthy Energy is that we looked at identical radii around each state’s Class II Injection well inventory. We included these wells given the safety concerns regarding:
their role in induced seismicity,
potential water and air quality issues, and
concomitant increases in truck volumes and speeds.
By Ted Auch, Great Lakes Program Coordinator, FracTracker Alliance
https://www.fractracker.org/a5ej20sjfwe/wp-content/uploads/2017/03/WV-Schools-Feature.jpg400900Ted Auch, PhDhttps://www.fractracker.org/a5ej20sjfwe/wp-content/uploads/2025/09/2025-Wordmark-Logo.pngTed Auch, PhD2017-03-13 11:27:562021-04-15 15:03:37How close are schools and hospitals to drilling activity in West Virginia and Ohio?
By Karen Edelstein, Eastern Program Coordinator, FracTracker Alliance
In an apparent move to step around compliance with comprehensive regulations outlined in the Endangered Species Act (ESA), a coalition of nine oil and gas corporations has filed a draft plan entitled the Oil & Gas Coalition Multi-State Habitat Conservation Plan (O&G HCP). The proposed plan, which would relax regulations on five species of bats, is unprecedented in scope in the eastern United States, both temporally and spatially. If approved, it would be in effect for 50 years, and cover oil and gas operations throughout the states of Ohio, Pennsylvania, and West Virginia—covering over 110,000 square miles. The oil and gas companies see the plan as a means of “streamlining” the permit processes associated with oil and gas exploration, production, and maintenance activities. Others outside of industry may wonder whether the requested permit is a broad over-reach of an existing loophole in the ESA.
Habitat fragmentation, air, and noise pollution that comes with oil and gas extraction and fossil fuel delivery activities have the potential to incidentally injure or kill bat species in the three-State plan area that are currently protected by the Endangered Species Act (ESA) of 1973. In essence, the requested “incidental take permit”, or ITP, would acknowledge that these companies would not be held to the same comprehensive regulations that are designed to safeguard the environment, particularly the flora and fauna at most risk to extirpation. Rather, they would simply be asked to insure that their impacts are “minimized and mitigated to the maximum extent practicable.”
Section 10(a)(2)(B) of the ESA contains provisions for issuing an ITP to a non-Federal entity for the take of endangered and threatened species, provided the following criteria are met:
The taking will be incidental
The applicant will, to the maximum extent practicable, minimize and mitigate the impact of such taking
The applicant will develop an HCP and ensure that adequate funding for the plan will be provided
The taking will not appreciably reduce the likelihood of survival and recovery of the species in the wild
The applicant will carry out any other measures that the Secretary may require as being necessary or appropriate for the purposes of the HCP
What activities would be involved?
The Northern Long-eared Bat is a federally-listed threatened species, also included in the ITP
The proposed plan, which would seek to exempt both upstream development activities (oil & gas wells) and midstream development activities (pipelines). Upstream activities include the creation of access roads, staging areas, seismic operations, land clearing, explosives; the development and construction of well fields, including drilling, well pad construction, disposal wells, water impoundments, communication towers; and other operations, including gas flaring and soil disturbance; and decommissioning and reclamation activities, including more land moving and excavation.
Midstream activities include the construction of gathering, transmission, and distribution pipeline, including land grading and stream construction, construction of compressor stations, meter stations, electric substations, storage facilities, and processing plants, and installation of roads, culverts, and ditches, to name just a few.
Companies involved in the proposed “Conservation Plan” represent the major players in fossil fuel extraction, refinement, and delivery in the region, and include:
Antero Resources Corporation
Ascent Resources, LLC
Chesapeake Energy Corporation
EnLink Midstream L.P.
EQT Corporation
MarkWest Energy Partners, L.P., MPLX L.P., and Marathon Petroleum Corporation (all part of same corporate enterprise)
Rice Energy, Inc.
Southwestern Energy Company
The Williams Companies, Inc.
Focal species of the request
Populations of federally-endangered Indiana Bats could be impacted by the proposed Incidental Take Permit (ITP)
The five species listed in the ITP include the Indiana Bat (a federally-listed endangered species) and Northern Long-eared Bat (a federally-listed threatened species), the Eastern Small-footed Bat (a threatened species protected under Pennsylvania’s Game and Wildlife Code), as well as the Little Brown Bat and Tri-colored Bat. Populations of all five species are already under dire threats due to white-nose syndrome, a devastating disease that, since 2008, has killed an estimated 5.7 million bats in North America. In some cases, entire local populations have succumbed to this deadly disease. Because bats already have a naturally low birthrate, bat populations that do survive this epidemic will be slow to rebound. Only recently, wildlife biologists have begun to see hope for a treatment in a beneficial bacterium that may save affected bats. However, production and deployment details of this treatment are still under development. Best summarized in a recent article in the Pittsburgh Post-Gazette:
This [ITP] would be a huge deal because we are dealing with species in a precipitous decline,” said Jared Margolis, an attorney with the Center for Biological Diversity, a national nonprofit conservation organization headquartered in Tucson, Ariz. “I don’t see how it could be biologically defensible. Even without the drilling and energy development we don’t know if these species will survive.
In 2012, Bat Conservation International produced a report for Delaware Riverkeeper, entitled Impacts of Shale Gas Development on Bat Populations in the Northeastern United States. The report focuses on landscape scale impacts that range from water quality threats, to disruption of winter hibernacula, the locations where bats hibernate during the winter, en masse. In addition, because bats have strong site fidelity to roosting trees or groups of trees, forest clearing for pipelines, well pads or other facilities may disproportionately impact local populations.
The below map, developed by FracTracker Alliance, shows the population ranges of all five bat species, as well as the current areas impacted by existing development by the oil and gas industry through well sites, pipelines, and other facilities.
To learn more details about the extensive oil and gas development in each of the impacted states, follow these links:
Oil and gas threat map for Pennsylvania. Currently, there are ~104,000 oil and gas wells, compressors, and other related facilities here.
Oil and gas threat map for Ohio. Currently, there are ~90,000 oil and gas wells, compressors, and other related facilities here.
Oil and gas threat map for West Virginia. Currently, there are ~16,000 oil and gas wells, compressors, and other related facilities here.
Public input options
The U.S. Fish and Wildlife Service (USFWS) announced in the Federal Register in late November 2016 its intent to prepare an environmental impact statement (EIS) and hold five public scoping sessions about the permit, as well as an informational webinar. In keeping with the parameters of an environmental impact statement, USFWS is particularly interested in input and information about:
Aspects of the human environment that warrant examination such as baseline information that could inform the analyses.
Information concerning the range, distribution, population size, and population trends concerning the covered species in the plan area.
Additional biological information concerning the covered species or other federally listed species that occur in the plan area.
Direct, indirect, and/or cumulative impacts that implementation of the proposed action (i.e., covered activities) will have on the covered species or other federally listed species.
Information about measures that can be implemented to avoid, minimize, and mitigate impacts to the covered species.
Other possible alternatives to the proposed action that the Service should consider.
Whether there are connected, similar, or reasonably foreseeable cumulative actions (i.e., current or planned activities) and their potential impacts on covered species or other federally listed species in the plan area.
The presence of archaeological sites, buildings and structures, historic events, sacred and traditional areas, and other historic preservation concerns within the plan area that are required to be considered in project planning by the National Historic Preservation Act.
Any other environmental issues that should be considered with regard to the proposed HCP and potential permit issuance.
The public comment period ends on December 27, 2016. Links to more information about locations of the public hearings, as well as instructions about how to sign up for the December 20, 2016 informational webinar can be found at this website. In addition, you can electronically submit comments about the “conservation plan” by following this link.
https://www.fractracker.org/a5ej20sjfwe/wp-content/uploads/2016/12/Eastern-small-footed-bat-header.jpg4301500Karen Edelsteinhttps://www.fractracker.org/a5ej20sjfwe/wp-content/uploads/2025/09/2025-Wordmark-Logo.pngKaren Edelstein2016-12-12 14:22:072021-04-15 15:04:19“Taking” Wildlife in PA, OH, WV
Cover of Dangerous and Close report. Click to view report
FracTracker Alliance has been working with the Frontier Group and Environment America on a nationwide assessment of “fracked” oil and gas wells. The report is titled Dangerous and Close, Fracking Puts the Nation’s Most Vulnerable People at Risk. The assessment analyzed the locations of fracked wells and identified where the fracking has occurred near locations where sensitive populations are commonly located. These sensitive sites include schools and daycare facilities because they house children, hospitals because the sick are not able to fight off pollution as effectively, and nursing homes where the elderly need and deserve clean environments so that they can be healthy, as well. The analysis used data on fracked wells from regulatory agencies and FracFocus in nine states. Maps of these nine states, as well as a full national map are shown below.
No one deserves to suffer the environmental degradation that can accompany oil and gas development – particularly “fracking” – in their neighborhoods. Fracked oil and gas wells are shown to have contaminated drinking water, degrade air quality, and sicken both aquatic and terrestrial ecosystems. Additionally, everybody responds differently to environmental pollutants, and some people are much more sensitive than others. In fact, certain sects of the population are known to be more sensitive in general, and exposure to pollution is much more dangerous for them. These communities and populations need to be protected from the burdens of industries, such as fracking for oil and gas, that have a negative effect on their environment. Commonly identified sensitive groups or “receptors” include children, the immuno-compromised and ill, and the elderly. These groups are the focus of this new research.
National Map
National interactive map of sensitive receptors near fracked wells
As many of you know, educating the public is a FracTracker Alliance core value – a passion, in fact. In addition to our maps and resources, we help to provide hands-on education, as well. The extraordinary Bill Hughes is a FracTracker partner who has spent decades “in the trenches” in West Virginia documenting fracking, well pad construction, water withdrawals, pipeline construction, accidents, spills, leaks, and various practices of the oil and gas industry. He regularly leads tours for college students, reporters, and other interested parties, showing them first-hand what these sites look, smell, and sound like.
While most of us have heard of fracking, few of us have seen it in action or how it has changed communities. The tours that Bill provides allow students and the like to experience in person what this kind of extraction means for the environment and for the residents who live near it.
Biking to Support FracTracker and Bill Hughes
Dave Weyant at the start of his cross-country Pedal for the Planet bike trip
In the classic spirit of non-profit organizations, we work in partnership with others whenever possible. Right now, as you read this posting, another extraordinary Friend of FracTracker, Dave Weyant (a high school teacher in San Mateo, CA), is finishing his cross-country cycling tour – from Virginia to Oregon in 70 days.
Dave believes strongly in the power of teaching to reach the hearts of students and shape their thinking about complicated issues. As such, he has dedicated his journey to raising money for FracTracker. He set up a GoFundMe campaign in conjunction with his epic adventure, and he will donate whatever he raises toward Bill’s educational tours.
Help us celebrate Dave Weyant’s courage, vision, and generosity – and support Bill Hughes’s tireless efforts to open eyes, evoke awareness, and foster communication about fracking – by visiting Dave’s GoFundMe page and making a donation. Every gift of any size is most welcome and deeply appreciated.
100% of the funds raised from this campaign will go to support Bill’s oil and gas tours in West Virginia. FracTracker Alliance is a registered 501(c)3 organization. Your contribution is tax deductible.
And to those of you who have already donated, thank you very much for your support!
https://www.fractracker.org/a5ej20sjfwe/wp-content/uploads/2016/07/Hughes-Tour-Feature.jpg400900Guest Authorhttps://www.fractracker.org/a5ej20sjfwe/wp-content/uploads/2025/09/2025-Wordmark-Logo.pngGuest Author2016-07-27 10:30:012020-03-11 16:48:40A Cross-Country Ride to Support Oil and Gas Tours in West Virginia
For anyone who even casually follows Marcellus and Utica shale gas exploration and production, such as in the active gas fields of West Virginia or Southwestern PA or Ohio, we know there are many concerns surrounding the natural gas production process. These issues range from air pollution, water consumption and contamination, to waste disposal. We know that, after all well the pad drilling and construction traffic are done, we must also have pipelines to get the gas to compressor stations, processing plants, and to markets in the Eastern United States (and likely Europe and Asia in the near future). Gas companies in Wetzel County, WV, and in neighboring tri-state counties, are convinced that building pipelines – really big pipelines – will be the silver bullet to achieving some semblance of stability and profitability.
Problems With Proposed Pipelines
One of the new, very large diameter (42”) proposed gas pipelines getting attention in the press is the Mountain Valley Pipeline, which will originate in the village of Mobley in eastern Wetzel County, WV and extend Southeast, through national forests and over the Appalachian Mountains into the state of Virginia. Even if the residents of Wetzel County and other natural gas fields are guinea pigs for experiments with hydraulic fracturing, we know how to build pipelines, don’t we? The equipment, knowledge, and skill sets needed for pipeline construction is readily available and commonly understood compared to high pressure horizontal drilling with large volumes of slick water. So, what could go wrong?
I can answer that question first hand from my hayfield in Wetzel County. Almost two years ago, EQT wanted to survey my property for a similar proposed pipeline – this one 30” in diameter, called the Ohio Valley Connector (OVC). The application for this project has now been filed with the Federal Energy Regulatory Commission (FERC). The below map shows a section of the OVC as proposed almost two years ago. The red outlined area is my property. The yellow line shows one proposed pathway of the 30” pipeline that would cross our land. Multiple routes were being explored at first. Were this version approved, it would have gone right through my hayfield and under our stream.
A section of the OVC as proposed almost two years ago. The red outlined area is my property. The yellow line shows one proposed pathway of the 30” pipeline that would cross our land.
Pipeline opponents express concern about habitat fragmentation, the crossing of pristine streams and rivers, erosion and sedimentation issues, spills, gas leaks, and possible explosions. These are all very valid concerns. But the potential for other logistical errors in the building process – from very simple to potentially serious ones – are also worth consideration. In this article I will use my recent personal experience as a detailed and documented example of how a professionally surveyed location on my property contained an error of almost one mile – over 4,000 feet – as part of a pipeline construction planning project. Yes, you read that right.
Part I: How Did We Get To This Point
Before we get to my story, I should review my first contact with EQT on this issue. In February of 2014, an EQT land agent asked me for permission to walk my property for preliminary evaluation of a route that would send their 30” high-pressure pipe through our land, from south to north.
It is important to keep in mind that almost every landowner in Wetzel County has been contacted by mail, phone or in person, by land agents promising cash with a verbal assurance that all will be well. The goal is to get a landowner’s signature on a loosely worded “right of way” (RoW) lease contract, with terms favorable to the gas company, and move on. Unfortunately, pipeline lease offers cannot be ignored. Not objecting or not questioning can sometime leave the landowner with fewer choices later. This is because many of the bigger interstate transmission lines are being proposed as FERC lines. When final approval is granted by FERC, these pipelines will have the legal power of eminent domain, where the property owner is forced to comply. Just filing a FERC application does not grant eminent domain in West Virginia, as it seems to in Virginia, but the potential for eminent domain gives land agents power over landowners.
I was not ready to give them surveying permission (to drive stakes or other permanent markers). Since a natural gas pipeline would affect all my neighbors, however, I agreed to allow a preliminary walk through my property and to hang surveyor ribbons in exchange for answering my questions about the project. For instance, one of my biggest concerns was the potential for significant habitat fragmentation, splitting up the forest and endangering wildlife habitat.
There are many questions residents should consider when approached by land agent. A list of these questions can be found in the appendix below.
I never did get answers to most of my questions in the few e-mail exchanges and phone conversations with EQT. I never saw the surveyors either. They simply came and left their telltale colored ribbons. Later, at a public meeting an EQT representative said the closest they would run the pipe to any residence would be 37.5 feet. That number is correct. I asked twice. They said they had the right to run a pipeline that close to a residence but would do their best not to. The 37.5 feet is just one half of the permanent RoW of 75 feet, which was also only part of a 125 foot RoW requested for construction. A few months later, a very short e-mail said that the final pipeline route had changed and they would not be on my property. For a time we would enjoy some peace and quiet.
A Word On Surveyors
Most folks can relate to the work and responsibility of bookkeepers or Certified Public Accountants (CPAs). They measure and keep track of money. And their balance sheets and ledgers actually have to, well, BALANCE. Think of Surveyors as the CPAs of the land world. When they go up a big hill and down the other side, the keep track of every inch — they will not tolerate losing a few inches here and there. They truly are professionals, measuring and documenting everything with precision. Most of the surveyors I have spoken with are courteous and respectful. They are a credit to their profession. They are aware of the eminent domain threat and their surveying success depends on treating landowners with respect. They are good at what they do. However, as this article will show, their professional success and precision depends on whether or not they are given the correct route to survey.
Part II: Surveyor Stakes and Flags
Over the next year we enjoyed peace and quiet with no more surveyors’ intrusions. However, in my regular travels throughout the natural gas fields here, countless signs of surveyor activity were visible. Even with the temporary slowdown in drilling, the proposed pipeline installations kept these surveyors busy. Assorted types of stakes and ribbons and markings are impossible to miss along our roads. I usually notice many of the newer surveyor’s flags and the normal wooden stakes used to mark out future well pads, access roads, compressor stations, and more recently pipelines. Given that survey markings are never taken down when no longer needed, the old ones sometimes hide the new ones.
It can be difficult keeping track of all of them and hard at first to identify why they are there. Even if sometimes I am not sure what a stake and flag might indicate, when one shows up very unexpectedly in what is essentially my front yard, it is impossible to not see it. That is what happened in August of 2015. Despite being unable to get our hay cut due to excessive rain the previous month, the colored flags were highly visible. Below shows one of the stakes with surveyor’s tape, and the hay driven down where the surveyors had parked their trucks in my field alongside my access road.
A surveyor stake alongside my access road.
To call it trespassing might not be legally defensible yet. The stakes were, after all, near a public roadway – but the pins and stakes and flags were on my property. Incidents like this, whether intentional or accidental, are what have given the natural gas companies a reputation as bad neighbors. There were surveyors’ stakes and flags at two different locations, my hay was driven down, and I had no idea what all this meant given that I had no communication from anyone at EQT in over 18 months. I consider myself fortunate that the surveyors did not stray into wooded areas where trees might have been cut. It’s been known to happen.
Below shows the two sets of wooden stakes, roughly 70-80 feet apart, with flags and capped steel rebar pins. Both stakes were near the road’s gravel lane, which is a public right of way. Nevertheless, the stakes were clearly on my property. The markings on one side of the stake identify the latitude, longitude, and the elevation above sea level of the point. The other side of the stake identified it as locating the OVC pipeline (seen here as “OVC 6C):
These identifying numbers are unique to this pin which is used to denote a specific type of location called a “control point.” Control points are usually located off to the side of the center-line of the pipeline:
A control point, located off to the side of the center-line of the pipeline.
It seemed that somehow, without informing me or asking permission to be on my land, EQT had changed their mind on the OVC route and were again planning to run a pipeline through my property. If this was intentional, both EQT and I had a problem. If this was some kind of mistake, then only EQT would have a problem. Either way I could not fathom how this happened. Trespassing, real or perceived, is always a sensitive topic. This is especially true since, when I had initially allowed the surveyor to be on my property, I had not given permission for surveying. Given concerns about eminent domain, I wanted answers quickly. I documented all this with detailed pictures in preparation for contacting EQT representatives in Pittsburgh, PA, with my complaints.
Part III: What Happened & How?
I think it is safe to say that, in light of my well-known activism in documenting all things Marcellus, I am not your average surface owner. I have over 10,000 photographs of Marcellus operations in Wetzel County and I document every aspect of it. Frequently this leads to contacting many state agencies and gas operators directly about problems. I knew which gas company was responsible and I also knew exactly who in Pittsburgh to contact. To their credit, the person I contacted at EQT, immediately responded and it took most of the day to track down what had happen. The short story was that it was all a simple mistake—a 4,300 foot long mistake—but still just a mistake. The long story follows.
The EQT representative assured me that someone would be out to remove their stakes, flags and the steel pins. I told them that they needed to be prompt and that I would not alter or move their property and locating points. The next day, when I got home, the stakes with flags were gone. Just a small bare patch of dirt remained near the white plastic fencepost I had placed to mark the location. However, since I am a cultivated skeptic—adhering to the old Russian proverb made famous by President Reagan, “Trust but Verify”—I grabbed a garden trowel, dug around a bit, and clink, clink. The steel pin had just been driven deeper to look good, just waiting for my tiller to locate someday. I profusely re-painted the pin, photographed it, and proceeded to send another somewhat harsh e-mail to EQT. The pin was removed the next day.
After all the stakes, ribbons, and steel pins were removed, EQT provided further insights into what had transpired. Multiple pipeline routes were being evaluated by EQT in the area. Gas companies always consider a wide range of constraints to pipeline construction such as road and stream crossings, available access roads, permission and cooperation of the many landowners, steepness of terrain, etc. At a certain point in their evaluation, a final route was chosen. But for unknown reasons the surveyor crew was given the old, now abanoned, route on which to establish their control points. The magnitiude of the error can be seen on the map below. The bright blue line is the original path of the OVC pipeline through my property and the red line shows where the FERC filed pipeline route will go. A new control point has now been established near the highway where the pipeline was meant to cross.
The FERC filed OVC pipeline route vs. the accidentally surveyed route.
Part IV: Lessons To Be Learned
Given the likely impact of many proposed large-diameter, very long, pipelines being planned, it seems useful to examine how these errors can happen. What can we learn from my personal experience with the hundreds of miles of new pipelines constructed in Wetzel County over the past eight years? First, it is important to ask whether or not similar problems are likely to happen elsewhere, or if this was this just an isolated incident. Can we realistically expect better planning on the proposed Mountain Valley Pipeline, which will run for over 300 miles? Can the residents and landowners living along these pipeline RoWs expect more responsible construction and management practices?
In general, many of the pipeline projects with which landowners, such as those in Wetzel County, are familiar with fall into the unregulated, gathering line category. They might be anywhere from six inches in diameter up to sixteen inches. As we review their track record, we have seen every imaginable problem, both during construction and after they were put into operation. We have had gas leaks and condensate spills, hillside mud slips, broken pipes, erosion and sedimentation both during construction and afterwards.
Now for some apparently contradictory assumptions—I am convinced that, for the most part, truck drivers, pipeliners, equipment operators, drilling and fracturing crews, well tenders and service personnel at well sites, all do the best job they can. If they are given the proper tools and materials, accurate directions with trained and experienced supervision, the support resources and the time to do a good job, then they will complete their tasks consistently and proudly. A majority of employees in these positions are dedicated, trained, competent, and hard working. Of course, there are no perfect contractors out there. These guys are human too. And on the midnight shift, we all get tired. In the context of this story, some pipeline contractors are better and more professional than others, some are more experienced, and some have done the larger pipelines. Therefore, despite best intentions, significant errors and accidents will still occur.
The Inherent Contradictions
It seems to me that the fragile link in natural gas production and pipeline projects is simply the weakness of any large organization’s inherent business model. Every organization needs to constantly focus on what I refer to as the “four C’s—Command and Control, then Coordination and Communication—if they are to be at all successful. It is a challenge to manage these on a daily basis even when everyone is in the same big building, working for the same company, speaking the same language. This might be in a university, or a large medical complex, or an industrial manufacturing plant.
But the four C’s are nearly impossible to manage due to the simple fact that the organizational structure of the natural gas industry depends completely on hundreds of sub-contractors. And those companies, in turn, depend on a sprawling and transient, expanding and collapsing, network of hundreds of other diverse and divergent independent contractors. For example, on any given well pad, during the drilling or fracturing process, there might be a few “company” men on site. Those few guys actually work for the gas company in whose name the operating permit is drawn. Everyone else is working for another company, on site temporarily until they are ready to move on, and their loyalty is elsewhere.
In the best of situations, it is next to impossible to get the right piece of information to the right person at just the right time. Effective coordination among company men and contractors is also next to impossible. I have seen this, and listened in, when the drilling company is using one CB radio channel and the nearby pipeline company is using some private business band radio to talk to “their people.” In that case, the pipeline contractors could not talk to the well pad—and it did not matter to them. In other cases, the pilot vehicle drivers will unilaterally decide to use another CB radio channel and not tell everyone. I have also watched while a massive drill rig relocation was significantly delayed simply because a nearby new gas processing plant was simultaneously running at least a hundred dump trucks with gravel on the same narrow roadway. Constant communication is a basic requirement for traffic coordination, but next to impossible to do properly and consistently when these practices are so prevalent.
These examples illustrate how companies are often unable to coordinate their operations. Now, if you can, just try to picture this abysmal lack of command and control, and minimal communication and coordination, in the context of building a 300-mile length of pipeline. The larger the pipeline diameter, and the greater the overall length of the pipeline, the more contractors will be needed. With more contractors and sub-contractors, the more coordination and communication are essential. A FERC permit cannot fix this, nor would having a dozen FERC permits. Unfortunately, I do not envision the four Cs improving anytime soon in the natural gas industry. It seems to be the nature of the beast. If, as I know from personal experience, a major gas company can arrange to locate a surveyed control point 4,300 feet from where it should have been, then good luck with a 300 mile pipeline. Even with well-intentioned, trained employees, massive problems are still sure to come.
The FERC approvals for these pipelines might not be a done deal, but I would not bet against them. So vigilance and preparation will still be of the essence. Citizen groups must be prepared to observe, monitor, and document these projects as they unfold. If massive pipelines like the MVP and OVC are ever built, they should become the most photographed, measured, scrutinized, and documented public works projects since the aqueducts first delivered water to ancient Rome. For the sake of protecting the people and environment of Wetzel County and similar communities, I hope this is the case.
Appendix: Questions to Ask When Approached by a Land Agent (Landsman)
These questions can be modified to suit your location. The abbreviation “Gas Corp.” is used below to reference a typical natural gas company or a pipeline subsidiary to a natural gas company. These subsidiaries are frequently called Midstream Companies. Midstream companies build and manage the pipelines, gas processing, and some compressor stations on behalf of natural gas companies.
Please provide a Plain English translation of your landowner initial contract.
What will Gas Corp. be allowed to do, and not allowed to do, short term and long term?
What will Gas Corp. be required to do, and not required to do?
What is the absolute minimum distance this pipeline will be placed away from any dwelling anywhere along its entire length?
What restrictions will there be on the my land after you put in the pipelines?
Who will be overseeing and enforcing any environmental restrictions (erosion and sedimentation, slips, stream crossings, etc.)?
Who will be responsible for my access road upkeep?
Who will be responsible for long term slips and settlements of surface?
When would this construction begin?
When would all work be completed?
Who would be responsible for long term stability of my land?
Will the pipeline contractor(s) be bound to any of our agreements?
Who are the pipeline contractor(s)?
What will be transported in the pipeline?
Will there be more than one pipe buried?
How wide is the temporary work RoW?
How wide is the permanent RoW?
How deep will the pipeline(s) be buried?
What size pipe will it be; what wall thickness?
How often will the welds on the individual pipe segments be inspected?
Will there be any above ground pipeline components left visible?
Where will the pipe(s) originate and where will they be going to?
What will the average operating pressure be?
What will the absolute maximum pressure ever be?
At this pressure and diameter, what is the PIR—Potential Impact Radius?
Will all pipeline and excavating and laying equipment be brought in clean and totally free from any invasive species?
How will the disturbed soil be reclaimed?
Will all top soil be kept separate and replaced after pipeline is buried?
Also, After all the above is settled, how much will I be paid per linear foot of pipeline?
https://www.fractracker.org/a5ej20sjfwe/wp-content/uploads/2014/12/Pipeline-Feature.png400900FracTracker Alliancehttps://www.fractracker.org/a5ej20sjfwe/wp-content/uploads/2025/09/2025-Wordmark-Logo.pngFracTracker Alliance2016-02-17 10:21:412020-03-12 17:33:44A Push For Pipelines
The following guide is a simplified description of a variety of markings that are used by land surveyors. Throughout an active shale gas field, the first signs of pending expansions are the simple markings of stakes, flags, and pins. Many months or even years before the chain saw fells the first tree or the first dozer blade cuts the dirt at a well pad location, the surveyors have “marked the target” on behalf of their corporate tactical command staff.
The three most commonly used markings are the simple stakes, flags and pins. These surveyor symbols are common to any construction project and guarantee that everything gets put in the right place. In an active gas field, these marking tools are used for all aspects of exploration and production:
access roads to well pads,
widening the traveled portion of the roadway,
well locations,
ponds and impoundment locations,
temporary water pipeline paths,
surface disturbance limits,
compressor stations,
gas processing sites, and
rights-of-way for roads and pipelines.
Quite frequently these simple markings are undecipherable by themselves, especially by non-professionals. One cannot just know what is happening, what is likely to occur, or how concerned one should be. Context and additional information are usually needed. Sometimes the simple colors and combinations of colored tapes might only make sense in conjunction with similar markings nearby. Sometimes public notices in the newspaper and regulatory permits must be used to decipher what is planned.
For an example, the proposed 30″ diameter EQT pipeline called the Ohio Valley Connector seems to be regularly marked using a combination of blue and white (see figure 10 below) surveyors tape to mark the actual pipeline location, then green and white (see figure 4 below) to mark all the proposed access roads along the routes that will be used to get pipe trucks and excavation equipment into the right of way. These access roads might be public roadways or cut across private leased property.
Common surveyor symbols & signs (click on images to zoom in)
Surveyor flags and tape: Sometime the flags or streamers are just attached to trees, fence posts, or put on a stake to make them visible above the weeds. There might be no markings on the stake, or only simple generic markings. This could just mean that this is the correct road and turn here. It could also signal a proposed or approximate location for some future work.
Simple surveyor’s flags or tape
Surveyor flags and tapes: These are a selection of typical surveyor tapes, also called flags or ribbons. Many other specialty color combinations are available to the professional surveyor.
A selection of surveyor tapes
Stakes with simple markings: Flags with some type of identification (it might be names or numbers). This one was used for a proposed well pad access road location. There are no dimensions given on these.
Stake with simple markings
Stakes with simple flags and basic identification: The stakes shown here all indicate an access route to be used for equipment and trucks to get to a proposed pipeline right of way. The “H310″ is the EQT name for the 30” OVC pipeline.
Stakes indicating an access route
Control points: These three stakes are identifying a control point that is outside the limits of disturbance (LoD). These markings surround a pin to be used for reference.
Control point stakes
Controls points: This stake is also identifying a control point location. All control points will have some type of driven metal rod, usually with a plastic cap identifying the surveyor. Frequently there are three stakes with extra flags or tape. They are always set off to the side of the intended work area. They are not to be disturbed.
Control point stake and pin
Control points: Another set of three stakes marking a Control Point location. It is common to see triple stakes with elaborate, multiple flags. Even if only two stakes are present, there always will be a driven steel pin and identifying cap.
Control point stakes and pin
Control points: This shows a close-up of the identifying cap on a metal driven steel pin. Control point locations are not meant to be disturbed as they are for future and repeated reference. They might give the latitude and longitude on the stake plus the altitude above sea level.
Control point pin and cap
Control points: This is another, older control point location. This represents a typical arrangement where the stakes somewhat try to protect the metal pin from a bulldozer blade by warning its operator.
Control point pin protection
Limit of disturbance: The “L O D” here means the limits of disturbance. Beyond this point there should not be any trees cut or dirt moved. The stakes shown here indicates that this is the outside limit of where the contractor will be disturbing the original contour of the surface soil.
Limit of disturbance stakes
Limit of disturbance: The “L O D” means the limits of disturbance of the proposed pipeline right of way. Beyond this point there should not be any trees cut or dirt moved. This could also be used for the outside edge of well pads or access roads or pond locations.
Limit of disturbance ROW stakes
Pipelines: Stakes with flags and “center line” markings are usually for pipelines. Here you see the symbol for center line: a capital letter “C” imposed on the letter “L”.
Pipelines center line
Pipelines: Again you see the capital letter “C” super imposed on top of the letter “L” used frequently for pipe line center lines, but can also be used for proposed access roads.
Pipelines center line
Pipelines: As shown here, “C” and “L” center line flags can also be used for future well pad access roads.
Road access center line
Precise location markings: Stakes like this will usually have a steel pin also associated with it. This stake gives the latitude, longitude, and elevation of the site.
Precise location stake
Permanent property lines: You may also find markings, like this one inch steel rod with an alum cap, that denote permanent property lines and corners of property.
Permanent property rod
Permanent property lines: Another kind of permanent property line or corner marker is the “boundary survey monument.” This is likely an aluminum cap on top of a one inch diameter steel bar.
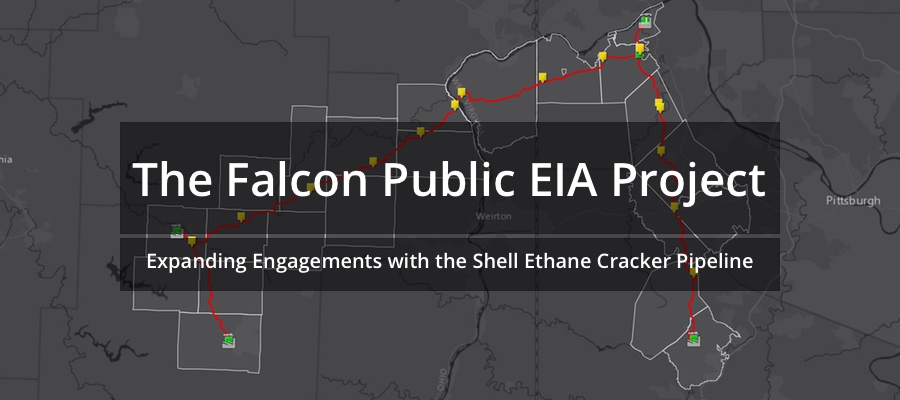
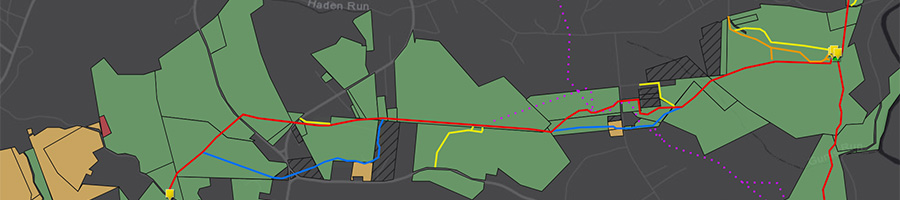


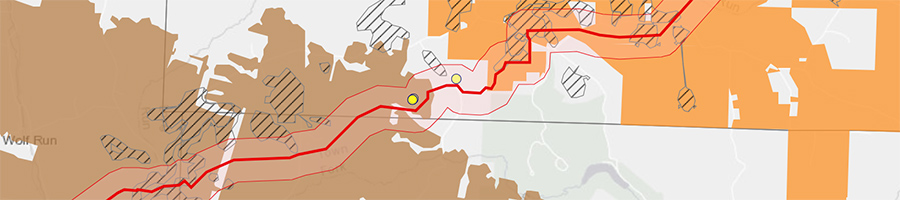


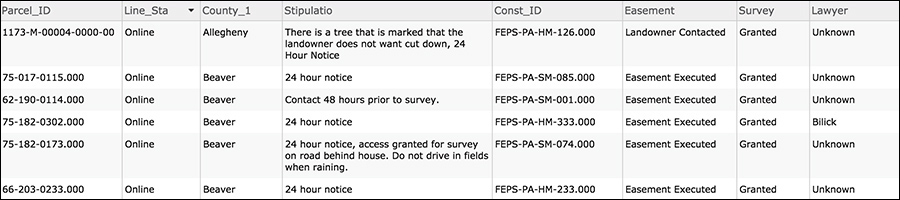


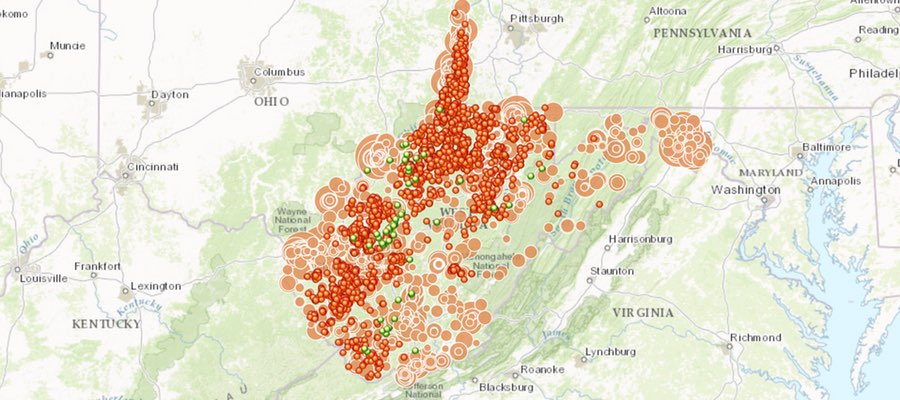

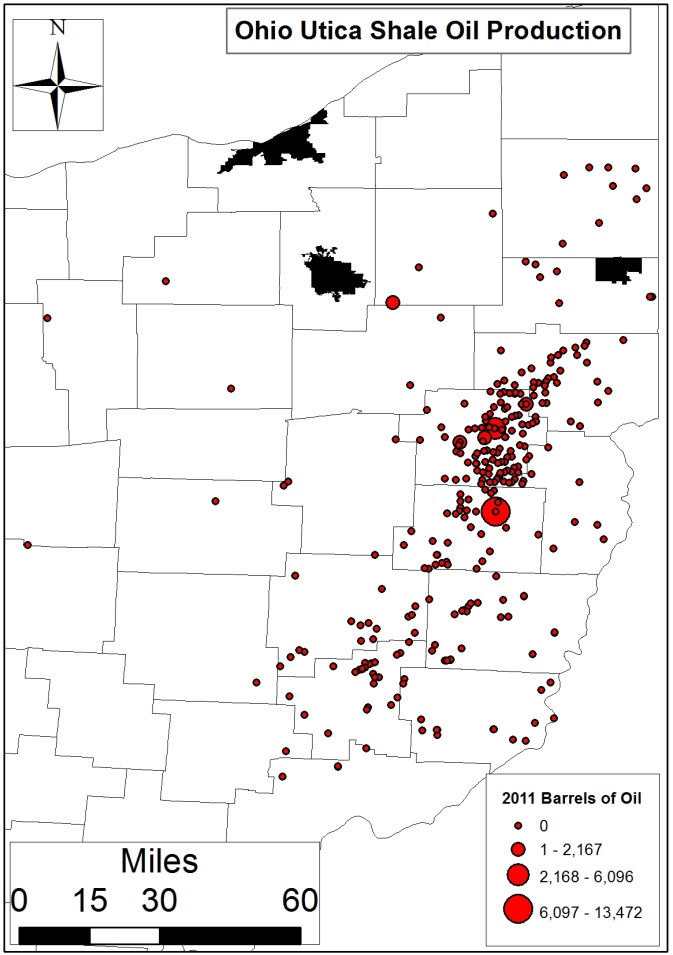
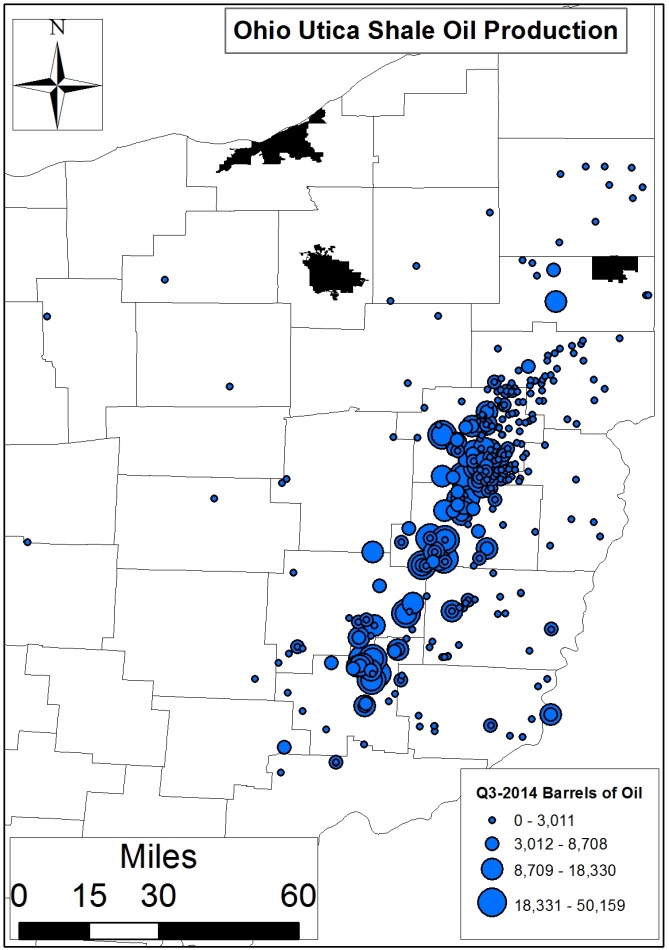
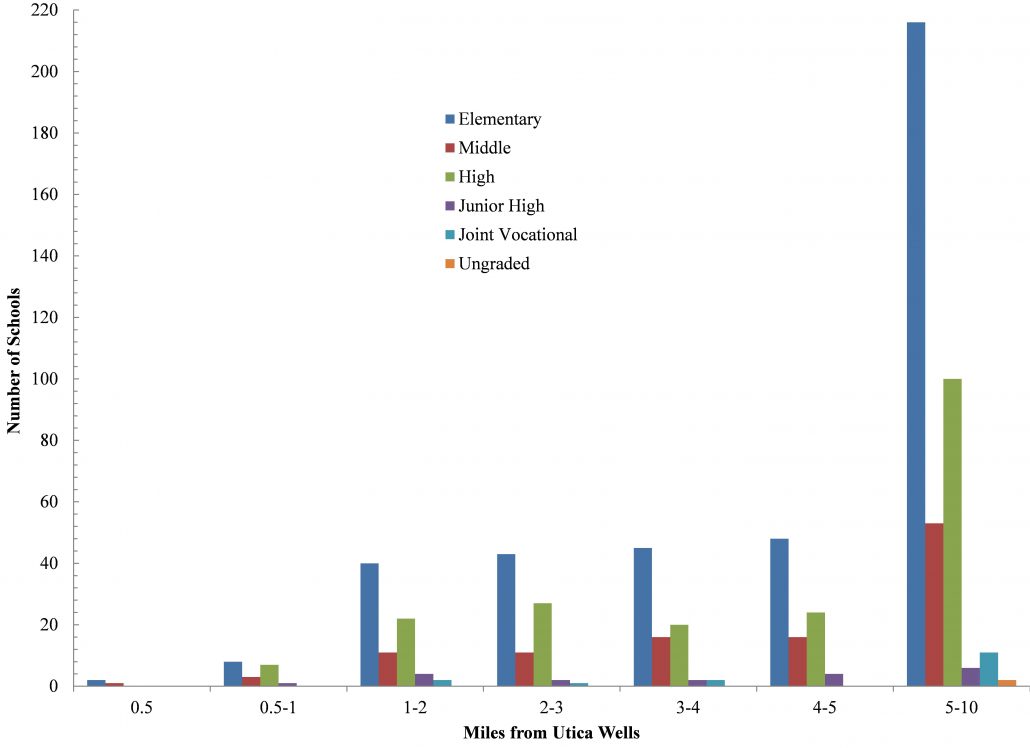
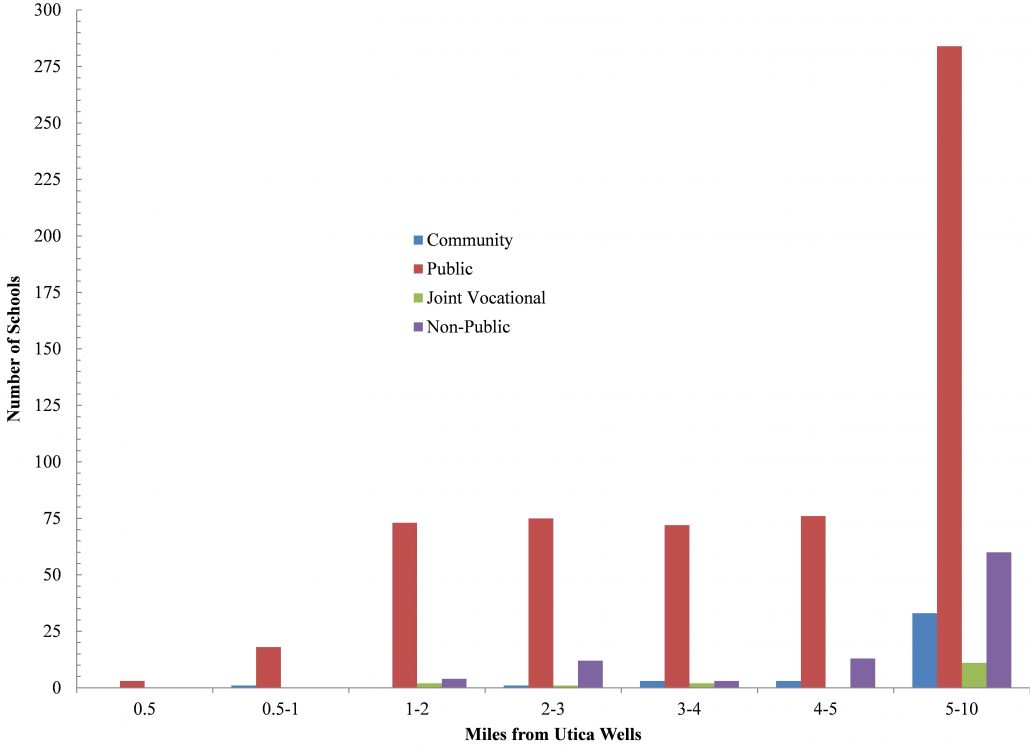
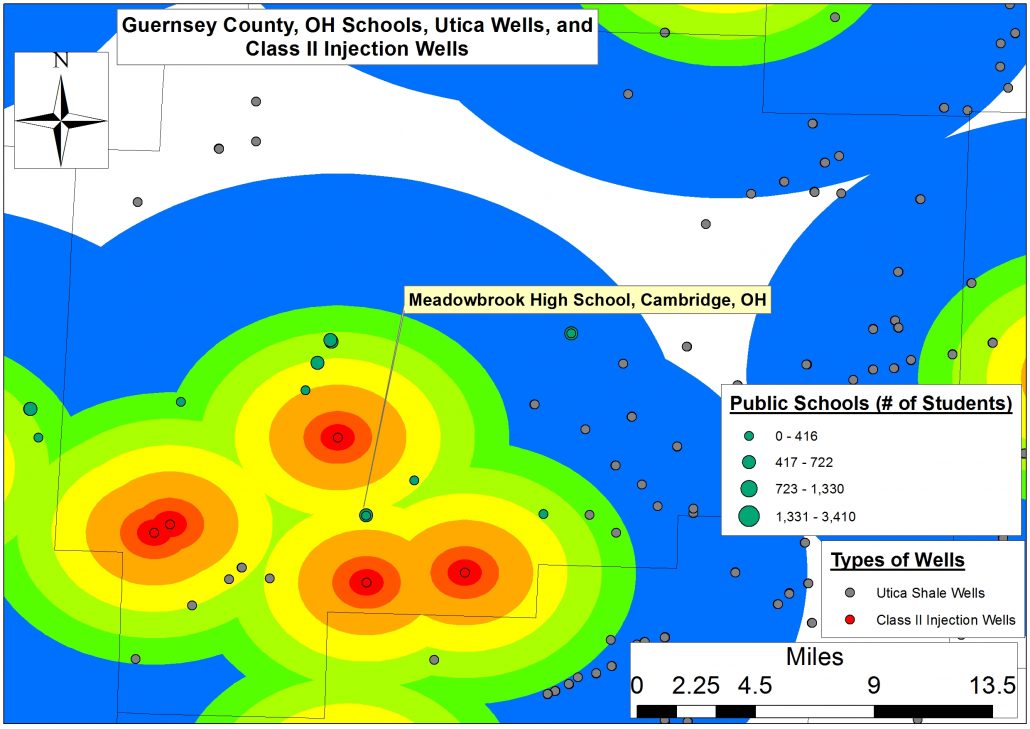
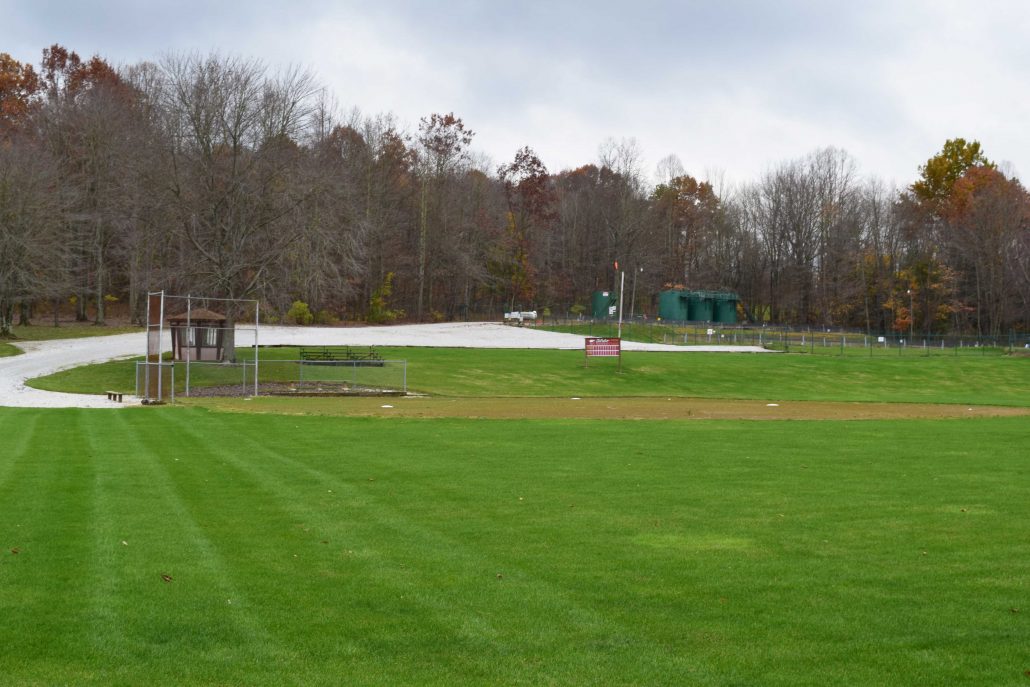
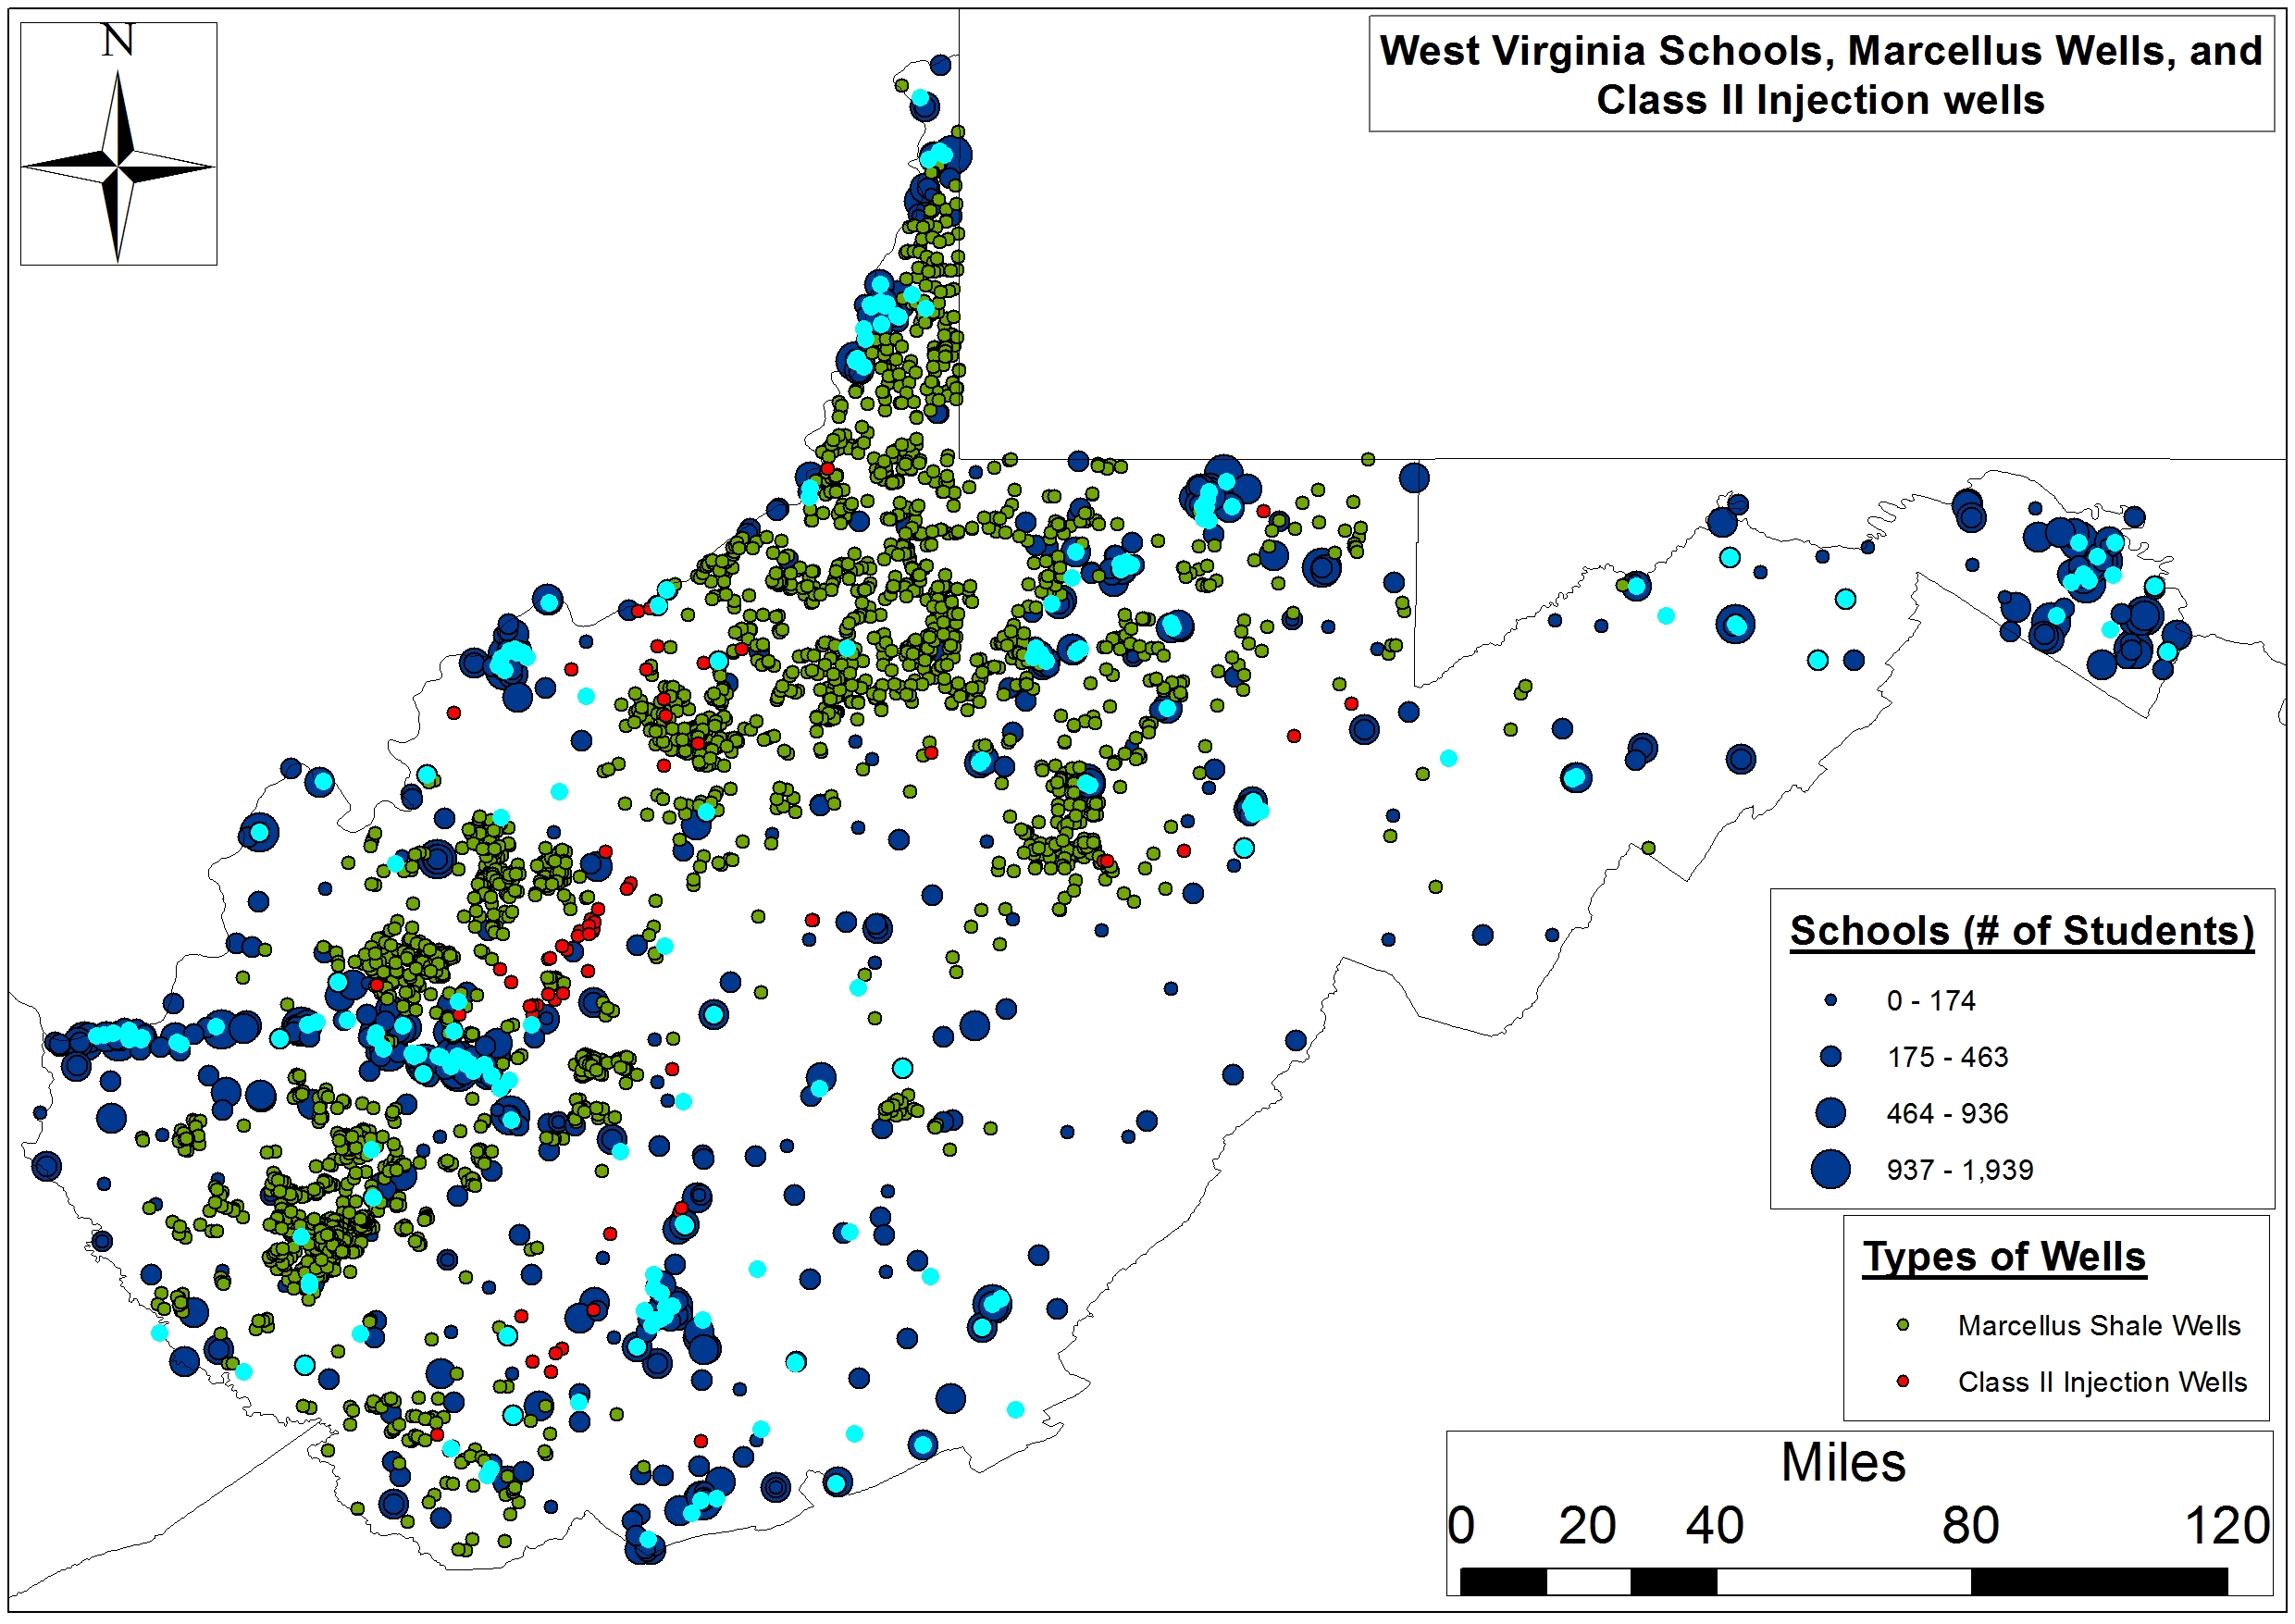


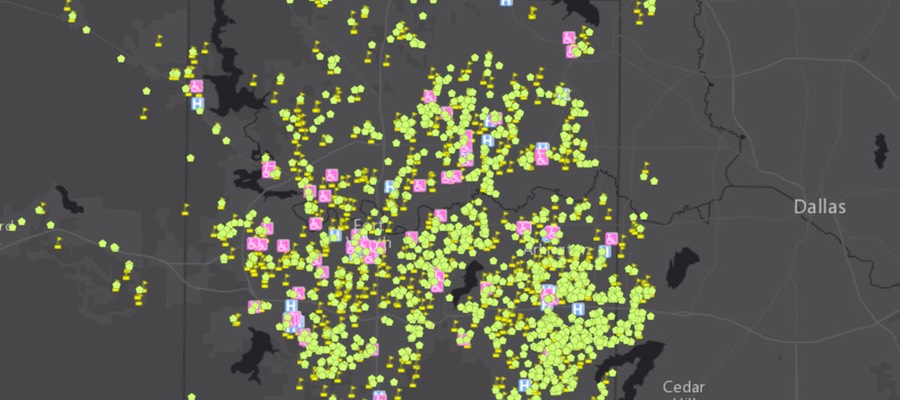
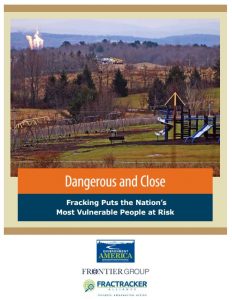
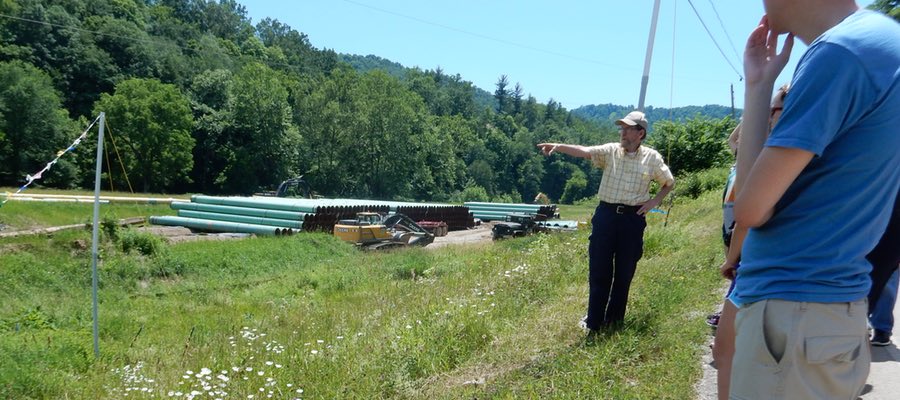
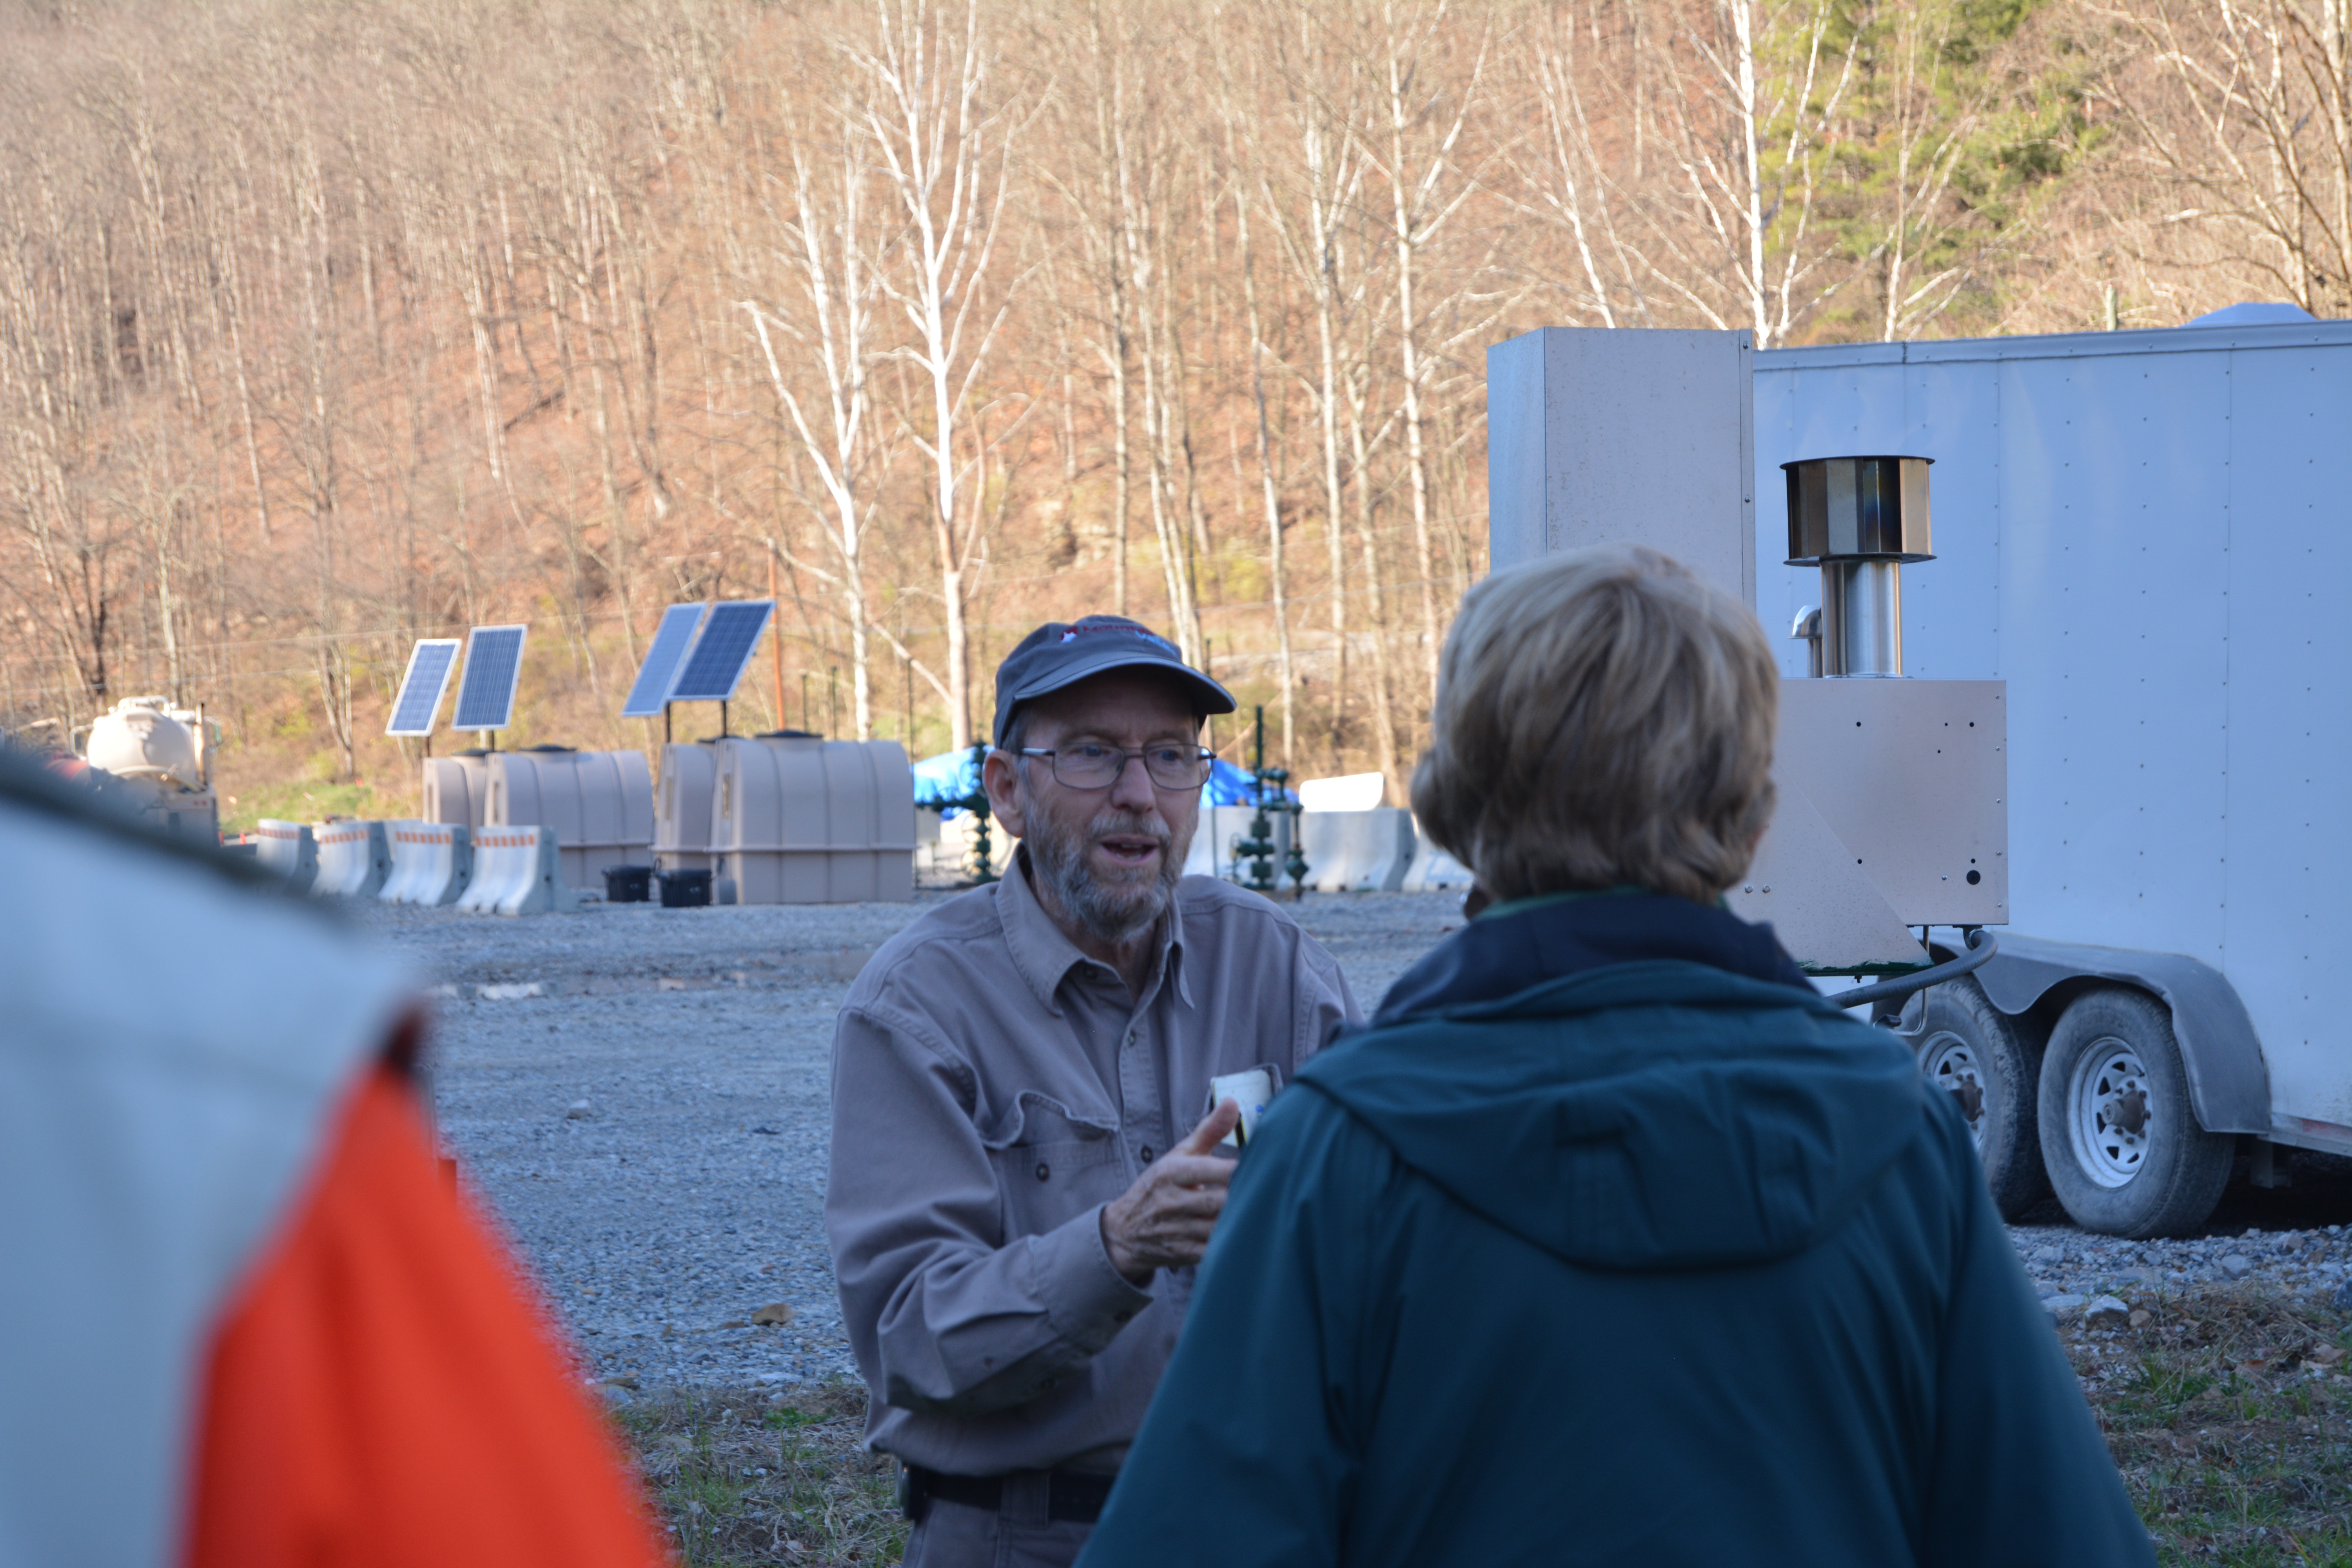

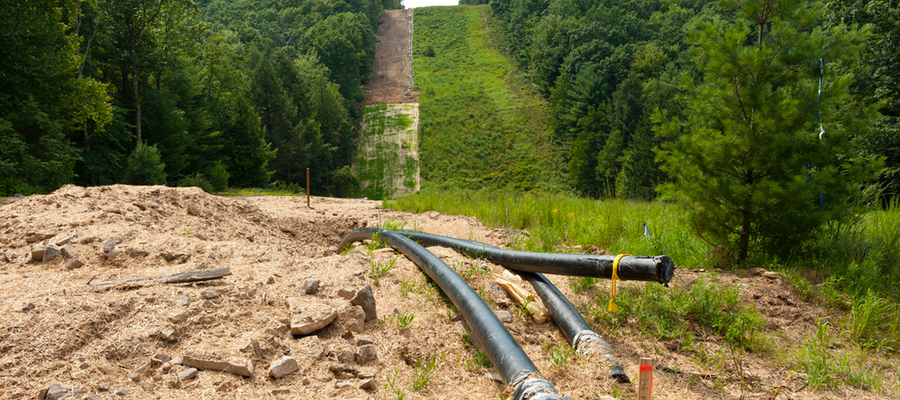
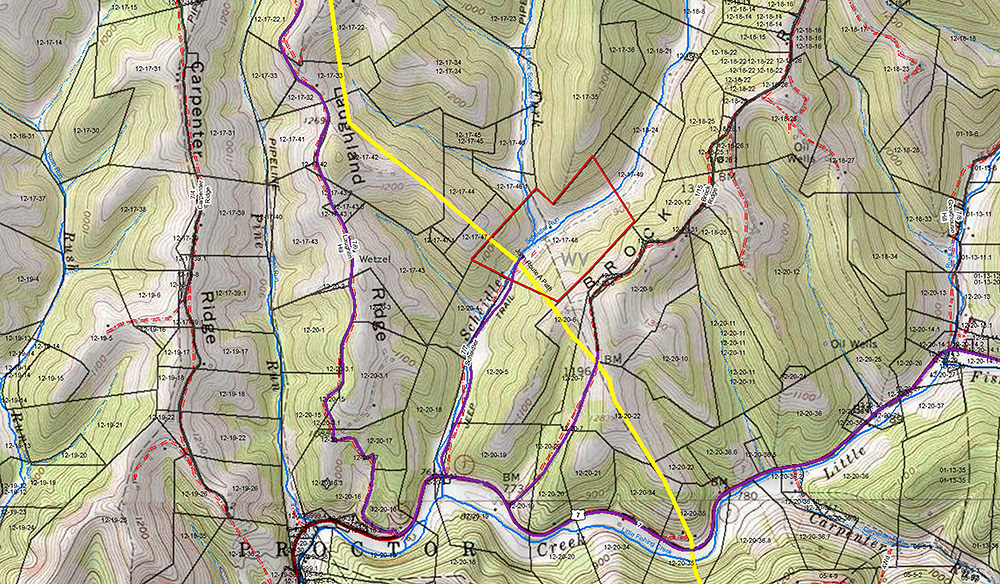

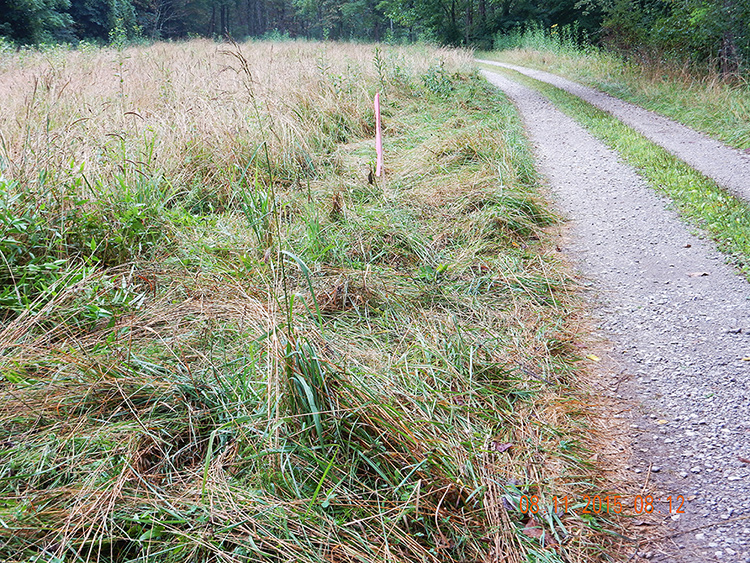


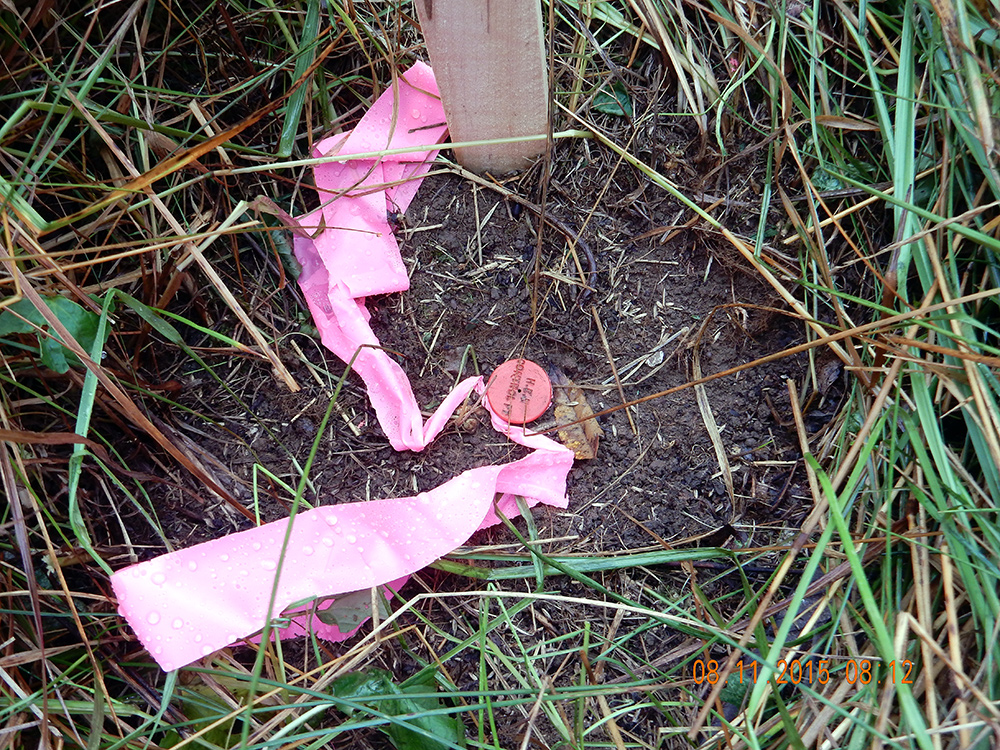


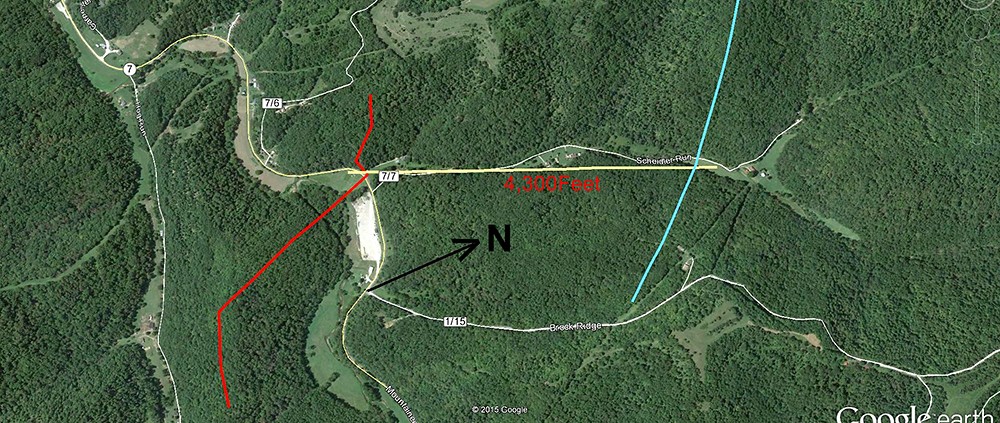
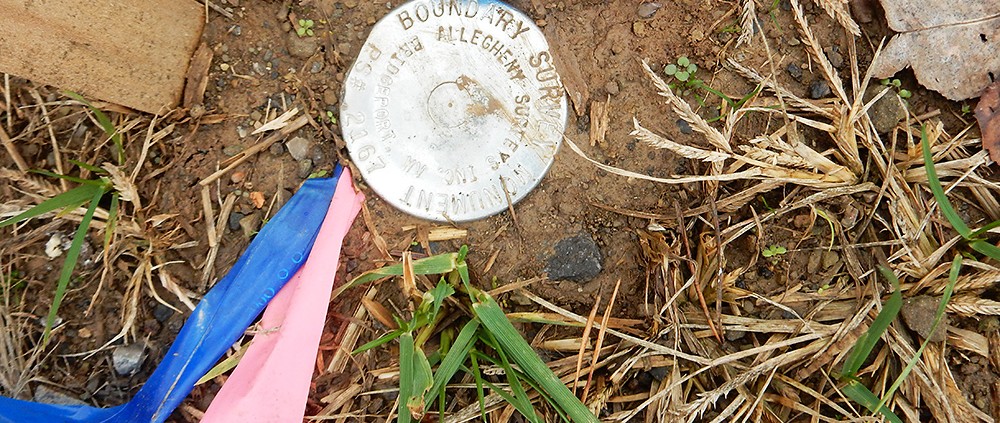
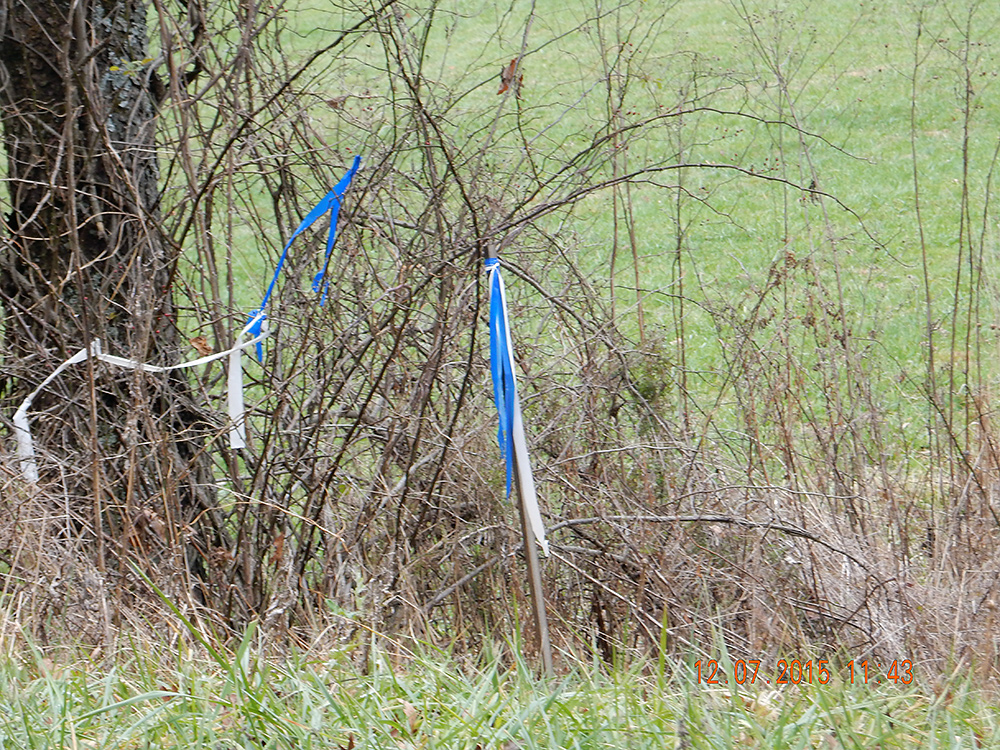

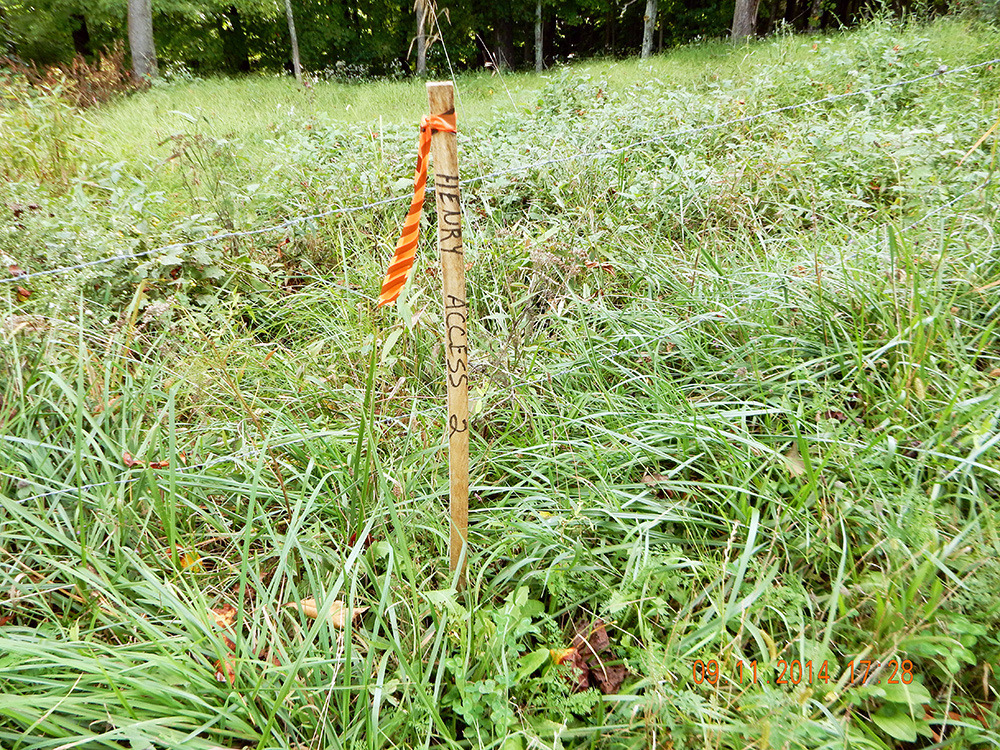
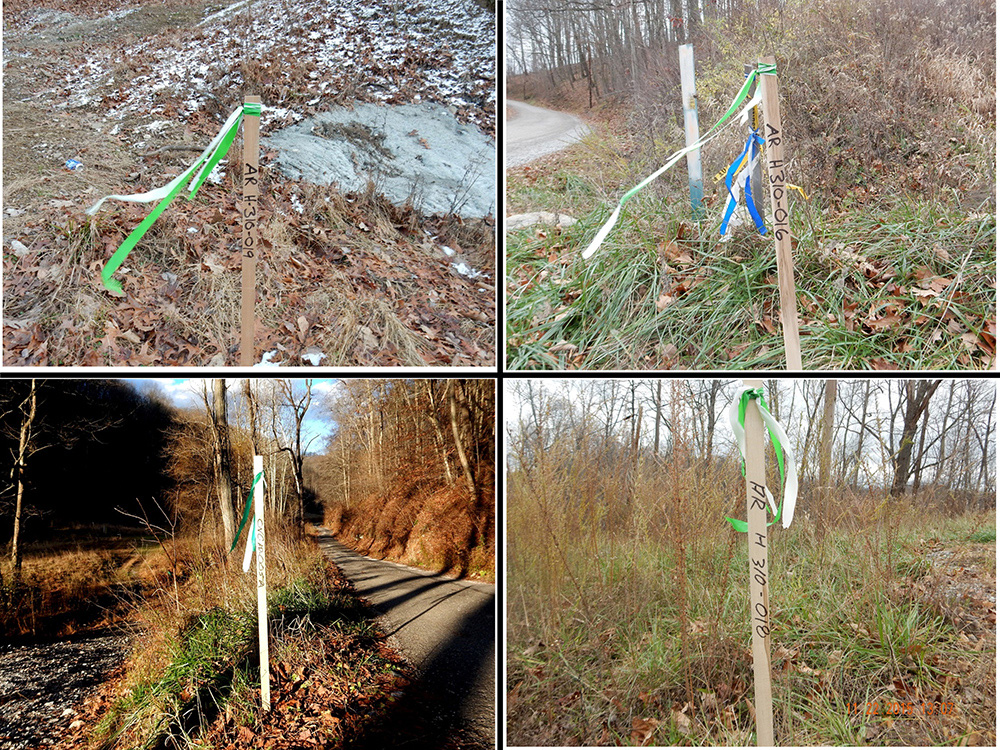
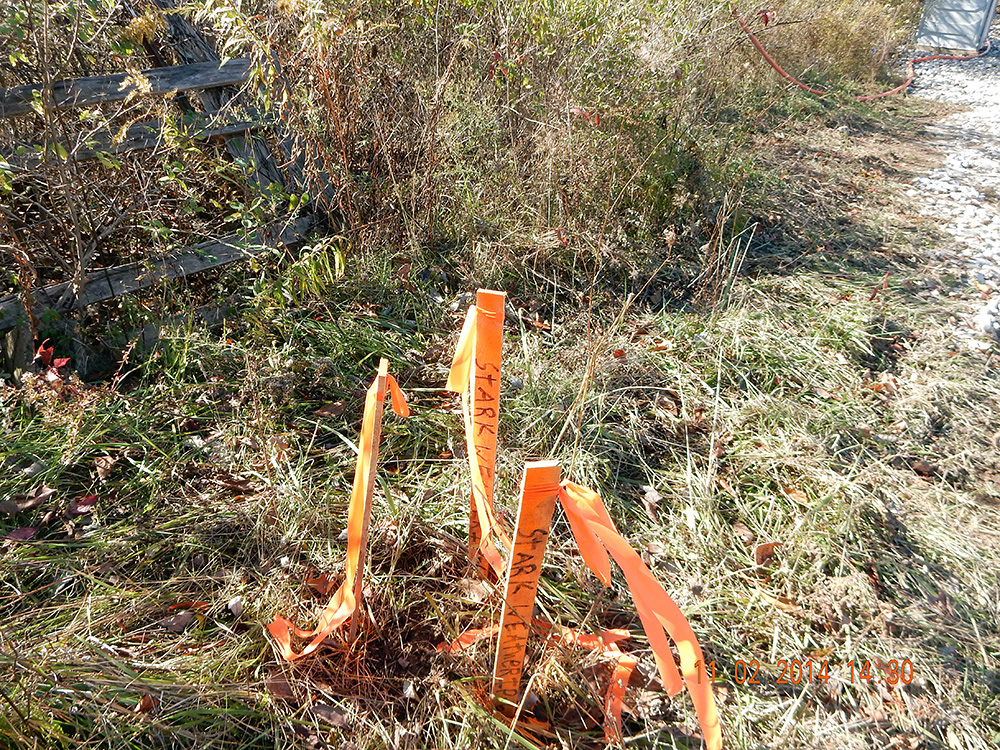
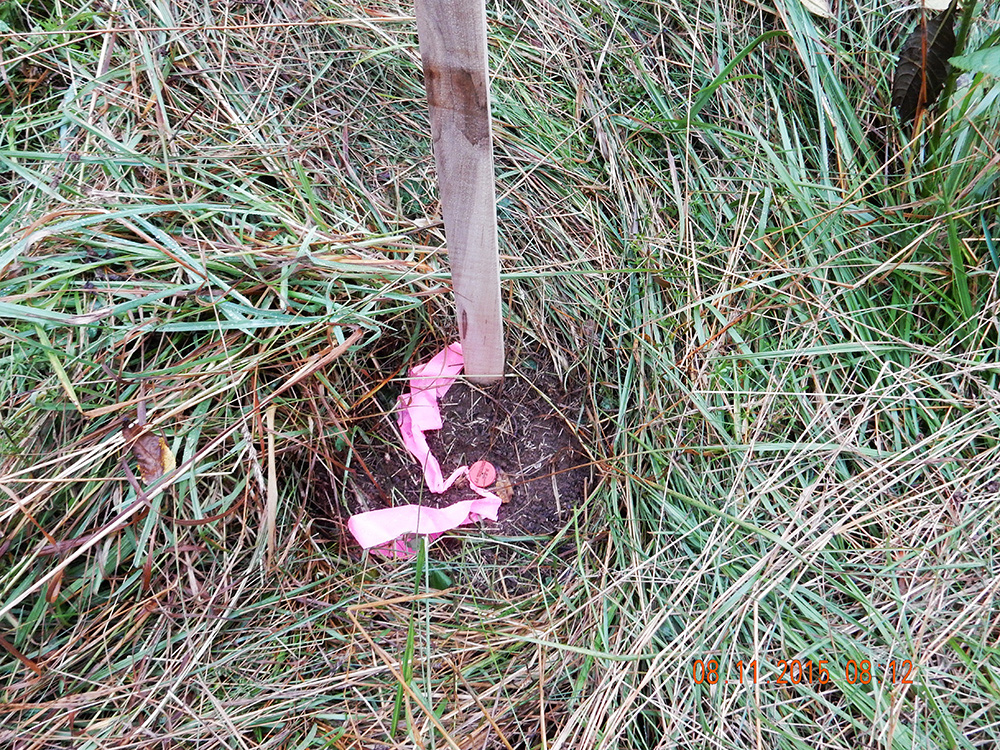
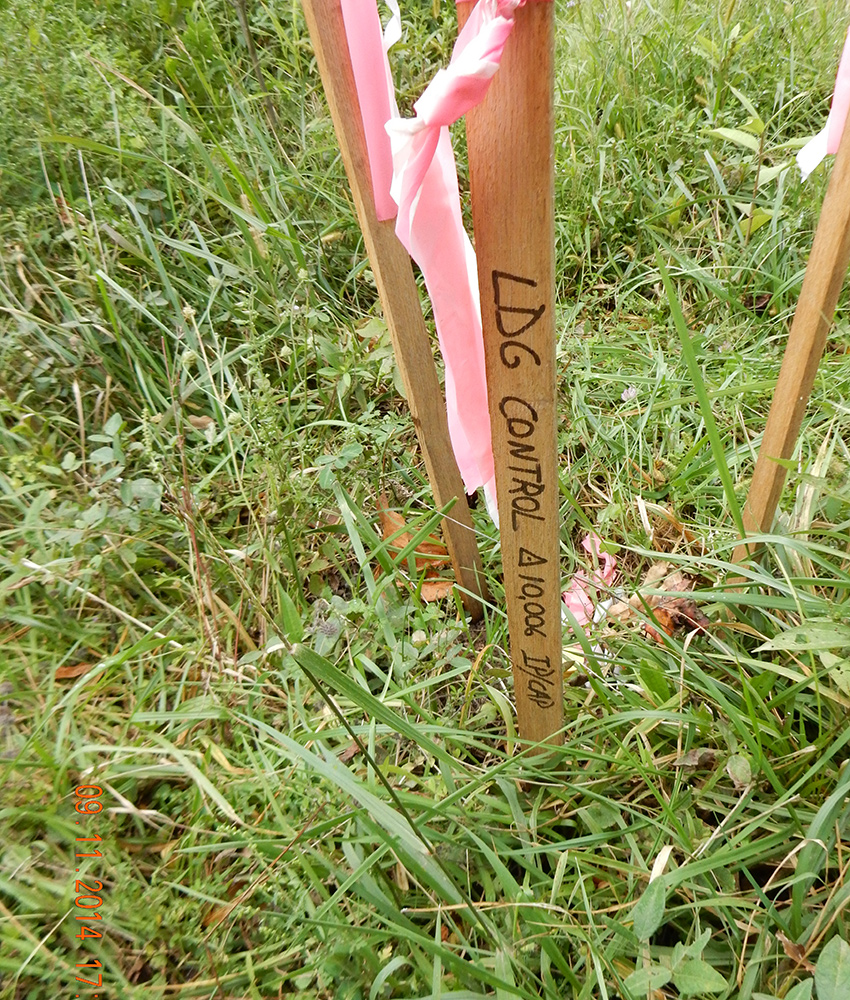
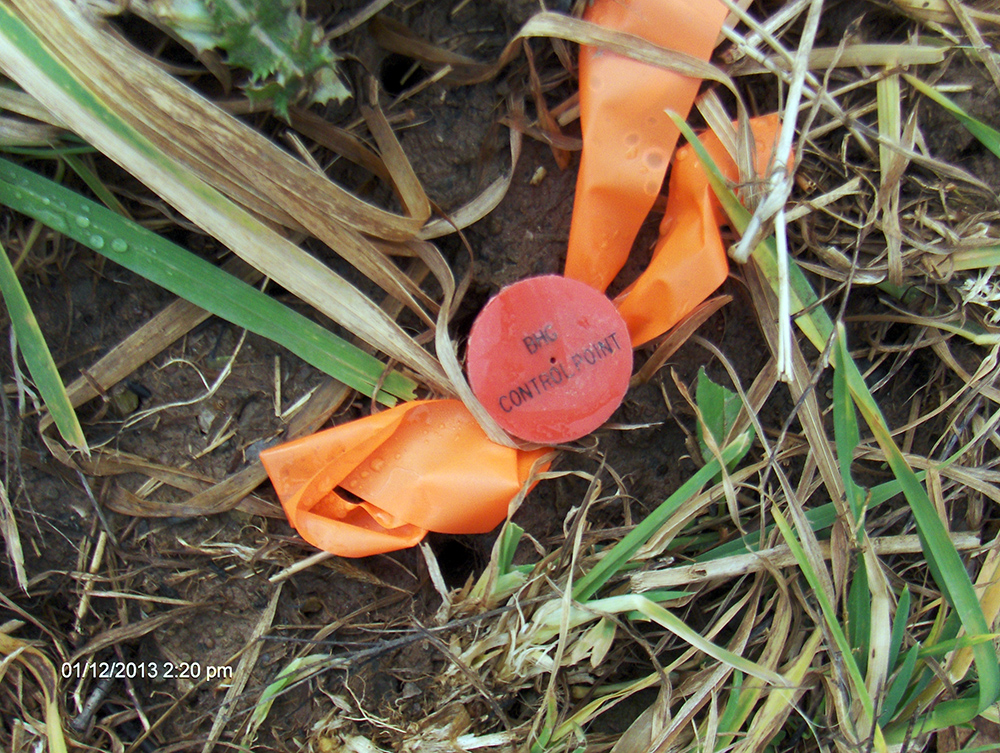
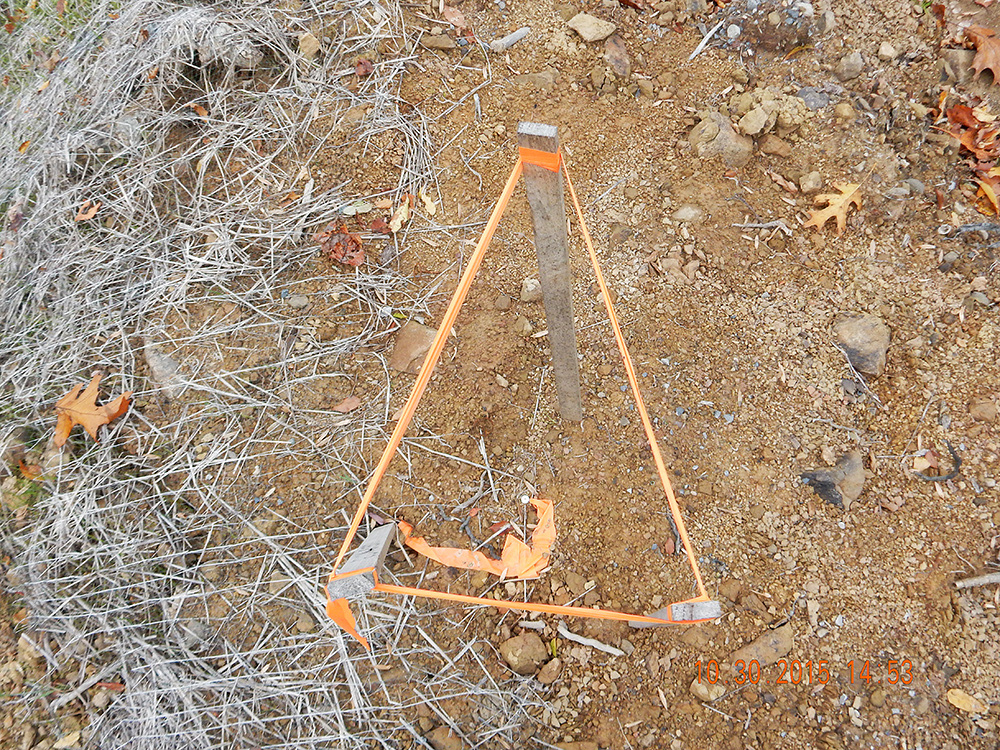
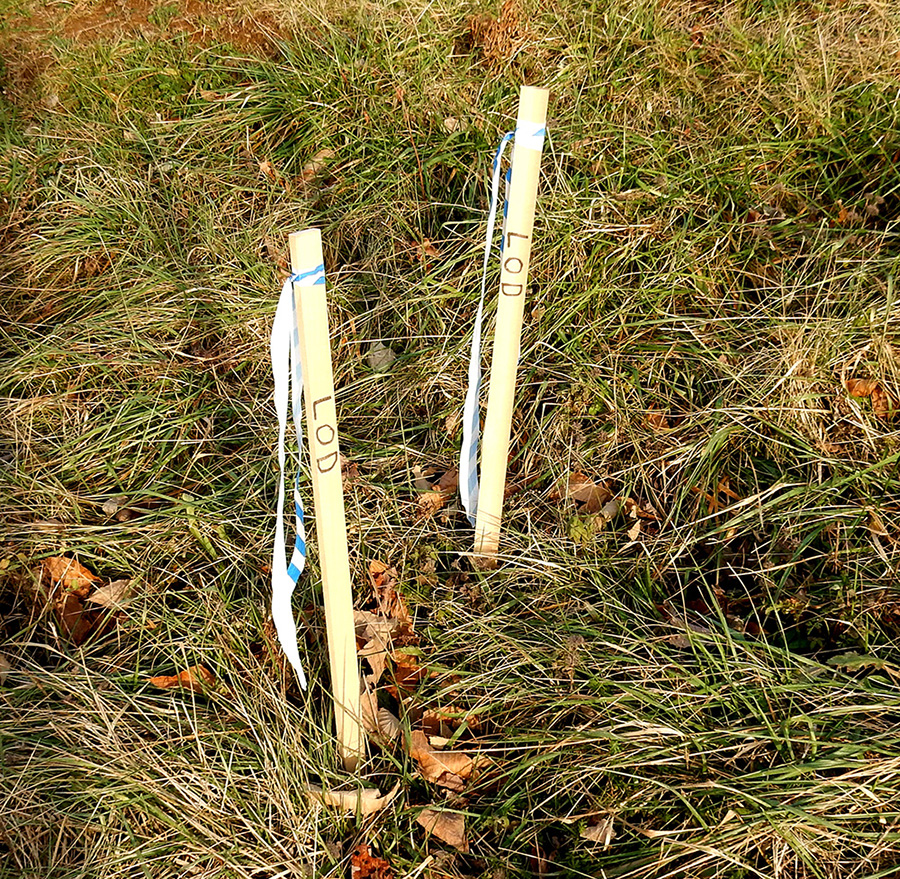
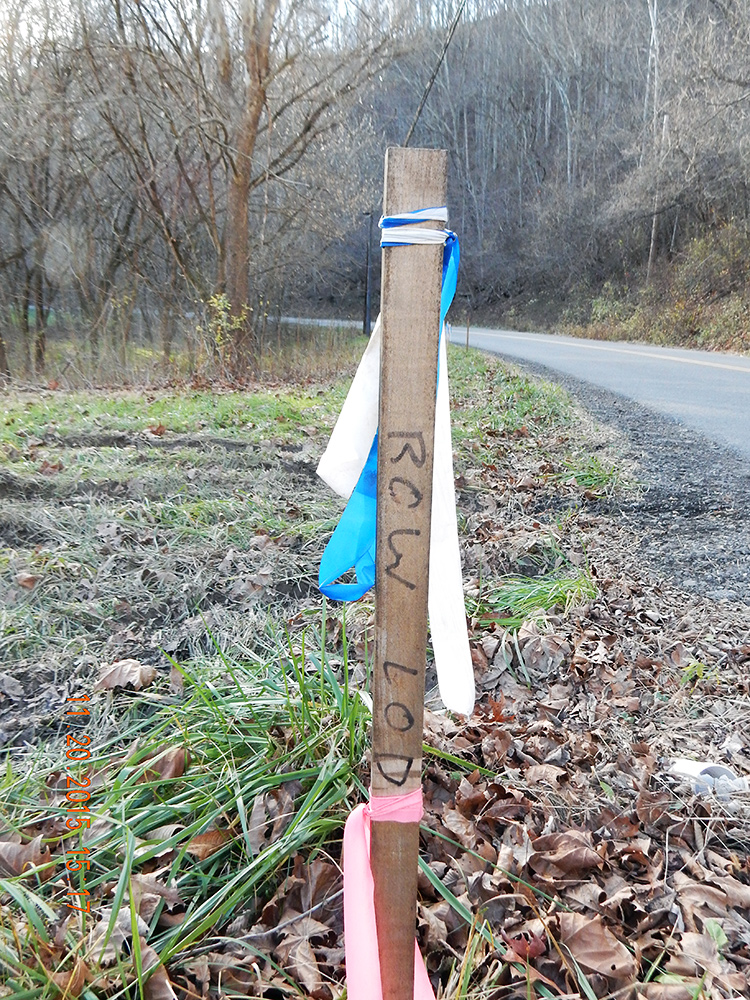
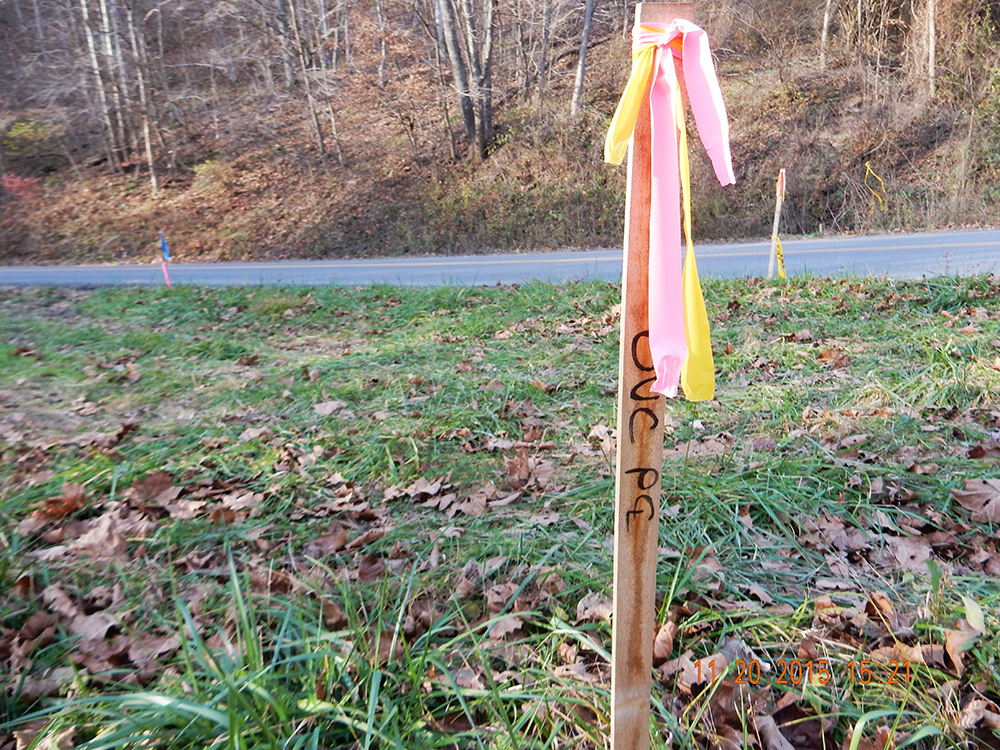
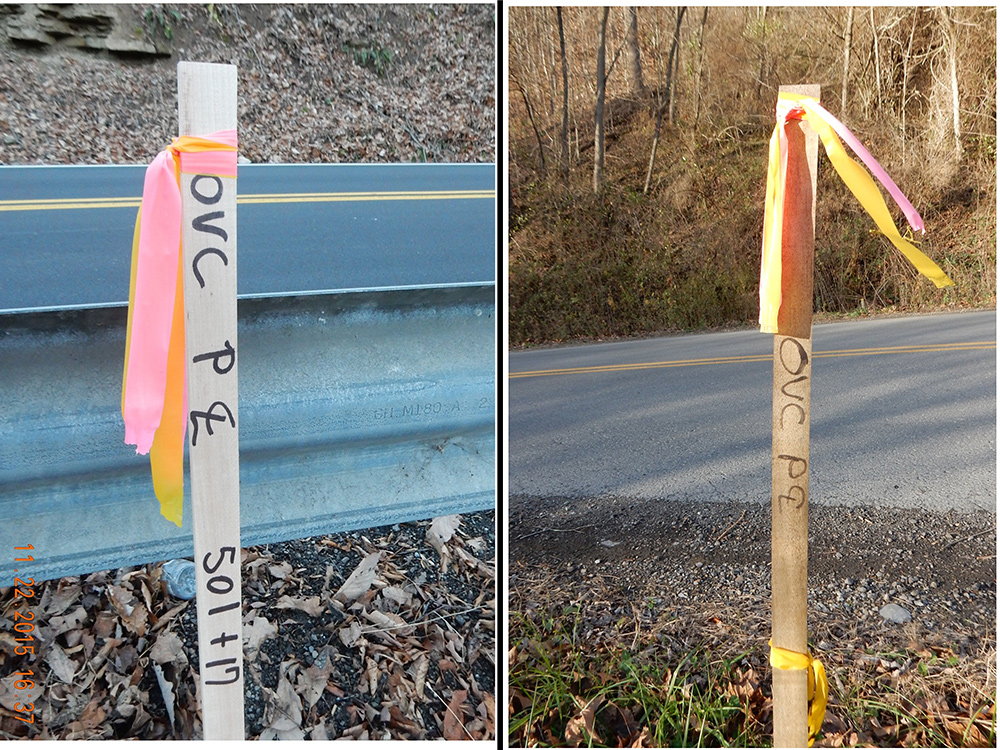
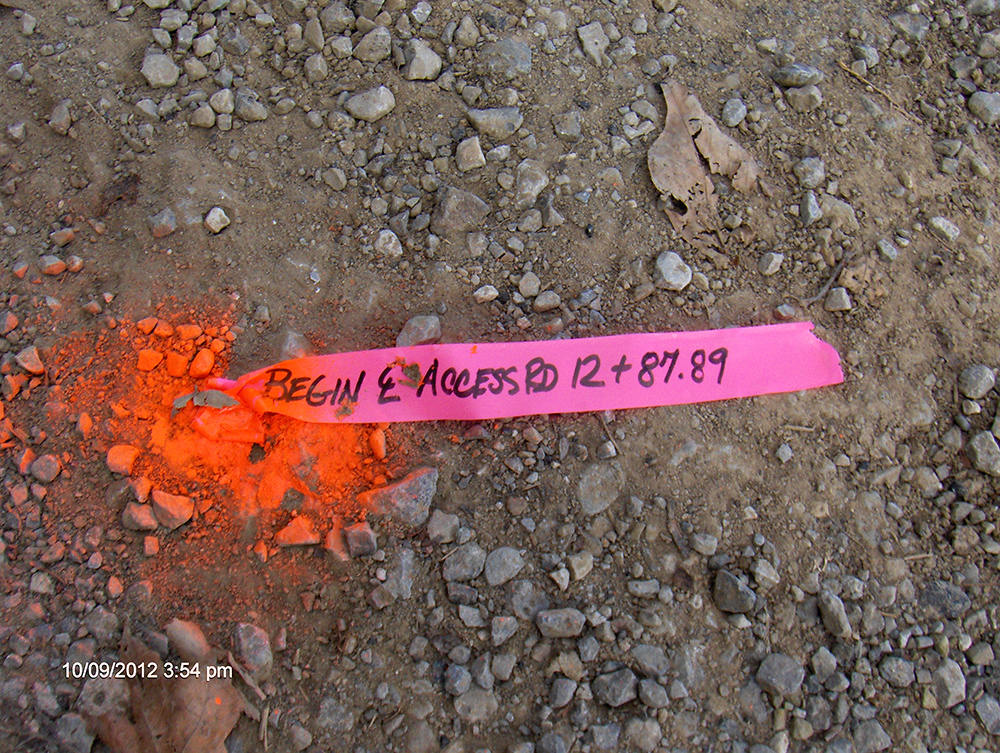
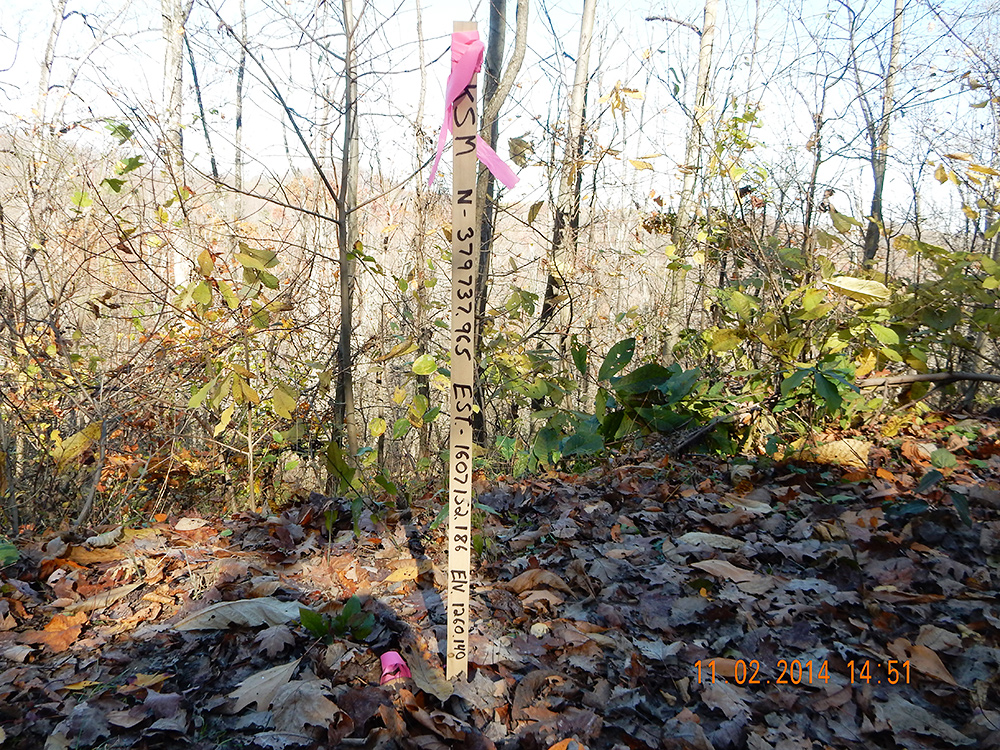
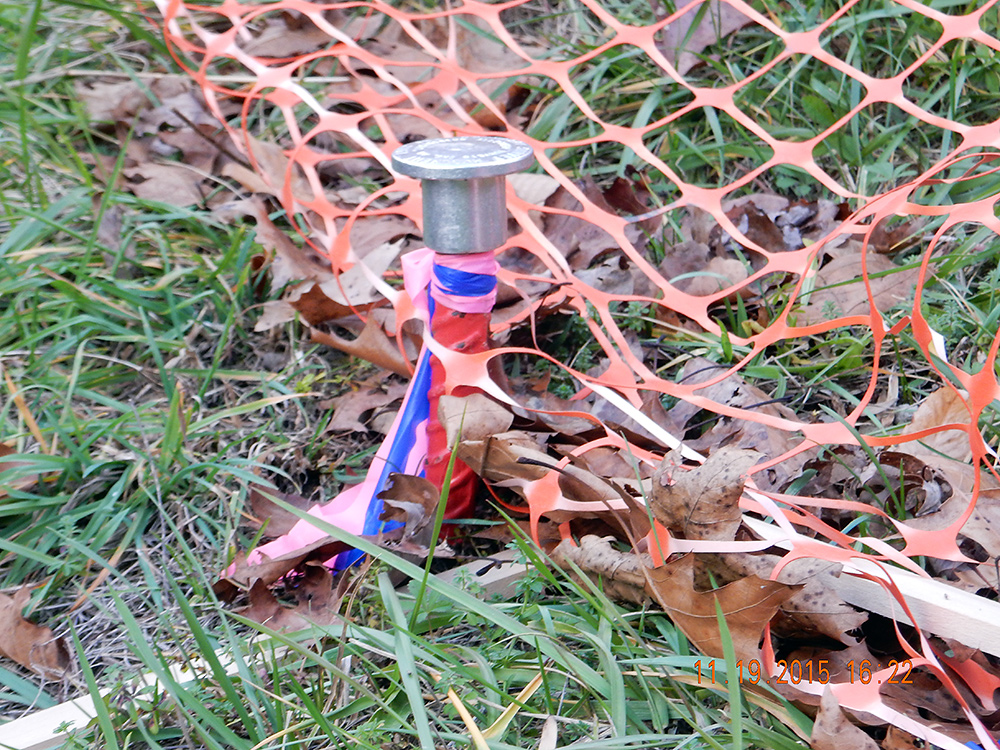
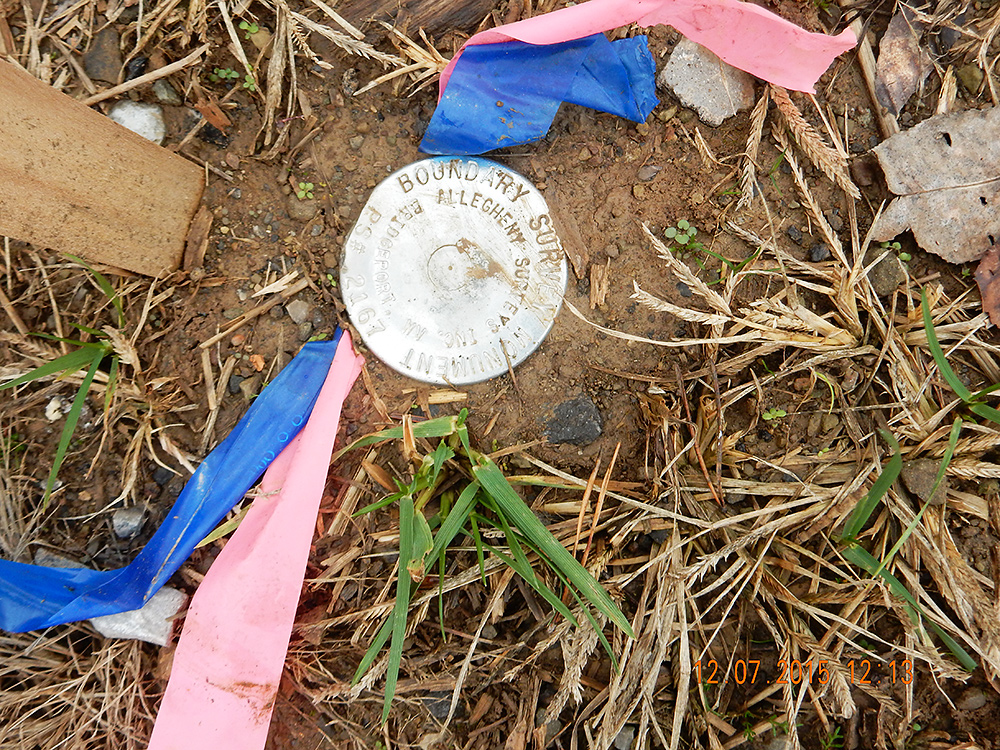
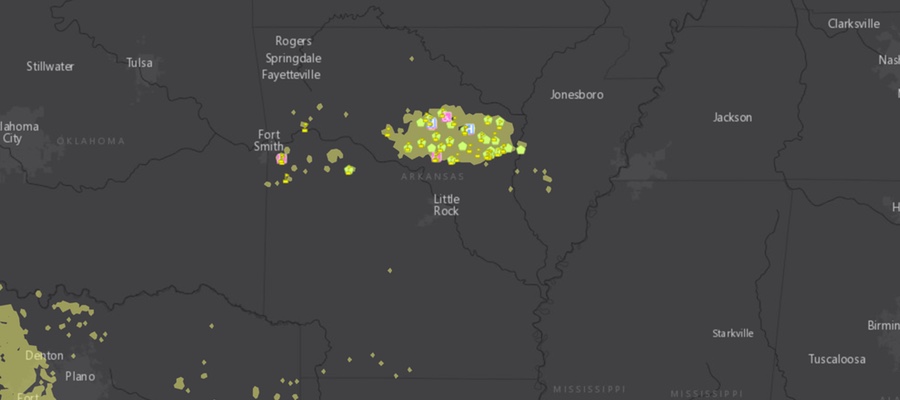
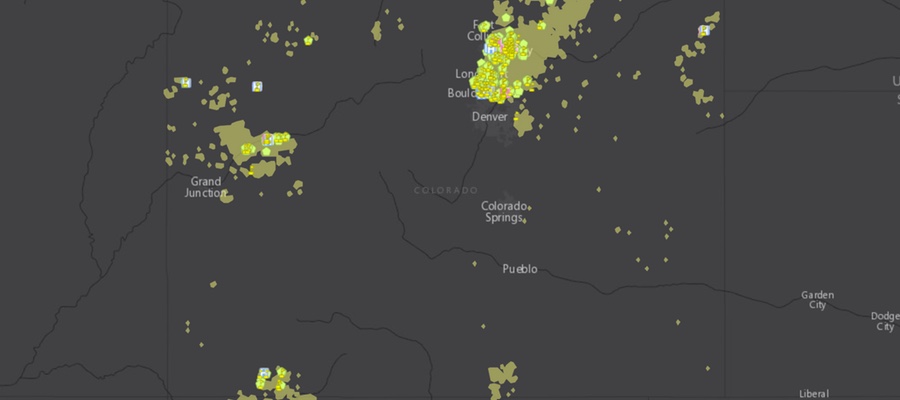
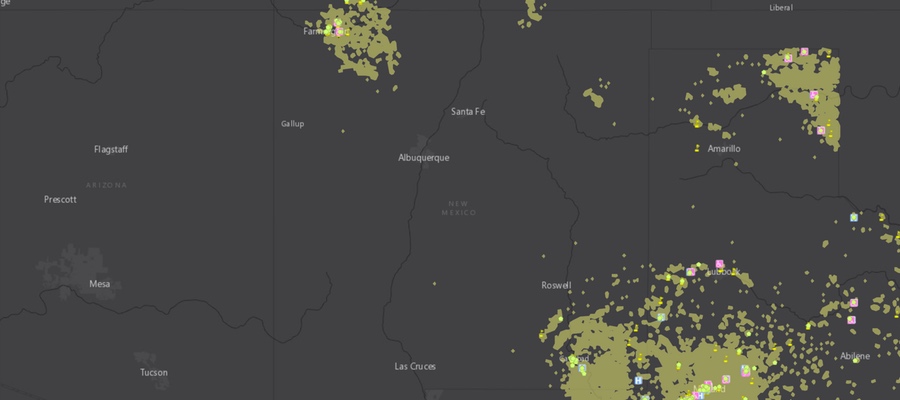
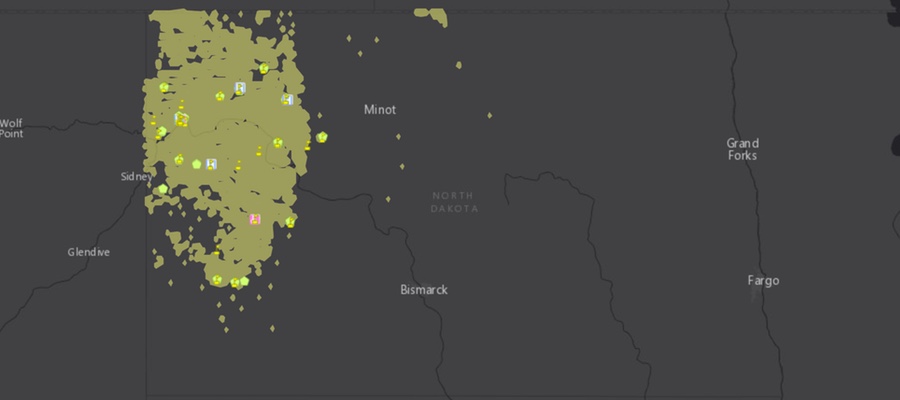
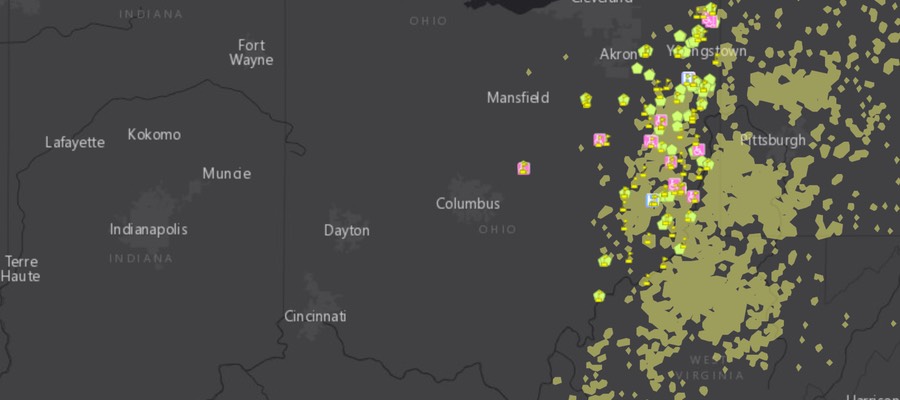
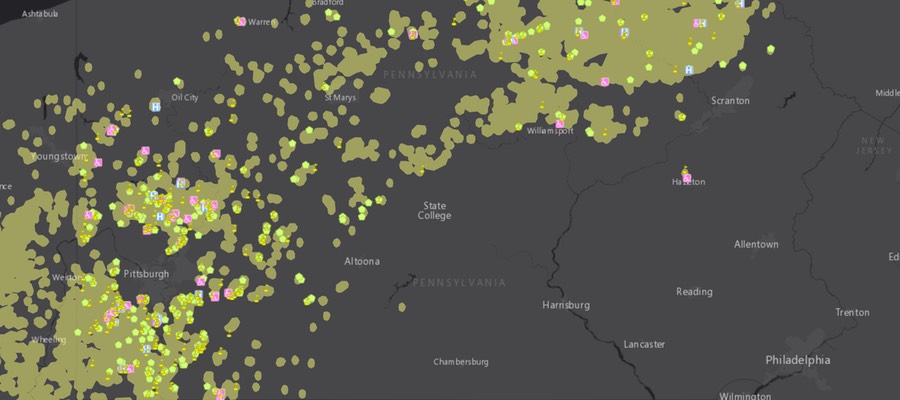
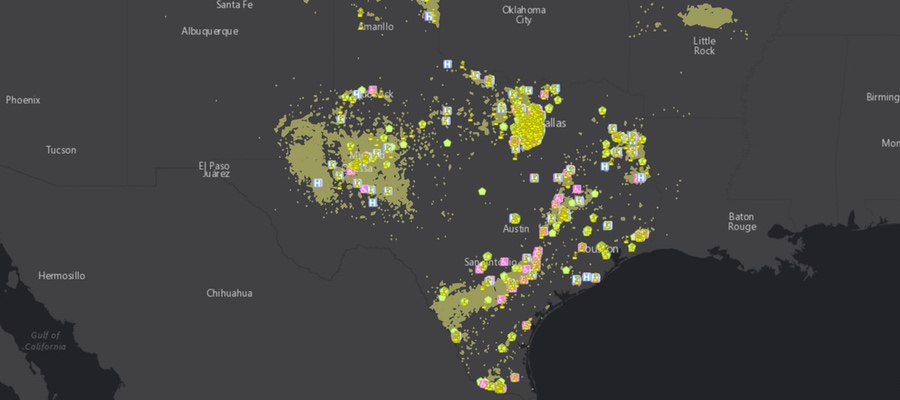
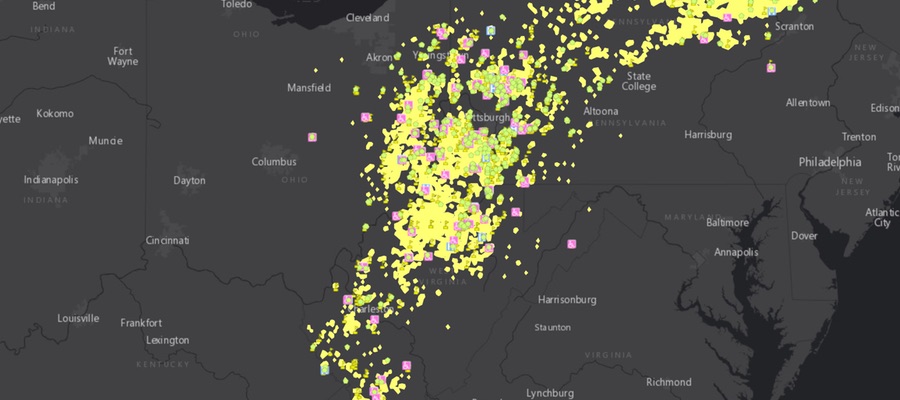