The following correspondence comes to FracTracker from a community member in West Virginia. It highlights in a very personal way the day-to-day nuisances of living with intense drilling activity nearby.
This Is Home
The 170-plus acre parcel of land where we live and farm has been in our family for over 50 years. I have worked on our road that comes into our property for 40 of those years. I know what the road should look like and have put a lot of personal work into maintaining it over the years (like most folks do who live on many of these smaller roads, even though they are a legal State right-of-way). We have been experiencing a lot of problems here due to the exploration and production of the natural gas resources. We would like to see major improvement really soon.
In all my years I have never seen this amount of dust or this amount of mud and slop after a small rainfall, of all of the loose gravel that makes traction near impossible. And I have never before been blocked and delayed or stopped on my road, and my wife has never been as upset, concerned and fearful and agitated about driving down our lane because of all the big trucks and rude drivers.
I have tried to work with the gas companies and their subcontractors for some years. My Mom and I have a separate property nearby where another well pad is located. I have recently allowed a new gas pipeline to be put through my farmland. I have tried to be patient and tolerant and easy going for the past three years. However, like some neighbors on nearby roads have found out, that doesn’t always work. Some of the hundreds of drivers and employees are courteous, polite, and respectful and yield the road when we are traveling. Some others are downright rude and disrespectful. They must not live around here, and it is obvious they do not care at all about the local residents.
Dirt and Mud
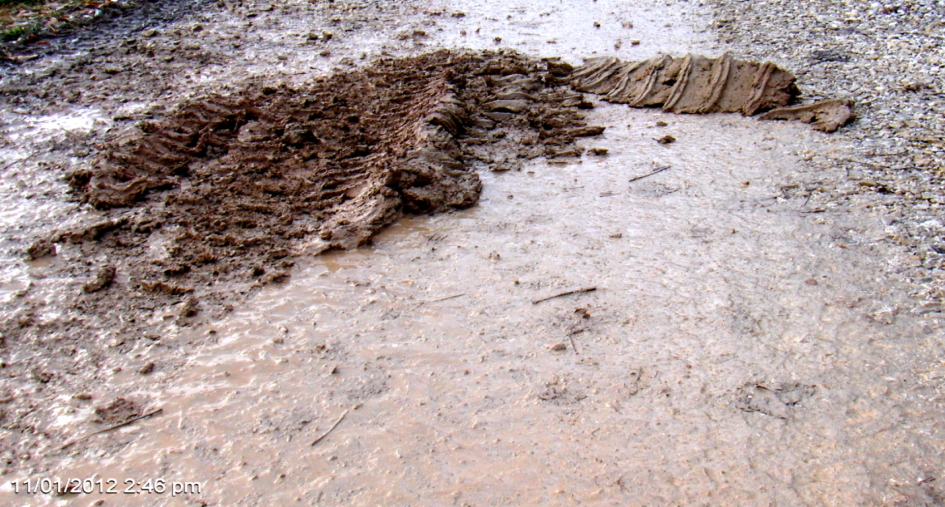
Clumps of mud that employees of a construction and excavating company dragged off of the well pad
We will give you some examples of the problems from our viewpoint. Let’s start with dirt, mud, and dust since those have been an on-going problem since the pipeline guys started here over 6 months ago. See photos right.
Surely they knew that it was likely to happen and they knew it did happen. They left the mud on our road. The construction employees drove by and watched a neighbor pick up and carry the mud to the side of the road.
This was not a one-time occurrence. This has happened every time this summer when we had rain. Our lane has been treated like it was a private lease road. So far it seems that our WV DOH (West Virginia Division of Highways) has been ineffective in improving the situation.
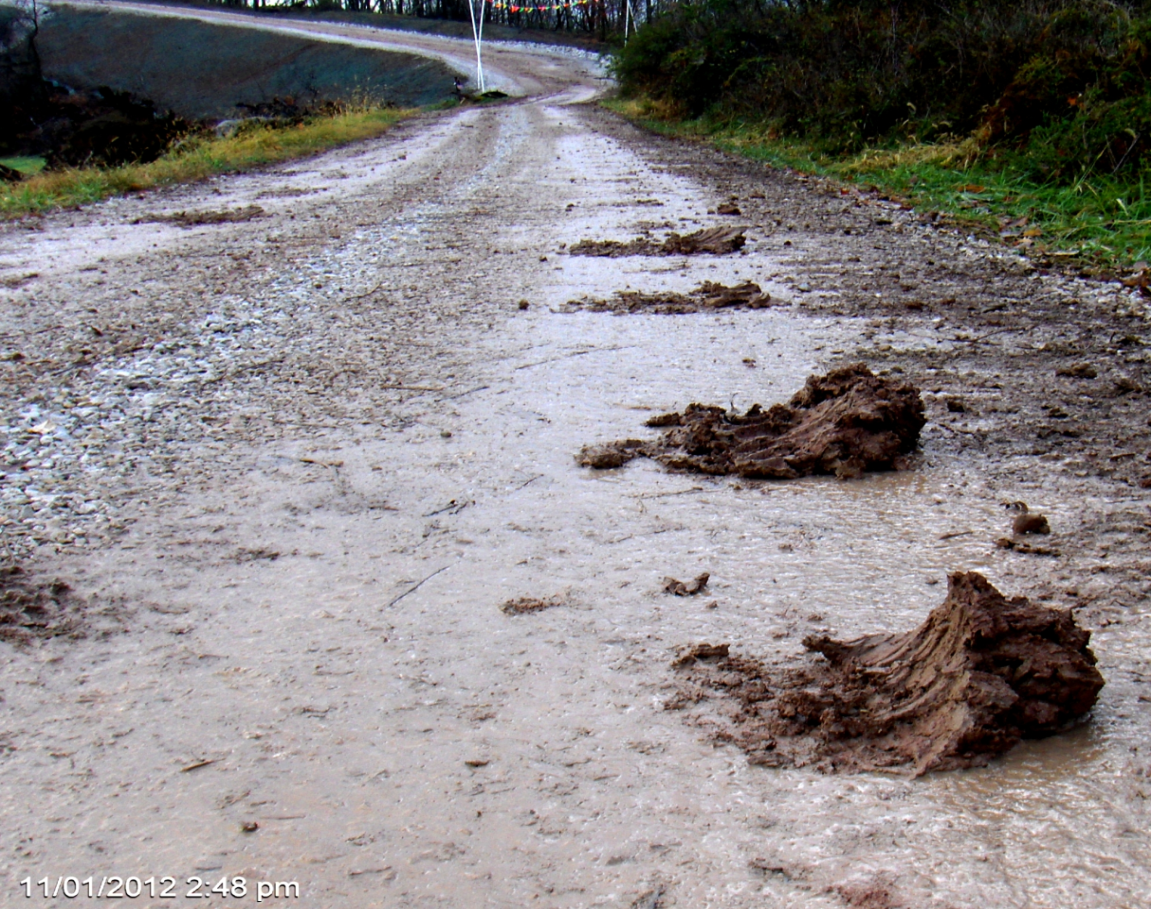
Another mud tracking issue
For the most part when companies are moving dirt they seem to do a good job. All we ask is that they keep their mud on their property and off our road.
I have never before seen big mud blobs like the one to the right on our road. It is unnecessary, uncalled for and avoidable. Seeing these frequently is a visible sign that at hardly any of the industry cares about the neighbors near here. I was given some of the Engineering Plans for the well pad and its access road. It spells out that the contractor is responsible to never drag mud out onto the public road. And what to do if it happens.
I recently reviewed some well pad construction plans. To paraphrase, the plans say don’t make a mess in public, but if and when you do clean up after yourself. Sounds like stuff that was covered in Kindergarten, doesn’t it? It promotes good policy and it keeps peace in the neighborhood.
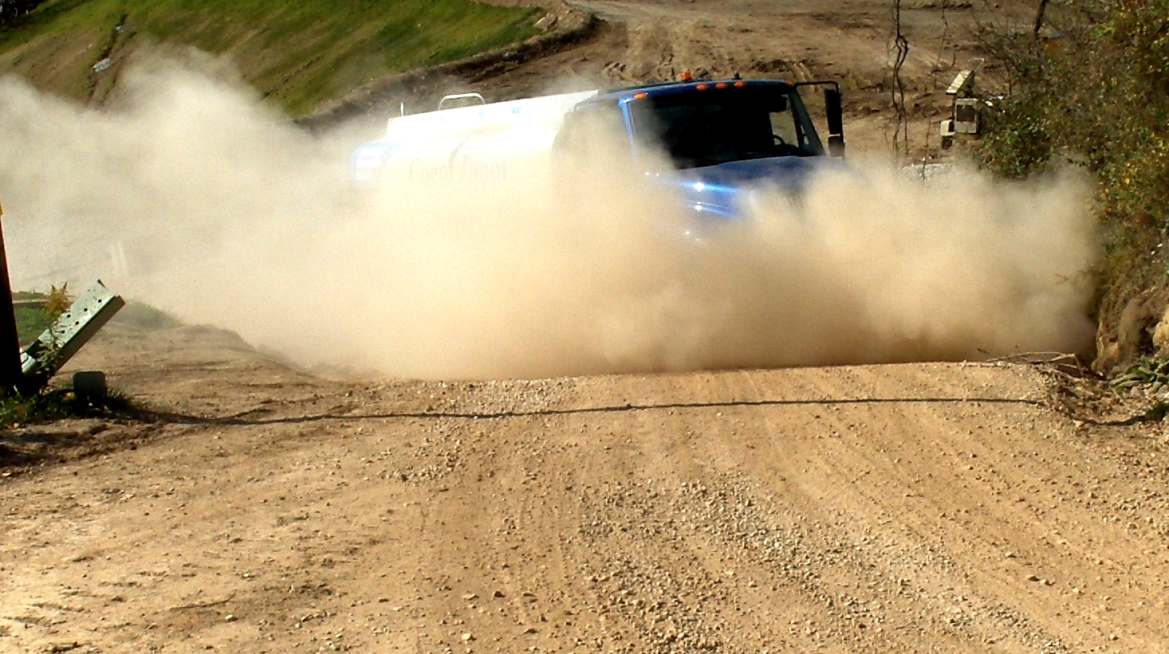
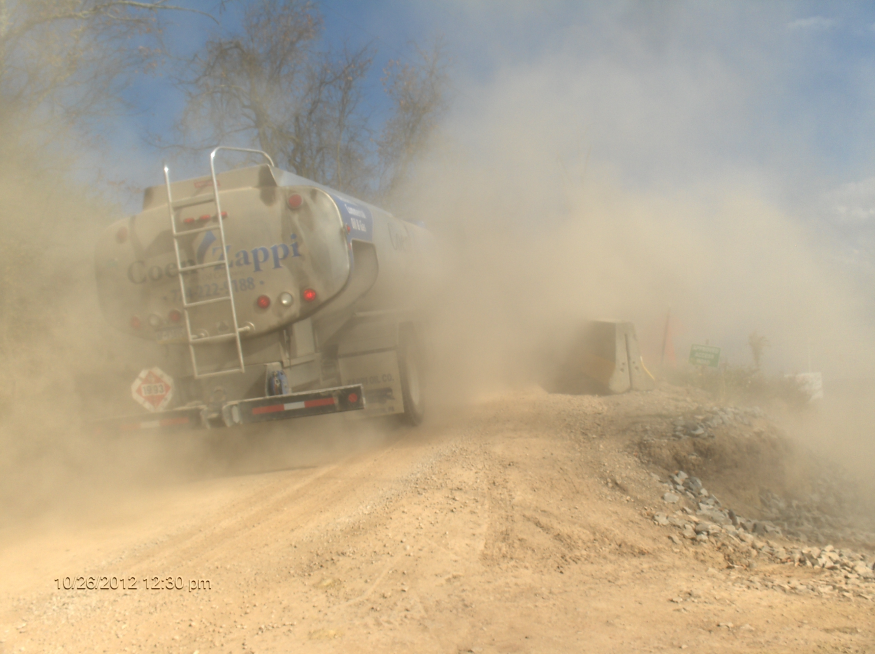
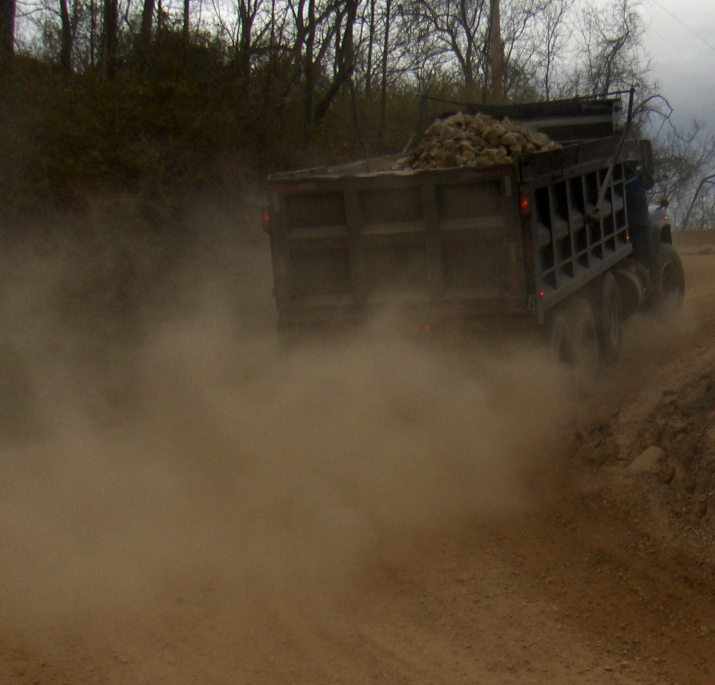
Dust Storms
The next example of another problem that we should not have to live with, occurs when all of that mud on our road dries out. DUST, as can be seen in the next three pictures, is a very common occurrence.
Guests were visiting here recently and had to follow a dust storm down the road. The trucker probable never saw her car. He probably could not see anything behind him.
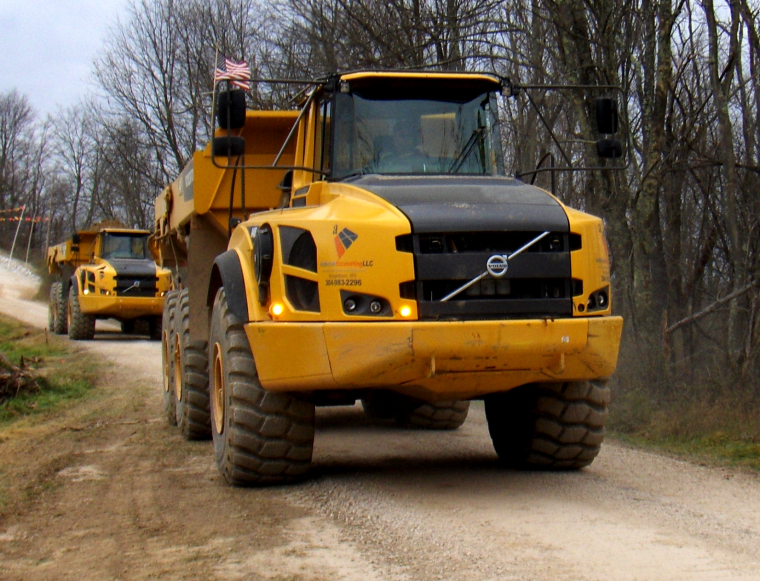
Trucks
More Trucks
Means Lots of Dust
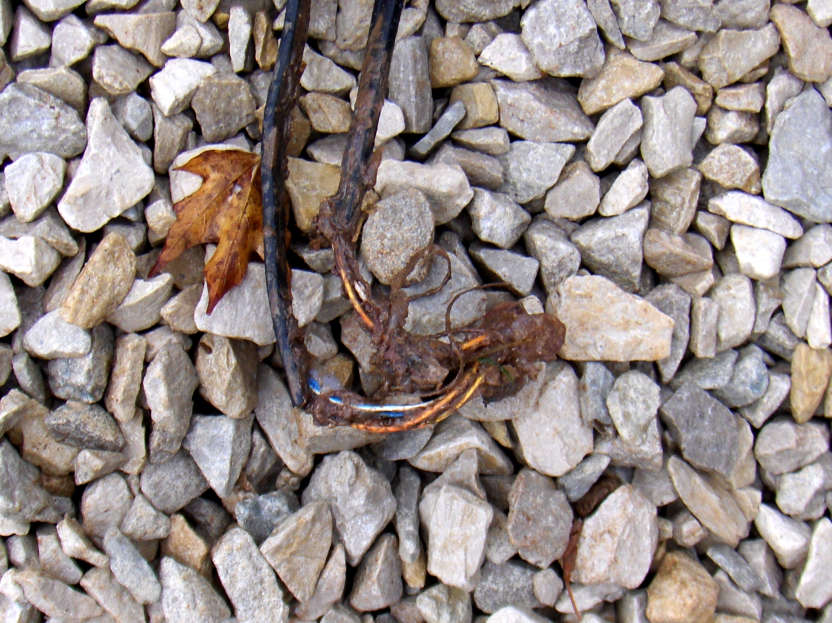
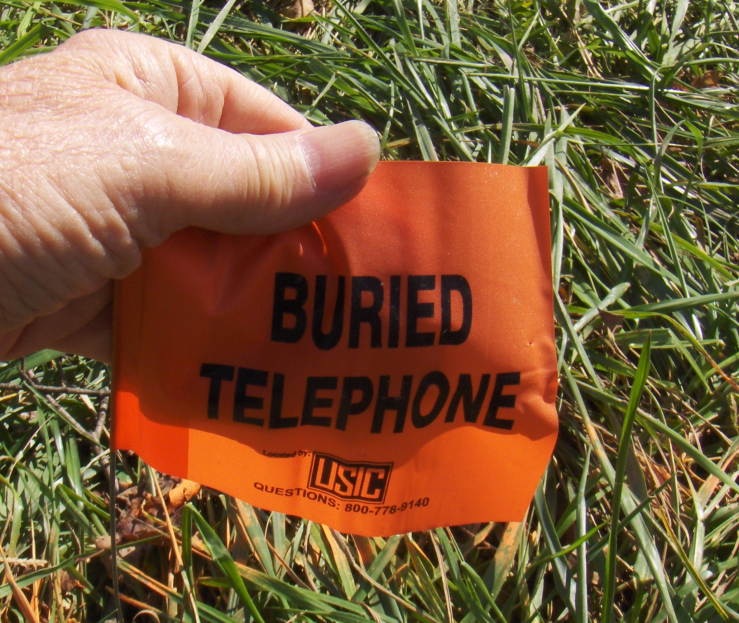
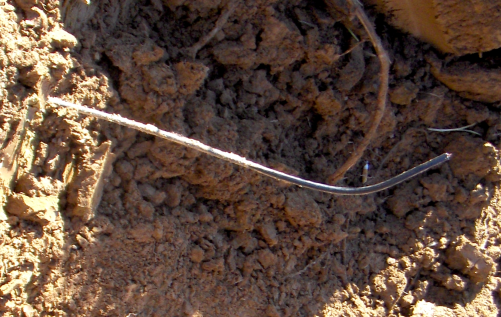
Broken Phone Lines
Another problem that has happened over and over has been has been all the times that contractors have broken our phone line. It seemed that no one ever thought to call the 800 phone number to have utilities marked. In addition, after they were marked, no one paid any attention to where the flags were. This is a very basic task, but it seems to be beyond what some of the contractors could figure out and do. See photos below. Note the broken and temporary splice in my phone line that looks like a dozer operator did it. The phone line was then lying on the top of the gravel road.
The photos below show our phone line after it was again dug up and broken last week. Even with the phone company markers to tell the operators exactly where the line was, they dug into it. Someone is not paying attention.
By the way, we do not own or use a cell phone, so being able to depend on a working landline is important to us. We could understand this incident happening one time, but not more often than that.
Construction Equipment on Public Roadway
Construction equipment on the road
We appreciate that a few weeks ago the construction contractor put some small gravel on the top part of the roadway near the well pad entrance. However we are not sure how long that gravel will last because of all the dirt that has been dropped on it, but mainly because of all the heavy construction equipment that has been running on the public road every day.
The gravel is being pulverized daily and contributes to the dust problem. Also a large pile of loose gravel and big rock is now spread out on the roadway at the sharp right, uphill turn past the compressor station entrance. This makes it difficult for smaller vehicles to get any traction. Well pad guys all drive bigger 4-wheel drive trucks, so it doesn’t seem to matter to them. But my family drives smaller cars.
A neighbor was again walking the road last week picking up clumps of mud and large rock to get them off the road.
Also, we have been told that all this construction equipment is not supposed to be using the state right-of-way anyway, at any time. Are these off road construction pieces of equipment insured, and registered and licensed to be used on a public roadway?
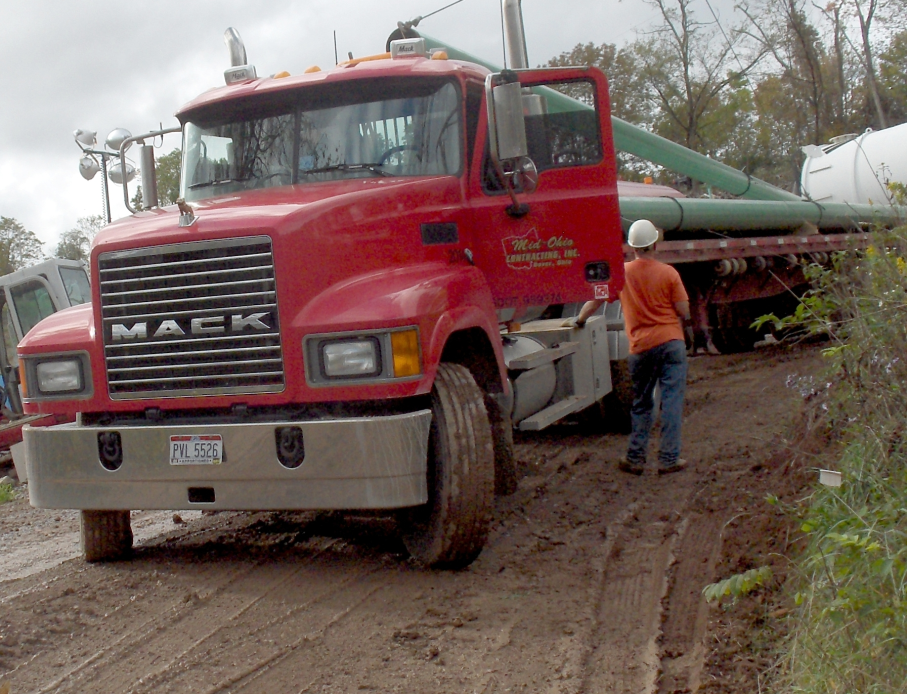
Blocked Roads
Roadblock on Turkey Run, WV
Another frequent problem is having our roads blocked many times causing many delays.
On Election Day my wife went to get my mom to take her to vote and had to wait on yet another truck blocking the road. These truckers seem to always think they always have the right of way, the right to block our roads, and the right to stop residential traffic at any time for their convenience. Last week a flagger stopped me just to allow construction employees to exit the well pad. Good neighbors would not do that. The truck to the right had the road completely closed for over an hour, with a track hoe behind it being used to unload the pipe. There is enough land around here to get these trucks off our road when unloading them. Even our local loggers know to do that.
Being a Better Neighbor
All of these problems are nothing new to other residents here in Wetzel County. My friends in the Silver Hill area have complained about the same type of problems for years, and eventually the operator there finally figured out how to be a better neighbor.
With all the problems in many other areas by multiple companies, one would think that by now the gas drillers and all their many subcontractors would have come up with a set of what works and what doesn’t. I think they are called best practices. We should not have to continually keep doing the same inconsiderate things all over again at each well pad site in every area. It is possible to learn from mistakes made elsewhere. We should be looking for constant improvements in our operations, as these issues are more than an inconvenience.
This article is one of many in our Community Insights section. Learn more>
https://www.fractracker.org/a5ej20sjfwe/wp-content/uploads/2014/08/TruckBlog.png400900FracTracker Alliancehttps://www.fractracker.org/a5ej20sjfwe/wp-content/uploads/2025/09/2025-Wordmark-Logo.pngFracTracker Alliance2014-09-25 10:09:172020-07-21 10:42:45More than an Inconvenience
Part of the FracTracker Truck Counts Project By Mary Ellen Cassidy, Community Outreach Coordinator, FracTracker Alliance
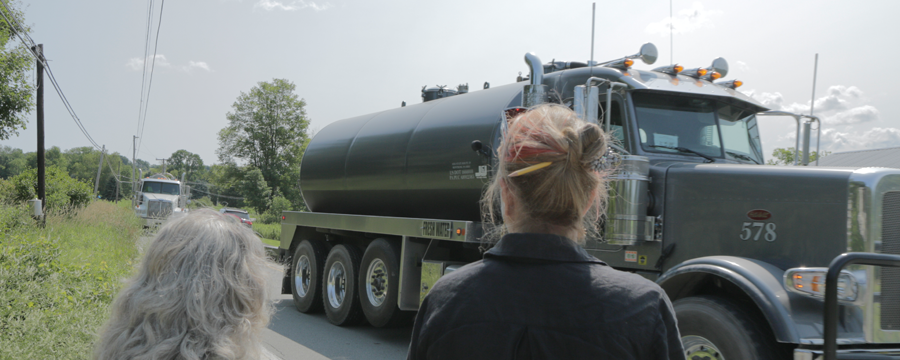
I was recently invited by a community member to visit his home. It sits in a valley that is surrounded by drilling pads, as well as compressors and processing stations. While walking down the road that passes directly in front of his home, several caravans of gas trucks roared past and continued far into the evening. Our discussion about the unexpected barrage of this new invasion of intense truck traffic was frequently interrupted by the noise of the diesel engines passing nearby. Along with the noise, truck headlights pierced through the windows of the home, and dust flew up from the nearby road onto his garden.
There are many stories like this about homes and families impacted by the increased truck traffic associated with fracking-related activities. FracTracker is currently working with some of these communities to document the intensity of gas and oil trucks travelling their roads. In response to these concerns we have a launched a pilot Truck Counts project to provide support, resources, and networking opportunities to communities struggling with high volume gas truck traffic.
Preliminary Results
Volunteers in PA, WV, OH and WI have already started to participate in the project, with some interesting results, photos, observations, and suggestions.
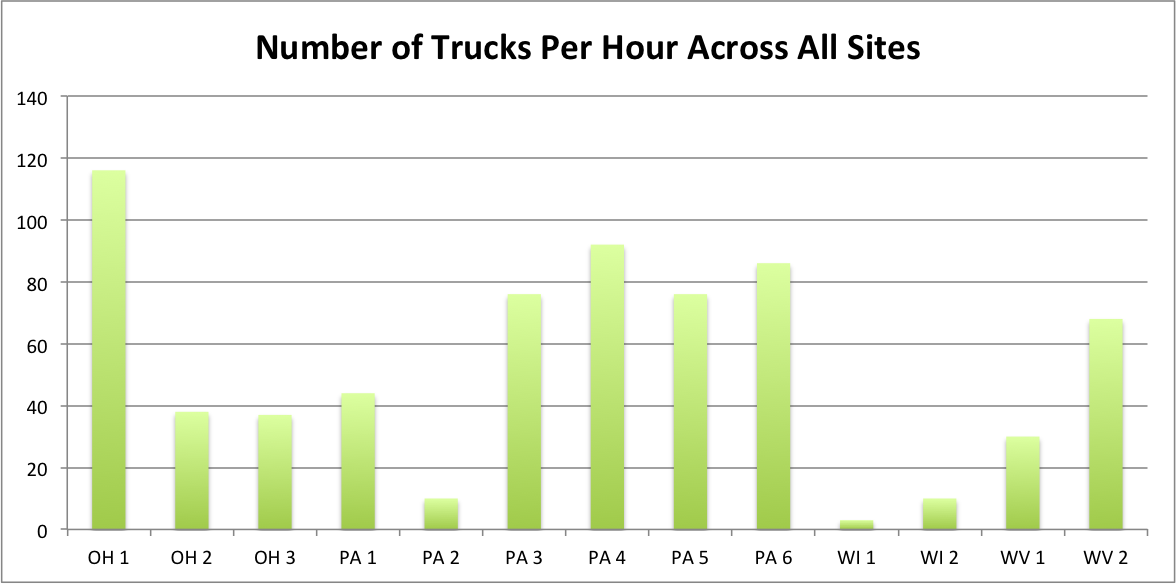
To-date, truck counts have varied significantly, as to be expected. Some of the sites where we chose to count passing trucks were very close to drilling activity, and some were more remote. While developing the counting protocol, we often included large equipment and tanker trucks, as well as gas company personnel vehicles (as indicated by white pickup trucks and company logos on the side). While the data vary, the spikes in truck counts do tell the story of a bigger and broader issue – the influx of heavy equipment during certain stages of drilling can be a significant burden on the local community. In total, we counted 676 trucks over 13 sites The average number of trucks that passed by per hour was 44, with a high of 116 an hour, and a low of 5.
About the Project
FracTracker Truck Counts partners with communities to: help identify issues of concern related to high volume gas truck traffic; collect data, photos, videos and narratives related to gas truck traffic; and analyze and share results through shared database and mapping options.
What motivates volunteers to join us in our Truck Counts program? Community concerns include dust, diesel exhaust, spills, accidents, along with other health and safety issues, as well as the cost and inconvenience of deteriorating road conditions resulting from the increased weights and numbers of vehicles. So, what do we already know about the extent of the damages caused by heavy truck traffic?
Public Safety
Several studies have found that shale gas development is strongly linked to increased traffic accidents and that the increases cannot be attributed only to more trucks and people on the road.
Unlike gas truck traffic issues from past oil and gas booms, this recent shale gas boom impacts traffic and public safety in many different ways. The hydraulic fracturing process requires 2,300 to 4,000 truck trips per well, where older drilling techniques needed one-third to one-half as many trips. Another difference is the speed of development that often far outpaces the capacity of communities to build better roads, bridges, install more traffic signals or hire extra traffic officers. Some experts explain increased truck traffic related accidents by pointing to regulatory loopholes such as federal rules that govern how long truckers can stay on the road being less stringent for drivers in the oil and gas industry. Others note that out of state drivers in charge of large heavy duty loads are not always accustomed to the regional weather patterns or the winding, narrow and hilly country roads that they travel.
An Associated Press analysis of traffic deaths in six drilling states shows that in some counties, fatalities have more than quadrupled since 2004 when most other American roads have become much safer in that period (even with growing populations). Marvin Odum, who runs Royal Dutch Shell’s exploration operations in the Americas, said that deadly crashes are “recognized as one of the key risk areas of the business”. Along with the community, gas truck drivers themselves are at risk. According to a study by the National Institute for Occupational Safety and Health, vehicle crashes are the single biggest cause of fatalities to oil and gas workers. The AP study finds that:
In North Dakota drilling counties, the population has soared 43% over the last decade, while traffic fatalities increased 350%. Roads in those counties were nearly twice as deadly per mile driven than the rest of the state
From 2009-2013-
Traffic fatalities in West Virginia’s most heavily drilled counties…rose 42%. Traffic deaths in the rest of the state declined 8%.
In 21 Texas counties where drilling has recently expanded, deaths/100,000 people are up an average of 18 % while for the rest of Texas, they are down by 20%.
Traffic fatalities in Pennsylvania drilling counties rose 4%, while in the rest of the state they fell 19 %.
New Mexico’s traffic fatalities fell 29%, except in drilling counties, where they only fell 5%.
A separate analysis by Environment America using data from the Upper Great Plans Institute finds that – “While the expanding oil industry in North Dakota has produced many benefits, the expansion has also resulted in an increase in traffic, especially heavy truck traffic. This traffic has contributed to a number of crashes, some of which have resulted in serious injuries and fatalities.” In the Bakken Shale oil region of North Dakota, the number of highway crashes increased by 68% between 2006 and 2010, with the share of crashes involving heavy trucks also increasing over that period.”1
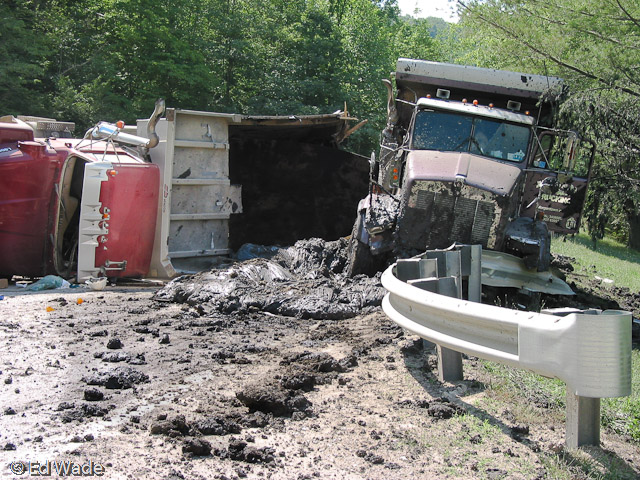
Truck accident and spill in WV. Wetzel County Action Group photo, copyright of Ed Wade, Jr.
Public health concerns do not end with traffic accidents and fatalities. An additional cost of heavy gas truck traffic is the strain it places on emergency service personnel. A 2011 survey by State Impact Pennsylvania in eight counties found that:
Emergency services in heavily drilled counties face a troubling paradox: Even though their population has fallen in recent years, 911 call activity has spiked — by as high as 46 percent, in one case.” Along with the demands placed on emergency responders from the number of increased calls, it also takes extra time to locate the accidents since many calls are coming from transient drivers who “don’t know which road or township they are in.
In Bradford County, a heavily drilled area, increased traffic has delayed the response times of emergency vehicles. According to an article in The Daily Review, firefighters and emergency response teams are delayed due to the increased number of accidents, gas trucks breaking down, and gas trucks running out of fuel (some companies only allow refueling once a night).
Road Deterioration and Regional Costs
Roadway degradation from truck traffic. Wetzel County Action Group photo, copyright of Ed Wade, Jr.
An additional cost often passed on to the impacted communities is infrastructure maintenance. In an article from Business Week, Lynne Irwin, director of Cornell University’s local roads program in Ithaca, New York, states, “Measures to ensure that roads are repaired don’t capture the full cost of damage, potentially leaving taxpayers with the bill.”
This Food and Water Watch Report calculated the financial burden imposed on rural counties by traffic accidents alone, estimating that if the heavy truck accident rate in fracked counties had matched those untouched by the boom, $28 million would have been saved.2
Garrett County is currently struggling with anticipating potential gas traffic and road costs. The Garrett County Shale Gas Advisory Committee uses recent studies from RESI ‘s New York and Pennsylvania data to project gas truck traffic for 6 wells/pad at 22,848 trips/pad and 91,392 total truck trips the first year with increasing numbers for the next 10 years. Like many counties, Garrett County also faces the issue that weights and road use are covered by State, not County code. There is a possibility, however, that the County could determine best “routes” for the trucks. (This is a prime example of the need and benefit for truck counts.)
Although truck companies and contractors pay permit fees, often they are either insufficient to cover costs or are not accessible to impacted counties. The Texas Tribune reports, “The Senate unanimously passed a joint resolution which would ask voters to approve spending $5.7 billion from the state’s Rainy Day Fund, including $2.9 billion for transportation debt. But little, if any, of that money is likely to go toward repairing roads in areas hit hardest by the drilling boom.”
Commenting on the argument that gas companies already pay their fair share for road damages they cause, George Neal posts calculations on the Damascus Citizens for Sustainability website that lead him to conclude that, although “the average truck pays around 27 times the fuel taxes an average car pays… according to the Texas Department of Transportation, they do 8,000 times the damage per mile driven and drive 8 times as far each year.”
The funds needed to fill the gap between the costs of road repairs and the amount actually paid by the oil and gas companies must come from somewhere. According to a draft report from the New York Department of Transportation looking at potential Marcellus Shale development costs, “The annual costs to undertake these transportation projects are estimated to range from $90 to $156 million for State roads and from $121-$222 million for local roads. There is no mechanism in place allowing State and local governments to absorb these additional transportation costs without major impacts to other programs and other municipalities in the State.”
Poor Air Quality
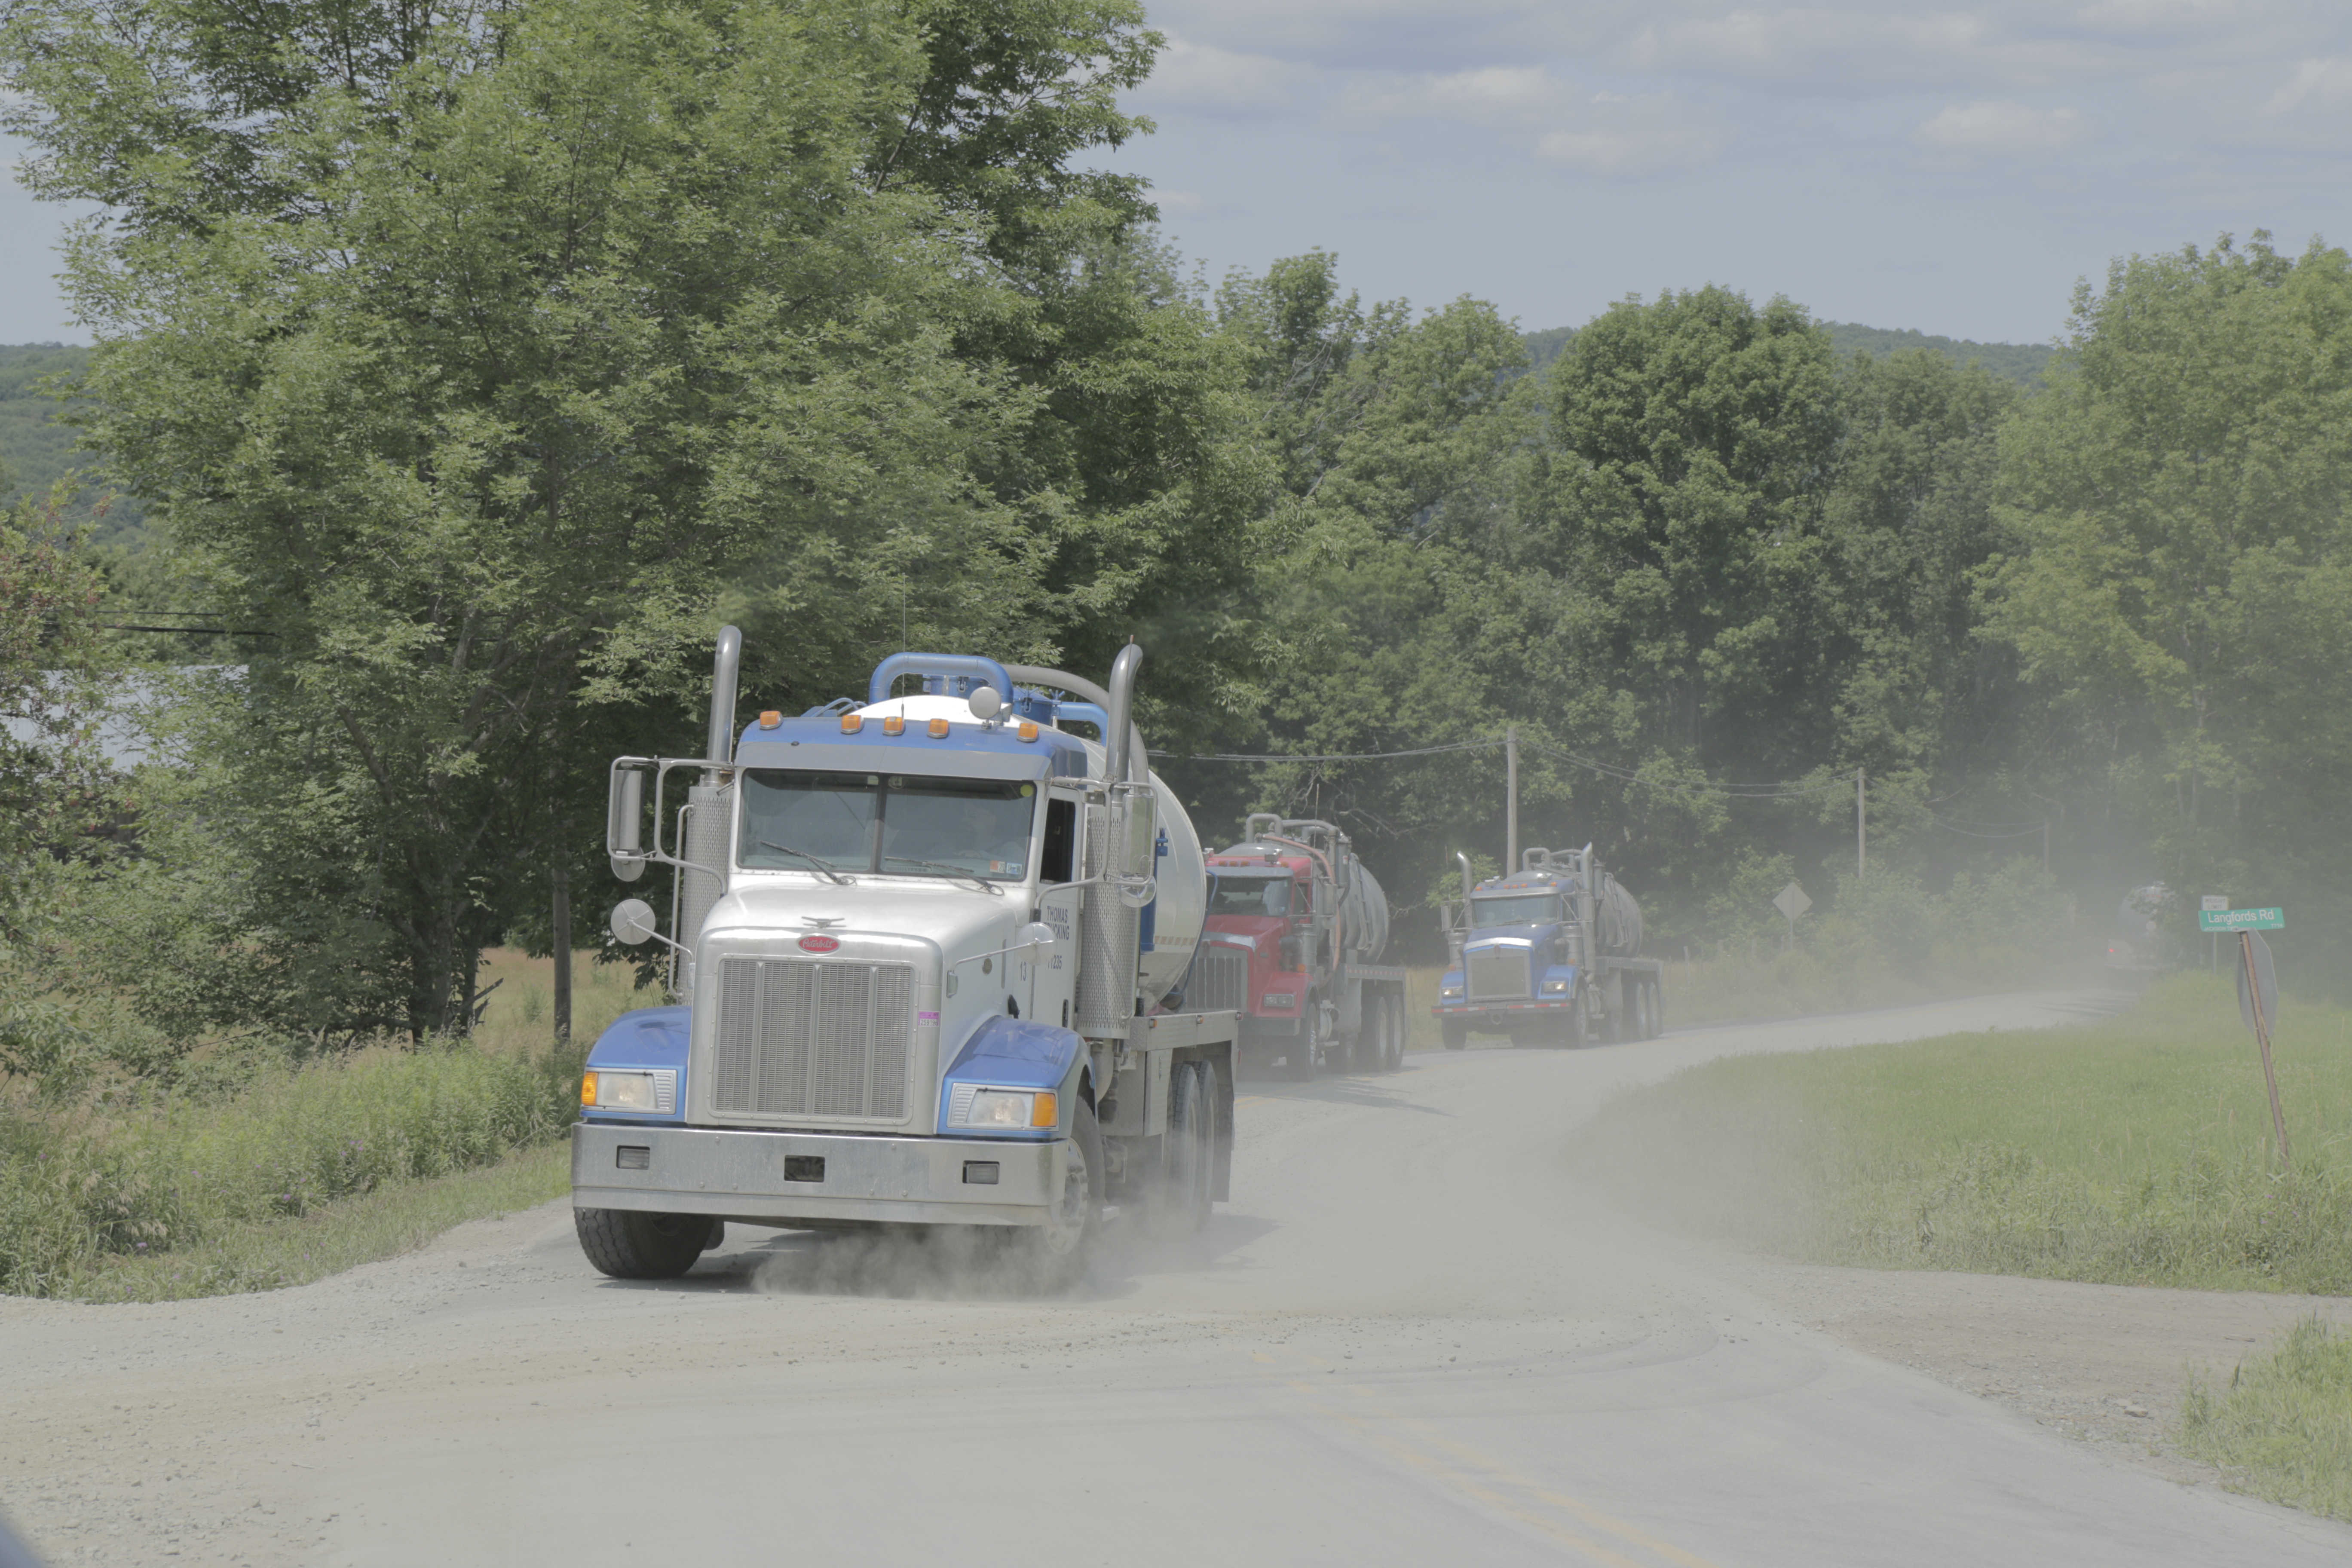
Caravan of trucks. Photo by Savanna Lenker, 2014.
Along with public safety and infrastructure costs, increased truck traffic associated with unconventional oil and gas extraction is found to be a major contributor to public health costs due to elevated ozone and particulate matter levels from increased emissions of heavy truck traffic and the refining and processing activities required.
In addition to ozone and particulate matter in the air, chemicals used for extraction and development also pose a serious risk. A recent study in the journal of Human and Ecological Health Assessment found that 37% of the chemicals used in drilling operations are volatile and could become airborne. Of those chemicals, more than 89% can cause damage to the eyes, skin, sensory, organs, respiratory and gastrointestinal tracts, or the liver, and 81% can cause harm to the brain and nervous system. Because these chemicals can vaporize, they can enter the body not only through inhalation, but also absorption through the skin.
The Union of Concerned Scientists note that air pollution from traffic may be worsened in North Dakota by the use of unpaved roads that incorporate gravel containing a fibrous mineral called erionite, which has properties similar to asbestos. Trucks driving over such gravel roads can release harmful dust plumes into the air, which could present health risks for workers and area residents
To address and solve these problems associated with heavy truck traffic, information is needed to assess both qualitatively and quantitatively the scope of the increased truck traffic and its impacts on communities. Collection and analysis of data, as well as community input, are needed to both understand the scope of the problem and to inform effective solutions.
Joining FracTracker’s Truck Counts
In response to community concerns about the impacts of increased truck traffic in their community, FracTracker has developed the Truck Count project to document the intensity of oil and gas traffic in your region, map heavy traffic locations, and offer networking opportunities for impacted communities.
Participation in FracTracker’s Truck Counts can provide grassroots organizations with a valuable opportunity to collect local data, engage volunteers, and educate stakeholders and the public. The data, pictures and narratives collected can be used to support concerned citizens’ efforts to reroute traffic from schools, playgrounds and other sensitive areas; to inform decision makers, public health researchers, and transportation agencies; to serve as a potential launching point for more detailed, targeted studies on public health and safety along with economic development analyses; to compare costs and benefits of oil and gas energy sources to the cost and benefits of energy conservation, efficiency and renewable energy.
Also, by sharing your community’s counts and stories on FracTracker.org, you serve other communities by increasing the awareness of the impacts of oil and gas truck traffic nationwide.
FracTracker’s Truck Counts provides the following resources to conduct the counts:
information and education on gas and oil truck identification,
data sheets for easy counting, and
tips for selecting safe and accessible counting locations in your community.
We look forward to working with you and supporting your community. If you are interested in working on this important crowdsourcing project with us, please contact:
In addition, a 2013 study from Resources for the Future found that shale gas development is linked to traffic accidents in Pennsylvania with a significant increase in the number of total accidents and accidents involving a heavy truck in counties with a relatively large degree of shale gas development as compared to counties with less (or no) development.
The 2013 Food and Water Watch Report finds similar correlations. Shale gas drilling was associated with higher incidents of traffic accidents in Pennsylvania. This trend was strongest in counties with the highest density of fracking wells. The decrease in the average annual number of total vehicle crashes was 39% larger in unfracked rural counties than in heavily fracked counties. (analysis based on data from US Census Bureau, PA DEP and PennDOT).
In a recent Karnes County, Texas analysis “Traffic accidents and fatalities have skyrocketed in the shale boom areas….with an increases of 1,000% in commercial motor vehicle accidents from 2008-2011.
According to a 2013 Texas Public Threat Safety Report, “In the three Eagle Ford Shale counties where drilling is most active, the number of crashes involving commercial vehicles rose 470 percent between 2009 and 2011. In the 17 counties that make up the Permian Basin, fatal car crashes involving commercial vehicles have nearly tripled from 14 in 2010 to 41 in 2012.
As a result of heavily using of publicly available infrastructure and services, fracking imposes both immediate and long-term costs on taxpayers. An Environment Texas study reveals that, “Trucks required to deliver water to a single fracking well cause as much damage to roads as 3.5 million car journeys, putting massive stress on roadways and bridges not constructed to handle such volumes of heavy traffic. Pennsylvania estimates that repairing roads affected by Marcellus Shale drilling would cost $265 million”.
Researchers from the RAND Corporation and Carnegie Mellon University looked at the design life and reconstruction cost of roadways in the Marcellus Shale formation in Pennsylvania. Their findings in Estimating the Consumptive Use Costs of Shale Natural Gas Extraction on Pennsylvania Roadways, note that local roads are generally designed to support passenger vehicles, not heavy trucks, and that “the useful life of a roadway is directly related to the frequency and weight of truck traffic using the roadway.” The study’s findings include:
“The estimated road-reconstruction costs associated with a single horizontal well range from $13,000 to $23,000. However, Pennsylvania often negotiates with drilling companies to rebuild smaller roads that are visibly damaged, so the researchers’ conservative estimate of uncompensated roadway damage is $5,000 and $10,000 per well.
While the per-well figure of $5,000-$10,000 appears small, the increasingly large number of wells being drilled means that substantial costs fall on the state: “Because there were more than 1,700 horizontal wells drilled [in Pennsylvania] in 2011, the statewide range of consumptive road costs for that year was between $8.5 and $39 million,” costs paid by state transportation authorities, and thus taxpayers.”
The feature photo at the top of the page was taken by Savanna Lenker, 2014.
https://www.fractracker.org/a5ej20sjfwe/wp-content/uploads/2014/09/TruckCounts.png400900FracTracker Alliancehttps://www.fractracker.org/a5ej20sjfwe/wp-content/uploads/2025/09/2025-Wordmark-Logo.pngFracTracker Alliance2014-09-11 15:18:072020-07-21 10:42:44Here They Come Again! The Impacts of Oil and Gas Truck Traffic
By Ted Auch, OH Program Coordinator, FracTracker Alliance
Both Ohio and West Virginia citizens are concerned about the increasing shale exploration in their area and how it affects water quality. Those concerned about the drilling tend to focus on the large quantities of water required to hydraulically fracture – or “frack” – Utica and Marcellus wells. Meanwhile those concerned with water quality cite increases in truck traffic and related spills. Concerns also exist regarding the large volumes of fracking waste injected into Class II Salt Water Disposal (SWD) wells primarily located in/adjacent to Ohio’s Muskingum River Watershed.
Injection Wells & Water Usage
While Pennsylvania and WV have drilled heavily into their various shale plays, OH has seen a dramatic increase in Class II Injection wells. In 2010 OH hosted 151 injection wells, which received 50.1 Million Gallons (MGs) per quarter in total – or 331,982 gallons per well. Now, this area has 1941 injection wells accepting 937.5 MGs in total and an average of 4.3 MGs per well.
In the second quarter of 2010 the Top 10 Class II wells by volume accounted for 45.87% of total fracking waste injected in the state. Fast forward to today, the Top 10 wells account for 38.87% of the waste injected. This means that the industry and OH Department of Natural Resources Underground Injection Control (ODNR UIC) are relying on 128% more wells to handle the 1,671% increase in the fracking waste stream coming from inside OH, WV, and PA. During the same time period, freshwater usage by the directional drilling industry has increased by 261% in WV and 162% in OH.
Quantity of Disposed Waste
With respect to OH’s injection waste story there appear to be a couple of distinct trends with the following injection wells:
— Long Run Disposal #8 in Washington and Myers in Portage counties. The changes reflect a nearly exponential increase in the amount of oil and gas waste being injected, with projected quarterly increases of 6.78 and 5.64 MGs. This trend is followed by slightly less dramatic increases at several other sites: the Devco Unit #11 is up 4.81 MGs per quarter (MGPQ).
— Groselle #2 is increasing at 4.21 MGPQ, and Ohio Oil Gathering Corp II #6 is the same with an increase of 4.03 MGPQ.
— Another group of wells with similar waste statistics is the trio of the Newell Run Disposal #10 (↑2.81 MGPQ), Pander R & P #15 (↑3.23 MGPQ), and Dietrich PH (↑2.53 MGPQ).
— The final grouping are of wells that came online between the fall of 2012 and the spring of 2013 and have rapidly begun to constitute a sizeable share of the fracking waste stream. The two wells that fall within this category and rank in the Top 10 are the Adams #10 and Warren Drilling Co. #6 wells, which are experiencing quarterly increases of 3.49 and 2.41 MGs (Figure 2).
Disposal of Out-of-State Waste
These Top 10 wells also break down into groups based on the degree to which they have, are, and plan to rely on out-of-state fracking waste (Figure 3). Five wells that have continuously received more than 70% of their wastestream from out-of-state are the Newell Run Disposal (94.4), Long Run Disposal (94.7%), Ohio Oil Gathering Corp (94.2%), Groselle (94.3%), and Myers (77.2%). This group is followed by a set of three wells that reflect those that relied on out-of-state waste for 17-30% of their inputs during the early stages of Utica Shale development in OH but shifted significantly to out-of-state shale waste for ≥40% of their inputs. (More than 80% of Pander R & P’s waste stream was from out-of-state waste streams, up from ≈20% during the Fall/Winter of 2010-11). Finally, there are the Adams and Warren Drilling Co. wells, which – in addition to coming online only recently – initially heavily received out-of-state fracking waste to the tune of ≥75% but this reliance declined significantly by 51% and 26% in the case of the Adams and Warren Drilling Co. wells, respectively. This indicates that demand-side pressures are growing in Ohio and for individual Class II owners – or – the expanding Stallion Oilfield Services (which is rapidly buying up Class II wells) is responding to an exponential increase in fracking brine waste internally.
Waste Sources
We know anecdotally that much of the waste coming into OH is coming from neighboring WV and PA, which is why we are now looking into directional well water usage in these two states. WV and PA have far fewer Class II wells relative to OH and well permitting has not increased significantly there. Here in Ohio we are experiencing not just an increase in injection waste volumes but also a steady increase in water usage. The average Utica well currently utilizes 6.5-8.1 million gallons of fresh water, up from 4.6-5.3 MGs during the Fall/Winter of 2010-11 (Figure 4). Put another way, water usage is increasing on a quarterly basis by 221-333K gallons per well2. Unfortunately, this increase coincides with an increase in the reliance on freshwater (+00.42% PQ) and parallel decline in recycled water (-00.54% PQ). In addition to declining in nominal terms, recycling rates are also declining in real terms given that the rate is a percentage of an ever-increasing volume. Currently the use of freshwater and recycled water account for 6.1 MGs and 0.33 MGs per well, respectively. Given the difference in freshwater and recycled water it appears there is an average 8,319 gallon unknown fluid void per well. The quality of the water used to fill the void is important from a watershed (or drinking water) perspective. The chemicals used in the process tend to be resistant to bio-degradation and can negatively influence the chemistry of freshwater.
WV Data
WV is experiencing similar increases in water usage for their directionally drilled wells; the average well currently utilizes 7.0-9.6 MGs of fresh water – up from 2.9-5.0 MGs during the Fall/Winter of 2010-11 (↑208%). This change translates into a quarterly increase in the range of 189-353K gallons per well3. The increase coincides with an increase in the reliance on freshwater (+00.34% PQ) and related decline in recycled water (-00.67% PQ). Currently, freshwater and recycled water account for 7.7 MGs and 0.61 MGs per well, respectively. Given the difference in freshwater and recycled water, there is an average of 22,750 gallons of unaccounted for fluids being filled by unknown or proprietary fluids (Figure 5).
Figure 1. Ohio Class II Number and Volumes in 2010 and 2014
Figure 2. Quarterly volumes accepted by Ohio’s Top Ten Class II Injection Wells with respect to hydraulic fracturing brine waste.
Figure 3. Ohio’s Top Ten Class II Injection Wells w/respect to hydraulic fracturing brine waste.
Figure 4. Total water usage per Utica well and recycled Vs freshwater percentage change across Ohio’s Utica Shale wells on a quarterly basis. Data are presented quarterly (Ave. Q3-2010 to Q2-2014)
Figure 5. Changes in WV water usage for horizontally/hydraulically fractured wells w/respect to recycled water (volume & percentages) & freshwater. Data are presented quarterly (Ave. Q3-2010 to Q2-2014)
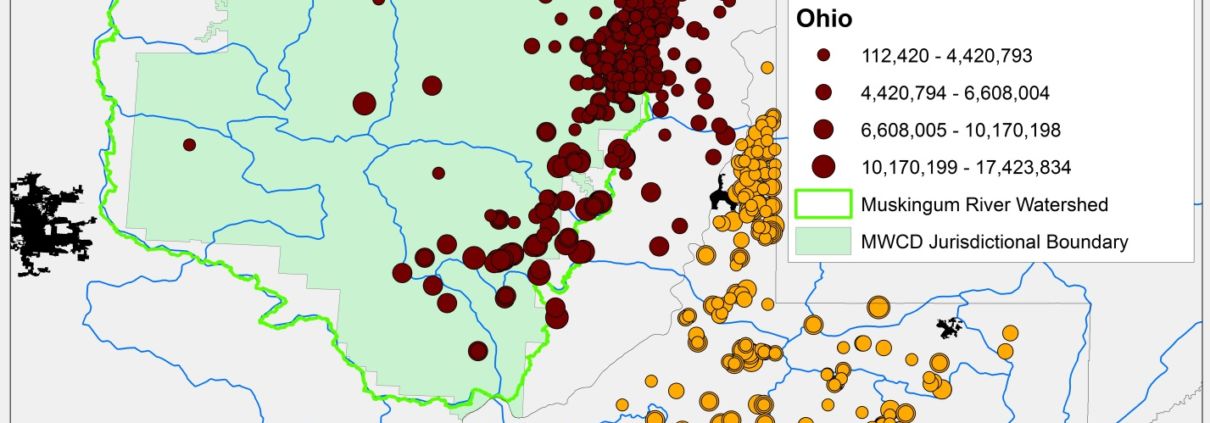
Figure 6. Unconventional drilling well water usage in OH (n = 516) and WV (n = 581) (Note: blue borders describe primary Hydrological Units w/the green outline depicting the Muskingum River watershed in OH).
The large range depends on whether you start your analysis at Q3-2010 or the aforementioned statistically robust Q3-2011.
The large range depends on whether you start your analysis at Q3-2010 or the more statistically robust Q3-2011.
MWCD water sales approved to date: 1) Seneca Lake for Antero: 15 million gallons at 1.5mm per day, 2) Piedmont Lake for Gulfport: 45 million gallons at 2 million per day, 3) Clendening for American Energy Utica: 60 million gallons at 2 million per day.
https://www.fractracker.org/a5ej20sjfwe/wp-content/uploads/2014/06/OH_WV_Water.jpg11051427Ted Auch, PhDhttps://www.fractracker.org/a5ej20sjfwe/wp-content/uploads/2025/09/2025-Wordmark-Logo.pngTed Auch, PhD2014-07-03 14:26:532020-07-21 10:42:40OH and WV Shale Gas Water Usage and Waste Injection
Water Resource Reporting and Water Footprint from Marcellus Shale Development in West Virginia and Pennsylvania
Report and summary by Meghan Betcher and Evan Hansen, Downstream Strategies; and Dustin Mulvaney, San Jose State University
The use of hydraulic fracturing for natural gas extraction has greatly increased in recent years in the Marcellus Shale. Since the beginning of this shale gas boom, water resources have been a key concern; however, many questions have yet to be answered with a comprehensive analysis. Some of these questions include:
What are sources of water?
How much water is used?
What happens to this water following injection into wells?
With so many unanswered questions, we took on the task of using publically available data to perform a life cycle analysis of water used for hydraulic fracturing in West Virginia and Pennsylvania.
Summary of Findings
Some of our interesting findings are summarized below:
In West Virginia, approximately 5 million gallons of fluid are injected per fractured well, and in Pennsylvania approximately 4.3 million gallons of fluid are injected per fractured well.
Surface water taken directly from rivers and streams makes up over 80% of the water used in hydraulic fracturing in West Virginia, which is by far the largest source of water for operators. Because most water used in Marcellus operations is withdrawn from surface waters, withdrawals can result in dewatering and severe impacts on small streams and aquatic life.
Most of the water pumped underground—92% in West Virginia and 94% in Pennsylvania—remains there, lost from the hydrologic cycle.
Reused flowback fluid accounts for approximately 8% of water used in West Virginia wells.
Approximately one-third of waste generated in Pennsylvania is reused at other wells.
As Marcellus development has expanded, waste generation has increased. In Pennsylvania, operators reported a total of 613 million gallons of waste, which is approximately a 70% increase in waste generated between 2010 and 2011.
Currently, the three-state region—West Virginia, Pennsylvania, and Ohio—is tightly connected in terms of waste disposal. Almost one-half of flowback fluid recovered in West Virginia is transported out of state. Between 2010 and 2012, 22% of recovered flowback fluid from West Virginia was sent to Pennsylvania, primarily to be reused in other Marcellus operations, and 21% was sent to Ohio, primarily for disposal via underground injection control (UIC) wells. From 2009 through 2011, approximately 5% of total Pennsylvania Marcellus waste was sent to UIC wells in Ohio.
The blue water footprint for hydraulic fracturing represents the volume of water required to produce a given unit of energy—in this case one thousand cubic feet of gas. To produce one thousand cubic feet of gas, West Virginia wells require 1-3 million gallons of water and Pennsylvania wells required 3-4 million gallons of water.
Table 1. Reported water withdrawals for Marcellus wells in West Virginia (million gallons, % of total withdrawals, 2010-2012)
Source: WVDEP (2013a). Note: Surface water includes lakes, ponds, streams, and rivers. The dataset does not specify whether purchased water originates from surface or groundwater. As of August 14, 2013, the Frac Water Reporting Database did not contain any well sites with a withdrawal “begin date” later than October 17, 2012. Given that operators have one year to report to this database, the 2012 data are likely very incomplete.
As expected, we found that the volumes of water used to fracture Marcellus Shale gas wells are substantial, and the quantities of waste generated are significant. While a considerable amount of flowback fluid is now being reused and recycled, the data suggest that it displaces only a small percentage of freshwater withdrawals. West Virginia and Pennsylvania are generally water-rich states, but these findings indicate that extensive hydraulic fracturing operations could have significant impacts on water resources in more arid areas of the country.
While West Virginia and Pennsylvania have recently taken steps to improve data collection and reporting related to gas development, critical gaps persist that prevent researchers, policymakers, and the public from attaining a detailed picture of trends. Given this, it can be assumed that much more water is being withdrawn and more waste is being generated than is reported to state regulatory agencies.
Data Gaps Identified
We encountered numerous data gaps and challenges during our analysis:
All data are self-reported by well operators, and quality assurance and quality control measures by the regulatory agencies are not always thorough.
In West Virginia, operators are only required to report flowback fluid waste volumes. In Pennsylvania, operators are required to report all waste fluid that returns to the surface. Therefore in Pennsylvania, flowback fluid comprises only 38% of the total waste which means that in West Virginia, approximately 62% of their waste is not reported, leaving its fate a mystery.
The Pennsylvania waste disposal database indicates waste volumes that were reused, but it is not possible to determine exactly the origin of this reused fluid.
In West Virginia, withdrawal volumes are reported by well site rather than by the individual well, which makes tracking water from withdrawal location, to well, to waste disposal site very difficult.
Much of the data reported is not publically available in a format that allows researchers to search and compare results across the database. Many operators report injection volumes to FracFocus; however, searching in FracFocus is cumbersome – as it only allows a user to view records for one well at a time in PDF format. Completion reports, required by the Pennsylvania Department of Environmental Protection (PADEP), contain information on water withdrawals but are only available in hard copy at PADEP offices.
In short, the true scale of water impacts can still only be estimated. There needs to be considerable improvements in industry reporting, data collection and sharing, and regulatory enforcement to ensure the data are accurate. The challenge of appropriately handling a growing volume of waste to avoid environmental harm will continue to loom large unless such steps are taken.
https://www.fractracker.org/a5ej20sjfwe/wp-content/uploads/2014/04/GasWellWaterWithdrawals.png732975FracTracker Alliancehttps://www.fractracker.org/a5ej20sjfwe/wp-content/uploads/2025/09/2025-Wordmark-Logo.pngFracTracker Alliance2014-04-04 09:31:062020-07-21 10:42:24Water Use in WV and PA
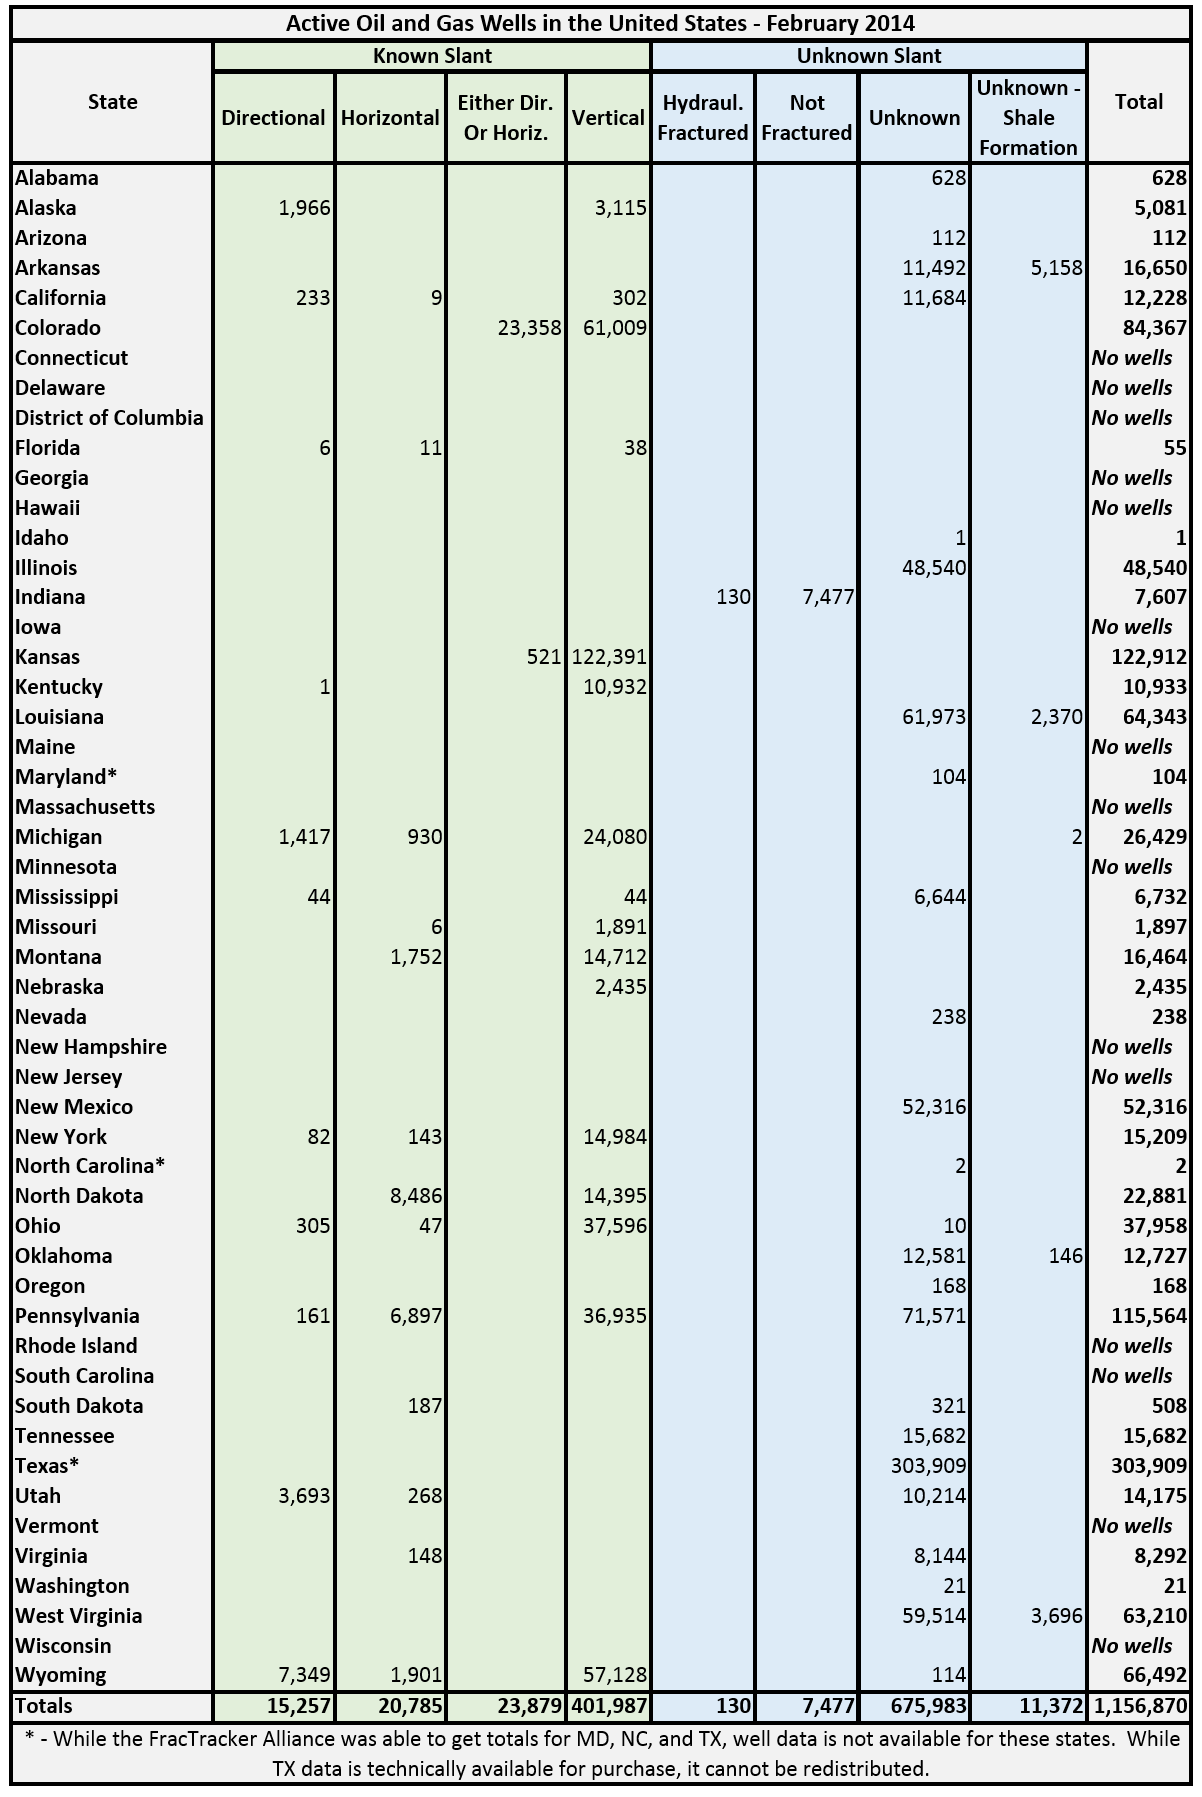
Many people ask us how many wells have been hydraulically fractured in the United States. It is an excellent question, but not one that is easily answered; most states don’t release data on well stimulation activities. Also, since the data are released by state regulatory agencies, it is necessary to obtain data from each state that has oil and gas data to even begin the conversation. We’ve finally had a chance to complete that task, and have been able to aggregate the following totals:
Oil and gas summary data of drilled wells in the United States.
While data on hydraulically fractured wells is rarely made available, the slant of the wells are often made accessible. The well types are as follows:
Directional: Directional wells are those where the top and the bottom of the holes do not line up vertically. In some cases, the deviation is fairly slight. These are also known as deviated or slant wells.
Horizontal: Horizontal wells are directional wells, where the well bore makes something of an “L” shape. States may have their own definition for horizontal wells. In Alaska, these wells are defined as those deviating at least 80° from vertical. Currently, operators are able to drill horizontally for several miles.
Directional or Horizontal: These wells are known to be directional, but whether they are classified as horizontal or not could not be determined from the available data. In many cases, the directionality was determined by the presence of directional sidetrack codes in the well’s API number.
Vertical: Wells in which the top hole and bottom hole locations are in alignment. States may have differing tolerances for what constitutes a vertical well, as opposed to directional.
Hydraulically Fractured: As each state releases data differently, it wasn’t always possible to get consistent data. These wells are known to be hydraulically fractured, but the slant of the well is unknown.
Not Fractured: These wells have not been hydraulically fractured, and the slant of the well is unknown.
Unknown: Nothing is known about the slant, stimulation, or target formation of the well in question.
Unknown (Shale Formation): Nothing is known about the slant or stimulation of the wells in question; however, it is known that the target formation is a major shale play. Therefore, it is probable that the well has been hydraulically fractured, with a strong possibility of being drilled horizontally.
Wells that have been hydraulically fractured might appear in any of the eight categories, with the obvious exception of “Not Fractured.” Categories that are very likely to be fractured include, “Horizontal”, “Hydraulically Fractured”, and “Unknown (Shale Formation),” the total of which is about 32,000 wells. However, that number doesn’t include any wells from Texas or Colorado, where we know thousands wells have been drilled into major shale formations, but the data had to be placed into categories that were more vague.
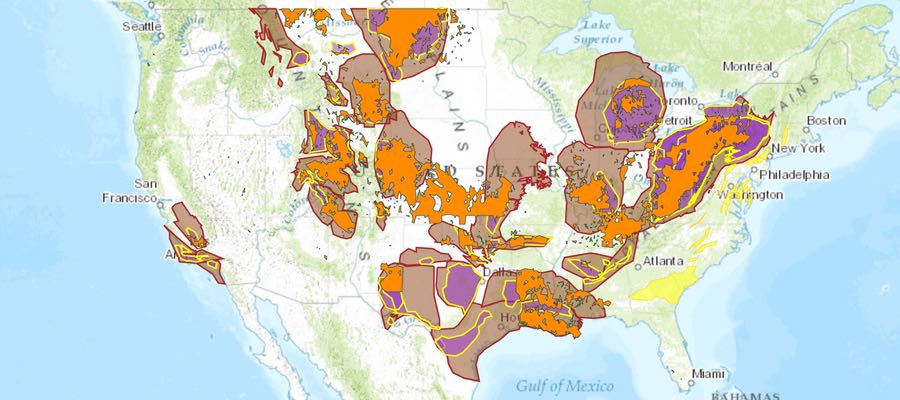
Oil and gas wells in the United States, as of February 2014. Location data were not available for Maryland (n=104), North Carolina (n=2), and Texas (n=303,909). To access the legend and other map tools, click the expanding arrows icon in the top-right corner.
The standard that we attempted to reach for all of the well totals was for wells that have been drilled but have not yet been plugged, which is a broad spectrum of the well’s life-cycle. In some cases, decisions had to be made in terms of which wells to include, due to imperfect metadata.
No location data were available for Maryland, North Carolina, or Texas. The first two have very few wells, and officials in Maryland said that they expect to have the data available within about a month. Texas location data is available for purchase, however such data cannot be redistributed, so it was not included on the map.
It should not be assumed that all of the wells that are shown in the map above the shale plays and shale basin layers are actually drilled into shale. In many cases, however, shale is considered a source rock, where hydrocarbons are developed, before the oil and gas products migrate upward into shallower, more conventional formations.
The raw data oil and gas data is available for download on our site in shapefile format.
https://www.fractracker.org/a5ej20sjfwe/wp-content/uploads/2014/03/US-ShaleViewer-Feature.jpg400900Matt Kelso, BAhttps://www.fractracker.org/a5ej20sjfwe/wp-content/uploads/2025/09/2025-Wordmark-Logo.pngMatt Kelso, BA2014-03-04 12:37:152020-07-21 10:41:55Over 1.1 Million Active Oil and Gas Wells in the US
By Brook Lenker, Executive Director, FracTracker Alliance
Touring Doddrige County, West Virginia
On September 26th, FracTracker staff and board member, Brian Segee, traveled to Doddridge County, West Virginia for an eye-popping tour. This endeavor was led by Diane Pitcock of West Virginia Host Farms and local activists who are deeply concerned about the fate of their region – an area overwhelmed by shale gas development.
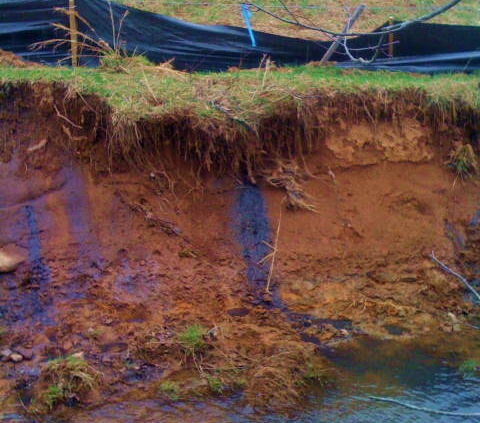
Approaching West Union on route 50, a giant flare roars above the roadway and about every fourth vehicle, mostly pickups, tankers, and dump trucks, suggest association with the shale gas industry. At the café in town, vehicles baring EQT logos fill the lot. Nearby, Middle Island Creek flows thick and brown despite an absence of rain for the past five days. Diane says it’s frequently muddy from the constant pipeline construction upstream.
Mark West site
The first stop is a Mark West complex with a cryogenic plant burning off excess hydrocarbons, a yard for loading CNG on tanker trucks, one well pad, and another in the works (see photo right). To build the latter, a hillside is being disemboweled. The heavy equipment and a train of idling trucks release diesel emissions. A stream once coursed through the field in the foreground, but the previous landowner had filled and relocated it without a permit. Watching and photographing from the adjoining rail trail, irony rules. The trail sign is topped by a company-placed “No Trespassing” sign. From the discussion and observations, it’s clear that the environment is being devalued and degraded in Doddridge County.
The tour continues on to a water withdrawal site. According to the permit numbers plastered beside the conduit, the site hosts approximately 50 unconventional gas wells – each requiring millions of gallons of water to crack the shale and hasten the flow of gas.
Right-of-Way?
Next, we traverse gravelly back roads widened by the industry. The roadway expansion often requires the purchase of right-of-way from landowners. Our guides tell us that if a landowner says no, sometimes they are told “if you don’t sell, we’ll take it by eminent domain.” The threat is hollow if not deceitful, since in such circumstances the industry has no right to exercise eminent domain. The industry does have the right to access mineral rights they may own, however, even if they don’t own the property on the surface. In West Virginia, these “split estate” situations are as common as country music, only they project a much more somber note to the landowner, especially when the gas company comes knocking.
A Neighbor’s Perspective
Well pad visit
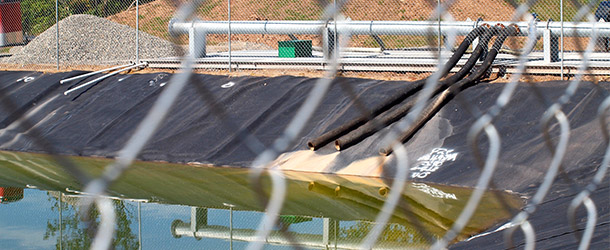
A freshly cut and clearcut road travels onward and upward across a half mile or more of former forest where a nice lady owns the land but not the natural gas being accessed more than a mile below. Piles of logs line the roadside, a reminder of what was. The road ends at a fenced impoundment holding thousands of gallons of impaired water. An odor, akin to antifreeze, hangs in the dry, dusty air. The lady tells the group about the wildlife she has seen, including the songbirds that rest on the high fence and likely drink from the poisonous reservoir.
Downhill lies an expansive well pad, big enough for a football game if there wasn’t the metallurgical din and sprawl of a towering drill rig and the pipes and machinery that accompany it. The landowner’s presence enables our group to enter the working well pad where workers, sleeping off a long shift, emerge from a trailer. While over 30 of her roughly 80 acres are affected by drilling-related activities, only a payment for timber is in negotiation. Meanwhile, she pays the taxes on the land – a parcel that will never quite be the same. Tom Bond, a local and well-informed activist, wistfully comments, “This is just the beginning. Eventually there will be well pads everywhere.” He may be right.
Pipeline Construction
A golden afternoon closes crossing steel plates over an open trench and green pipeline. The corridor is an undulating, exposed ribbon of ground spanning ridge to ridge in each direction. There are many more just like it snaking across the hills and hamlets of West Virginia from one compressor station to another.
From witnessing the industry’s heavy footprint to the stories we hear of problems emerging in home water wells, somehow a happy John Denver tune now seems melancholy.
West Virginia Shale Viewer. Please click the expanding arrows in the top right corner to access the legend and other map tools.
The map above shows some detail about Marcellus Shale operations in the Mountain State, including:
Permits issued (purple). To date, there have been 3,079 permits issued statewide since 2000 where the Marcellus Shale is the target formation.
Completed wells (orange). Of the permits that have been issued, the West Virginia Department of Environmental Protection (WVDEP) has received a completion form for 1,840 wells, or just under 60 percent.
Wells in noncompliance (yellow). 196 Marcellus wells were given the noncompliance flag in the dataset. There are no details on what might have led to this status, however.
Public comment wells (blue). 35 Marcellus Shale wells in West Virginia are flagged as having received a public comment of one sort or another. As with the wells in noncompliance, this dataset offers no details on these wells.
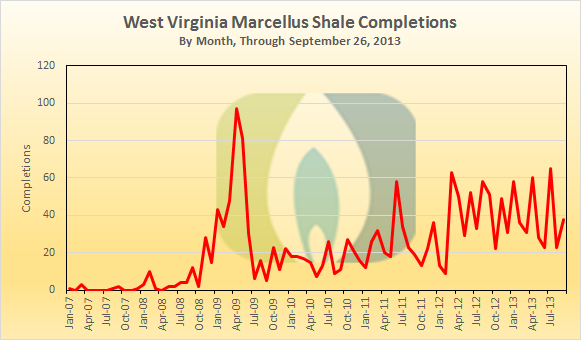
Here’s a look at the number of completion reports received by WVDEP by month:
Marcellus Shale completions by month in West Virginia
The largest number of completions per month for Marcellus Shale wells is 97 in April 2009. The next highest total was the following month, with 81 completions. From January through August of this year, there are an average of 40.5 completions per month in West Virginia.
The information that is distributed in this West Virginia data is typical, however, a good deal of data are being collected by WVDEP. To see the kinds of things that the state knows about completed wells, take a look at what is required for submission on form WR-35.
https://www.fractracker.org/a5ej20sjfwe/wp-content/uploads/2013/09/WV_comp_by_month1.png340581Matt Kelso, BAhttps://www.fractracker.org/a5ej20sjfwe/wp-content/uploads/2025/09/2025-Wordmark-Logo.pngMatt Kelso, BA2013-09-27 12:30:552020-07-21 10:41:34West Virginia Map Updated
Fire on McDowell B well site near Wetzel County, WV. Burned for 9 days. (Sept. 2010) Wetzel County Action Group photo, copyright of Ed Wade, Jr.
By Samantha Malone, MPH, CPH – Manager of Science and Communications
While I am a full-time staff member of FracTracker Alliance, like many other people I wear several hats. One of these is as an academic researcher and doctorate student in environmental health at Pitt. My academic research focuses on unconventional natural gas extraction and its potential impacts on health. However, trying to conduct research in such a controversial arena can be frustrating – at best. Access to well pads, pipelines, or other industrial areas is limited for a variety of reasons in Pennsylvania. The opportunity to discuss concerns with workers and residents is stifled by fear, red tape, and/or the desire to protect precious assets. I don’t blame people for being cautious about with whom they speak, but I truly wish it were easier to get close to drilling activity in person, without putting anyone’s lives or jobs in danger. My lamenting on that very subject one day resulted in a colleague telling me about The West Virginia Host Farms Program, a grassroots project launched by volunteer home owners residing near drilling activity.
The purpose of the program is to provide environmental researchers and the media with the chance to conduct research or simply to photograph a well pad in person from the safety of an adjacent host farm. In short, the network of volunteers help to develop research partnerships to better understand the impacts of drilling. Diane Pitcock, the program’s administrator, recognized the need for this initiative a few years ago as a surface rights owner. In WV many people are in “split-estate” situations, meaning that most surface owners do not own the mineral rights beneath their land. This issue is compounded by the fact that most of the minerals in WV are owned by people that do not even live in state. As such, the people who own the surface rights feel that their homes and livelihoods in some cases are at risk – without the potential for financial reimbursement from the sale of the mineral rights below their land. The program aims to show people that unconventional drilling using hydraulic fracturing is not our grandfather’s gas extraction process, and it can’t be treated as such.
The project operates out of 14 West Virginia counties where drilling is most active. The network of volunteers has aided in academic research based out of several universities including Yale and Duke. The project has also hosted out of state reporters and even international photojournalists, people who possess platforms to advance the outreach and public education effort surrounding unconventional drilling. For example, Jolynn Minaar, who produced the documentary, Un*earthed, visited from South Africa in 2012 as part of her field work. Journalists from alternet.org and polidoc.com have been among the area’s many inquirers, as well. Even if you don’t plan on taking a tour of WV drilling sites, you can still benefit from the project’s extensive, online photo gallery (see image above).
Despite the controversial nature of shale gas drilling, the growing utilization of the program is surely a success story. Based on the WV Host Farms model, additional host farm networks are being coordinated in PA and OH as we speak. Engaging people who can volunteer 30-40 hours per week is no easy task, however. As more federal research like the US EPA’s hydraulic fracturing study begins to get off of the ground and into the well, perhaps even more people will support and recognize the value of such an integral, on-the-ground resource in the WV Host Farms Program. I know this researcher does!
For more information:
Diane L. Pitcock, Program Administrator
The WV Host Farms Program
P.O. Box 214, West Union, WV, 26456
304-873-3764
(e) wvhostfarms@yahoo.com
(w) www.wvhostfarms.org
Permits data for Marcellus Shale wells in West Virginia has recently been updated on FracTracker’s DataTool
[map archived]
Astute viewers will note that there is a well drawn in the Athens, OH area, a good 20 miles from the West Virginia border as the crow flies. As it turns out, this is not the most egregious error; if you zoom out, you will see purple dots in Indiana and North Carolina as well, neither of which are are even contiguous with West Virginia. There were also about five wells that I deleted the location data for, because I could tell at a glance that they would have drawn well south of the Tropic of Cancer.
These data errors are a shame, because they compromise the experience of an otherwise slick data delivery system, where viewers can pick permits from a given formation, see them draw on a map, and then download the data. The data are fairly bare-bones in nature, consisting of just six columns, but this is not something that I have a quarrel with, as it includes the information that most people want to know, including where the well is, who is responsible for it, when the permit was issued, and the unique well number. And we already know, based on download parameters, what the target formation of the well is.
While only a handful of wells are affected by faulty location data, 330 out of 2,688 wells in the dataset lack permit issue dates, or just over 12 percent of the wells. This is significant enough to make the result of any trend analysis questionable. Nonetheless, let’s proceed to have a look, keeping relevant caveats in mind:
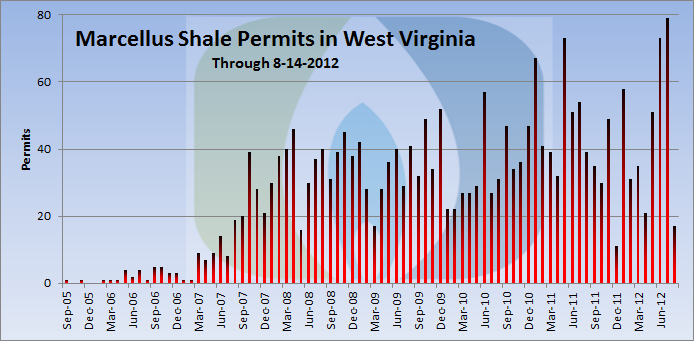
Marcellus Shale permits issued per month in West Virginia
While the number of permits per month is fairly erratic in West Virginia, it is clear that the last full month–July 2012–saw the largest number of permit issued in the Marcellus ever, and that June 2012 is tied for second. West Virginia clearly is not seeing the same contraction of unconventional gas activity that Pennsylvania is.
Like its neighbors, Pennsylvania and Ohio, Chesapeake has the largest number of permits for unconventional gas permits. Unlike Ohio, where the operator’s share was over 70 percent of the total of the Utica, here the plurality is just 17 percent of Marcellus Wells.
https://www.fractracker.org/a5ej20sjfwe/wp-content/uploads/2025/09/2025-Wordmark-Logo.png00Matt Kelso, BAhttps://www.fractracker.org/a5ej20sjfwe/wp-content/uploads/2025/09/2025-Wordmark-Logo.pngMatt Kelso, BA2012-08-14 15:02:292020-07-21 10:40:01Updated West Virginia Permits Data
This past January, when Ohio was still in the midst of the bidding war for the proposed cracker facility, Toledoans saw the following blurb in their paper, the Toledo Blade:
Gov. John Kasich is pursuing the multibillion-dollar ethane-cracker facility that Shell Chemicals LP plans to build in Ohio, West Virginia, or Pennsylvania to capitalize on the increasing harvest of natural gas from Marcellus shale. The American Chemistry Council estimates that the plant would generate 17,000 jobs in chemistry and other industries as well as $1 billion in wages and $169 million in tax revenue.
That’s some financial impact, right? And now we are hearing the same figure coming out of Harrisburg via the Post-Gazette:
Estimates from the American Chemical Council have projected that a $3.2 billion ethane-processing facility, similar to the one that Shell is considering for Beaver County, would create more than 17,000 new jobs at the plant itself and among spinoff businesses along the supply chain.
Too bad it is isn’t very realistic.
Although the planned Monaca plant is one of several new cracker facilities planned in North America, currently, there are just a handful on the continent. In January, I posted about one of them, a Shell facility in Norco, Louisiana. On their website, the multinational giant proudly proclaims the following, in bold type:
Shell Chemicals’ Norco facility is located in St. Charles Parish. The facility has over 600 full-time employees, more than 160 contractors, and generates an annual payroll of $50 million. The company pays more than $16 million in state and local taxes and $6M is property taxes that help fund public education as well as police and fire departments.
As I mentioned five months ago, those are significant contributions, to be sure. But it is a far cry from the projections of the American Chemistry Counsel (ACC) state above. Shell also operates another cracker in Deer Park, Texas, which claims:
Shell Deer Park is a 1,500-acre complex located in Deer Park, Texas, approximately 20 miles east of downtown Houston along the Houston Ship Channel. Founded in 1929, Shell Deer Park is now home to 1,700 employees who operate a fully integrated refinery and petrochemical facility 24 hours a day.
That’s a lot of jobs, but as an integrated facility, it already accounts for some of the “spinoff businesses along the supply chain”.
Nova Chemicals operates another cracker in Sarnia, Onterio, which according to their website employs about 900 people who earn an estimated $86 million in wages and benefits each year.
So how silly is the claim of 17,000 jobs and $1 billion in wages? Consider that with all of its existing crackers and other facilities,
“Shell chemicals companies staff total 8,500 worldwide. The majority of these support our manufacturing operations. This does not include joint venture employees.”
Even with the JV employees not being counted, we are talking about major petrochemical plants in nine locations around the world, plus three technology centers. So just who are these experts at the ACC who keep getting quoted for the 17,000 job figure? According to website:
The American Chemistry Council’s (ACC’s) mission is to deliver business value through exceptional advocacy using best-in-class member performance, political engagement, communications and scientific research.
Well played, ACC. You have put on a best-in-class performance with your exceptional advocacy. But for the rest of us, it is time to start considering more realistic jobs numbers when talking about the proposed ethylene producing facility.


 The use of hydraulic fracturing for natural gas extraction has greatly increased in recent years in the Marcellus Shale. Since the beginning of this shale gas boom, water resources have been a key concern; however, many questions have yet to be answered with a comprehensive analysis. Some of these questions include:
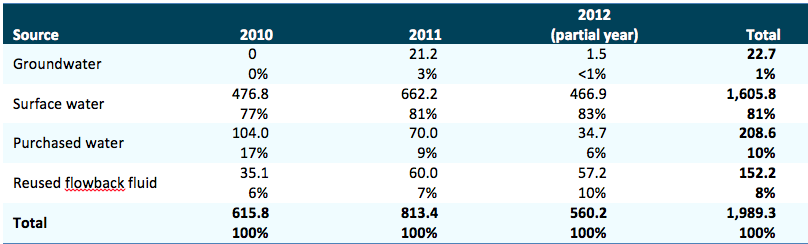


 Wetzel County Action Group photo, copyright of Ed Wade, Jr.")