Dunes, Great Lakes Barrens at Risk

World Class Dunes and Great Lakes Barrens at Risk at Ludington

By Dave Dister, Consulting Ecologist, Ludington, MI

One of the prime reasons I moved to the Ludington, Michigan area in 2008 was the aesthetic and biological diversity evident at Ludington State Park (LSP). As a field biologist nearing the end of his formal career, I was eager to conduct a study of the vascular plants within the 5,300-acre park. That study consumed six years of exploring all habitats and ecosystems, and documenting (by vouchers) the flora I encountered. Although the unfortunate presence of the Sargent Sand Company operation was obvious as it cut through the south end of the park, it was not until the fracking boom a few years ago that I took special notice as a residential neighbor.

US Frac Sands and Silica Geology Map


View map fullscreen | How FracTracker maps work

Above is a dynamic map of silica sands and frac sand mines, drying facilities, and other related facilities. Zoom and click on the map to explore various aspects of frac sand mining infrastructure. Click here to view the map full screen along with its legend.

Expanding Sand Mining

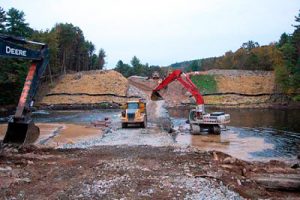
That “sleepy” sand mining operation suddenly turned into a 24-hour, seven-days-a-week operation, with associated noise that irritated a very light-sleeping biologist. Hamlin Township officials were only partially effective in addressing residential impacts “after hours,” and had no interest in developing reasonable ordinances upon a commercial operation. Although increased noise and truck traffic were a tangible nuisance, only when a renewal of the company’s sand mining permit was announced did it become clear that biological resources within the 372-acre private in-holding were afforded virtually no protection at all. And the more research I did into the regulatory permitting process, the more incredulous the situation appeared.


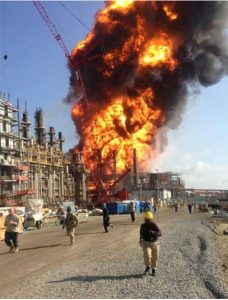
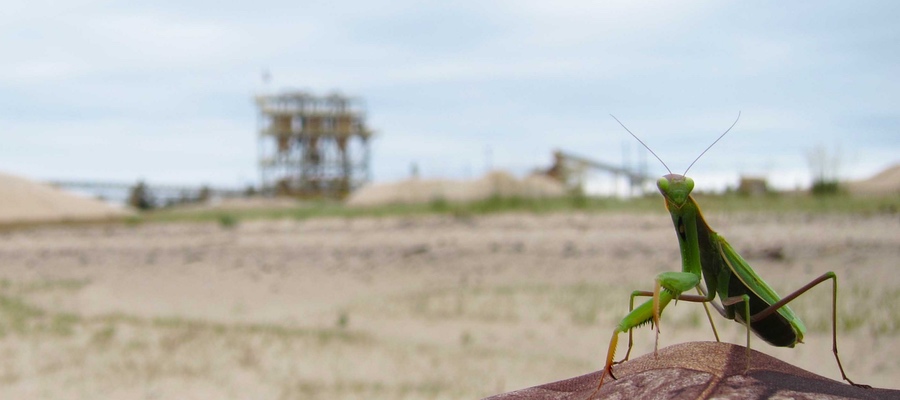
Above – Photos of Sargent Sands frac sand mining operations taken by Ted Auch, FracTracker Alliance

1979 Environmental Impact Report

My expertise as a wetlands biologist and botanist were well suited to scrutinizing the 1979 Environmental Impact Report (EIR), which was a hastily-compiled poorly-researched 24-page document.

From my perspective, there was a poor level of protection afforded to the Federal and State Threatened Pitcher’s Thistle (Cirsium pitcheri). As far as is known, Sargent Sand has no records of relocating this plant in proposed or active mining cells in its 100-year history of mining, although the Michigan Department of Natural Resources (MDNR) has known about plants on the property for more than 20 years. The MDNR and US Fish and Wildlife Service (USFWS) have been complicit in not adequately protecting this species, which has had minimal research into the success (or not) of transplanting individual plants. Young plants appear to transplant well, but long-term studies are not available. Older plants are much less likely to survive transplanting, as they depend on numerous minute root hairs to absorb moisture in a xeric habitat, and removal from a dune would strip-off most such root hairs. It requires about seven years for these plants to mature, so reproductive rates are slow.

Yep, it’s a fact of life – plants simply are not nearly as charismatic as animals, and consequently are treated as “second-class organisms” in the world of environmental protection. Sadly, the Michigan Department of Environmental Quality (MDEQ) just renewed the sand mining permit that allows Sargent Sand to “self-monitor” for this threatened species, and to “move plants” encountered in areas proposed for development. Does anyone really think a mining company will give two hoots about a thistle plant?!

Great Lakes Barrens Ecosystem

The rarity and value of Great Lakes Barrens (GLB) was not addressed when the 1979 EIR was written, though such ecosystems are clearly visible on aerial photographs of Sargent Sand Company property and surrounding LSP. These natural communities are known to be imperiled ecosystems at both the state and global levels. The Michigan Natural Features Inventory classifies “Great Lakes Barrens” – that include jack pine stands with associated xeric-loving shrubs and forbs – as S2 natural communities:

Imperiled in the state because of rarity due to very restricted range, very few occurrences, steep declines, or other factors making it very vulnerable to extirpation from the state. – Michigan Natural Features Inventory

Globally, Great Lakes Barrens have a similar designation. Consequently, mitigation measures must be strengthened and avoidance of impacts considered. Any Restoration Plan of such habitats must include high quality GLB plants such as buffaloberry (Shepherdia canadensis), bearberry (Arctostaphylos uva-ursi), ground juniper (Juniperus communis), sand cherry (Prunus pumila), sand-dune willow (Salix cordata), blueleaf willow (Salix myricoides), beach-heath (Hudsonia tomentosa), harebell (Campanula rotundifolia), white camas (Anticlea elegans), and wild wormwood (Artemisia campestris), among others.

Again, unfortunately the MDNR has not enforced strong protections against the destruction of Great Lakes Barrens. The “reclamation” of destroyed dunes and jack pine barrens for a mere “one-year period at 80 percent vegetative cover” comes nowhere close to a viable mitigation plan, as trees and shrubs impacted in such areas take decades to recover.

Furthermore, other state-listed plants, such as ram’s head lady-slipper orchid (Cypripedium arietinum) are known to be adjacent to Sargent Sand property but are not legally protected as they are only “Special Concern” species. Lastly, the Lake Huron locust (Trimerotropsis huroniana) is a state Threatened insect known to occur within Ludington State Park, and suitable “sparsely vegetated dune” habitat is common within Sargent Sand’s property. If you thought rare plants get little respect, try to protect a threatened grasshopper!

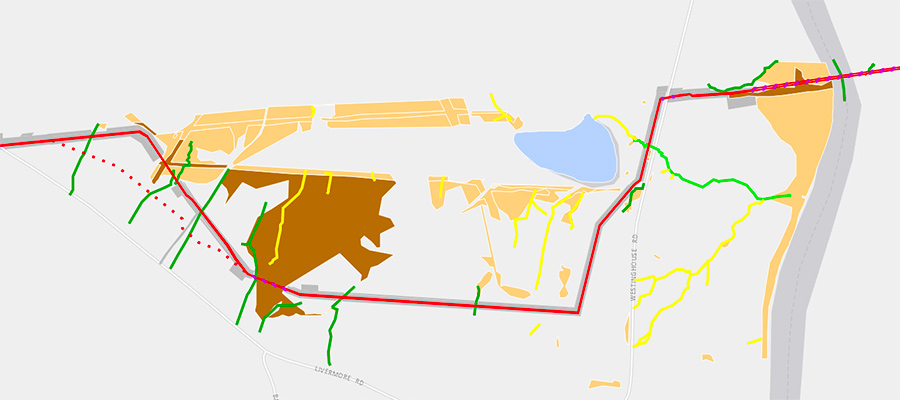
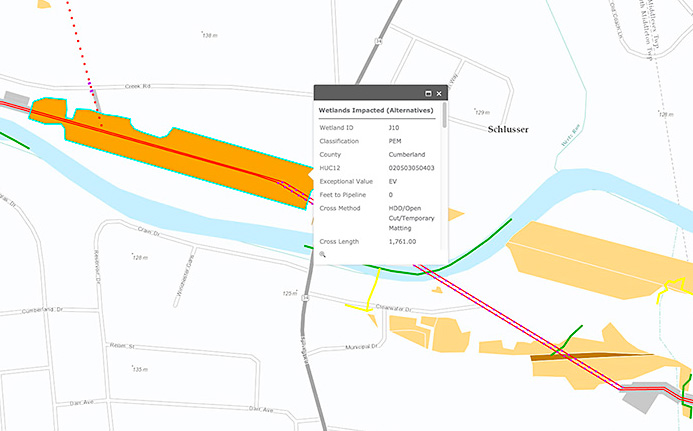
Great Lakes Barrens often include seasonal wetlands that are protected under Section 404 of the Clean Water Act of 1972, but which often lack surface waters much of the year. Not surprisingly, the 1979 EIR does not mention “wetlands” at all. At best, there is a comment that “There are three or four very small swamp areas on the property…”  However, a review of recent aerial photography indicates many Interdunal Wetlands remain within the northern half of Sargent Sand property. The largest of these appears to be at least 0.5 acre in size, and it is likely that several acres of such wetlands exist on the property.

Consequently, a formal Wetland Delineation is needed to determine the exact location and amount of Jurisdictional Wetlands on Sargent Sand property. Any impact to such wetlands requires mitigation measures that include avoidance, minimization, and/or wetland creation elsewhere within the watershed. Additionally, Interdunal Wetlands are ranked S2 Natural Communities by the State of Michigan, and have a rank of G2 globally. Both of these designations indicate these areas are “Imperiled,” so mitigation ratios should be high (e.g., 10:1 or 20:1).

Current Political Climate in Ludington

The current political leadership in Michigan, as well as the nation, has presented a formidable challenge for environmentalists and scientists. Additionally, the system certainly appears rigged when the agency – the MDEQ – that issues permits and permit renewals is also a lobbyist for the oil, gas, and minerals industry. Nevertheless, the battle to protect this natural heritage is a noble and vital one that will persist. As with every other sensitive and rare environmental resource, if no one scrutinizes the lax protection of our natural heritage, before you know it, it will be gone.

Northern Access Project - pipeline map

Northern Access Project: Exporting PA’s Marcellus Gas Northward

In March 2015, the National Fuel Gas Supply Corporation and Empire Pipeline Company filed a joint application with the Federal Energy Resource Commission (FERC) to construct a new natural gas pipeline and related infrastructure, known collectively as the Northern Access Project (NAPL). The pricetag on the project is $455 million, and is funded through international, as well as local, financial institutions. The Public Accountability Initiative recently produced a report detailing the funding for this pipeline project, entitled “The Power Behind the Pipeline“.

The proposed Northern Access Project consists of a 97-mile-long, 24” pipe that would carry Marcellus Shale gas from Sergeant Township (McKean County), PA, to the Porterville Compressor Station in the Town of Elma (Erie County), NY. Nearly 69% of the proposed main pipeline will be co-located in existing pipeline and power line rights-of-way, according to FERC. The agency says this will streamline the project and reduce the need to rely on eminent domain to most efficiently route the project.

A $42 million, 15,400 horsepower Hinsdale Compressor Station along the proposed pipeline route was completed in 2015. In addition to the pipeline itself, the proposed project includes:

  • Additional 5,350 HP compression at the existing Porterville Compressor Station, a ten-fold increase of the capacity of that station
  • A new 22,214 HP compressor station in Pendleton (Niagara County), NY
  • Two miles of pipeline in Pendleton (Niagara County), NY
  • A new natural gas dehydration facility in Wheatfield (Niagara County), NY
  • An interconnection with the Tennessee Gas Pipeline in Wales (Erie County), NY, as well as tie-ins in McKean, Allegany, and Cattaraugus counties
  • A metering, regulation and delivery station in Erie County
  • Mainline block valves in McKean, Allegany, Cattaraugus and Erie counties; and
  • Access roads and contractor/staging yards in McKean, Allegany, Cattaraugus and Erie counties

Map of Proposed Northern Access Project


View map fullscreen | How FracTracker maps work

The above map shows the proposed pipeline (green) and related infrastructure (bright pink). The pale yellow and pink lines on the map are the existing pipelines that the Northern Access Project would tie into. Click here to explore the map fullscreen.

Project Purpose

National Fuel maintains that the goal of the proposed project would be to supply multiple markets in Western New York State and the Midwest. The project would also supply gas for export to Canada via the Empire Pipeline system, and New York and New England through the Tennessee Gas Pipeline 200 Line. The company anticipates that the project would be completed by late 2017 or early 2018. Proponents are hoping that NAPL will keep fuel prices low, raise tax revenues, and create jobs.

Push-back against this project has been widespread from citizens and environmental groups, including Sierra Club and RiverKeeper. This is despite an environmental assessment ruling in July 2016 that FERC saw no negative environmental impacts of the project. FERC granted a stamp of approval for the project on February 4, 2017.

Concerns about the Proposed Pipeline

The Bufffalo-Niagara Riverkeeper, asserts that the project presents multiple threats to environmental health of the Upper Lake Erie and Niagara River Watersheds. In their letter to FERC, they disagreed with the Commission’s negative declaration that the project would result in “no significant impact to the environment.” The pipeline construction will require crossings of 77 intermittent and 60 perennial streams, 19 of which are classified by the New York State Department of Environmental Conservation (NYS DEC) as protected trout streams. Twenty-eight of the intermittent streams impacted also flow into these protected streams. Resulting water quality deterioration associated with bank destabilization, increased turbidity, erosion, thermal destabilization of streams, and habitat loss is likely to impact sensitive native brook trout and salamanders. Riverkeeper found that National Fuel’s plan on how to minimize impacts to hundreds of wetlands surround the project area was insufficient. FERC’s Environmental Assessment of the project indicated that approximately 1,800 acres of vegetation would affected by the project.

Several groups have also taken issue with the proposed project’s plan to use the “dry crossing” method of traversing waterways. Only three crossings will be accomplished using horizontal directional drilling under the stream bed — a method that would largely protect the pipes from dynamic movement of the stream during floods. The rest will be “trenched” less than 5 feet below the stream bed. Opponents of the project point out that NYSDEC, federal guidelines, and even industry itself discourage pipe trenching, because during times of high stream flow, stream scour may expose the pipes to rocks, trees, and other objects. This may lead to the pipes leaking, or even rupturing, impacting both the natural environment, and, potentially, the drinking water supply.

A December 2016 editorial to The Buffalo News addressed the impacts that the proposed Northern Access Project could have to the Cattaraugus Creek Basin Aquifer, the sole source of drinking water for 20,000 residents in surrounding Cattaraugus, Erie, and Wyoming counties in New York. In particular, because the aquifer is shallow, and even at the surface in some locations, it is particularly vulnerable to contamination. The editorial took issue with the absence of measures in the Environmental Assessment that could have explored how to protect the aquifer.

Other concerns include light and noise pollution, in addition to well-documented impacts on climate change, created by fugitive methane leakage from pipelines and compressors.

NYSDEC has held three public hearings about the project already: February 7th at Saint Bonaventure University (Allegany, NY), February 8th at Iroquois High School (Elma, NY), February 9th at Niagara County Community College (Sanborn, NY). The hearing at Saint Bonaventure was attended by nearly 250 people.

While FERC approved the project on February 4, 2017, the project still requires approvals from NYSDEC – including a Section 401 Water Quality Certification. These decisions have recently been pushed back from March 1 to April 7.

Proponents for the project – particularly the pipefitting industry – have emphasized that it would create up to 1,700 jobs during the construction period, and suggested that because of the experience level of the construction workforce, there would be no negative impacts on the streams. Other speakers emphasized National Fuel’s commitment to safety and environmental compliance.

Seneca Nation President Todd Gates expressed his concerns about the gas pipeline’s impacts on Cattaraugus Creek, which flows through Seneca Nation land (Cattaraugus Indian Reservation), and is downstream from several tributaries traversed by the proposed pipeline. In addition, closer to the southern border of New York State, the proposed pipeline cuts across tributaries to the Allegheny River, which flows through the Allegany Indian Reservation. One of New York State’s primary aquifers lies beneath the reservation. The closest that the proposed pipeline itself would pass about 12 miles from Seneca Nation Territory, so National Fuel was not required contact the residents there.

Concerns about Wheatfield dehydration facility & Pendleton compressor station

According to The Buffalo News, National Fuel has purchased 20 acres of land from the Tonawanda Sportsmen’s Club. The company is building two compressors on this property, totaling 22,000 HP, to move gas through two miles of pipeline that are also part of the proposed project, but 23 miles north of the primary stretch of newly constructed pipeline. Less than six miles east of the Pendleton compressor stations, a dehydration facility is also proposed. The purpose of this facility is to remove water vapor from the natural gas, in accordance with Canadian low-moisture standards. According to some reports from a National Fuel representative, the dehydration facility would run only a few days a year, but this claim, has not been officially confirmed.

Residents of both Pendleton and Wheatfield have rallied to express their concerns about both components of the project, citing potential impacts on public health, safety, and the environment relating to air and water quality.

Northern Access Project Next Steps

The deadline for public comment submission is 5 pm on February 24, 2017 — less than two weeks away. To file a comment, you can either email NYS DEC directly To Michael Higgins at NFGNA2016Project@dec.ny.gov, or send comments by mail to NYS DEC, Attn. Michael Higgins, Project Manager, 625 Broadway, 4th Floor, Albany, NY 12233.


Note: this article originally stated that the Porterville Compressor Station would double its capacity as a result of the NAPL project. In fact, the capacity increase would be ten-fold, from 600 hp to about 6000 hp. We regret this error.


by Karen Edelstein, Eastern Program Coordinator, FracTracker Alliance

Power Plants & Other Facilities Now on Ohio Oil & Gas Map

Over the last few months we’ve been busy working on some updates to our Ohio Oil & Gas Map. Check out what we’ve added recently and explore the map below!

New: Power Plants & ATEX Pipeline

We now have the locations of eight of the credible natural gas power plants proposed in Ohio, along with the jobs they cite during construction and operations. We also now have a complete inventory of 118 existing power plants, including 25 natural gas facilities. Together, these plants would produce 7,660 megawatts, around 957 per facility.

Six of these plants are either in the heart of Ohio’s Utica Shale or within several miles of the 1,200+ mile Appalachia-to-Texas (ATEX) pipeline. ATEX was installed to transport 190,000 barrels per day (BPD) of natural gas liquids (NGLs) from the Marcellus and Utica region to the Texas and Louisiana Gulf Goast refinery corridor. The 360 mile segment of this pipeline that runs from Pennsylvania to south central Jackson County, Indiana is also now shown on the Ohio Oil & Gas Map.

Late Permitting Increases

Cumulative and Monthly Ohio Utica Hydraulic Fracturing Well Permits

Figure 1. Cumulative and monthly hydraulic fracturing well permits in Ohio’s Utica Shale

While many shale plays across the United States are experiencing a period of contraction (with low gas prices often cited as the primary reason), drilling activity in Ohio’s Utica Shale has been experiencing a slow and steady expansion. The region has seen more than 2,700 permitted wells as of the end of January 2017. Incidentally, roughly 59% of these wells are producing either oil or gas as of Q3-2016. For more information on that subject, explore our production map.

The permitting trajectory hit a low of 13-16 permits per month between February and January of 2016. Since the presidential election in November, however, permitting rates have more than doubled (Figure 1).

Ohio Oil & Gas Map

Ohio sits on the western edge of both the Utica and Marcellus Shale formations, but conditions are such that the Marcellus Shale is all but being ignored in Ohio. Explore our updated map of OH drilling activity and related facilities below:


View map fullscreen | How FracTracker maps work

Map Layers

The map above is made up of various datasets, from the location of permits to compressor stations. These “map layers” make up the legend. Below we describe each layer on the map, as well as the data source and date range.


Horizontal Marcellus Permits, Laterals
There have been 40+ permits issued for horizontal wells in Ohio’s Marcellus Shale.

Source:   Ohio Department of Natural Resources
Date Range:  December 2009 – Present


Horizontal Utica Permits
An aggregate of ODNR’s monthly cumulative Utica and Marcellus permits as well as a more detailed weekly Risk Based Data Management System (RBDMS) Microsoft Access inventory. At the present time Ohio is home to 2,160+ permitted Utica Wells with the wells broken out by status. Additionally this layer contains depth, water usage, sand usage, HCl, and Gelling Agent percentage for 249 wells based on data provided to FracFocus. Finally, we have incorporated production in various units from individual industry press releases and the ODNR annual report.

Source:   Ohio Department of Natural Resources
Date Range:  December 2009 – Present


Horizontal Utica Permits actual and straight line laterals
An aggregate of ODNR’s monthly cumulative Utica and Marcellus permits as well as a more detailed weekly Risk Based Data Management System (RBDMS) Microsoft Access inventory. At the present time we have straight line laterals for all drilled, drilling, and producing wells as well as actual PLAT laterals for 341 of the wells.

Source:   Ohio Department of Natural Resources
Date Range:  December 2009 – Present


High Volume Hydraulic Fracturing Gathering Lines
All gathering lines servicing Ohio’s inventory of High Volume Hydraulic Fracturing (HVHF) wells.

Source:   Herbert Hoover Foundation grant
Date Range:  December 2009 – 2015


High Volume Hydraulic Fracturing Well Pads
The well-pads of all Ohio’s drilled or producing High Volume Hydraulic Fracturing (HVHF) wells.

Source:   Herbert Hoover Foundation grant
Date Range:  December 2009 – 2015


High Volume Hydraulic Fracturing Well Pad’s Limits Of Disturbance (LOD)
Limits Of Disturbance (LOD) for all Ohio’s drilled or producing High Volume Hydraulic Fracturing (HVHF) well-pads.

Source: Herbert Hoover Foundation grant
Date Range:  December 2009 – 2015


Compressor Stations and Cracking Facilities
Boundaries of several confirmed High Volume Hydraulic Fracturing (HVHF) servicing cracking and compressor station facilities.

Source:   Herbert Hoover Foundation grant
Date Range:  December 2009 – 2015


Ohio Active Class II Injection Wells
This data speaks to the state’s “Active” Class II Injection wells able to accept hydraulic fracturing waste. There are 240+ Active Wells with 51 having yet to receive waste from hydraulic fracturing. For more on Ohio’s Class II Inventory in depth refer to our recent Ohio Fracking Waste Transport & Disposal Network article.

Source:   Ohio Department of Natural Resources
Date Range:  Historical to October, 2015


Earthquakes of >2.0 Magnitude
This data speaks to the state’s 258 earthquakes with current updates from the Ohio Seismic Network and historical quakes – all >2.0 magnitude. These data come from the department’s inventory. Additionally, we present Ohio earthquakes with <2.0 magnitude courtesy of Environment Canada’s Search the Earthquake Database platform.

Source: Ohio Department of Natural Resources, Division of Geological Survey, The Ohio Seismic Network
Date Range:  Historical to Present

Mariner East Technical Difficulties map

Remaining Questions on Mariner East Technical Deficiencies

In the summer of 2015, Sunoco Logistics submitted applications to the Pennsylvania Department of Environmental Protection (DEP) to build its massive Mariner East 2 pipeline. The ME 2 pipeline would have the capacity to transport 275,000 barrels a day of propane, ethane, butane, and other hydrocarbons from the shale fields of Western Pennsylvania to the Marcus Hook export terminal, located on the Delaware River.

Sunoco’s applications were to satisfy the state’s Chapter 105 (water obstruction and encroachment) and Chapter 102 (erosion/sediment control and earth disturbance) permitting requirements. The DEP responded to Sunoco’s application, issuing 20 deficiency letters totaling more than 550 pages. Sunoco resubmitted their application in the summer of 2016 and the DEP again rejected many of its plans to disturb streams, ponds, and wetlands. In December, Sunoco resubmitted its revised application for a third time, hoping for final approval.

FracTracker Alliance first wrote about ME 2’s risks to watershed in August 2016, following Sunoco’s second application. Readers who want a general overview of the issues may find that article worth reading. In this new article, we dig deeper into the subject. Along with its December application, Sunoco also supplied the DEP with revised GIS files illustrating ME 2’s new route and documents summarizing its impacts to nearby water bodies. We have created a new map utilizing newly available data and provide contextual analysis valuable in determining how Sunoco responds to the DEP’s review of its prior rejected applications.

Detailed Mapping of Water Body Impacts

At the end of December, the DEP finally released Sunoco’s GIS files detailing water bodies that will be impacted by ME 2, as well as Sunoco’s data tables outlining alternative methods that might mitigate certain impacts. Our map (below) combines these new datasets to show the locations where ME 2’s route has changed since Sunoco’s initial application, presumably in response to the DEP’s technical deficiency letter.

Also on this map are water bodies: 1) implicated in ME 2’s environmental impact assessment, 2) determined by the DEP as likely impacted by construction, and 3) identified by Sunoco as having viable construction alternatives to mitigate impacts.

Mariner East 2 Technical Deficiencies Map


View map fullscreenHow FracTracker maps work

By viewing the map fullscreen and zooming in, one can click on a water feature to reveal its data tables (see below example). These tables contain information on the water body’s flow regime, the extent of permanent and temporary impacts, alternative crossing methods that could be used, and what benefits might come from those alternate methods. Also in the tables are a number of designations such as:

  • USGS Fish and Wildlife wetland classification (see guide). Most common are PEM (palustrine emergent wetland), PSS (palustrine scrub-shrub wetland), PFO (palustrine forested wetland), and PuB (palustrine unconsolidated bottom – i.e. ponds).
  • PA DEP stream designation (see guide). Most common are WWF (warm water fishes), CWF (cold water fishes), HQ (high quality), and EV (exceptional value).
  • PA Fish and Boat Commission classifications (see guide). Most common are ATW (approved trout water), STS (stocked trout stream), Class A (class A water), and WTS (wilderness trout stream).

An example water body data table that can be found on the map:
me2-zoom-screenshot2

Our analysis of this new data reveals the number of water crossings in question is significantly higher than what we estimated in August: now totaling 1,222 streams, 34 ponds, and 708 wetlands crossings. This increase is primarily due to Sunoco’s data also containing information on ephemeral and intermittent waters that are not typically accounted for in USGS data (all that was available at the time of our prior analysis).

Defining Impacts

The DEP’s Chapter 105 Joint Permit Application Instructions break down “impacts” into two broad categories: permanent and temporary. These are primarily used to assess environmental impact fees, but are also valuable in determining what parameters Sunoco will be held to during and after ME 2’s construction.

Permanent impacts: are “areas affected by a water obstruction or encroachment that consist of both direct and indirect impacts that result from the placement or construction of a water obstruction or encroachment and include areas necessary for the operation and maintenance of the water obstruction or encroachment located in, along or across, or projecting into a watercourse, floodway or body of water.”

Permanent impacts are calculated using the pipeline’s 50-foot permanent right-of-way. For streams, all bed and banks are to be restored to pre-construction conditions. For ponds and wetlands, permanent impacts are assumed to remain even if the area is considered restored.

Temporary impacts: are “areas affected during the construction of a water obstruction or encroachment that consists of both direct and indirect impacts located in, along or across, or projecting into a watercourse, floodway or body of water that are restored upon completion of construction.” Temporary impacts consist of areas such as temporary workspaces and access roads.

The below table lists the total impacted acres broken down by county. Of interest here is that more than 175 acres would be permanently impacted — equivalent to 134 football fields — with an additional 82 acres temporarily impacted.

Table 1. Impacted Acres by County

County Permanent Impacts (acres) Temporary Impacts (acre)
Allegheny 1.85 0.39
Berks 11.14 4.88
Blair 11.70 6.72
Cambria 20.21 8.48
Chester 10.30 3.92
Cumberland 24.06 7.61
Dauphin 8.12 6.55
Delaware 5.05 3.33
Huntingdon 18.75 8.04
Indiana 11.42 4.73
Juniata 5.25 3.02
Lancaster 4.65 1.66
Lebanon 6.48 2.53
Perry 5.58 2.63
Washington 9.37 2.94
Westmoreland 17.72 12.36
York 3.46 2.16
Total 175.12 81.93

Viable Options to Reduce Impacts

Example of an open cut wet crossing

An open cut wet crossing (image source)

Pipeline companies cross water bodies using a variety of methods depending on their classification. The DEP maintains three general categories for water crossings: minor (in streams less than or equal to 10 feet wide at the water’s edge at the time of construction), intermediate (perennial stream crossings greater than 10 feet wide but less than 100 feet wide at the water’s edge at the time of construction), and major (crossings of more than 100 feet at the water’s edge at the time of construction).

Minor and intermediate crossings often employ rudimentary trenching along “open cut” crossings where the water is either temporarily diverted (wet crossing) or allowed to flow during construction (wet crossing). After the cuts, the company attempts to repair damage done in the process of trenching.

In more sensitive places, such as in exceptional value streams, wetlands, and always in major crossings, a company uses conventional boring to tunnel under a water feature. When boring over long distances, such as under a lake or river, a company turns to Horizontal Directional Drilling (HDD), a more engineered form of boring. An example of HDD boring is seen below (image source):

hdd_crossing_example

We were surprised by the number of water crossings identified by Sunoco as having options to minimize impact. As the table below shows, more than 44% (869) of Sunoco’s crossings have an alternate method identified in the resubmitted applications. In most of these instances, the intended crossing method is either trenching through open cuts or dry crossings. The majority of identified alternatives would reduce impacts simply by altering the trenching route. 53 of the 869 were shown to have feasible conditions for conventional or HDD boring, but Sunoco categorized all of these as impracticable options despite their environmental benefits.

Table 2. Number of Crossings With and Without Viable Alternate Methods

Crossings Assessed but Unimpacted Impacted with No Alternative Impacted with Alternatives Total
Streams 313 925 297 1,535
Ponds 66 3 31 100
Wetlands 963 167 541 1,671
  1,342 1,095 869 3,306

Absorbing the Costs of Environmental Impacts

If executed, these alternative methods would decrease the length of crossings, limit right-of-way encroachments, prevent land fragmentation, and significantly reduce risks to larger water bodies. More likely, Sunoco will pay the impact fees associated with the less complicated crossing methods. We’ve summarized these fees (found in Sunoco’s resubmitted application) in the table below. In total, Sunoco would pay roughly $1.8 million in exchange for nearly 2,000 water body crossings – a fraction of the project’s $2.5 billion estimated cost:

Table 3. Impact Fees for Sunoco’s Preferred Crossings

County Permanent Impacts area (fees) Temporary Impact area (fees) Admin Fees Total Fees
Allegheny $15,200 $1,600 $1,750 $18,550
Berks $89,600 $19,600 $1,750 $110,950
Blair $94,400 $27,200 $1,750 $123,350
Cambria $162,400 $34,000 $1,750 $198,150
Chester $83,200 $16,000 $1,750 $100,950
Cumberland $192,800 $30,800 $1,750 $225,350
Dauphin $65,600 $26,400 $1,750 $93,750
Delaware $40,800 $13,600 $1,750 $56,150
Huntingdon $150,400 $32,400 $1,750 $184,550
Indiana $92,000 $19,200 $1,750 $112,950
Juniata $42,400 $12,400 $1,750 $56,550
Lancaster $37,600 $6,800 $1,750 $46,150
Lebanon $52,000 $10,400 $1,750 $64,150
Perry $44,800 $10,800 $1,750 $57,350
Washington $75,200 $12,000 $1,750 $88,950
Westmoreland $142,400 $50,000 $1,750 $194,150
York $28,000 $8,800 $1,750 $38,550
$1,408,800 $332,000 $29,750 $1,770,550

Conclusion

This week, acting DEP Secretary Patrick McDonnell met with residents who voiced frustration that the agency failed to provide an additional public comment period following Sunoco’s application resubmission. Nevertheless, the DEP is expected to greenlight Sunoco’s plans any day now, adding another to the list of recent pipeline approvals in the region. Sunoco needs its permits now in order to begin clearing trees prior to endangered species bat nesting season, which begins in April.

Meanwhile, communities along the pipeline’s path are preparing for the sudden wave of disruption that may ensue. Some have threatened lawsuits, arguing that the resubmitted application still contains many deficiencies including missing wetlands and private drinking wells that must be accounted for. Indeed, the map and data presented in this article confirms that there is still a lot that the general public does not know about ME 2 – in particular, the extent of water impacts the DEP seems willing to accept and the range of options at Sunoco’s disposal that might mitigate those impacts if it were forced to do so.

Finally, it is encouraging to see that the DEP is becoming more transparent in sharing datasets, compared to other pipeline projects. However, this data is complex and not easily understood without sufficient technical expertise. We are discouraged to think that it is unlikely the public will learn about additional changes to the construction plan until after permits are issued. In order for data to be useful, it must be made available throughout the process, not at the end stages of planning, and done so in a way that it becomes integrated into the agency’s public participation responsibilities.


by Kirk Jalbert, Manager of Community-Based Research & Engagement

Shell Ethane Cracker

A Formula for Disaster: Calculating Risk at the Ethane Cracker

by Leann Leiter, Environmental Health Fellow
map & analysis by Kirk Jalbert, Manager of Community-Based Research & Engagement
in partnership with the Environmental Integrity Project

On January 18, 2016, Potter Township Supervisors approved conditional use permits for Shell Chemical Appalachia’s proposed ethane cracker facility in Beaver County, PA. A type of petrochemical facility, an ethane cracker uses energy and the by-products of so-called natural gas to make ethylene, a building block of plastics. FracTracker Alliance has produced informative articles on the jobs numbers touted by the industry, and the considerable negative air impacts of the proposed facility. In the first in a series of new articles, we look at the potential hazards of ethane cracker plants in order to begin calculating the risk of a disaster in Beaver County.

As those who stand to be affected by — or make crucial decisions on — the ethane cracker contemplate the potential risks and promised rewards of this massive project, they should also carefully consider what could go wrong. In addition to the serious environmental and human health effects, which might only reveal themselves over time, what acute events, emergencies, and disasters could potentially occur? What is the disaster risk, the potential for “losses, in lives, health status, livelihoods, assets and services,” of this massive petrochemical facility?

Known Ethane Cracker Risks

A well-accepted formula in disaster studies for determining risk, cited by, among others, the United Nations International Strategy for Disaster Reduction (UNISDR), is Disaster Risk = (Hazard x Vulnerability)/Capacity, as defined in the diagram below. In this article, we consider the first of these factors: hazard. Future articles will examine the remaining factors of vulnerability and capacity that are specific to this location and its population.

disaster-risk-infographic-websize

Applied to Shell’s self-described “world-scale petrochemical project,” it is challenging to quantify the first of these inputs, hazard. Not only would a facility of this size be unprecedented in this region, but Shell has closely controlled the “public” information on the proposed facility. What compounds the uncertainty much further is the fact that the proposed massive cracker plant is a welcome mat for further development in the area—for a complex network of pipelines and infrastructure to support the plant and its related facilities, and for a long-term commitment to continued gas extraction in the Marcellus and Utica shale plays.

williams-geismar-explosion-websize

U.S. Chemical Safety and Hazard Investigation Board, Williams Geismar Case Study, No. 2013-03-I-LA, October 2016.

We can use what we do know about the hazards presented by ethane crackers and nearby existing vulnerabilities to establish some lower limit of risk. Large petrochemical facilities of this type are known to produce sizable unplanned releases of carcinogenic benzene and other toxic pollutants during “plant upsets,” a term that refers to a “shut down because of a mechanical problem, power outage or some other unplanned event.” A sampling of actual emergency events at other ethane crackers also includes fires and explosions, evacuations, injuries, and deaths.

For instance, a ruptured boiler at the Williams Company ethane cracker plant in Geismar, Louisiana, led to an explosion and fire in 2013. The event resulted in the unplanned and unpermitted release of at least 30,000 lbs. of flammable hydrocarbons into the air, including ethylene, propylene, benzene, 1-3 butadiene, and other volatile organic chemicals, as well as the release of pollutants through the discharge of untreated fire waters, according to the Louisiana Department of Environmental Quality. According to the Times-Picayune, “workers scrambl(ed) over gates to get out of the plant.” The event required the evacuation of 300 workers, injured 167, and resulted in two deaths.

The community’s emergency response involved deployment of hundreds of personnel and extensive resources, including 20 ambulances, four rescue helicopters, and buses to move the injured to multiple area hospitals. The U.S. Chemical Safety and Hazard Investigation Board chalked up the incident to poor “process safety culture” at the plant and “gaps in a key industry standard by the American Petroleum Institute (API).” The accident shut the plant down for a year and a half.

Potential Risks & Shell’s Mixed Messages

Shell has done little to define the potential for emergencies at the proposed Beaver County ethane cracker plant, at least in materials made available to the public. Shell has revealed that general hazards include “fire, explosion, traffic accidents, leaks and equipment failures.”

However, we located numerous versions of Shell’s handout and found one notable difference among them—the brochure distributed to community members at a December 2016 public hearing held by the Pennsylvania Department of Environmental Protection (PA DEP) excluded the word “explosion” from the list of “potential safety concerns.” The difference is seen in comparing the two documents.

Figure #1 below: Excerpt of online version of a handout for Beaver County, dated May 2015, with “explosion” included in list of “potential safety concerns.” (Other Shell-produced safety documents, like the one included as an exhibit in the conditional use permit application on file with the township, and Shell’s webpage for the project, also include “explosion” in the list of hazards.)

Figure #2 below: Excerpt of handout, dated November 2016 and provided to the community at December 15, 2016 meeting, with the word “explosion” no longer included.


Additional hints about risks are peppered throughout the voluminous permit applications submitted by Shell to the PA DEP and Potter Township, such as references to mitigating acts of terror against the plant, strategies for reducing water contamination, and the possibility of unplanned upsets. But the sheer volume of these documents, coupled with their limited accessibility challenge the public’s ability to digest this information. The conditional use permit application submitted by Shell indicates the existence of an Emergency Response Plan for the construction phase, but the submission is marked as confidential.

Per Pennsylvania law, and as set forth in PA DEP guidelines, Shell must submit a Preparedness, Prevention, and Contingency Plan (PPC Plan) at an unspecified point prior to operation. But at that likely too-late stage, who would hear objections to the identified hazards, when construction of the plant is already a done deal? Even then, can we trust that the plan outlined by that document is a solid and executable one?

Shell’s defense of the Beaver County plant is quick to point out differences between other plants and the one to come, making the case that technical advances will result in safety improvements. But it is noteworthy that the U.S. Chemical Safety and Hazard Investigation Board attributes failures at the Williams Geismar plant, in part, to “the ineffective implementation of…process safety management programs… as well as weaknesses in Williams’ written programs themselves.” The Geismar explosion demonstrates some of the tangible hazards that communities experience in living near ethane cracker plants. It is worth noting that the proposed Beaver County facility will have about 2½ times more ethylene processing capacity than the Geismar plant had at the time of the 2013 explosion.

Opening the Floodgates

In an effort to expand our understanding of risk associated with the proposed Beaver County ethane cracker and the extent of related developments promised by industry leaders, FracTracker Alliance has constructed the below map. It shows the site of the Shell facility and nearby land marked by Beaver County as “abandoned” or “unused.” These land parcels are potential targets for future build-out of associated facilities. Two “emergency planning zones” are indicated—a radius of 2 miles and a radius of 5 miles from the perimeter of Shell’s site. These projections are based upon FracTracker’s discussions with officials at the Saint Charles Parish Department of Homeland Security and Emergency Preparedness, who are responsible for emergency planning procedures in Norco, Louisiana, the site of another Shell ethane cracker facility. The emergency zones are also noted in the 2015 Saint Charles Hazard Mitigation Plan.

Also shown on the map is an estimated route of the Falcon pipeline system Shell intends to build, which will bring ethane from the shale gas fields of Ohio and Pennsylvania. Note that this is an estimated route based on images shown in Shell’s announcement of the project. Finally, our map includes resources and sites of vulnerability, including schools, fire stations, and hospitals. The importance of these sites will be discussed in the next article of this series.

Ethane Cracker Hazards Map


View map fullscreenHow FracTracker maps work

While the site of the Shell cracker is worth attending to, it would be a mistake to limit assessments of disaster risk to the site of the facility alone. Shell’s proposed plant is but one component in a larger plan to expand ethane-based processing and use in the region, with the potential to rival the Gulf Coast as a major U.S. petrochemical hub. An upcoming conference on petrochemical construction in the region, scheduled for June 2017 in Pittsburgh, shows the industry’s commitment to further development. These associated facilities (from plants producing fertilizers to plastics) would utilize their own mix of chemicals, and their potential interactions would produce additional, unforeseen hazards. Ultimately, a cumulative impact assessment is needed, and should take into account these promised facilities as well as existing resources and vulnerabilities. The below Google Earth window gives a sense of what this regional build-out might look like.

What might an ethane cracker and related petrochemical facilities look like in Beaver County? For an idea of the potential build-out, take a tour of Norco, Louisiana, which includes Shell-owned petrochemical facilities.

Final Calculations

As discussed in the introduction, “hazard,” “vulnerability,” and “capacity” are the elements of the formula that, in turn, exacerbate or mitigate disaster risk. While much of this article has focused on drastic “hazards,” such as disastrous explosions or unplanned chemical releases, these should not overshadow the more commonplace public health threats associated with petrochemical facilities, such as detrimental impact on air quality and the psychological harm of living under the looming threat of something going wrong.

The second and third articles in this series will dig deeper into “vulnerability” and “capacity.” These terms remind us of the needs and strengths of the community in question, but also that there is a community in question.

Formulas, terminology, and calculations should not obscure the fact that people’s lives are in the balance. The public should not be satisfied with preliminary and incomplete risk assessments when major documents that should detail the disaster implications of the ethane cracker are not yet available, as well as when the full scale of future build-out in the area remains an unknown.

Much gratitude to Lisa Graves-Marcucci and Lisa Hallowell of the Environmental Integrity Project for their expertise and feedback on this article.

The Environmental Integrity Project is a nonpartisan, nonprofit watchdog organization that advocates for effective enforcement of environmental laws. 

Offshore oil and gas development in CA - Photo by Linda Krop Environmental Defense Center

More offshore drilling and “fracking” in California

Offshore oil and gas development is expanding in CA. This article explores the state’s regulatory framework, existing data, and data discrepancies.

Federal Regulations for Offshore Fracking

In the summer of 2016 the Bureau of Ocean Energy Management (BOEM) and the Bureau of Safety and Environmental Enforcement (BSEE) jointly released an environmental study that reviewed offshore fracking operations. The report found that operations have a minimal impact on marine health. For a review of California’s offshore oil and gas operations, see FracTrackers Alliance’s coverage of the collaborative report with the Environmental Defense Center, the Dirty Water Report.

As ThinkProgress reports, these two federal agencies will now resume the approval of offshore fracking permits. In response, Governor Jerry Brown made a plea to President Obama, to prevent fracking off California’s coast. Governor Brown asked President Obama to institute a permanent ban on all new offshore oil and gas drilling in federal waters, saying:

California is blessed with hundreds of miles of spectacular coastline; home to scenic state parks, beautiful beaches, abundant wildlife and thriving communities,” Brown wrote in a letter to Obama. “Clearly, large new oil and gas reserves would be inconsistent with our overriding imperative to reduce reliance on fossil fuels and combat the devastating impacts of climate change.

A new report by Liza Tucker at Consumer Watchdog has reviewed the state regulatory agency’s own policies under the Brown Administration. The report claims, “Brown has nurtured drilling and hydraulic fracturing in the state while stifling efforts to protect the public.” The report asks Governor Brown to “direct regulators to reject any drilling in a protected coastal sanctuary, ban offshore fracking, and phase out oil drilling in state waters” among other recommendations.

California Data & Discrepancies

FracTracker Alliance reviewed the data published by DOGGR on permitted offshore wells. (DOGGR refers to the Division of Oil, Gas, & Geothermal Resources, which regulates drilling in CA). Using API identification numbers as a timeline, we actually find that it is likely that 238 wells have been drilled offshore since the start of 2012. The DOGGR database only lists “spud” (drilling) and completion dates for 71 – a mere 1.3% of the 5,435 total offshore wells. DOGGR reports that 1,366 offshore wells are currently active production wells. It must be noted that these numbers are only estimations, since operators have a 2-year window to drill wells after receiving a permit and API number.

Using these methods of deduction, we find that since the beginning of 2012 the majority of offshore wells have been drilled offshore of Los Angeles County in the Wilmington Oil Field (204 in total); followed by 25 offshore in the Huntington Beach field; 7 in the West Montalvo field offshore of Ventura County, and 1 in the Belmont field, also offshore of Ventura County. These wells are shown as bright yellow circles in the map below. Additionally, the Center for Biological Diversity reports that at least 200 of the wells off California’s coast have been hydraulically fractured.

Offshore Oil and Gas Development and SB4-Approved Well Stimulations


View map fullscreen | How FracTracker maps work

In total, DOGGR data shows 5,435 offshore oil and gas wells. Of those listed as active, new or idle, they break down into well types as shown in Table 1 below.

Table 1. Offshore oil and gas well types

Well Type Count
Oil and Gas Production 1,539
Dry Gas 5
Waste Disposal 14
Steam Flood 2
Water Flood 813
Pressure Maintenance 3
Observation 8

New Fracking under SB4 Rules

The map above also shows several datasets that detail the stimulation activity that has been occurring in California since the passage of SB4 under Jerry Brown. Prior to the adoption of the new stimulation regulations on July 1, 2015, operators submitted applications and received permits for a total of 2,130 wells. These well permits are shown in the map labeled “CA SB4 Interim Well Stimulation Permits.” Since July of 2015, 596 of these permitted wells have been stimulated. In the map above, the layer “CA SB4 Well Stimulation Disclosures” shows the time series of these wells. An additional 31 well stimulation treatment permit applications have been submitted to DOGGR, since the adoption of the final rules on July 1, 2015. They are shown in the map, labeled “CA SB4 Well Stimulation Treatment Permit Applications.”


Offshore drilling cover photo by Linda Krop, Environmental Defense Center

By Kyle Ferrar, Western Program Coordinator, FracTracker Alliance

For the Susquehanna River Basin Impacts Project

An Introduction to the Susquehanna River Basin Impacts Project

By the FracTracker Alliance
In partnership with the Pennsylvania Chapter of the Sierra Club
and Clean Water Action 

Looking at a map of Pennsylvania, three major rivers span the Commonwealth — the Ohio River in the West, the Susquehanna River in the middle of PA, and the Delaware River in the East. The Delaware River Watershed benefits from the active oversight and management of the Delaware River Basin Commission (DRBC) and the Ohio is managed by Ohio River Valley Water Sanitation Commission (ORSANCO). The multi-state effort to protect the Susquehanna River is known as the Susquehanna River Basin Commission (SRBC).

These agencies differ greatly in how they oversee protections of their respective watersheds, particularly in the context of oil and gas development. For instance, the DRBC engages in a range of activities related to water quantity protection (like water supply allocation and water conservation), water quality, regulatory review and permitting, watershed-wide planning, flood mitigation and drought management, and recreational activities. Meanwhile, ORSANCO and the SRBC interpret their responsibilities very narrowly, primarily focusing on managing issues related to discharge standards in the case of ORSANCO, and water quantity in the case of the SRBC.

Major watershed boundaries in PA, with the Susquehanna River Basin shown in pale green. Source: DCNR

In this new series of articles, FracTracker Alliance, in partnership with the Sierra Club Pennsylvania Chapter and Clean Water Action, takes a closer look at the Susquehanna River Watershed and its many challenges related to industrial development, including deforestation and sedimentation issues, nutrient loading from poor agricultural practices, sewer and stormwater runoff. A significant component of Susquehanna River Basin impacts can be attributed to expanding oil and gas development. How will the Susquehanna River Watershed withstand future impacts from the oil and gas industry given the SRBC’s limited oversight? A first step in understanding the problem is to look at the state of the watershed today.

Oil & Gas in the Susquehanna River Watershed

As part of the ongoing Marcellus Shale oil and gas boom, nearly 5,500 unconventional wells on roughly 2,000 well pads have been drilled in the Susquehanna River Watershed since 2007. According to the Nature Conservancy, shale gas companies could drill 27,600 additional wells in the Susquehanna River basin by 2030, which would result in approximately 6,900 well pads (assuming four wells per pad, a relatively conservative number given recent trends where up to a dozen wells are being drilled on a single pad). These additional 4,900 well pads represent 31,850 acres of disturbed lands for the pads and access roads alone. Overall, the Nature Conservancy believes that up to 110,000 acres of forested land could be cleared in the Susquehanna River Watershed by 2030. In addition to well pads and access roads, one must also account for the impacts of associated pipelines. Estimates suggest that 12-15 acres of gathering line are installed per acre of well pad.

This explosive growth of the shale drilling industry, combined with declining resources for regulatory oversight, would complicate regional watershed management strategies. A growing body of evidence suggests that watersheds near hydraulic fracturing operations can be impacted by improper waste disposal, trucking accidents, migration of drilling fluids, as well as problems related to land disturbance such as pipeline and access road stream crossings, sedimentation and runoff (needs a reference). And while there are two major water monitoring programs operating in the Susquehanna River, one run by the Pennsylvania Department of Environmental Protection (PA DEP) and the other operated by the SRBC, significant questions remain about their ability to assess the Susquehanna River’s water quality. These concerns primarily stem from the infrequent and patchwork-like coverage of their sampling regimes, as well as inconsistencies in indicators measured at different sites.

Existing Water Monitoring Efforts

Watershed testing is key to understanding how industrial development affects water quality. It also significantly informs mitigation strategies. In this first map of the series (below), we have put together several layers to help illustrate the state of water testing in the Susquehanna River Basin. This map can be used to obtain summary information about unconventional oil and gas activity and monitoring efforts at the watershed level by clicking on individual features.

Note that there are two separate layers on this map depicting summary data — one outlined in dark green and one in light green, both at HUC-08 level. The dark green outlines are in PA only and contain oil and gas summaries of wells and violations. The light green outlines show agency-based monitoring activity, and are not restricted to PA boundaries. The reason for the two layers is that states classify oil and gas wells differently and so cannot be combined easily.

View map fullscreenHow FracTracker maps work

The Susquehanna River Basin has over 49,000 miles of waterways, according to the SRBC. While it may not be possible to fully document the impacts that the oil and gas industry has on the basin, there are some efforts underway to chronicle changes to the river system. In this map, we look at the efforts of governmental and quasi-governmental agencies to test the waters throughout the region, which range from periodic grab samples to automated data loggers that constantly evaluate several measures of water quality. There are advantages to both methods, as data loggers can capture short term spikes in conductivity, for example, that monthly sampling would likely miss altogether. However, grab sampling allows for a more in-depth analysis of the water in a laboratory than what the data loggers can provide.

While oil and gas is the focus of the map, it is not the only concern of the SRBC. Thus, considerable testing occurs in areas that are not seeing drilling activity. The drilling regions are shown on the map as a great orange arc, extending from Indiana County in the west-central part of Pennsylvania all the way to Susquehanna county in the Northern Tier. If you zoom in on this region, data for individual unconventional wells will become visible, along with permits for wells that have yet to be been drilled, and violations that have been issued by DEP.

Clusters of Development and Oversight

In some regions of the Susquehanna basin, there are significant clusters of oil and gas activity without a corresponding governmental monitoring regimen. Other areas have significant monitoring coverage. In many cases, periodic grab samples are taken from the same sites as data loggers – and may therefore appear twice on our map – to capture both aspects of monitoring activity. Our map can be used to find quick summary data for a given watershed.  For example, the Upper Susquehanna-Tunkhannock watershed is being monitored with 53 testing sites and nine data loggers. The same region has 2,178 wells, and 2,347 violations associated with these wells.

We can also use the map to focus on concerns at different scales. The cluster of drilling activity in Ulysses Township, seen below, resulted in a number of violations (shown in yellow). Due to historical impact of the oil and gas industry in this sub-watershed, additional monitoring locations might be called for.

While we think that it is important to protect all the Susquehanna’s waters, certain areas are more fragile than others. For instance, headwater streams that are designated as high quality (HQ) or exceptional value (EV) are vital to the overall health of the river system and their protection is required by Pennsylvania law. However, many headwaters streams have no monitoring despite heavy oil and gas drilling, as can be seen in the below map. We have included HQ/EV designated streams on the map, although due to the large amount of data these streams are not displayed by default. They can be seen by activating the layer.

Broader Implications

The Susquehanna River provides drinking water to 4.1 million people, including residents in New York, Pennsylvania, and Maryland. In addition, through water that is diverted to areas outside the watershed, it is estimated that the Susquehanna also serves as a drinking water supply for 2 million people in more populated areas such as Baltimore, MD and Chester County, PA. With clean drinking water hanging in the balance, and the potential build-out of thousands more natural gas well pads in the watershed, it is more important than ever to understand how oil and gas activity could affect the watershed.

The Pennsylvania Constitution reminds us of our right to clean air, pure water, and the preservation of the environment. Prior to the adoption of the Environmental Rights Amendment — 80 years ago this year — and long before the federal Clean Water Act, the Pennsylvania legislature passed the state level Clean Streams Law in recognition of the need to protect the integrity of our valuable aquatic resources. In the spirit of this tradition to lead on clean water issues, the SRBC, Pennsylvania, and surrounding states must commit to putting the protection and preservation of the Susquehanna River watershed at the forefront of decision-making within the basin.

In future installments of this series, we seek to reveal gaps in watershed and land management plans in order to evaluate what these risks mean for the people and environments of the Susquehanna River Basin. The mapping and analysis provided in this series will be used to frame a series of conversations throughout the Basin with the goal of encouraging concerned residents to become more involved in public discussions about watershed management planning. Further, this project will result in recommendations for tangible solutions to filling oversight and management gaps and communicate these findings to relevant agencies. Only with adequate information can the public ensure strong protections for this life-sustaining waterway. Recognizing the important work that the SRBC has done in recent years, we also hope to identify areas where the Commission can direct additional resources to analyzing the cumulative impacts of shale gas development and expand their oversight strategies.

Project Info

Read more about the Susquehanna River Basin Impacts Project

Top: fair use image by Nicholas A. Tonelli