Mysterious leak near Porterville Compressor Station, NY
Last month, FracTracker Alliance featured a blog entry and map exploring the controversy around National Fuel’s proposed Northern Access Pipeline (NAPL) project, shown in the map below. The proposed project, which has already received approval from the Federal Energy Regulatory Commission (FERC), is still awaiting another decision by April 7, 2017 — Section 401 Water Quality Certification. By that date, the New York State Department of Environmental Conservation (NYS DEC) must give either final approval, or else deny the project.
Northern Access Pipeline Map
View map fullscreen | How FracTracker maps work
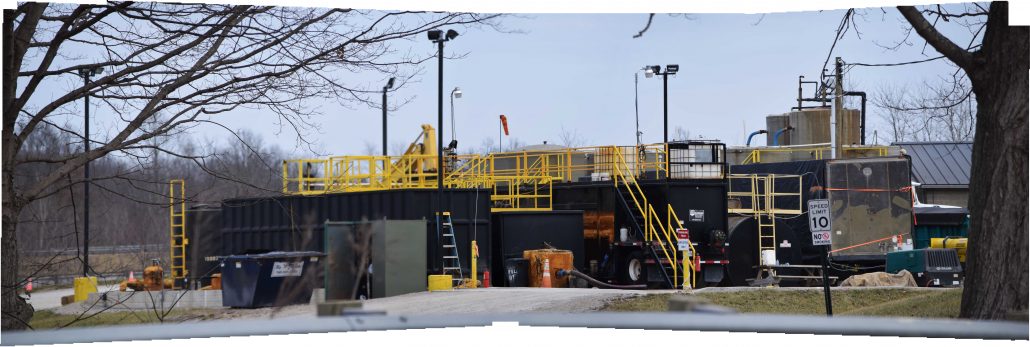
The NAPL project includes the construction of 97-mile-long pipeline to bring fracked Marcellus gas through New York State, and into Canada. The project also involves construction of a variety of related major infrastructure projects, including a gas dehydration facility, and a ten-fold expansion of the capacity of the Porterville Compressor Station located at the northern terminus of the proposed pipeline, in Erie County, NY.
On three consecutive days in early February, 2017, the New York State Department of Environmental Conservation (NYS DEC) held hearings in Western New York to gather input about the NAPL project. On February 7th, the day of the first meeting at Saint Bonaventure University in Allegany County, NY, an alarming — and yet to be fully reported — incident widely considered to be a gas leak, occurred at, or near, the Porterville Compressor Station (also known locally as the “Elma Compressor Station”). The incident is thought to be connected to the planned upgrades to the facility, but was not even mentioned as a concern during the public meetings relating to the Northern Access Pipeline in the subsequent hours and days.
What follows is a story of poor communication between the utility company, first responders, and local residents, resulting in confusion and even panic, and has yet to be conclusively explained to the general public.
Incident Description
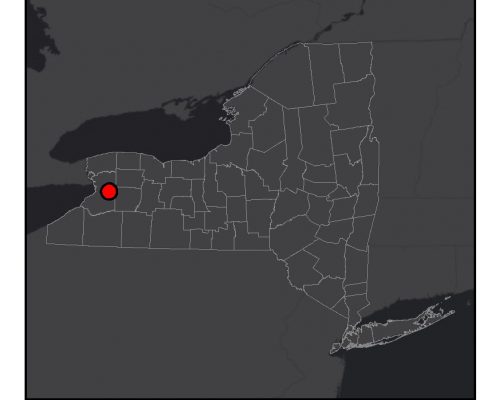
Area of incident in NY State
We know that a little past 10 AM on February 7th, people in the villages of Elma and East Aurora, within about a mile of the Porterville Compressor Station, reported strong odors of gas. They filed complaints with the local gas utility (National Fuel), and the local 911 center, which referred the calls to the local Elma Fire Department. The fire department went to the Porterville Compressor station to investigate, remembering a similar incident from a few years earlier. At the compressor station, representatives from National Fuel, the operator of the compressor station, assured the fire company that they were conducting a routine flushing of an odorant line, and the situation was under control, so the fire company departed.
Residents in the area became more alarmed when they noticed that the odor was stronger outside their buildings than inside them. National Fuel then ordered many residents to evacuate their homes. The East Aurora police facilitated the evacuation and instructed residents to gather in the East Aurora Library not far from those homes. Nearby businesses, such as Fisher Price, headquartered in East Aurora, chose to send their employees home for the day, due to the offensive odor and perceived risks.
Around 11:30 in the morning, up to 200 clients at Suburban Adult Services, Inc. (SASi), were evacuated to the Jamison Road Fire Station, where they remained until around 3 PM that afternoon. Over 200 reports were received, some from as far away as Orchard Park, eight miles down-wind of the compressor station.
After East Aurora elementary and middle schools placed complaints, National Fuel told them to evacuate students and staff from their buildings. Realizing that the smell was stronger outside than inside the building, school leaders revised their plans, and started to get buses ready to transport student to the high school, where there had not been reports of the odor. Before the buses could load, however, the police department notified the school that the gas leak had been repaired, and that there was no need to evacuate. School officials then activated the school’s air circulation system to rid the building of the fumes.
Perplexingly, according to one report, National Fuel’s Communications Manager Karen Merkel said “that the company did not reach out into the community to tell people what was going on because the company cannot discourage anyone from making an emergency gas call.”
Merkel noted further, “You never know if the smell being reported is related to work we are doing or another gas leak,” she said. “This wouldn’t be determined until we investigate it.”
That smell…
Some background on gas leaks & odorant additives

Ethyl mercaptan molecule
An odorant, such as ethyl mercaptan, is often added to natural gas in order to serve as an “early warning system” in the event of a leak from the system. Odorants like mercaptan are especially effective because the humans can smell very low concentrations of it in the air. According to the National Center for Biotechnology Information, “The level of distinct odor awareness (LOA) for ethyl mercaptan odorant is 1.4 x10⁻⁴ ppm,” or 0.00014 parts per million. That translates to 0.000000014 percent by volume.
Not all natural gas is odorized, however. According to Chevron Phillips, “mercaptans are required (by state and federal regulations) to be added to the gas stream near points of consumption as well as in pipelines that are near areas with certain population density requirements, per Department of Transportation regulations… Not all gas is odorized, though; large industrial users served by transmission lines away from everyday consumers might not be required to use odorized gas.” Also, because odorants tend to degrade or oxidize when gas is travelling a long distance through transmission lines, they are not always added to larger pipeline systems.
The explosion and flammability concentration limit for natural gas refers to the percentage range at which a gas will explode. At very low concentrations, the gas will not ignite. If the concentration is too high, not enough oxygen is present, and the gas is also stable. This is why gas in non-leaky pipelines does not explode, but when it mixes with air, and a spark is present, the result can be disastrous. Methane, the primary component of natural gas, has a lower explosive level (LEL) of 4.4% and an upper explosive limit (UEL) (above which it will not ignite) of 16.4%. Nonetheless, levels above 1% are still worrisome, and may still be good cause for evacuation.
Therefore, the margin of safety between when natural gas is detectable with an odorant present, and when it may explode, is very broad. This may help to explain why the smell of gas was detected over such a broad distance, but no explosion (very fortunately) took place.
Local memories of gas explosion in East Aurora
Many East Aurora residents have had first-hand experience with the dangers posed by gas lines in their community. Less than 25 years ago, in September 1994, a high-pressure pipeline owned by National Fuel ruptured in an uninhabited area between East Aurora and South Wales along Olean Rd. The blast left a 10-foot-deep, 20-foot-wide crater, and tree limbs and vegetation were burned as far as 50 feet away.
Porterville first-hand accounts and inquiries
FracTracker spoke extensively with one resident of East Aurora, Jennifer Marmion, about her experiences, and efforts to understand what had actually happened the day of this incident.
When personnel from the Jamison Fire Company — who are assumed to be first responders to emergencies of this sort — arrived at the Porterville Compressor Station, they were told by National Fuel that there was no hazard and that their services were not needed. Consequently, these crews left the site. The East Aurora Police Department was given a different explanation by National Fuel; there was a valve malfunction somewhere along Two Rod Road in Marilla. Still later, National Fuel indicated that the pipeline changeover occurred closer to the compressor station itself. The closest distance between anywhere on Two Rod Road and the compressor station, itself, is a mile and a half. And Ms. Marmion was given a still different story by a National Fuel engineer: that the odor, indeed, resulted during the replacement of a 100-foot-long section of aging pipeline at the Porterville (“Elma”) Compressor Station.
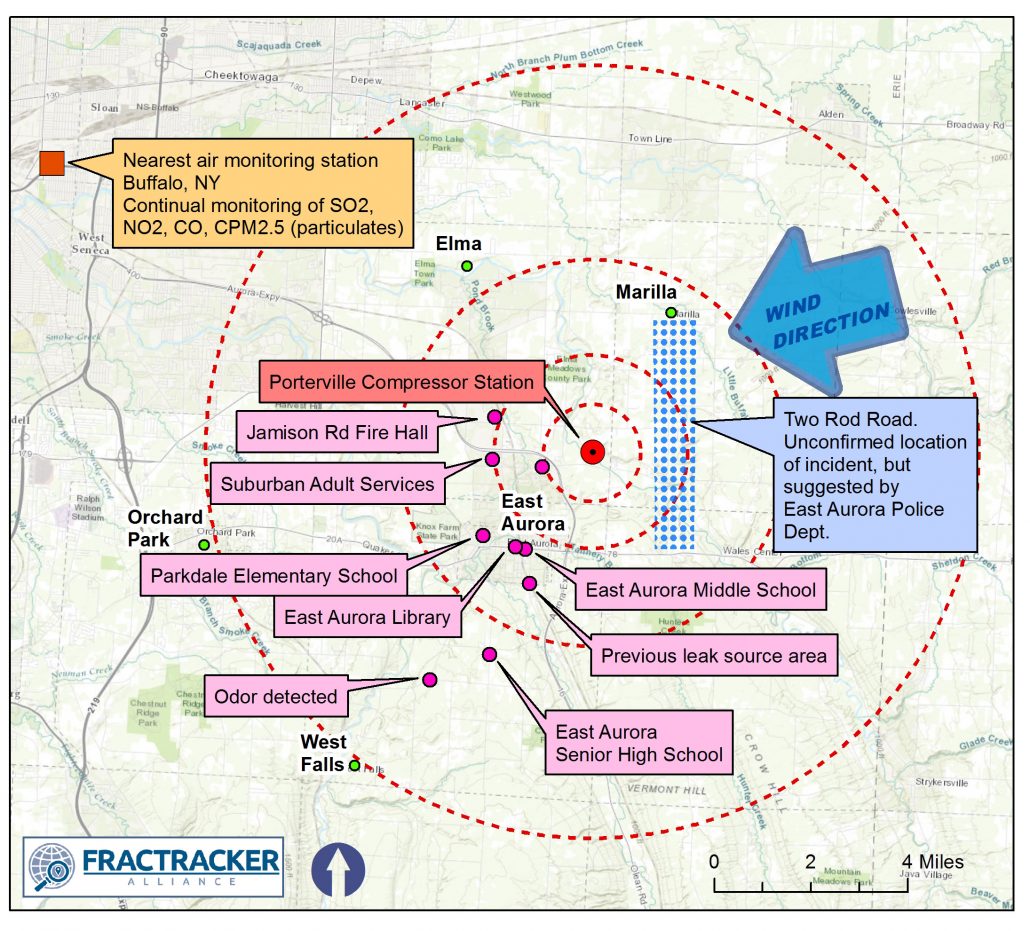
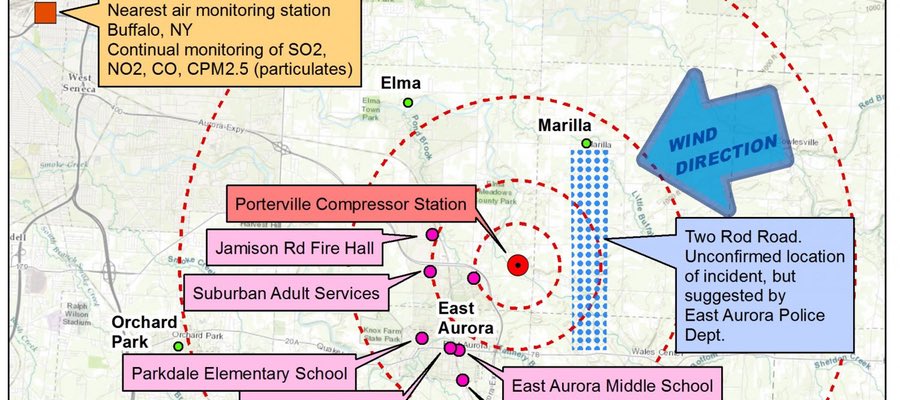
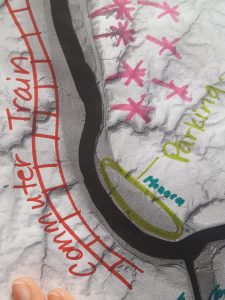
Key locations in incident report
Some reports indicated an alternate explanation: that the odor originated at the East Aurora Town Hall (J. Marmion, pers. comm., via Channel 7 News), or a leaky valve along a pipeline near Marilla (J. Marmion, pers. comm, via East Aurora Police Department dispatcher). A member of the East Aurora Fire Department surmised that the leak might have been closer to Olean Road, south of the village, where there was a history of other leaks. The day after the incident, National Fuel indicated that the odor originated from the compressor station, and was the result of a routine, scheduled “blowdown” by National Fuel — wherein gas lines at the compressor station are cleared as part of routine maintenance. However, when pressed for more details, they did not provide them.
In need of follow up
More than six weeks have passed since the incident, and there is still no definitive explanation available. Clearly, there was considerable confusion about what the correct, and safe, procedure needed to be, as well as how this information needed to flow to the public. Ultimately, a representative from National Fuel’s Government Affairs office agreed that he would alert the local towns and fire departments when maintenance activities would be occurring. It is surprising that this was not already standard practice.
Although Ms. Marmion is continuing to be a determined citizen activist, she has been met with a frustrating array of ambiguous and often conflicting descriptions, phone calls that go un-answered, voice mailboxes at offices that are either full or not set up to receive messages. Furthermore, although National Fuel has told Marmion that there is an Action Plan to be followed in the event of an emergency, they have been unable to provide her with a written or electronic version of this document, because “the action plan is just known.”
National Fuel points to the weather
National Fuel maintains that the only factor that was out of the ordinary was that during the event, a combination of unusual weather factors caused the released gas to travel in an unusual manner and also not dissipate as quickly as expected. National Fuel also indicated that the strong odor (created by the additive mercaptan) was a benefit to the local community, added to natural gas so that residents would be alerted to problems. It’s important to note that the largest gas transmissions pipelines, like the nearby 26” diameter Tennessee Gas Pipeline to the east of Elma and East Aurora, as well other pipelines that will run to the greatly expanded Porterville Compressor Station as part of the Northern Access Pipeline project, will be without the odorant.
Here’s what FracTracker could verify, based on National Weather Service, and Weather Underground historical data. In the morning and afternoon of February 7th, the wind was uncharacteristically blowing from the east/northeast — atypical for western New York, when winds normally come from the west. Wind speeds were recorded between 10-15 mph. Humidity was also uncharacteristically high for February — topping out at 93% that day. Warm air aloft, combined with freezing rain, created a temperature inversion. The moist air then trapped the odor, which lingered across the region.
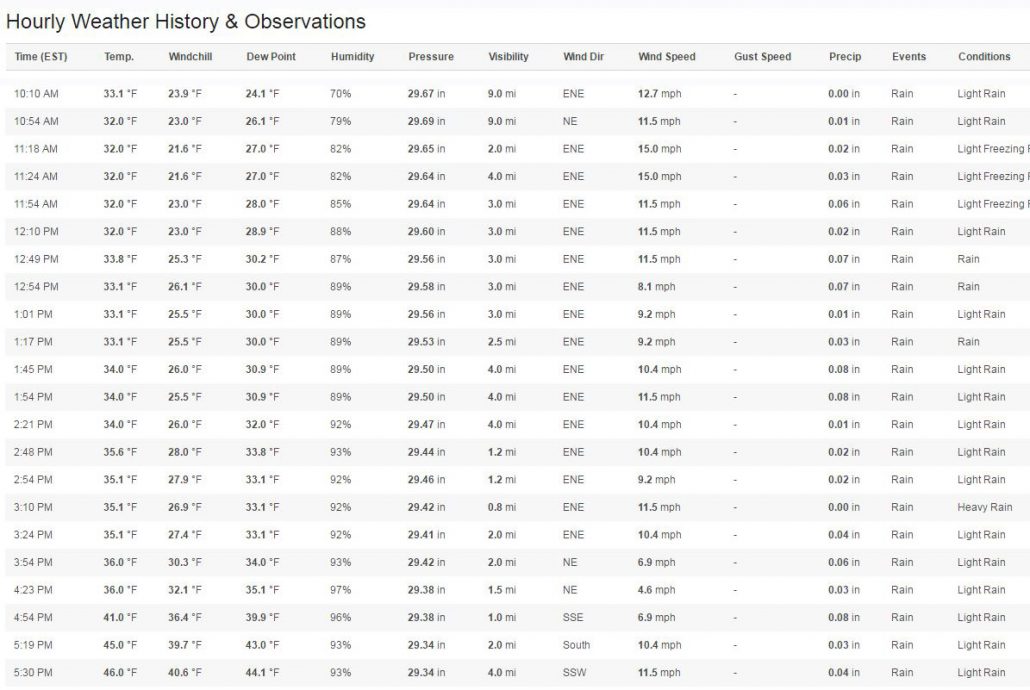
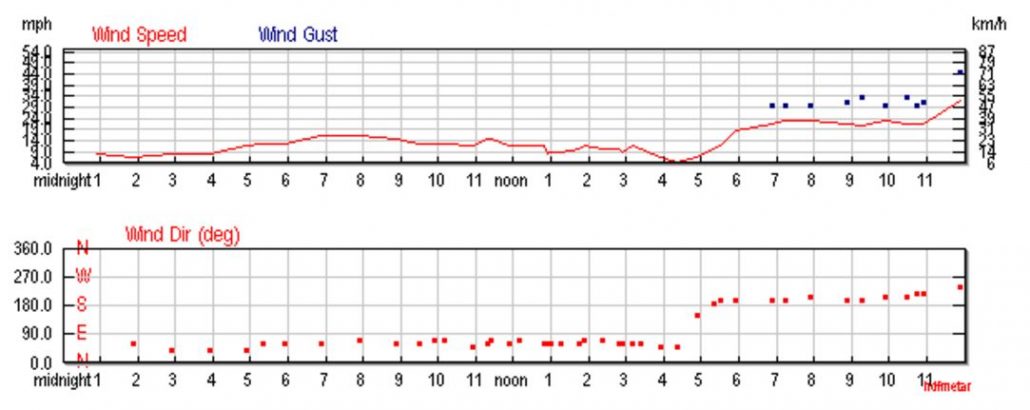
Screen captures of weather statistics on February 7, 2017 (Source: wunderground.com). Note dominant wind direction from ENE, as well as high humidity, during morning and early afternoon, when incident took place.
Who monitors air quality in Western New York?
Calls by FracTracker for clarification from the New York State DEC’s Division of Air Resources have gone unanswered. The only station at which the DEC monitors methane is located more than 275 miles away to the southeast, in the Bronx. In Erie County, where the incident took place, there are only four permanent ambient air pollution monitoring stations. These include stations in:
- Amherst: Continuous monitoring of ozone, NO2. Manual monitoring of PM5, acid deposition.
- Buffalo: Continuous monitoring of SO2, NOx, NO, NO2, NOy, CO, CPM5. Manual monitoring of PM2.5, PM10, toxics
- Brookside Terrace/Tonawanda: Continuous monitoring of SO2, CPM5. Manual monitoring of toxics and carbonyls
- Grand Island (special purpose only): Continuous monitoring of CPM5. Manual monitoring of toxics and carbonyls
“PM” refers to particulate matter diameter. PM5, for example, denotes particulate matter 5 microns in diameter, and smaller.
The East Aurora and Elma fire departments lack the appropriate air quality detection instruments to make their own judgements on the explosive nature of these gas plumes. Instead, small towns rely on the expertise of National Fuel to arrive on the scene after a call has been made, so that National Fuel can take measurements and then respond to the community. Some residents waited over three hours for an assessment, but by this time the plume had drifted away two hours ago.
National Fuel, however, has not disclosed any of the air quality data measurements they made on February 7th when they responded to this complicated incident. Ms. Marmion and others still want to know what levels of methane were measured in the communities involved in this incident, or the specific quantity of gas that entered the air that day.
What’s next?
While National Fuel did not notify the residents or the school district administration in advance of the scheduled “blowdown,” their Government Affairs Representative indicated that in the future, town governments, community leaders, and the local fire companies would be alerted to the upcoming releases and maintenance work. Nonetheless, weeks after the odor incident, National Fuel has neither contacted the local community leaders, nor local law enforcement, to provide complete and detailed answers as to what actually happened on February 7th.
By Karen Edelstein, Eastern Program Coordinator, FracTracker Alliance. Special thanks to East Aurora resident Jennifer Marmion, for her insights and comments.

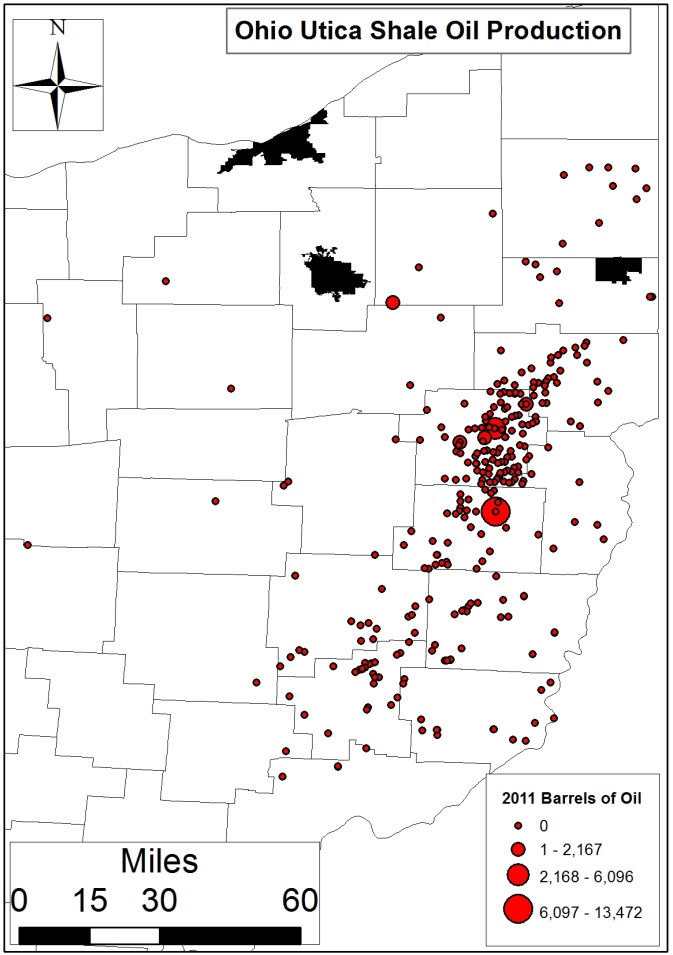
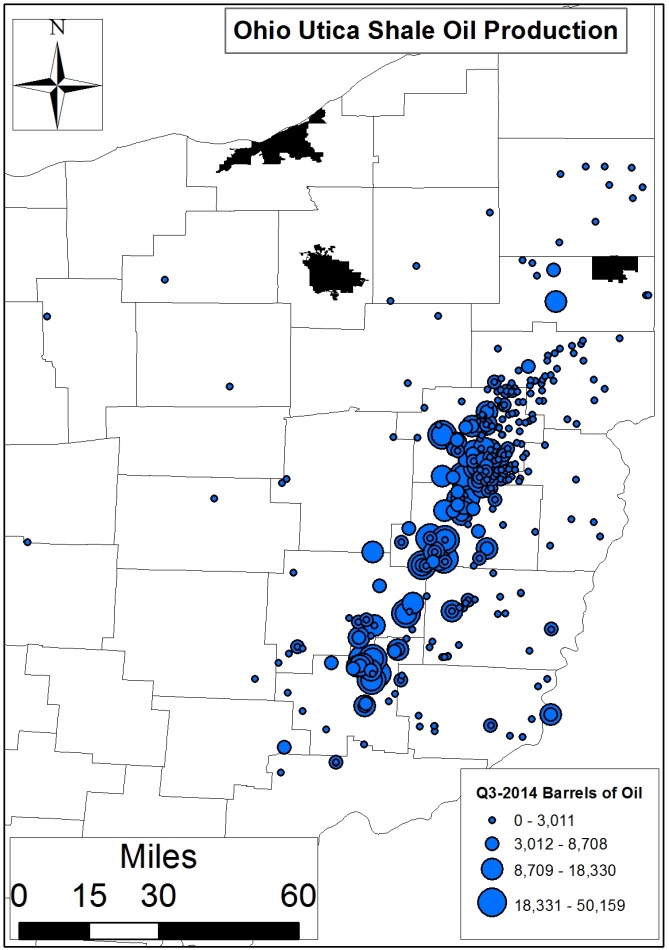
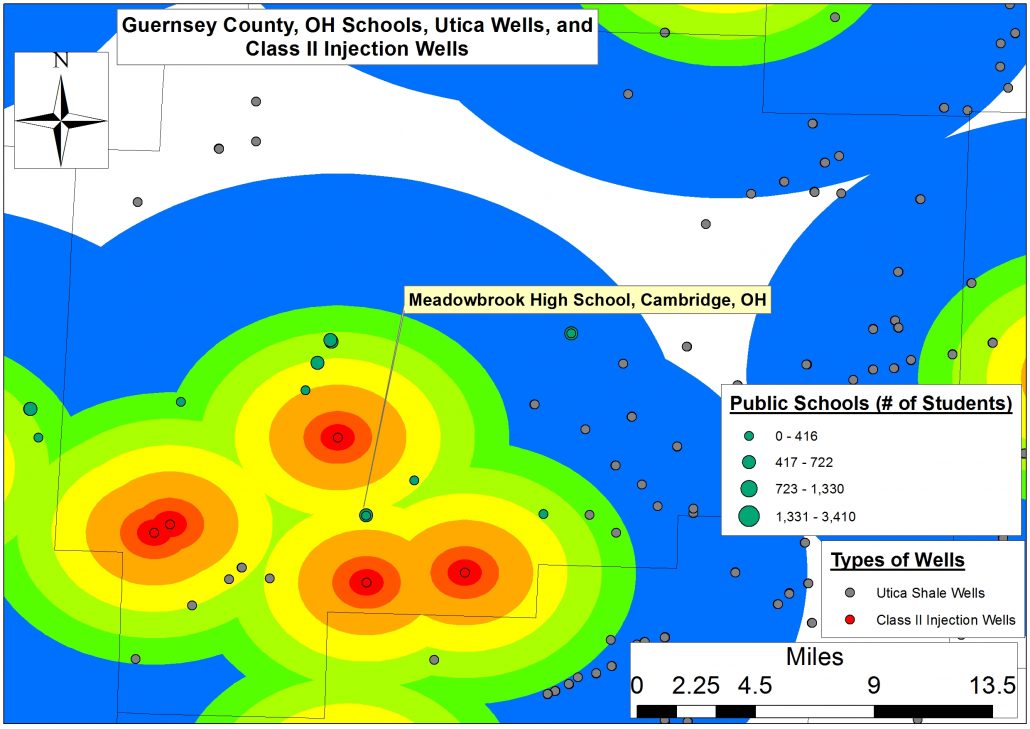


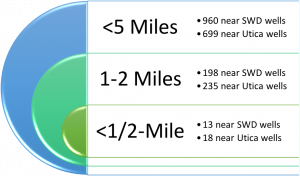 Just how close are public water supplies to Class II waste disposal wells and permitted Utica wells? As of January 15, 2017, there are 13 PWS’s within a half-mile of Ohio’s Class II SWD wells, and 18 within a half-mile of permitted Utica wells. These facilities serve approximately 2,000 Ohioans each, with an average of 112-153 people per PWS (Tables 1 and 5). Within one mile from these wells there are 64 to 66 PWSs serving 18 to 61 thousand Ohioans. That’s an average of 285-925 residents.