Wicked Witch of the Waste

The Great Plains has become the unconventional oil & gas industry’s dumping ground, prompting questions about the security and resilience of the bread basket and the underlying Ogalalla Aquifer

Back in December of 2016, FracTracker analyzed the growing link between injection wells that dispose fracking waste and “induced seismicity” [1], or human-caused earthquakes. Our compiled maps from this analysis (including Figure 1 below) show seismic activity in Kansas and Oklahoma along with Class II injection well volumes up through 2015. 

Figure 1. Earthquakes and Class II Injection Well Activity at the Kansas-Oklahoma Border

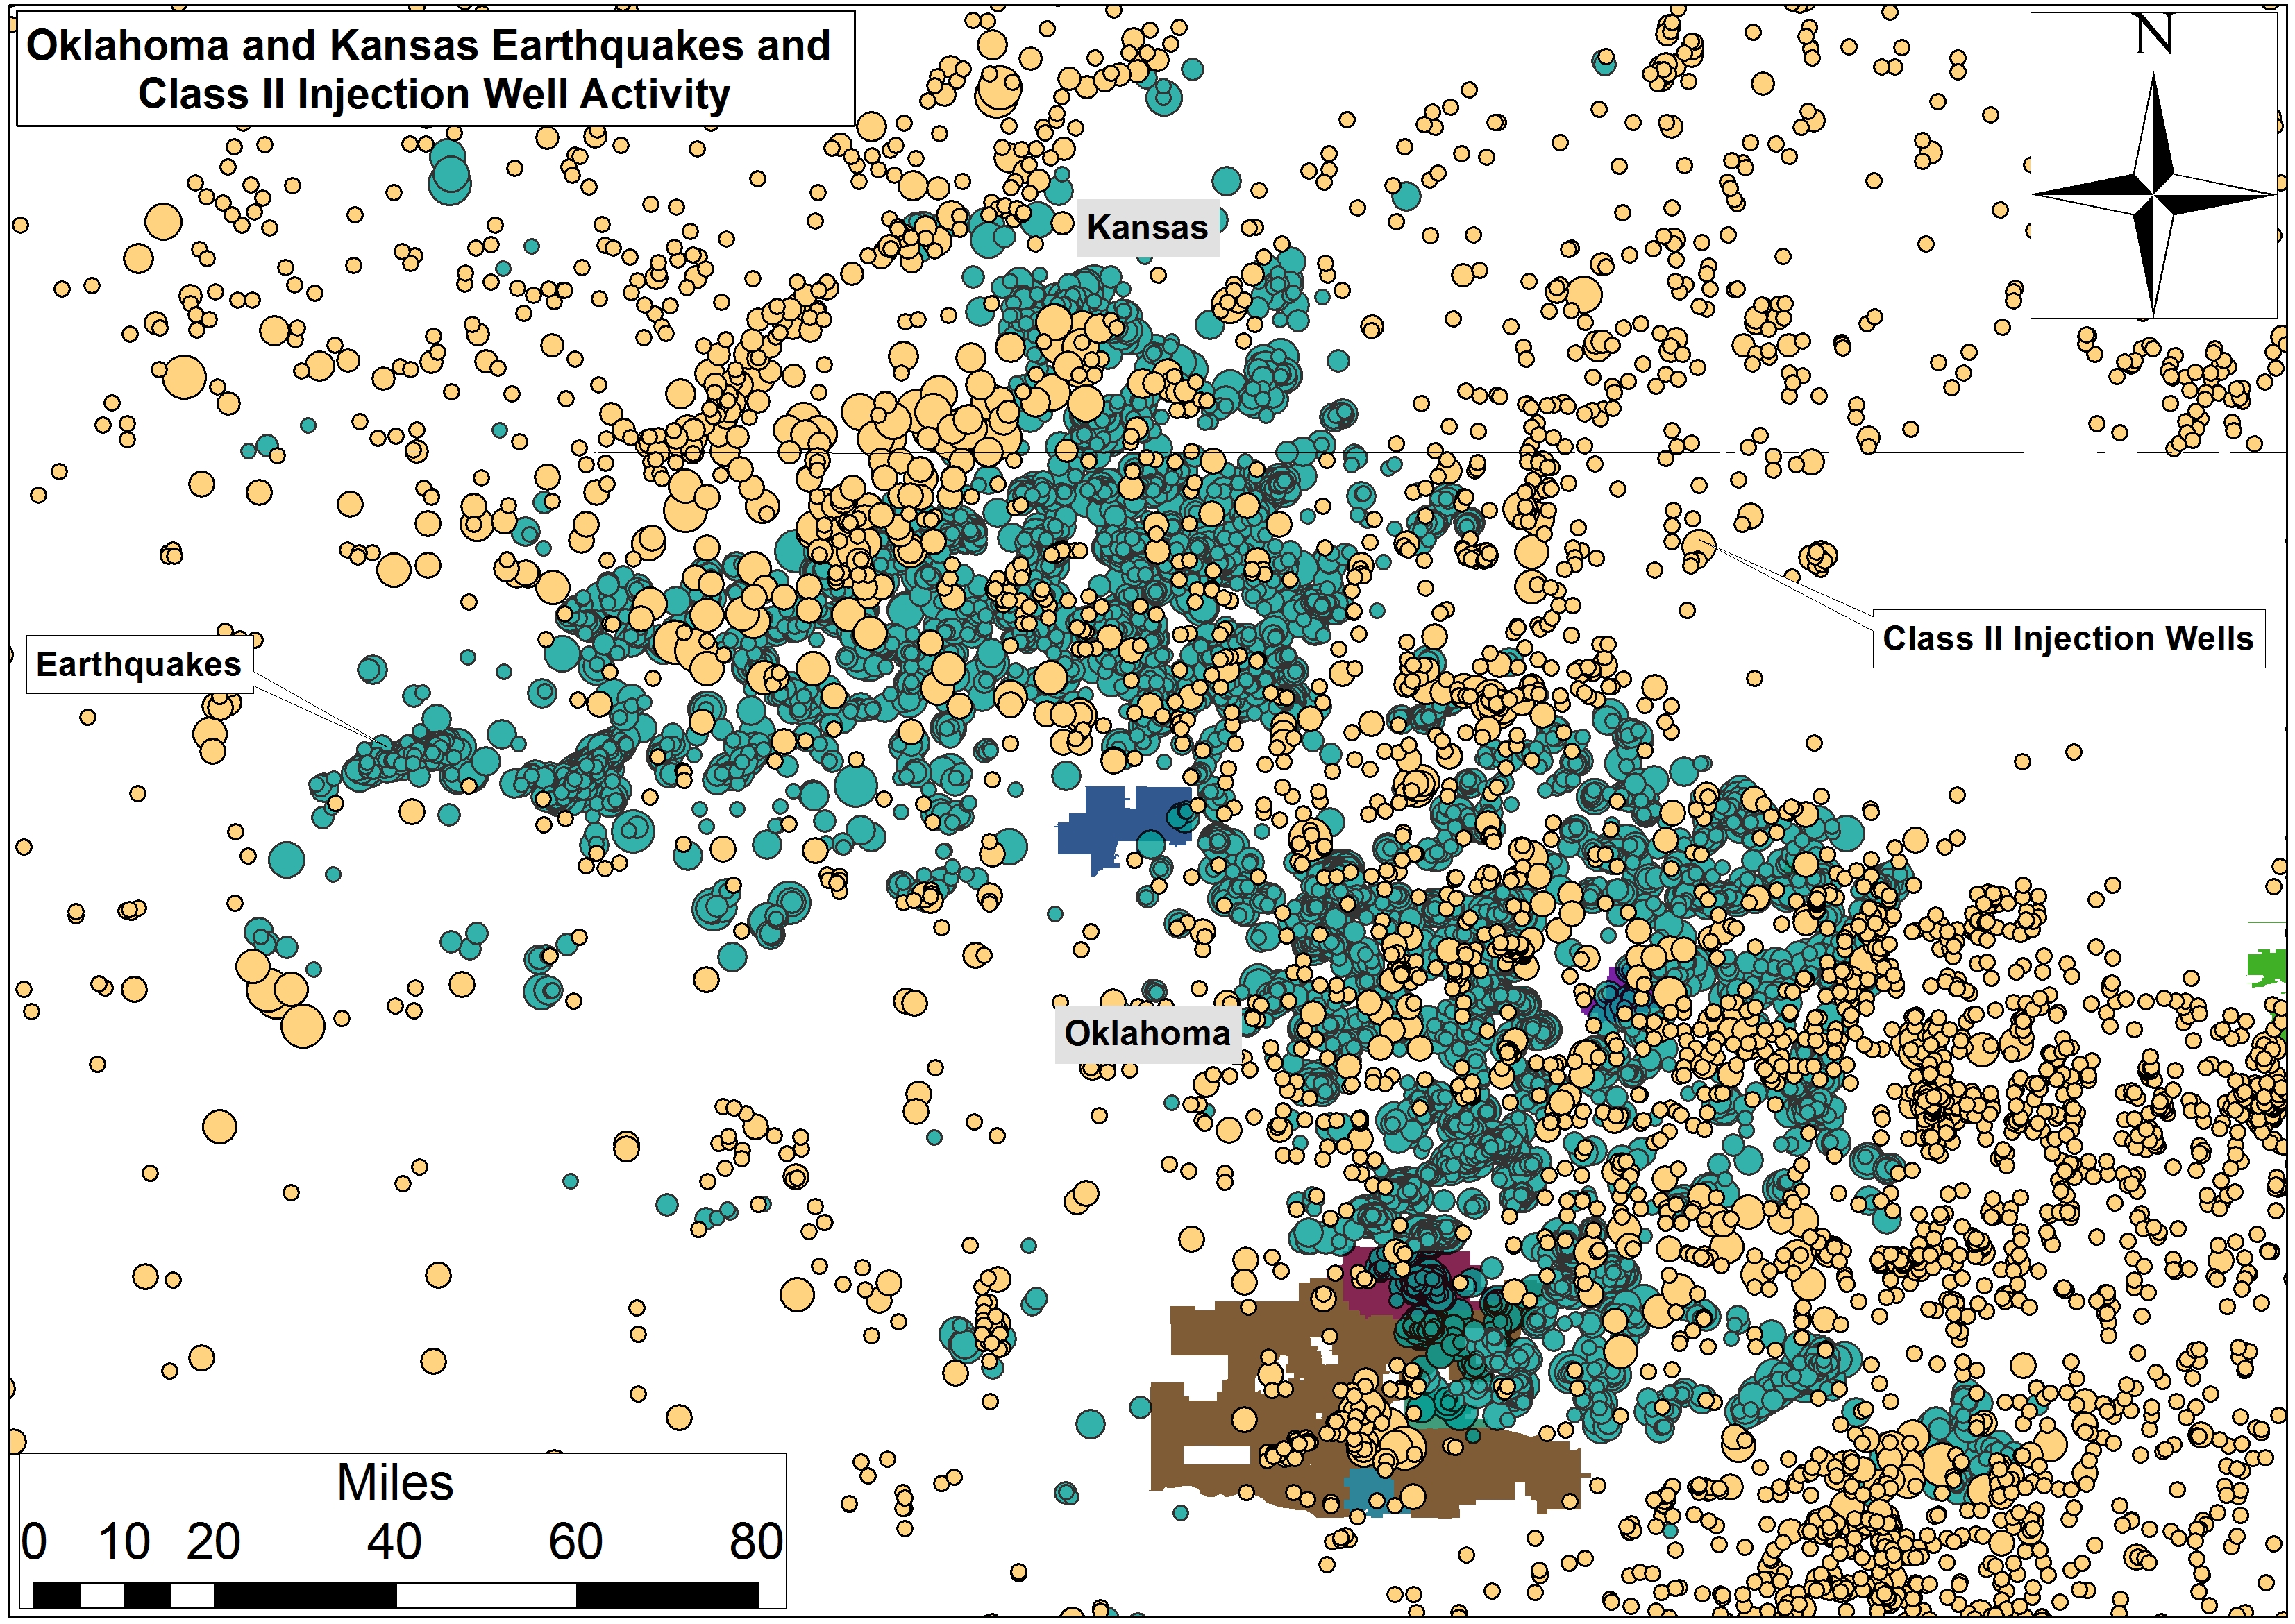
This link was given acute attention at that time as a result of the magnitude 5.8 earthquake in Pawnee, Oklahoma on September 3rd, 2016, followed closely by a 4.5 earthquake on November 1st.  The industry’s increased production of waste came home to roost 5 days later when a magnitude 5.0 quake struck a mile west of the “Cushing Hub,” the largest commercial crude oil storage center in North America. The Cushing Hub is capable of storing 54 million barrels of crude – the equivalent of 2.8 times the U.S. daily oil refinery capacity and 3.1 times the daily oil refinery capacity of all of North America.

Sunflower State of Affairs

Since we published this analysis and associated maps, Class II injection wells have been in the news several times across the Great Plains. An investigation by KSN News found that the Kansas Corporation Commission (KCC) improperly permitted over 2,000 Class II injection wells. The KCC stated that public comment periods for well proposals lasted just 15 days, instead of the correct number of 30 days. This amounts to 42% and 28% of the state’s active and total inventory of oil and gas waste receiving wells approved with inaccurate public notices.


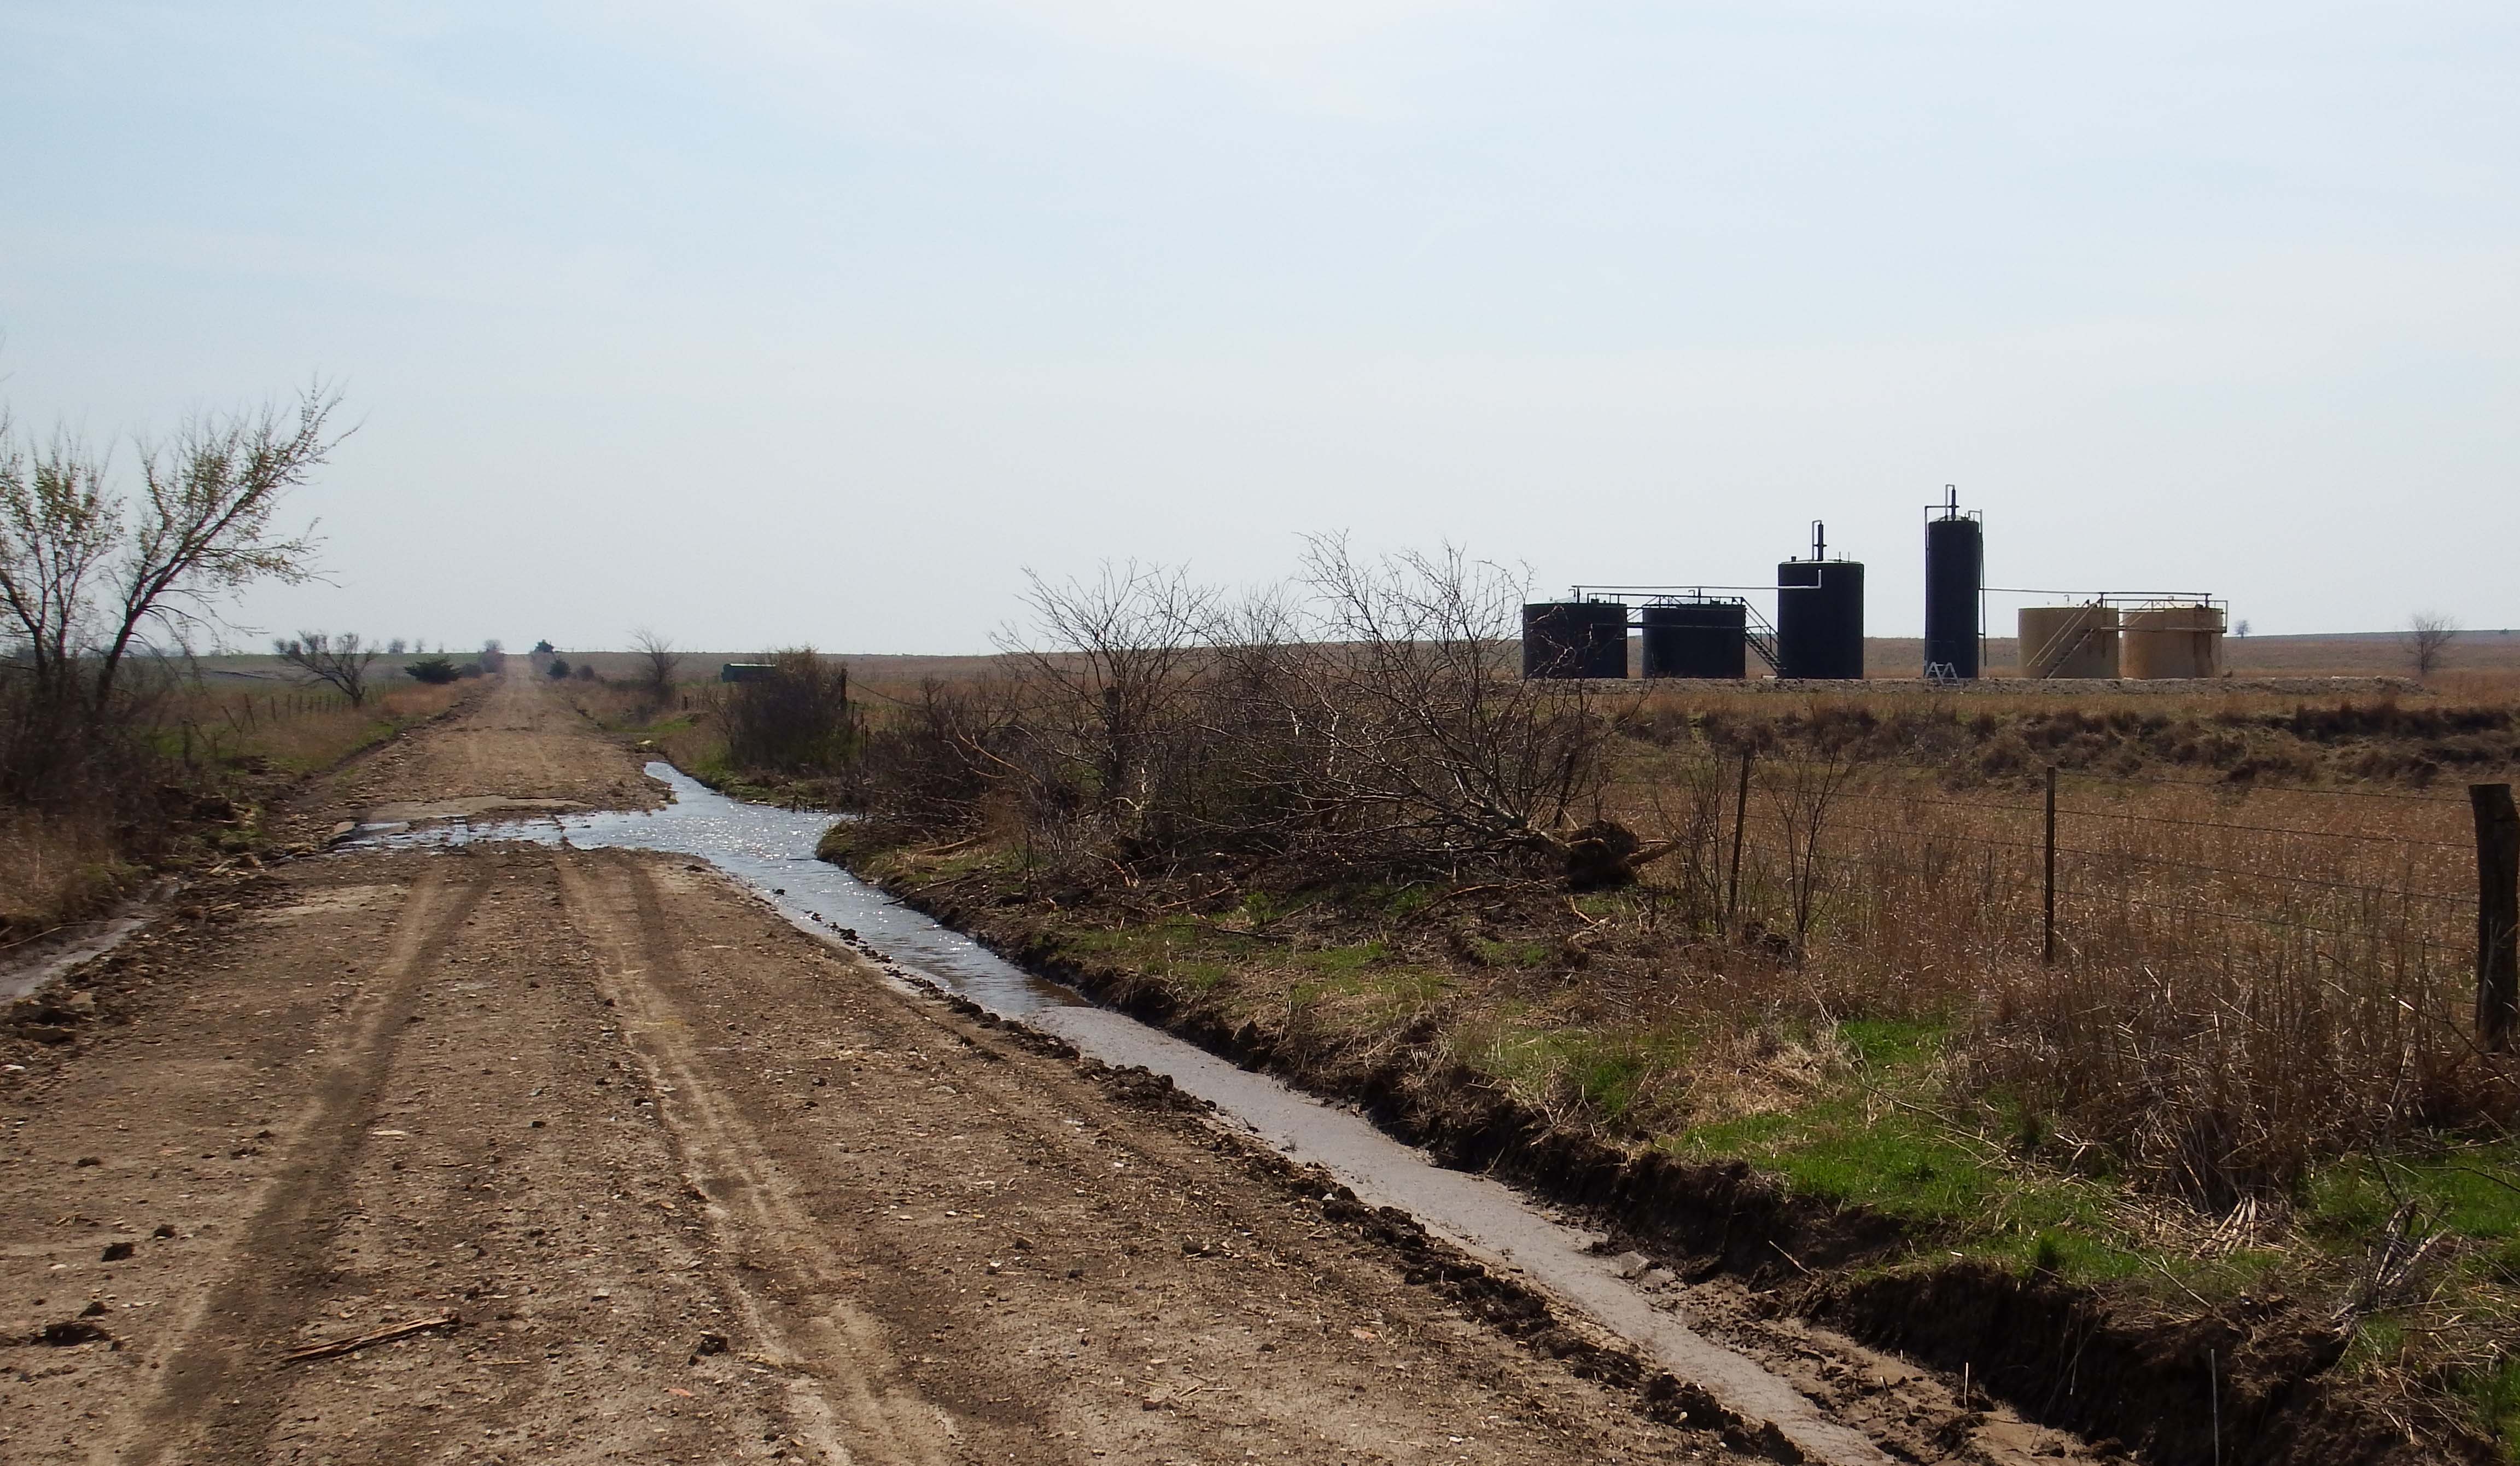
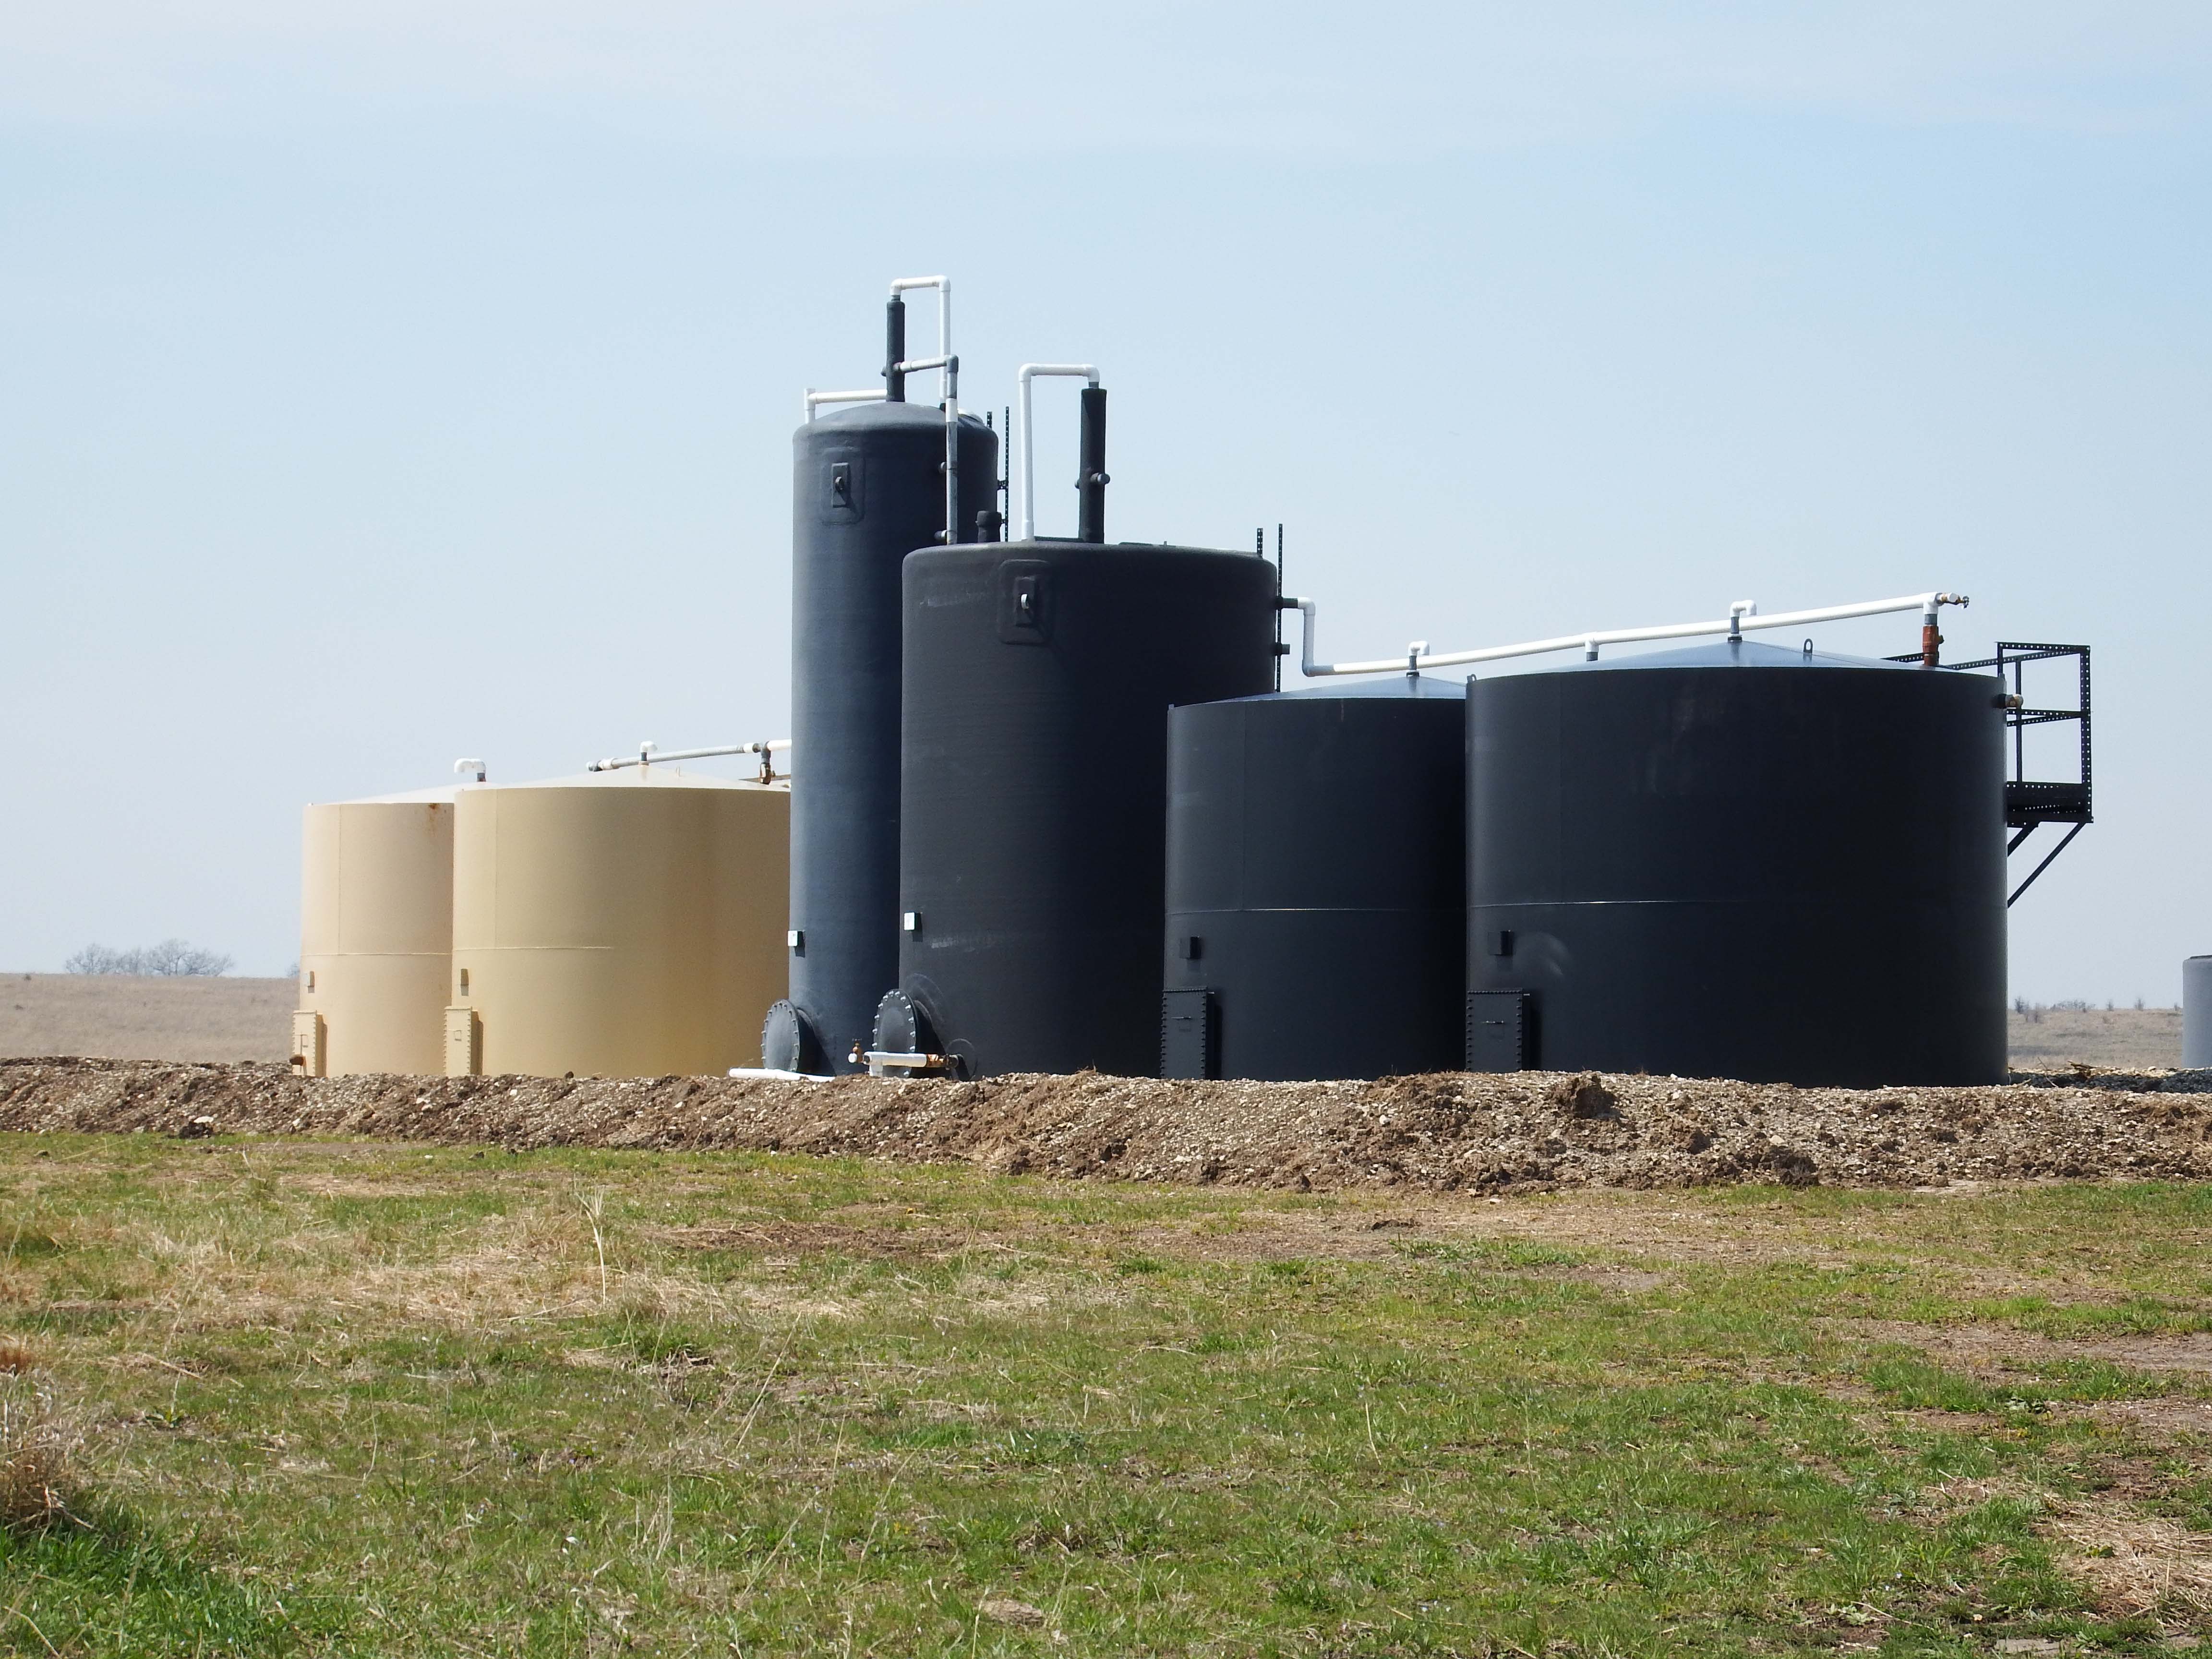
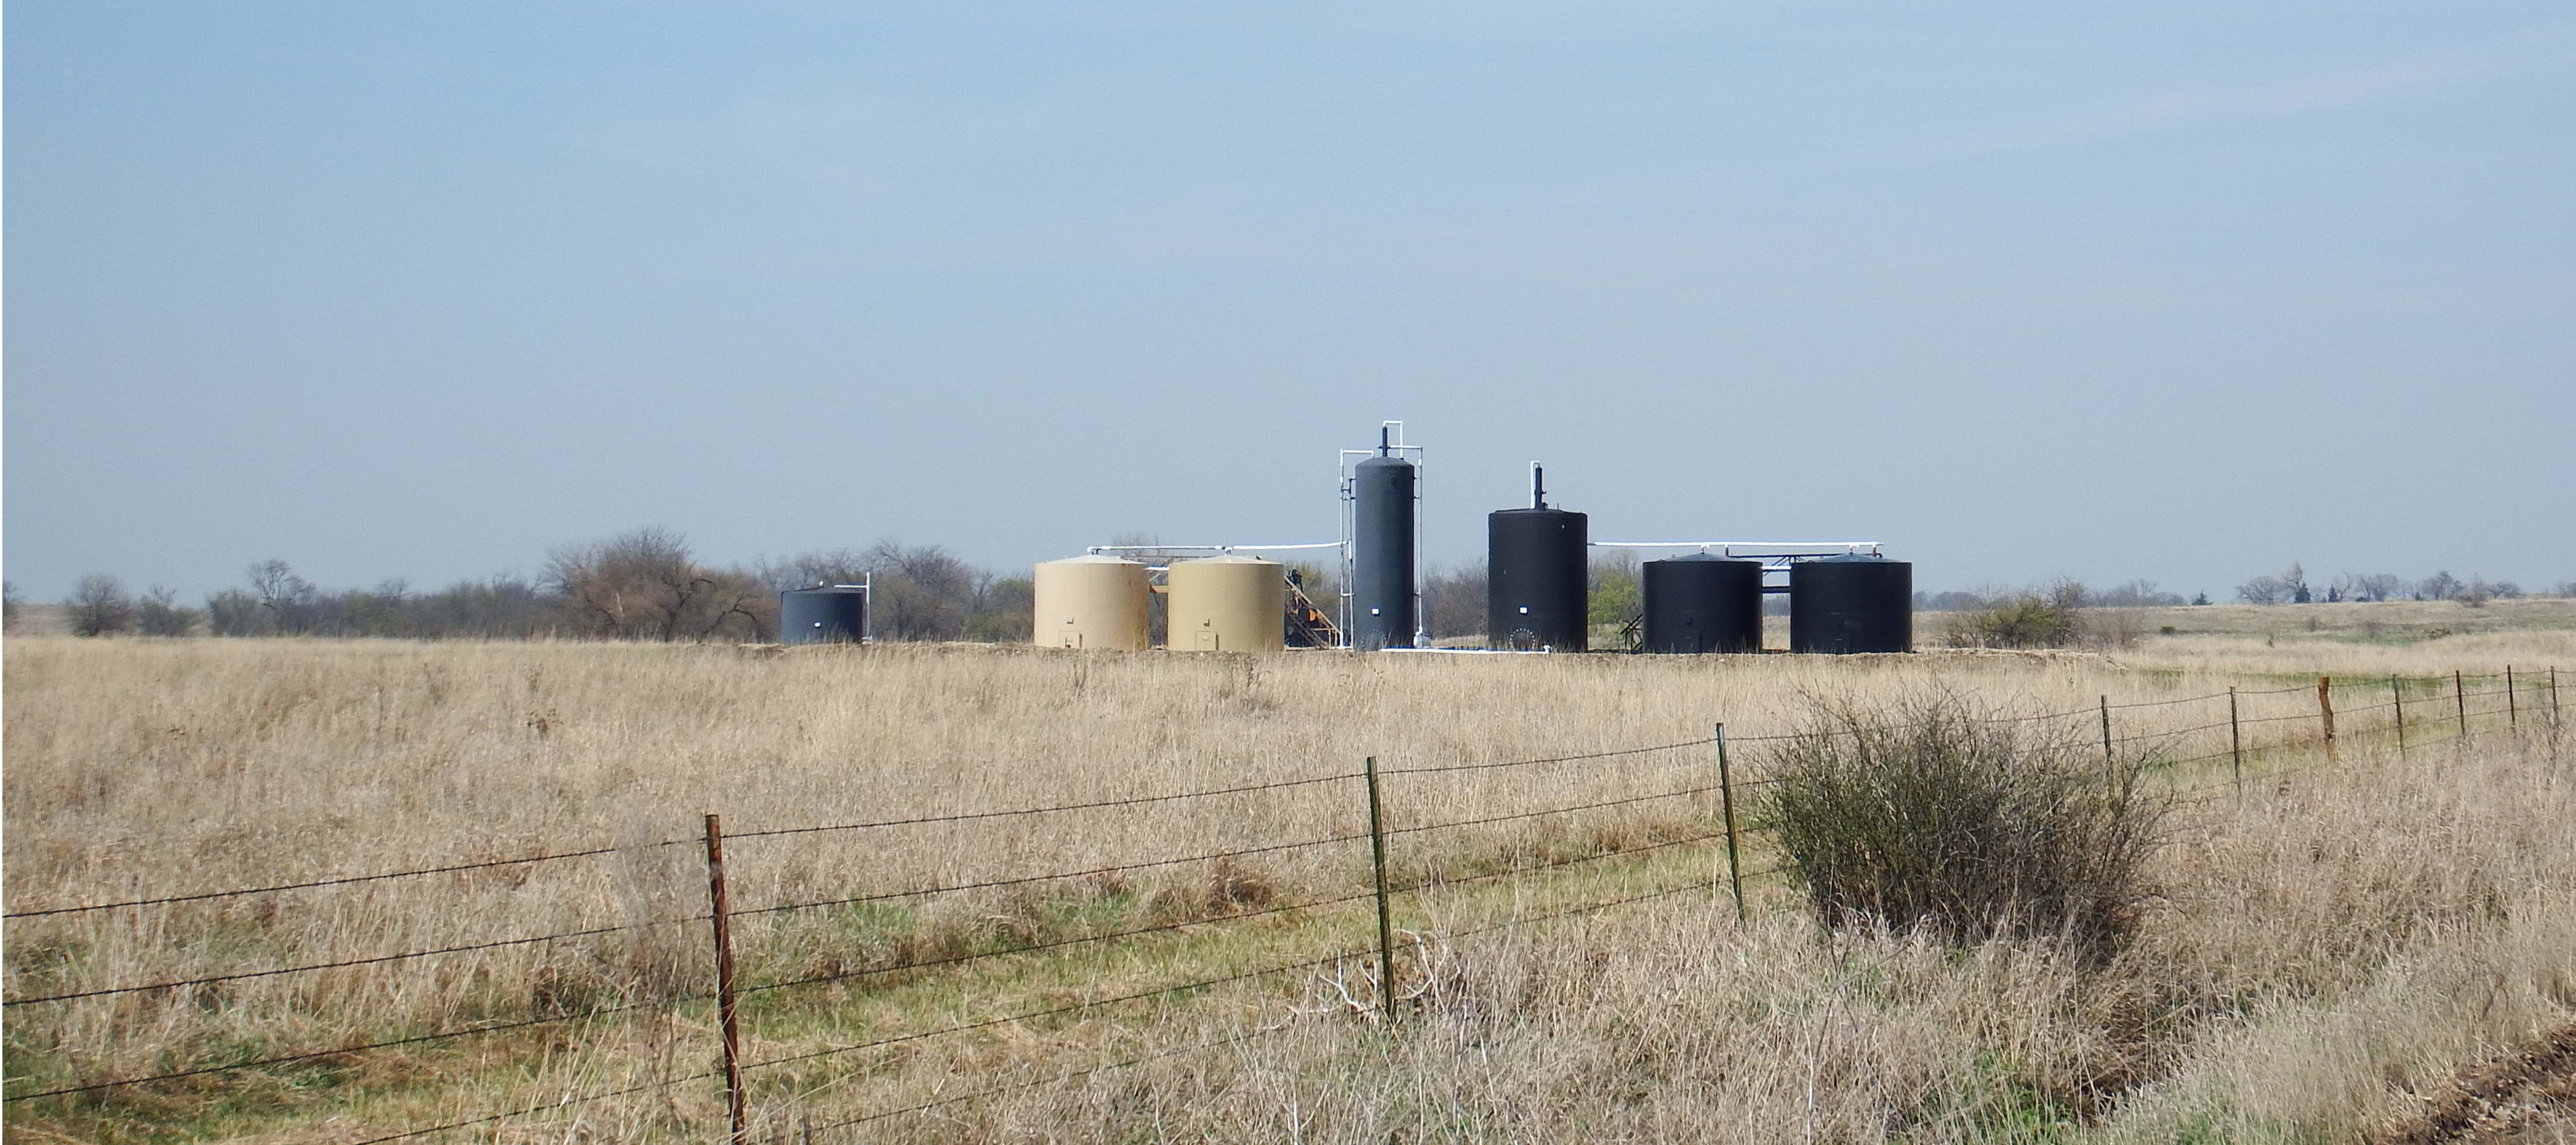
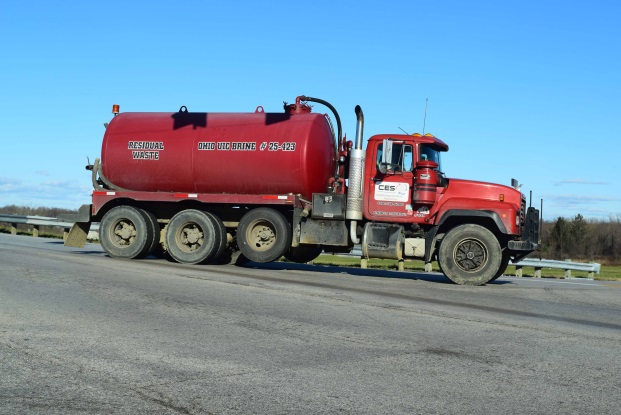
Quail Oil & Gas LC’s Class II Salt Water Disposal (SWD) well, Morris County,
KS near Diamond Creek (Photo Courtesy of Karla jo Grimmett at South 500 photography)

According to Cindy Hoedel, a freelance journalist in Kansas, the KCC responded to the investigation findings… by ruling that no remedy was needed and closing the docket.”

Attorneys representing the Sierra Club maintain that improper permitting by the KCC continued into the Fall of 2018:

“The significance is they are choking us off in terms of giving us less and less time to try to mount a protest, to submit any kind of comment, and that’s a lot,” Cindy Hoedel, a Matfield Green resident who has complained about earthquakes in her area, said… “These notices get published in these tiny little newspapers, and sometimes it might take us 15 days before we find it”

As Ms. Hoedel wrote in an email when I asked her to comment on issues relating to Kansas’ Class II injection wells:

“The Republican controlled Kansas Legislature is trying to fend off several proposed bills that would reform the KCC (the regulatory body that oversees the permitting of Class II underground injection control wells). Citizen challenges of individual applications for disposal and EOR [enhanced oil recovery] wells continue, with the KCC moving more aggressively than in the past to dismiss protestants before a hearing is held. Some of these dismissals are being challenged in appellate court. The activists’ view is that EPA, the SWDA [Safe Water Drinking Act] and Congress clearly intend for the public to be able to participate in the regulatory process; instead, KCC has written regulations that are effectively barriers to participation… Activists have questions about the large number of EOR wells being applied for in Kansas and what their true purpose is, given the insignificant amounts of oil being produced compared to high volumes of injected fluids. Another concern is that the injection well earthquakes in Oklahoma and Kansas continue, yet KCC refuses to add regs that would address seismic risk in permit applications. There is also a problem with harassment of citizens exercising their right to protest – Scott Yeargain and I were both turned in to the Kansas AG’s office by a KCC staffer on the bogus claim that we were practicing law without a license because we helped explain the convoluted process to other protesters.”


Grapes of Wrath

Meanwhile, across the border, Oklahoma City and its surrounding suburbs have become the San Francisco of the Great Plains, with regular earthquake swarms (including many that exceed magnitude 4.0). According to Think Progress reporter Samantha Page, despite the damages and lawsuits caused by these earthquakes, “for years, the state was slow to respond, while Gov. Mary Fallin (R) and others questioned the link to human activity.” 

Eventually, by the end of 2016, the Oklahoma Corporation Commission responded by implementing a ‘traffic light’ protocol, in which operations are paused or stopped altogether following earthquakes of certain magnitudes. For a time, the EPA demanded a moratorium on disposal across Class II wells injecting into the Arbuckle formation in “high seismically active focus areas.”

Chad Warmington, president of the Oklahoma Oil and Gas Association, said that this response by the EPA is “a stellar example of the inefficiency of the federal government…It’s akin to a newspaper telling us today the football scores from games played 15 months ago.”

In reporting on the industry’s response, journalist Paul Monies, buried the lead when he pointed out the following in his second to last paragraph:

“Wastewater recycling remains an expensive option compared to the low costs of disposal wells in Oklahoma. While operators can inject wastewater into formations other than the Arbuckle, Hatfield said other formations don’t accept water as easily and are at shallower depths.”

The Map

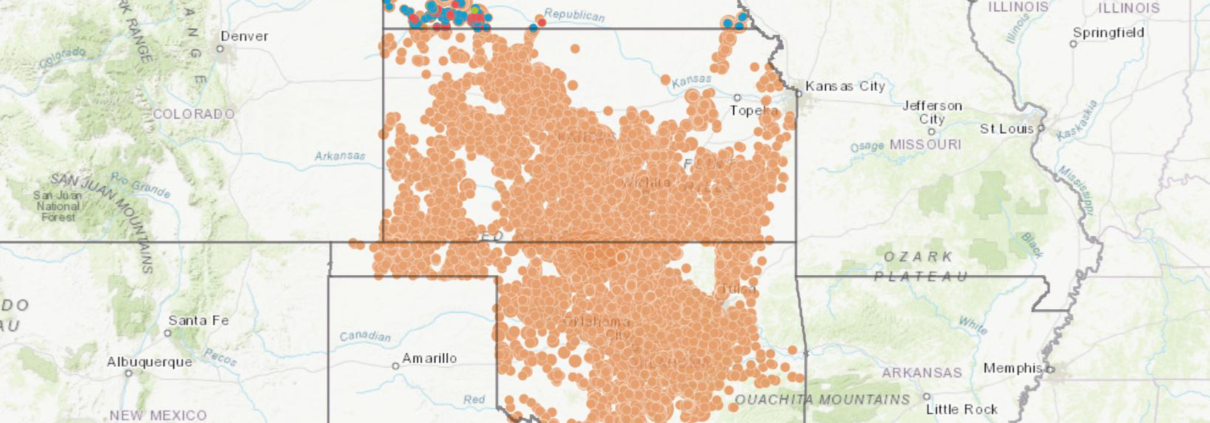
Our second stab at mapping the scale and scope of Class II injection wells across the Great Plains is slightly different than our first effort in a few ways:

  1. This iteration includes Class II Salt Water Disposal (SWD) Injection Wells in Nebraska, Oklahoma, and Kansas on one map. Clicking on a well reveals its location, well name, operator, and the volume of wastewater disposed. Volumes are presented annually for Nebraska and monthly for 2011 to 2017 for Oklahoma and Kansas. We also present annual sums for Oklahoma from 2006 to 2010.
  2. The map shows Arkansas and Platte River Basin boundaries, which contain the entire inventory of OK, NE, and KS Class II wells.
  3. We’ve included Hydrologic Unit Codes, which when zoomed in to the map, identify sub-watersheds, and the Ogalalla Aquifer boundary, courtesy of the USGS’s Sharon Qi.
  4. Finally, we’ve includedUS Forest Service Robert G. Bailey’s Ecoregions to give a sense for the types of ecosystems threatened by the O&G industry’s demand for suitable waste disposal sites

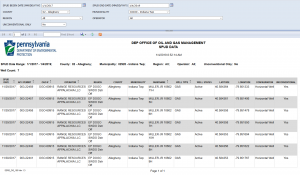
View Map Full Screen | To view the legend on this map, click the “layers” icon on the top left of the screen


Table 1, below, breaks down the volumes of oil and gas wastewater disposed in Oklahoma, Kansas and Nebraska. Volumes are measured in million barrels, with one barrel equivalent to 42 gallons. The number of Class II SWD (salt water disposal) injection wells in these states is separated to show the total number of wells permitted verse the number of wells that were active (receiving waste).

Table 1. Class II injection well volumes in 2017

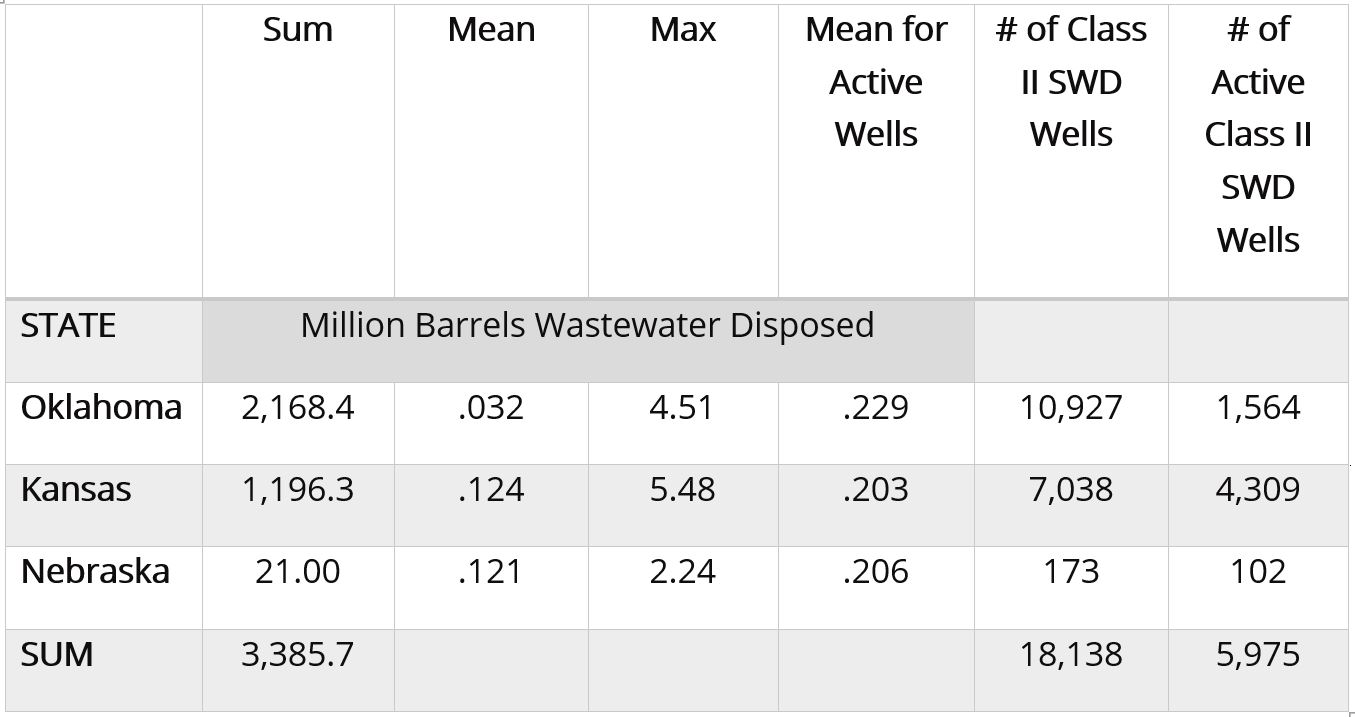
In total, 3,385,700,000 barrels of wastewater were disposed in 5,975 injection wells in these three states in 2017. The volume of wastewater disposed has increased in recent years (Table 2).

Table 2. Cumulative Class II injection well volumes to 2017, annual percent changes, and likely 2018 and 2027 volumes

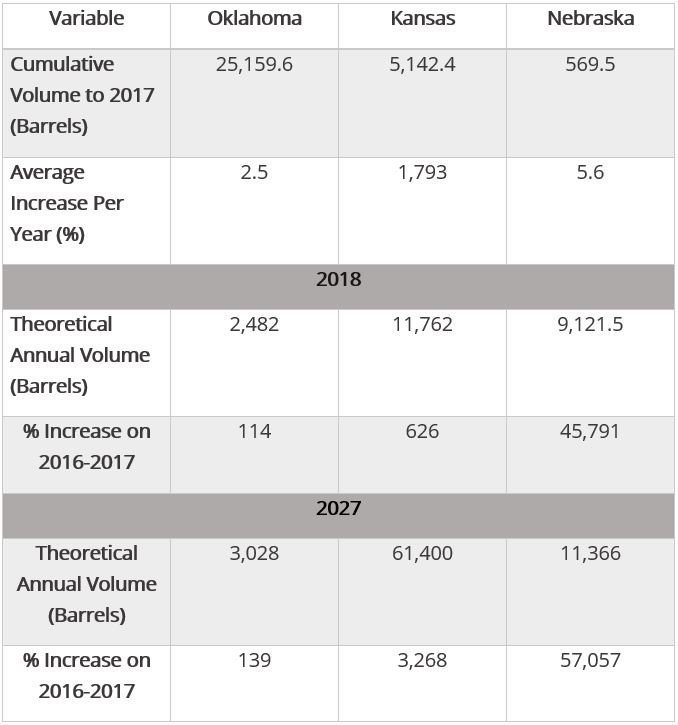
In Table 2, the theoretical annual volumes for 2018 and 2027 are predictions based on the average of linear, exponential, and polynomial models.

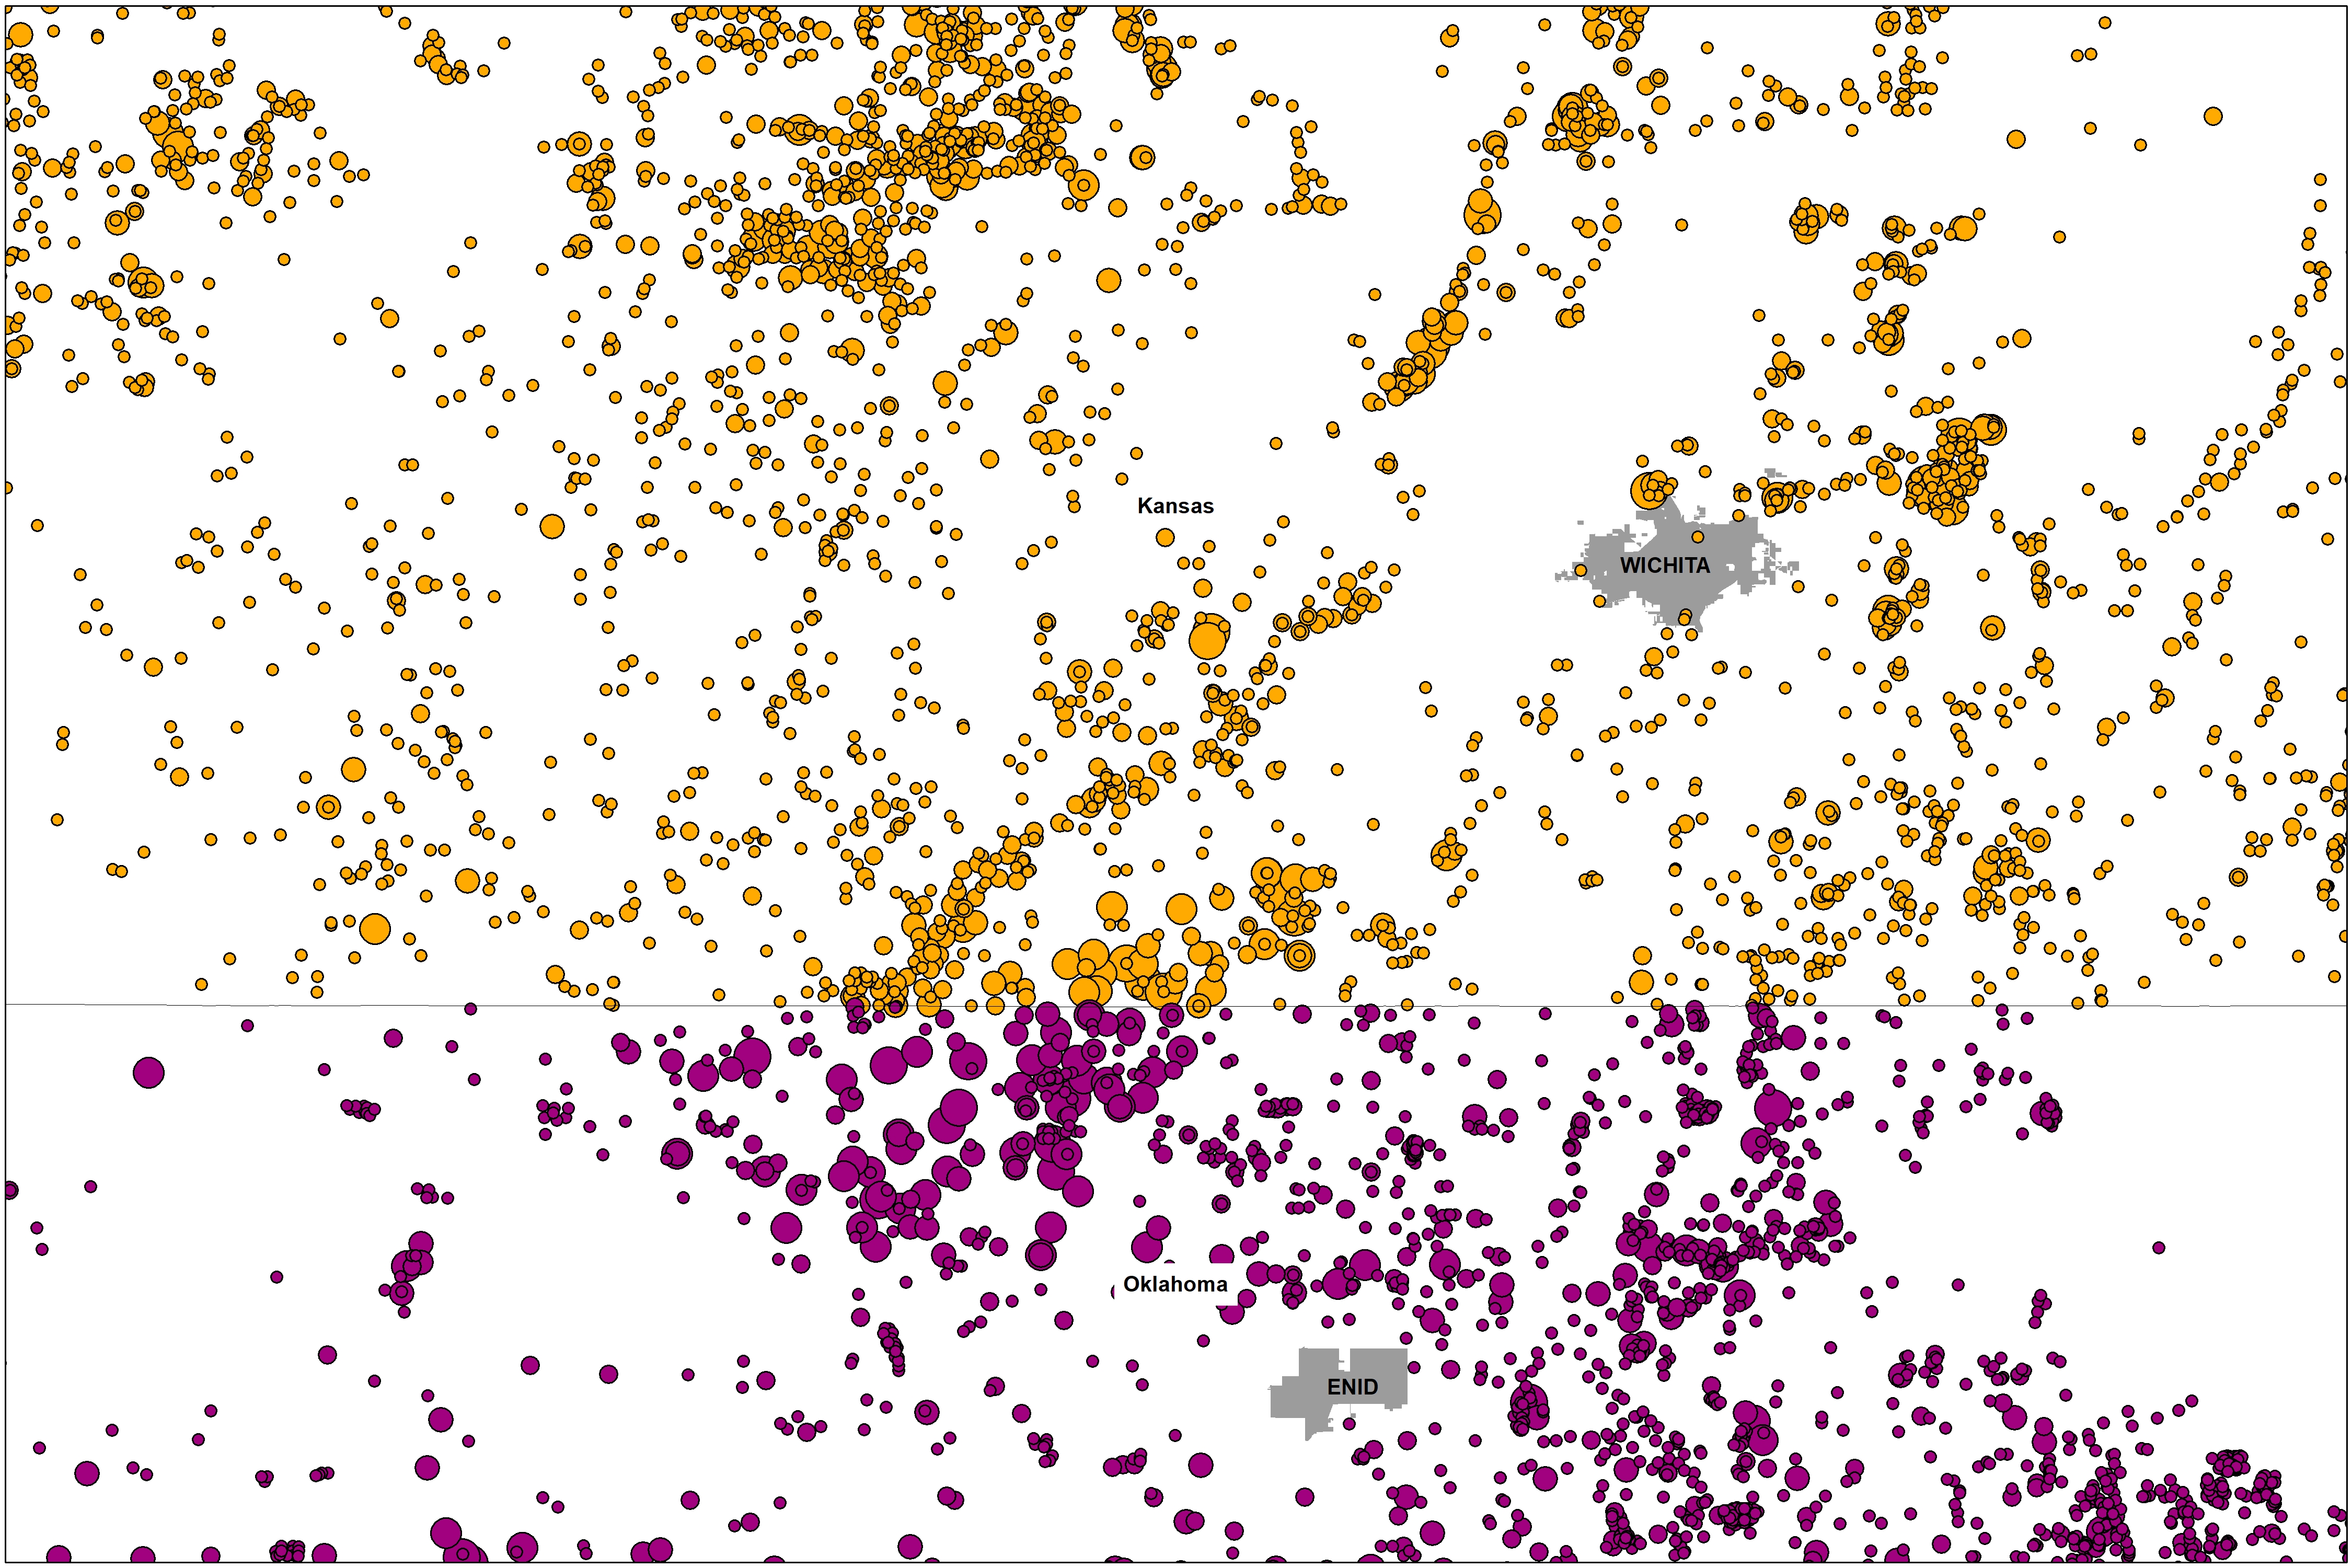
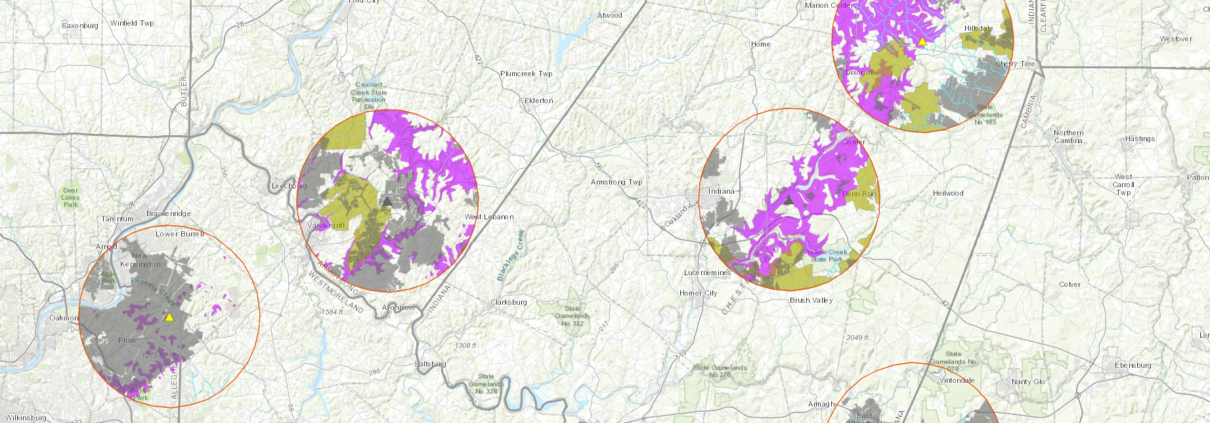
The Kansas-Oklahoma Border

It is critical that we analyze the Great Plains fracking waste ecosystem across state lines. There are several reasons for this, including the proximity of Kansas’ most active Class II wells to the Oklahoma border (Figure 2) and the potential for the KCC to use enhanced oil recovery wells in Kansas to dispose of Oklahoma’s fracking waste.

Figure 2. Class II injection well volumes for 2017 along the Kansas-Oklahoma border.

Collaboration between front line communities, non-profits like FracTracker Alliance, and groups like the Kansas Water Advocacy Team (WAT) will be crucial to understanding the impacts of waste disposal writ large.  It seems like the “food vs energy” nexus has come to a head in the heart of the U.S. Bread Basket. We’ll continue to highlight and map the issues associated with this topic in the coming months and years.

Data Download Links

The following links contain the data used in the above tables and map, for use in excel and with Geographic Information Systems (GIS).

[1] To learn more about Induced Seismicity, read an exclusive FracTracker two-part series from former researcher with Virginia Tech Department of Geosciences, Ariel Conn: Part I and Part II.

Additionally, the USGS has created an Induced Earthquakes landing page as part of their Earthquake Hazards Program.
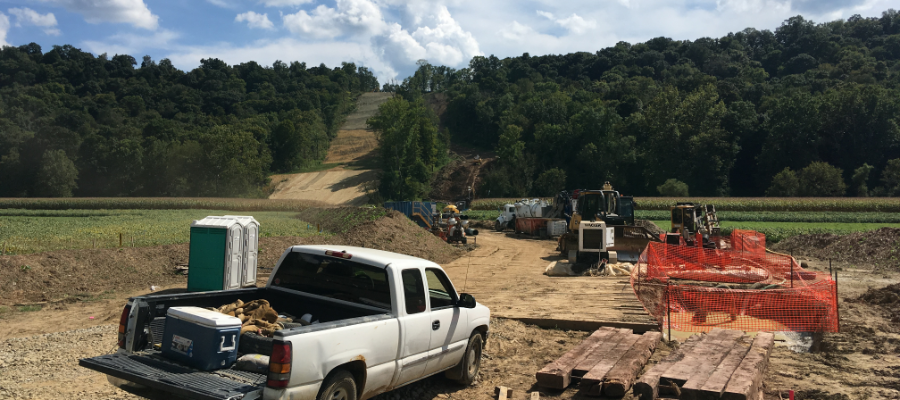
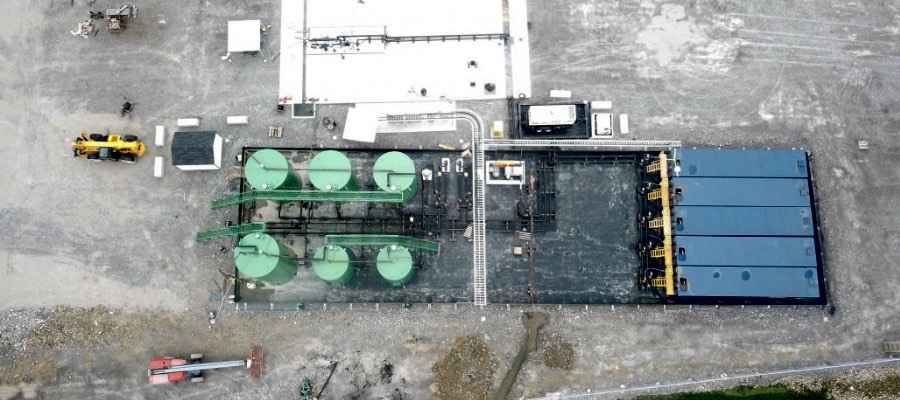
The Growing Web of Oil and Gas Pipelines

Although the vast majority of scientists agree that we must rapidly move away from fossil fuels to avoid a human-caused climate catastrophe by the end of this century, pipeline construction remains a big business.

Pipelines are the backbone of domestic fossil fuel use and for delivering fuels to terminals for international export. Yet aside from a few high-profile pipeline controversies that show up in the media, few Americans are aware of the vast network of pipelines that transport oil and gas products from sources of extraction to industry and end-use consumers.

The United States is crisscrossed by over 1.63 million miles of fossil fuel pipelines. This includes:

Many of the country’s pipelines have been built within the last few decades, and in recent years, construction of more has been spurred on by the fracking boom. The total mile count of crude oil pipelines (currently 79,000) has increased over 60% between 2004 and 2017.  Natural gas distribution and estimated service pipeline miles increased 72% between 1984 and 2017 (Figure 1).

Figure 1. Miles of natural gas distribution (1,296,157 miles) and estimated service (
927,052 miles) pipelines in the U.S., 1984-2017

Although total mileage for transmission pipelines slightly dropped between 2004 and 2017 (according to the Pipeline and Hazardous Materials Safety Administration), total mileage for Hazardous Liquids pipelines jumped 33% during that same period (Figures 2 and 3).

Figure 2 (above). Total miles of Hazardous Liquid pipelines in the U.S., 2004-2017
Figure 3 (below). Break down of Hazardous Liquid pipeline miles in the U.S by what they’re transporting, 2004-2017

Exporting natural gas

When natural gas is imported or exported, it’s transported in a liquefied form. The product occupies much less space as a liquefied natural gas (LNG) than it does in its gaseous form, making it easier to transport.

For many years, the United States was an importer of natural gas, until 2007, when this trend quickly reversed, coinciding with the “fracking boom” in the Marcellus Shale, as well as several other shale plays in Texas, Wyoming, and elsewhere.

Figure 4. U.S. imports of natural gas, which is transported as liquefied natural gas (LNG)

LNG facilities store and process natural gas to help move it between markets. Between 2010 and 2017, the number of LNG facilities increased from 122 to 152 (includes LNG storage facilities). This nearly 25% increase reflects the surplus of natural gas in the lower 48 states.

The U.S. began exporting LNG in 2016, especially to Europe and China, where demand is high. According to the United States Energy Information Administration (EIA), LNG exports doubled between 2016 and 2017 (Figure 5).

Figure 5. U.S. LNG exports between January, 2016 and October, 2017, are shown in the blue bars

Exports are again expected to double over 2018 levels by the end of 2019, reaching a storage capacity of 9.6 billion cubic feet per day. The US is now the third largest exporter of LNG, after Australia and Qatar.

The breakdown of LNG terminals —existing and future— according to FERC is shown below. These terminals receive LNG imports or ship out LNG for export. The shift from LNG import to export activity over time is quite striking. No new import facilities are currently in the planning phase, yet there are 19 export facilities proposed and another 10 already approved.  

Table 1. Import and Export LNG Terminals in the US: Current, Approved, and Proposed.

  Import Export
Current 12: Everett, MA; Cove Point, MD; Elba Island, GA; Lake Charles, LA; offshore Boston, MA (2); Freeport, TX; Sabine, LA; Hackberry, LA; Sabine Pass, LA; Pascagoula, MS; Peñuelas, PR) 3: (Cove Point, MD; Sabine, LA; Kenai, AK)
Approved 3: Corpus Christi, TX; Gulf of Mexico (2) 10: Hackberry, LA (2); Freeport, TX; Corpus Christi, TX; Sabine Pass, LA (2); Elba Island, GA; Lake Charles, LA (2); Gulf of Mexico
Proposed None 19: Pascagoula, MS;  Cameron Parish, LA (2); Brownsville, TX (3); Port Arthur, TX; Jacksonville, FL; Plaquemines Parish, LA (2); Calcasieu Parish, LA; Nikiski, AK; Freeport, TX; Coos Bay, OR; Corpus Christi, TX; La Fourche Parish, LA; Sabine Pass, LA; Galveston Bay, TX

The challenge of keeping up

One of the challenges in working on oil and gas-related environmental advocacy is that from week to week, there are always changes in pipeline status. New pipelines are announced, others are delayed, others are postponed, and in some cases, projects are cancelled or defeated. Pipelines that have been under construction for years go on line. Listings are piece-meal, sometimes very vague, and sometimes reported by third and fourth party sources.

FracTracker is committed to sorting through this information, and providing a window into the expansion of oil and gas infrastructure. We have mapped and assembled information on over 60,000 miles of new and proposed oil and gas transmission pipelines and mapped over 250 projects since 2017.

Of these 60,000 pipeline miles, almost 9,800 have been completed and/or are operating. Close to 7,500 miles were cancelled or defeated. This leaves another 42,700 miles of pipeline that are currently in the replacement, reversal, planning or construction stages. 

In the interactive map below, against a background of existing pipelines, we show the newest pipelines that have come “on the radar” since 2017. In addition we show LNG terminals, one of the main destinations for the gas that flows through the pipelines to the export market.

Updated U.S. pipeline and LNG terminal map

View Map Full Screen | How Our Maps Work

Our mapping process

FracTracker is dedicated to bringing transparency to the landscape of oil and gas development. We use mapping tools such as GIS (geographic information systems) to illuminate developments in oil and gas infrastructure expansion.

Where do we get our data?

We draw our information from new listings by the United States Energy Information Administration (EIA) and Sierra Club for natural gas projects. In addition, we find announcements about new crude oil and gas pipeline projects on RBN Energy’s website. 

After we create a composite list of pipelines, the research begins. We search the internet for references to each pipeline, looking for industry announcements, descriptions, news articles, and, most importantly, the docket listings of the Federal Energy Regulatory Commission (FERC).

FERC may release detailed maps of pipeline routes from the company’s Environmental Impact Statement (EIS), filed after operators have progressed past the initial phases of planning. On occasion, we’ll stumble across links to Google Earth files that grassroots groups have ground-truthed. We can convert these .kml files into our ArcGIS mapping software directly.

Digital cartography

How do we go from online pictures of maps to data that we can use in our interactive maps? For the most part, we use a process called georeferencing, also known in some circles as “rubber-sheeting”. One of the beauties of digital cartography and GIS is that through the magic of computing, we can add information about location to mapped information. This allows us to add different features to a map, such as roads or rivers, and ensure that they line up correctly.

Let’s say I have a .jpg (image) file of a pipeline map that crosses four counties in Indiana. The .jpg shows both the pipeline and the county boundaries. I can open my GIS program and add a reference basemap of the United States, which is similar to what you see when you open Google Maps. I can zoom in to Indiana and add a second GIS layer of Indiana’s counties (already built with coordinates in the digital information), and voila! It drops right into where Indiana is on my base map. Can I do this with the pipeline .jpg? Not yet!

I have to use the clues on the pipeline image to place it in the correct location on the GIS map. Luckily, my pipeline map has county boundaries on it, so I can line up the corners (or other shapes) on the pipeline image to where they are on my map that is “smart” about location using ground control points.

Once I’m satisfied that the map I’ve added is in the correct location, I carefully trace the path of the pipeline, saving it as a GIS layer. Because it’s drawn with its own location data included, it will always appear in future maps in the same place relative to the rest of Indiana.

That’s our process in a nutshell.

Want to see this done as a demo? Here’s a nice 10-minute YouTube video:

https://www.youtube.com/watch?v=PHtxbpboDro

By Karen Edelstein, Eastern Program Coordinator

Well Pad

Sow Love and Hope with FracTracker

FracTracker Alliance celebrates February, the “month of love,” as we do most months – by striving to help people and the planet. A few weeks ago, we sent checks to four organizations who were recipients of our December “spreading the cheer initiative,” receiving half our online donations that month in honor of the four winners of the 2018 Community Sentinel Award.  The beneficiaries included Redeemer Community Partnership (Los Angeles, CA), SkyTruth (Shepherdstown, WV), League of Oil and Gas Impacted Coloradans (Erie, CO), and Clean Air Council (Philadelphia, PA). Thanks to our December donors for providing a total of $860 to these important groups.

Our care extends beyond our nonprofit brethren to directly address Mother Earth. Less than 120 miles north of my office, Pine Creek flows to the Susquehanna River, draining nearly 1,000 square miles and encompassing one of the highest concentrations of exceptional value and high quality streams anywhere in the Keystone state. The creek’s breathtaking 47-mile gorge is known as the Grand Canyon of Pennsylvania.

Photo of Pine Creek Gorge by Nicholas Tonelli, Flickr

Unfortunately, the Pine Creek watershed has been inundated by hundreds of unconventional and conventional natural gas wells and the pipelines, compressor stations, impoundments and access roads that accompany oil and gas development.  It is estimated that in the watershed’s Tiadaghton State Forest, more than 1,000 acres have already been disturbed by gas operations.  Much of this degradation has occurred in the last 10 years. With wilderness in the balance, FracTracker – with support from the Foundation for Pennsylvania Watersheds – is examining what a decade of drilling means for this treasured landscape and its beloved woods and waters.

Over the next few months, we aim to construct a digital atlas – ripe with vivid, detailed maps and data – to tell the story of the changes in this emblematic place. The capstone will be an extensive field documentation tour using staff and volunteers deployed with cameras and the FracTracker mobile app. With the help of groups like the Pennsylvania chapter of the Sierra Club, Save Pennsylvania Forests Coalition, Responsible Drilling Alliance, Middle Susquehanna RiverKeeper, LightHawk, and others, images from the ground and air will be collected and included in the atlas project. The final product will be an invaluable tool to educate diverse audiences about the risks of natural gas development on Pine Creek, the Susquehanna watershed, and our public lands.

Near and far – for people, the planet, and precious watersheds like Pine Creek – there’s so much to do. Please consider becoming a FracTracker recurring monthly donor. Your gesture warms our hearts, nurtures our work, and sows hope –with invaluable information, tenacious solidarity, and the unstoppable spirit of love.

By Brook Lenker, Executive Director, FracTracker Alliance

destroyed home following pipeline explosion in San Bruno, CA

Unnatural Disasters

Guest blog by Meryl Compton, policy associate with Frontier Group

Roughly half of the homes in America use gas for providing heat, hot water or powering appliances. If you use gas in your home, you know that leaks are bad – they waste money, they pollute the air, and, if exposed to a spark, they could spell disaster.

Our homes, however, are only the end point of a vast production and transportation system that brings gas through a network of pipelines all the way from the wellhead to our kitchens. There are opportunities for wasteful and often dangerous leaks all along the way – leaks that threaten the public’s health and safety and contribute to climate change.

How frequent are gas leaks?

Between January 2010 and November 2018, there were a reported 1,888 incidents that involved a serious injury, fatality or major financial loss related to gas leaks in the production, transmission and distribution system, according to data from the Pipeline and Hazardous Materials Safety Administration. These incidents caused 86 deaths, 487 injuries and over $1 billion in costs.

When gas lines leak, rupture, or are otherwise damaged, the gas released can explode, sometimes right in our own backyards. Roughly one in seven of the incidents referenced above – 260 in total – involved an explosion.

In September 2018, for example, a series of explosions in three Massachusetts communities caused one death, numerous injuries and the destruction of as many as 80 homes. And there are many more stories like it from communities across the U.S. From the 2010 pipeline rupture and explosion in San Bruno, California, that killed eight people and destroyed almost 40 homes to the 2014 disaster in New York City that destroyed two five-story buildings and killed eight people, these events serve as a powerful reminder of the danger posed by gas.

The financial and environmental costs

Gas leaks are also a sheer waste of resources. While some gas is released deliberately in the gas production process, large amounts are released unintentionally due to malfunctioning equipment, corrosion and natural causes like flooding. The U.S. Energy Information Administration estimates that 123,692 million cubic feet of gas were lost in 2017 alone, enough to power over 1 million homes for an entire year. That amount is likely an underestimate. On top of the major leaks reported to the government agency in charge of pipeline safety, many of our cities’ aging gas systems are riddled with smaller leaks, making it tricky to quantify just how much gas is lost from leaks in our nation’s gas system.

Leaks also threaten the stability of our climate because they release large amounts of methane, the main component of gas and a potent greenhouse gas. Gas is not the “cleaner” alternative to coal that the industry often makes it out to be. The amount of methane released during production and distribution is enough to reduce or even negate its greenhouse gas advantage over coal. The total estimated methane emissions from U.S. gas systems have roughly the same global warming impact over a 20-year period as all the carbon dioxide emissions from U.S. coal plants in 2015 – and methane emissions are likely higher than this amount, which is self-reported by the industry.

In most states, there is no strong incentive for gas companies to reduce the amount of leaked gas because they can still charge customers for it through “purchased gas adjustment clauses.” These costs to consumers are far from trivial. Between 2001 and 2011, Americans paid at least $20 billion for gas that never made it to their homes.

These and other dangers of gas leaks are described in a recent fact sheet by U.S. PIRG Education Fund and Frontier Group. At a time when climate change is focusing attention on our energy system, it is critical that communities understand the full range of problems with gas – including the ever-present risk of leaks in the extensive network of infrastructure that brings gas from the well to our homes.

The alternative

We should not be using a fuel that endangers the public’s safety and threatens the stability of our climate. Luckily, we don’t have to. Switching to electric home heating and hot water systems and appliances powered by renewable energy would allow us to move toward eliminating carbon emissions from homes. Electric heat pumps are twice as efficient as gas systems in providing heat and hot water, making them a viable and commonsense replacement. Similarly, as the cost of wind and solar keep falling, they will continue to undercut gas prices in many regions.

It’s time to move beyond gas and create a cleaner, safer energy system.

By Meryl Compton, policy associate with Frontier Group, a non-profit think tank part of The Public Interest Network. She is based in Denver, Colorado.

Feature image at top of page shows San Bruno, California, following the 2010 pipeline explosion

Getting Rid of All of that Waste – Increasing Use of Oil and Gas Injection Wells in Pennsylvania

Oil and gas development generates a lot of liquid waste.

Some of the waste comes that comes out of a well is from the geologic layer where the oil and gas resources are located. These extremely saline brines may be described as “natural,” but that does not make them safe, as they contain dangerous levels of radiation, heavy metals, and other contaminants.

Additionally, a portion of the industrial fluid that was injected into the well to stimulate production, known as hydraulic fracturing fluid, returns to the surface.  Some of these substances are known carcinogens, while others remain entirely secret, even to the personnel in the field who are employed to use the additives.

The industry likes to remind residents that they have used this technique for more than six decades, which is true. What separates “conventional” fracking from developing unconventional formations such as the Marcellus Shale is really a matter of scale.  Conventional formations are often stimulated with around 10,000 gallons of fluid, while unconventional wells now average more than 10 million gallons per well.

In 2017 alone, Pennsylvania oil and gas wells generated 57,653,023 barrels (2.42 billion gallons) of liquid waste.

Managing the waste stream

Liquid waste can be reused to stimulate other oil and gas wells, but reuse concentrates the contaminant load in the fluid. There is a limit to this concentration that operators can use, even for this industrial purpose.

Another strategy is to decrease the volume of the waste through evaporation and other treatment methods. This also increases the contaminant concentration. Pennsylvania used to permit “treatment” of wastewater at sewage treatment facilities, before being forced to concede that the process was completely ineffective, and resulted in contaminating streams and rivers throughout the Commonwealth.

In many states, much of this waste is disposed of in facilities known as salt water disposal (SWD) wells, a specific type of injection well. These waste facilities fall under the auspices of the US Environmental Protection Agency’s Underground Injection Control (UIC) program. Such wells are co-managed with states’ oil and gas regulatory agencies, although the specifics vary by state.

These photos show SWD wells in other states, but what about in Pennsylvania?

The oil and gas industry in Pennsylvania has not used SWD wells as a primary disposal method, as the state’s geology has been considered unsuitable for this process.  For example, on page 67 of this 2009 industry report, the authors saw treatment of flowback fluid at municipal facilities as a viable option (before the process was  banned in 2011), but underground injection as less likely (emphasis added):

The disposal of flowback and produced water is an evolving process in the Appalachians. The volumes of water that are being produced as flowback water are likely to require a number of options for disposal that may include municipal or industrial water treatment facilities (primarily in Pennsylvania), Class II injection wells [SWDs], and on-site recycling for use in subsequent fracturing jobs. In most shale gas plays, underground injection has historically been preferred. In the Marcellus play, this option is expected to be limited, as there are few areas where suitable injection zones are available.

The ban on surface “treatment” being discharged into Pennsylvania waters has increased the pressure for finding new solutions for brine disposal.  This is compounded by the fact that the per-well volume of fluid injected into shale gas wells in the region has nearly tripled in that time period. Much of what is injected comes back up to the surface and is added to the liquid waste stream.

Chemically-similar brine from conventional wells has been spread on roadways for dust suppression. This practice was originally considered a “beneficial use” of the waste product, but the Pennsylvania Department of Environmental Protection (DEP) halted that practice in May 2018.

None of these waste management decisions make the geology in Pennsylvania suddenly suitable for underground injection, however, they do increase the pressure on the state to find a disposal solution.

Concerns with SWD wells

There are numerous concerns with salt water disposal wells.  In October 2018, the DEP held a hearing in Plum Borough, on the eastern edge of Allegheny County, where there is a proposal to convert the Sedat 3A conventional well to an injection well. Some of the concerns raised by residents include:

  • Fluid and/or gas migration- There are numerous routes for fluids and gas to migrate from the injection formation to drinking water aquifers or even surface water.  Potential conduits include coal mines, abandoned gas wells, water wells, and naturally occurring fissures in crumbling sedimentary formations.
  • Induced seismicity- SWD wells have been linked to increased earthquake activity, either by lubricating or putting pressure on old faults that had been dormant. Earthquakes can occur miles away from the injection location, and in sedimentary formations, not just igneous basement rock.
  • Noise, diesel pollution, loss of privacy, and road degradation caused by a constant stream of industrial waste haulers to the well location.
  • Complicating existing issues-  Plum Borough and surrounding communities are heavily undermined, and in fact the well bore goes right through the Renton Coal Mine (another part of which has been on fire for decades).  Mine subsidence is already a widespread issue in the region, and many fear that even small seismic events could exacerbate this.
  • Possibility of surface spill-  Oil and gas is, sadly, a sloppy industry, with unconventional operations having accumulated more than 13,000 violations in Pennsylvania since 2008.  If a major spill were to happen at this location, there is the possibility of release into Pucketa Creek, which drains into the Allegheny River, the source of drinking water for multiple communities.
  • Radioactivity and other contaminants- Flowback fluids are often highly radioactive, contain heavy metals, and other contaminants that are challenging to effectively clean.  The migration of radon gas into homes above the injection formation is also a possibility.

The current state of SWDs in Pennsylvania

Pennsylvania has numerous data sources for oil and gas, but they are not always in agreement. To account for this, we have mapped SWDs (and a five mile buffer around them) from two different data sources in the map below. The first source is a subset of SWD wells from a larger dataset of oil and gas locations from the DEP’s mapping website. The second source is from a Waste Facility Report, represented in pink triangles that are offset at an angle to allow users to see both datasets simultaneously in instances where they overlap.

Map of existing, proposed, and plugged salt water disposal (SWD) injection wells in Pennsylvania.

 View map fullscreen How FracTracker maps work

According to the first data set of DEP’s oil and gas locations, Pennsylvania contains 13 SWDs with an active status, one SWD with a regulatory inactive status, and eight that are plugged. The Waste Facility Report shows 10 SWD wells total, including one well that was left out of the other data set in Annin Township, McKean County.

It is worth noting that Pennsylvania’s definition for an “active” well status is confusing, to put it charitably. It does not mean that a well is currently in operation, nor does it even mean that it is currently permitted for the activity, whether that is waste disposal or gas production, or some other function. An active status means that the well has been proposed for a given use, and the well hasn’t been plugged, or assigned some other status.

The Sedat 3A well in Plum, for example, has an active status, although the DEP has not yet granted it a permit to operate as a SWD well. Another  status type is “regulatory inactive,” which is given to a well that hasn’t been used for its stated purpose in 12 months, but may potentially have some future utility.

Karst, coal mines, and streams

While there are numerous factors worthy of consideration when siting SWD wells, this map focuses on three: the proximity of karst formations, coal mines and nearby streams that the state designates as either high quality or exceptional value.

Karst formations are unstable soluble rock formations like limestone deposits which are likely to contain numerous subsurface voids. These voids are concerning in this context. For one reason, there’s the possibility of contaminated fluids and gasses migrating into underground freshwater aquifers. Also, the voids are inherently structurally unstable, which could compound the impacts of artificially-induced seismic activity caused by fluid injections in the well.

Our analysis found over 78,000 acres (123 square miles) of karst geology within five miles of current, proposed, or plugged SWD wells in Pennsylvania.

Coal mines, while a very different sedimentary formation, have similar concerns because of subsurface voids. Mine subsidence is already a widespread problem in many of the communities surrounding SWD well sites.  Pennsylvania has several available data sets, including active underground mine permits and digitized mined areas, which are used in this map.  Active mine permits show current permitted operations, while digitized mine areas offer a highly detailed look at existing mines, including abandoned mines, although the layer is not complete for all regions of the state.

In Pennsylvania, there are 56,542 acres (88 square miles) of active mines within five miles of SWD wells. Our analysis found 97,902 acres (153 square miles) of digitized mined areas within five miles of SWD wells.  Combined, there are 139,840 acres (219 square miles) of existing and permitted mines within the 5 mile buffer zone around SWDs in Pennsylvania.

Streams with the designation “high quality” and “exceptional value” are the best streams Pennsylvania has to offer, in terms of recreation, fishing, and biological diversity. In this analysis, we have identified such streams within a five mile radius of SWD wells, irrespective of the given watershed of the well location.

While the rolling topography of Western Pennsylvania sheds rainwater in a complicated network of drainages, groundwater is not subject to that particular geography. Furthermore, groundwater regularly interacts with surface water through water wells, abandoned O&G wells, and natural seeps and springs. Therefore, it is possible for SWDs to contaminate these treasured streams, even if they are not located within the same watershed.

Altogether, there are 716 miles of high quality streams and 110 miles of exceptional value streams within 5 miles of the SWDs in this analysis.

Conclusion

For decades, geologists have concluded that the subsurface strata in Pennsylvania were not suitable for oil and gas liquid waste disposal in underground injection wells.  The fact that vast quantities of this waste are now being produced in Pennsylvania has not suddenly made it a suitable location for the practice.  If anything, additional shallow and deep wells have further fractured the sedimentary strata, thereby increasing the risk of contamination.

The only factor that has changed is the volume of waste being produced in the region. SWD wells in nearby Ohio and West Virginia have capacity issues from their own production wells, and it is not clear that the geologic formations across the border are that much better than in Pennsylvania. But as new wells are drilled and volumes of hydraulic fracturing fluid continue to spiral into the tens of millions of gallons per well, the pressure to open new SWD wells in the state will only increase.

Perhaps because of these pressures, DEP has become quite bullish on the technology:

Several successful disposal wells are operating in Pennsylvania and options for more sites are always being considered. The history of underground disposal shows that it is a practical, safe and effective method for disposing of fluids from oil and gas production.
Up against this attitude, residents are facing an uphill battle trying to prevent harm to their health and property from these industrial facilities in their communities.  Municipalities that have attempted to stand up for their residents have been sued by DEP to allow for these injection wells.  The Department’s actions, which put the interests of industry above the health of residents and the environment, is directly at odds with the agency’s mission statement:
The Department of Environmental Protection’s mission is to protect Pennsylvania’s air, land and water from pollution and to provide for the health and safety of its citizens through a cleaner environment. We will work as partners with individuals, organizations, governments and businesses to prevent pollution and restore our natural resources.
It’s time for DEP to live up to its promises.

By Matt Kelso, Manager of Data and Technology, FracTracker Alliance

Bird's eye view of an injection well (oil and gas waste disposal)

A Disturbing Tale of Diminishing Returns in Ohio

Utica oil and gas production, Class II injection well volumes, and lateral length trends from 2010-2018

The US Energy Information Administration (EIA) recently announced that Ohio’s recoverable shale gas reserves have magically increased by 11,076 billion cubic feet (BCF). This increase ranks the Buckeye State in the top 5 for changes in recoverable shale natural gas reserves between 2016 and 2017 (pages 31- 32 here). After reading the predictable and superficial media coverage, we thought it was time to revisit the data to ask a pertinent question: What is the fracking industry costing Ohio?

Recent Shale Gas Trends in Ohio

According to the EIA’s report, Ohio currently sits at #7 on their list of proven reserves. It is estimated there are 27,021 BCF of shale gas beneath the state (Figure 1).

Graph of natural gas reserves in different states 2016-2017

Figure 1. Proven and change in proven natural gas reserves from 2016 to 2017 for the top 11 states and the Gulf of Mexico (calculated from EIA’s “U.S. Crude Oil and Natural Gas Proved Reserves, Year-End 2017”).

There are a few variations in the way the oil and gas industry defines proven reserves:

…an estimated quantity of all hydrocarbons statistically defined as crude oil or natural gas, which geological and engineering data demonstrate with reasonable certainty to be recoverable in future years from known reservoirs under existing economic and operating conditions. Reservoirs are considered proven if economic producibility is supported by either actual production or conclusive formation testing. – The Organization of Petroleum Exporting Countries

… the quantity of natural resources that a company reasonably expects to extract from a given formation… Proven reserves are classified as having a 90% or greater likelihood of being present and economically viable for extraction in current conditions… Proven reserves also take into account the current technology being used for extraction, regional regulations and market conditions as part of the estimation process. For this reason, proven reserves can seemingly take unexpected leaps and drops. Depending on the regional disclosure regulations, extraction companies might only disclose proven reserves even though they will have estimates for probable and possible reserves. – Investopedia

What’s missing from this picture?

Neither of the definitions above address the large volume of water or wastewater infrastructure required to tap into “proven reserves.” While compiling data for unconventional wells and injection wells, we noticed that the high-volume hydraulic fracturing (HVHF) industry is at a concerning crossroads. In terms of “energy return on energy invested,” HVHF is requiring more and more resources to stay afloat.

OH quarterly Utica oil & gas production along with quarterly Class II injection well volumes:

The map below shows oil and gas production from Utica wells (the primary form of shale gas drilling in Ohio). It also shows the volume of wastewater disposed in Class II salt water disposal injection wells.


 View map fullscreen | How FracTracker maps work

Publications like the aforementioned EIA article and language out of Columbus highlight the nominal increases in fracking productivity. They greatly diminish, or more often than not ignore, how resource demand and waste production are also increasing. The data speak to a story of diminishing returns – an industry requiring more resources to keep up gross production while simultaneously driving net production off a cliff (Figure 2).

Graph of Utica permits in Ohio on a cumulative and monthly basis along with the average price of West Texas Intermediate (WTI) and Brent Crude oil per barrel from September, 2010 to December, 2018

Figure 2. Number of Utica permits in Ohio on a cumulative and monthly basis along with the average price of West Texas Intermediate (WTI) and Brent Crude oil per barrel from September 2010 to December 2018

The Great Decoupling of New Year’s 2013

In the following analysis, we look at the declining efficiency of the HVHF industry throughout Ohio. The data spans the end of 2010 to middle of 2018. We worked with Columbus-area volunteer Gary Allison to conduct this analysis; without Gary’s help this work and resulting map, would not have been possible.

A little more than five years ago today, a significant shift took place in Ohio, as the number of producing gas wells increased while oil well numbers leveled off. The industry’s permitting high-water mark came in June of 2014 with 101 Utica permits that month (a level the industry hasn’t come close to since). The current six-month permitting average is 25 per month.

As the ball dropped in Times Square ringing in 2014, in Ohio, a decoupling between oil and gas wells was underway and continues to this day. The number of wells coming online annually increased by 229 oil wells and 414 gas wells.

Graph showing Number of producing oil and gas wells in Ohio’s Utica Shale Basin from 2011 to Q2-2018

Figure 3. Number of producing oil and gas wells in Ohio’s Utica Shale Basin from 2011 to Q2-2018

Graph of Producing oil and gas wells as a percentage of permitted wells in Ohio’s Utica Shale Basin from 2011 to Q2-2018

Figure 4. Producing oil and gas wells as a percentage of permitted wells in Ohio’s Utica Shale Basin from 2011 to Q2-2018

Permits

The ringing in of 2014 also saw an increase in the number of producing wells as a percentage of those permitted. In 2014, the general philosophy was that the HVHF industry needed to permit roughly 5.5 oil wells or 7 gas wells to generate one producing well. Since 2014, however, this ratio has dropped to 2.2 for oil and 1.4 for gas well permits.

Put another way, the industry’s ability to avoid dry wells has increased by 13% for oil and 18% for gas per year. As of Q2-2018, viable oil wells stood at 44% of permitted wells while viable gas wells amounted to 71% of the permitted inventory (Figure 4).

Production declines

from the top-left to the bottom-right

To understand how quickly production is declining in Ohio, we compiled annual (2011-2012) and quarterly (Q1-2013 to Q2-2018) production data from 2,064 unconventional laterals.

First, we present average data for the nine oldest wells with respect to oil and gas production on a per day basis (Note: Two of the nine wells we examined, the Geatches MAH 3H and Hosey POR 6H-X laterals, only produced in 2011-2012 when data was collected on an annual basis preventing their incorporation into Figures 6 and 7 belwo). From an oil perspective, these nine wells exhibited 44% declines from year 1 to years 2-3 and 91% declines by 2018 (Figure 5). With respect to natural gas, these nine wells exhibited 34% declines from year 1 to years 2-3 and 79% declines by 2018 (Figure 5).

Figure 5. Average daily oil and gas production decline curves for the above seven hydraulically fractured laterals in Ohio’s Utica Shale Basin, 2011 to Q2-2018

Four of the nine wells demonstrated 71% declines by the second and third years and nearly 98% declines by by Q2-2018 (Figure 6). These declines lend credence to recent headlines like Fracking’s Secret Problem—Oil Wells Aren’t Producing as Much as Forecast in the January 2nd issue of The Wall Street Journal. Four of the nine wells demonstrated 49% declines by the second and third years and nearly 81% declines by Q2-2018 (Figure 7).

Figure 6. Oil production decline curves for seven hydraulically fractured laterals in Ohio’s Utica Shale Basin from 2011 to Q2-2018

Figure 7. Natural gas production decline curves for seven hydraulically fractured laterals in Ohio’s Utica Shale Basin from 2011 to Q2-2018

Fracking waste, lateral length, and water demand

from bottom-left to the top-right

An analysis of fracking’s environmental and economic impact is incomplete if it ignores waste production and disposal. In Ohio, there are 226 active Class II Salt Water Disposal (SWD) wells. Why so many?

  1. Ohio’s Class II well inventory serves as the primary receptacle for HVHF liquid waste for Pennsylvania, West Virginia, and Ohio.
  2. The Class II network is situated in a crescent shape around the state’s unconventional wells. This expands the geographic impact of HVHF to counties like Ashtabula, Trumbull, and Portage to the northeast and Washington, Athens, and Muskingum to the south (Figure 8).

Map of Ohio showing cumulative production of unconventional wells and waste disposal volume of injection wells

Figure 8. Ohio’s unconventional gas laterals and Class II salt water disposal injection wells. Weighted by cumulative production and waste disposal volumes to Q3-2018.

Disposal Rates

We graphed average per well (barrels) and cumulative (million barrels) disposal rates from Q3-2010 to Q3-2018 for these wells. The data shows an average increase of 24,822 barrels (+1.05 million gallons) per well, each year.

That’s a 51% per year increase (Figure 9).

A deeper dive into the data reveals that the top 20 most active Class II wells are accepting more waste than ever before: an astounding annual per well increase of 728,811 barrels (+30.61 million gallons) or a 230% per year increase (Figure 10). This divergence resulted in the top 20 wells disposing of 4.95 times the statewide average between Q3-2010 and Q2-2013. They disposed 13.82 times the statewide average as recently as Q3-2018 (Figure 11).

All of this means that we are putting an increasing amount of pressure on fewer and fewer wells. The trickle out, down, and up of this dynamic will foist a myriad of environmental and economic costs to areas surrounding wells. As an example, the images below are injection wells currently under construction in Brookfield, Ohio, outside Warren and minutes from the Pennsylvania border.

More concerning is the fact that areas of Ohio that are injection well hotspots, like Warren, are proposing new fracking-friendly legislation. These disturbing bills would lubricate the wheels for continued expansion of fracking waste disposal and permitting. House bills 578 and 393 and Senate Bill 165 monetize and/or commodify fracking waste by giving townships a share of the revenue. Such bills “…would only incentivize communities to encourage more waste to come into their existing inventory of Class II… wells, creating yet another race to the bottom.” Co-sponsors of the bills include Democratic Reps. Michael O’Brien, Glenn Holms, John Patterson, and Craig Riefel.

Lateral Lengths

The above trends reflect an equally disturbing trend in lateral length. Ohio’s unconventional laterals are growing at a rate of 9.1 to 15.6%, depending on whether you buy that this trend is linear or exponential (Figure 12). This author believes the trend is exponential for the foreseeable future. Furthermore, it’s likely that “super laterals” in excess of 3-3.5 miles will have a profound impact on the trend. (See The Freshwater and Liquid Waste Impact of Unconventional Oil and Gas in Ohio and West Virginia.)

This lateral length increase substantially increases water demand per lateral. It also impacts Class II well disposal rates. The increase accounts for 76% of the former and 88% of the latter when graphed against each other (Figure 13).

Figure 12. Ohio Utica unconventional lateral length from Q3-2010 to Q4-2018

Figure 13. Ohio Utica unconventional water demand and Class II SWD injection well disposal volumes vs lateral length from Q3-2010 to Q4-2018.

Conclusion

This relationship between production, resource demand, and waste disposal rates should disturb policymakers, citizens, and the industry. One way to this problem is to more holistically price resource utilization (or stop oil and gas development entirely).

Unfortunately, states like Ohio are practically giving water away to the industry.

Politicians are constructing legislation that would unleash injection well expansion. This would allow disposal to proceed at rates that don’t address supply-side concerns. It’s startling that an industry and political landscape that puts such a premium on “market forces” is unwilling to address these trends with market mechanisms.

We will continue to monitor these trends and hope to spread these insights to states like Oklahoma and Texas in the future.

By Ted Auch, Great Lakes Program Coordinator, FracTracker Alliance – with invaluable data compilation assistance from Gary Allison


Data Downloads

FracTracker is a proponent of data transparency, and so we often share the data we use to construct our maps analyses. Click on the links below to download the data associated with the present analysis:

  • OH Utica laterals

    Ohio’s Utica HVHF laterals as of December 2018 in length (feet) (zip file)
  • Wastewater disposal volumes

    Inventory of volumes disposed on a quarterly basis from 2010 to Q3-2018 for all 223 active Class II Salt Water Disposal (SWD) Injection wells in Ohio (zip file)

Pennsylvania Drilling Trends in 2018

With the new year underway, it’s an opportune moment to reflect on the state of unconventional oil and gas extraction in Pennsylvania and examine a few of the drilling trends. A logical place to start is looking at the new wells drilled in 2018.

As always, but perhaps even more so than in previous years, unconventional drilling in Pennsylvania is a tale of two shale plays, with hotspots in the southwestern and northeastern corners of the state. The northeastern hotspot seems to be extending westward, including 25 new wells in Jones Township in Elk County (an area shown in dark red near the “St Marys” label on the map). In the southwestern hotspot, the industry continues to encircle Allegheny County, closing in on the City of Pittsburgh like a constrictor.

Screen shot showing spud report for Indiana Township, Allegheny County from 1/1/2017 through 1/4/2019. We suspect these spud dates of 11/29/17 and 11/30/17 are incorrect.

Screen shot showing spud report for Indiana Township, Allegheny County from 1/1/2017 through 1/4/2019. We suspect these spud dates of 11/29/17 and 11/30/17 are incorrect.

Data error? As Pittsburgh-area residents reflect on the past year, some of them must be wondering why a new well pad in Indiana Township, just northeast of the city isn’t shown on the map above. The answer is that the data the Department of Environmental Protection (DEP) has for these wells indicate they were drilled November 29-3o, 2017, although we believe this to be incorrect. FracTracker obtained the data from the Spud Report on January 2, 2019, which indicates seven wells spudded in that two day span on the “Miller Jr. 10602” well pad. This activity drew considerable opposition from families in the Fox Chapel School district in May of 2018, and was therefore widely reported on by the media. An article published on WESA indicates an expected drill date of July 2018, for example.

It turns out the new year is also a good time to remember that our understanding of the oil and gas industry around us is shaped, molded, and limited by the availability and quality of the data. We brought the Indiana Township data error to the attention of DEP, which only confirmed that the operator (Range Resources) entered the spud dates into the DEP’s online system. Perhaps these well were drilled in November of 2018 not 2017? There is even a possibility these wells have yet to be drilled.

Here are a few more dissections of the data, such as it is:

Graph of unconventional (fracking) wells drilled in PA, YTD - Drilling trends

Figure 1: Unconventional wells drilled in PA by year: 2005 to 2018

Wells Drilled Over Time

Barring more widespread data issues, the status of a handful of wells in Indiana Township does not have much of an impact on the overall trend of drilling in the state. There were 779 wells on the report, representing just under 40% of the total from the peak year of 2011, when industry drilled 1,958 wells. The year 2019 was the fourth year in a row where the industry failed to drill 1,000 wells, averaging 719 per year over that span. In contrast, the five years between 2010 and 2014 saw an average of 1,497 wells per year, more than twice the more recent average. As mentioned in our Hazy Future report, projections based on very aggressive drilling patterns are already proving to be out of phase with reality, although petrochemical commodity markets might change drastically in the coming decades.

How long before wells are plugged?

We also like to periodically check to see how long these wells stay in service. In Pennsylvania, there are two relevant well statuses worth following: plugged and regulatory inactive. While there are a number of conditions that characterize regulatory inactive wells, they are essentially drilled wells that are not currently in production, but may have “future utility.” Therefore, the wells are not required to be permanently plugged at this time.

Unconventional wells drilled since 2005 in PA - Drilling trends

Figure 2: This chart shows the percentage of unconventional wells drilled since 2005 with a plugged or regulatory inactive status as of December 31, 2018.

In order to understand some of the finer points, it’s best to use Figure 1 (above) in conjunction with Figure 2. We can see that most of the wells drilled in the initial years of the Marcellus boom have already been plugged, although Figure 1 shows us that the sample size is fairly low for these years. In 2005, for example, 7 of the 9 (78%) unconventional wells drilled in the state that year are already plugged. The following year, 24 of the 37 (65%) wells drilled are now plugged, and an additional 4 (11%) wells have a regulatory inactive status as of the end of 2018. The following year, the combined plugged and inactive wells account for just over 50% of the 113 wells drilled that year, and this trend continues along a fairly predictable curve. An exception is the noticeable bump around the most active drilling years of 2010 and 2011, where there are slightly more wells with a plugged or inactive status than might be expected. It is interesting to note that even the most recent wells are not immune to being plugged, including 8 plugged wells and 4 inactive wells drilled in 2018 that were not able to get past their very first year in production.

Overall, of the 11,675 drilled wells accounted for on this graphic, 851 (7%) are plugged already, with an additional 572 (5%) of wells with an inactive status.  Unconventional wells that are 11 years old have a roughly 50% chance of being plugged or inactive, and we would therefore expect to see the number of these wells skyrocket in the coming years before leveling off, roughly mirroring the drilling boom and subsequent slowdown of Marcellus Shale extraction in Pennsylvania.

Conclusions

Many factors contribute to fluctuations in drilling trends for the Marcellus Shale and other unconventional wells in Pennsylvania. Very cold winters result in high consumption by residential and commercial users. New gas-fired power plants can increase the demand for additional drilling. Recessions and economic conditions are known to reduce the demand for energy as well, and drillers’ heavy debt burdens can slow down operations appreciably. Additionally, other fossil fuel and renewable energy sources compete with one another, altering the market conditions even further. And finally, every oil and gas play eventually reaches a point where the expected results from new wells are not worth the money required to get the hydrocarbons to the surface, and unconventional wells are much more expensive to develop than more traditional operations.

Because of all of these variables, month to month or even year to year fluctuations are not necessarily that telling.  On the other hand, a four-year period where drilling is roughly half of previous extraction is significant, and can’t be easily dismissed as a blip in the data.


By Matt Kelso, Manager of Data and Technology, FracTracker Alliance