 https://www.fractracker.org/a5ej20sjfwe/wp-content/uploads/2024/09/Satellite-emissions-feature.jpeg
443
1500
FracTracker Alliance
https://www.fractracker.org/a5ej20sjfwe/wp-content/uploads/2025/09/2025-Wordmark-Logo.png
FracTracker Alliance2024-09-03 14:23:262025-05-02 14:52:33Mapping the Invisible Threat: Emissions from Oil and Gas
https://www.fractracker.org/a5ej20sjfwe/wp-content/uploads/2024/09/Satellite-emissions-feature.jpeg
443
1500
FracTracker Alliance
https://www.fractracker.org/a5ej20sjfwe/wp-content/uploads/2025/09/2025-Wordmark-Logo.png
FracTracker Alliance2024-09-03 14:23:262025-05-02 14:52:33Mapping the Invisible Threat: Emissions from Oil and Gas2021 Pipeline Incidents Update: Safety Record Not Improving
Overview
FracTracker periodically takes a deep dive into pipeline incidents that are reported to the Pipeline and Hazardous Materials Safety Administration (PHMSA), to examine the impacts of these events, understand the cause for the failures and to look for trends in the accident data.
The map below shows 6,950 total incidents since 2010, translating to 1.7 incidents per day. Pipelines are dangerous, in part because regulation around them is ineffective. The public needs better access to data regarding pipeline location in order to assess existing and incoming projects that threaten health and safety.
US Pipeline Incidents
This interactive map looks at pipeline incidents from three types of pipelines, as well as associated injuries and fatalities from 1/1/2010 through 3/4/2021. In order to turn layers on and off in the map, use the Layers dropdown menu at the top of the window. This tool is only available in Full Screen view. Items will activate in this map dependent on the level of zoom in or out. See more information and data sources listed in the “Details” section of the map, as well as at the end of this article.
View Full Size Map | Updated 3/4/21 | Data Tutorial
Limitations of the Data
It is important to keep in mind that these incidents are self-reported from industry to PHMSA. These datasets are extremely nuanced when it comes to describing what happened; the Hazardous Liquids report has 588 columns of data for each incident, for instance. That amount of data is certainly unwieldy, and there are differences between the Gas Distribution, Gas Transmission & Gathering, and Hazardous Liquids reports as well, making an easy comparison all the more challenging. For this reason, we focus on some of the basic reported impacts, including the number of incidents reported, fatalities and injuries caused, number of people evacuated, total property damage (including the value of the lost commodity), and the number of fires and explosions that were recorded.
Focusing on these impacts, we can see that the data are not necessarily reliable or up to date. When we last analyzed the incident data in February 2020, it looked as if the previous year was a down year for those impacts. However, when we look at the same 2019 range from data downloaded in March 2021, the numbers are quite different, as seen in Table 1.
PHMSA Incident Totals for 2019
Download Date |
Incidents | Fatalities | Injuries | Evacuees | Damages | Fires | Explosions |
| February 2020 | 614 | 10 | 35 | 2113 | $258,457,997 | 86 | 28 |
| March 2021 | 652 | 11 | 36 | 2214 | $333,933,207 | 88 | 28 |
Table 1 – PHMSA incident totals for 2019 by data download date. Note that this total is the aggregate total of the hazardous liquids, gas transmission & gathering, and gas distribution reports.
Pipeline operators are required to submit incident reports within 30 days of the accident. However, the lesson here is to take 2020 totals in the current analysis with a grain of salt, as the totals of total impacts will likely be revised upward for some incidents. In theory, all incidents for 2019 should have been reported by the February 4, 2020 download, however we now have 38 additional reports for that period. Totals also include one additional fatality, one injury, 101 evacuees, $75,475,210 of property damages, and two fires above previous totals.
Additionally, there are issues with the wells’ locations. Although the dataset includes latitude and longitude values, twelve incidents appeared outside of the United States, including off the coast of Mexico, Kyrgyzstan, Canada, and Mongolia. Although it is usually a fool’s errand to try to fix errors in someone else’s dataset, I did correct these twelve locations in a way that placed them in the described city and state, or else matched with the narrative description. However, it is equally as likely that there are additional location errors that were not as noticeable.
Incident Summary
With the fine print out of the way, now we can take a closer look at the incidents in each of the three reports (Tables 2 – 4). For the sake of brevity, we’ll include data for 2019 to 2021 year to date through March 4th. Additional historical data summaries can be found in our analysis from 2020.
Gas Distribution
| Year | Incidents | Fatalities | Injuries | Evacuees | Damages | Fires | Explosions |
| 2019 | 139 | 10 | 27 | 1,761 | $68,069,598 | 65 | 23 |
| 2020 | 111 | 10 | 29 | 7,180 | $30,069,741 | 53 | 16 |
| 2021* | 9 | 0 | 0 | 26 | $1,078,727 | 4 | 2 |
| 2010 – 2021* | 1,222 | 115 | 539 | 27,870 | $2,408,976,046 | 714 | 273 |
| * – 2021 data includes reports received by 3/4/2021 only | |||||||
Table 2. Recent PHMSA Gas Distribution pipeline incidents.
Gas Transmission and Gathering
| Year | Incidents | Fatalities | Injuries | Evacuees | Damages | Fires | Explosions |
| 2019 | 130 | 1 | 9 | 450 | $106,924,305 | 8 | 5 |
| 2020 | 131 | 2 | 2 | 174 | $156,342,100 | 13 | 6 |
| 2021* | 6 | 0 | 0 | 0 | $736,552 | 0 | 0 |
| 2010 – 2021* | 1,369 | 27 | 110 | 13,153 | $1,492,746,535 | 146 | 63 |
| * – 2021 data includes reports received by ¾/2021 only | |||||||
Table 3. Recent PHMSA Gas Transmission & Gathering pipeline incidents.
Hazardous Liquids
| Year | Incidents | Fatalities | Injuries | Evacuees | Damages | Fires | Explosions |
| 2019 | 383 | 0 | 0 | 3 | $158,939,304 | 15 | 0 |
| 2020 | 332 | 4 | 13 | 298 | $97,543,630 | 10 | 4 |
| 2021* | 29 | 0 | 0 | 0 | $1,445,659 | 3 | 0 |
| 2010 – 2021* | 4,359 | 14 | 39 | 2,780 | $2,962,900,530 | 145 | 19 |
| * – 2021 data includes reports received by 3/4/2021 only | |||||||
Table 4. Recent PHMSA Hazardous Liquids pipeline incidents.
Of the three categories of pipelines, hazardous liquid routes have the largest number of reported incidents and cause the greatest amount of property damage, whereas gas distribution lines have the largest number of fatalities, injuries, evacuees, fires, and explosions. The gas transmission and gathering network did not top any of the examined categories, although the impacts created by incidents on these lines is still extremely significant.
Millions of Miles of Pipes
As of March 19, 2021, PHMSA has records for 224,906 miles of hazardous liquids pipelines, of which 219,739 miles (98%) are crude oil, refined petroleum products like gasoline or diesel, or highly volatile liquids (HVL). This last category includes substances that are gaseous at ambient temperatures but handled as a liquid, predominantly natural gas liquids (NGL).
There are also 1,325,089 miles of gas distribution mains, and 954,579 additional miles of distribution service lines that feed residential, commercial, and industrial customers. On top of that, there are 300,781 miles of gas transmission lines moving methane long distances from one market to another.
PHMSA has records of 16,830 miles of gas gathering lines, which take methane and gaseous hydrocarbon mixtures from wells to processing plants. This last category is a vast undercount of the total mileage of gathering lines, as PHMSA estimates that only about 5% of gathering lines are required to submit records to the agency. Indeed, based on a digitization of Bradford County’s gathering line map in 2018, FracTracker calculated that the average length of gathering lines was 3.5 miles per well pad, which would work out to 13,234 miles in Pennsylvania alone.
Sticking to the routes that PHMSA has data for, we have records of 2,822,182 miles of gas and hazardous liquids pipelines in the United States, a distance almost 12 times of that from the Earth to the moon. They are all over the place.
Accurate Pipeline Data Could Save Lives
With all of these pipelines buried across the landscape, it becomes extremely dangerous to conduct any earth disturbing activities without first calling 811 to find out if excavation efforts are likely to go awry. However, the process is a bit like putting the cart before the horse – excavators have to develop plans on where to work and then have energy companies come to the site to determine whether or not there are allowed to do so at that location or not. A far simpler workflow would be to be able to conduct research on whether or not pipeline obstacles existed to the work plan at the beginning stages of the project before calling the various crews to the site to verify the pipeline locations.
PHMSA goes out of its way to not let this happen. On their National Pipeline Mapping System Public Viewer, users are met with the following red-colored warning:
Please note that the Public Viewer limits the scale of pipeline maps, in accordance with PHMSA’s security policy. When you are zoomed in closer than a 1:24,000 scale (above zoom level 14), you will notice that the pipelines have disappeared from the map. In order to see the pipelines, you must either zoom out to zoom level 14 or lower. Data cannot be downloaded from the Public Viewer.
PHMSA’s security policy does not allow the public to have accurate, detailed pipeline location data. While we are obviously concerned with pipeline safety, the data show that this policy is completely counterproductive.
Figure 1. Causes of Pipeline Incidents in 2020. Source: PHMSA, analyzed by FracTracker Alliance. Data downloaded 3/4/2021.
Despite the free nationwide Call 811 program, 69 (12%) of the 574 total pipeline incidents in 2020 were from excavation damage. Intentional damage is a subcategory of the “Other Outside Force” category, and there were two such incidents, or 0.3% of the total incidents.
Of course, even one intentional incident is outrageous, but a closer look at the narrative descriptions from these incidents questions whether they really belong in that category at all. The first of the two occurred on January 4, 2020 in Detroit, Michigan.
On January 4, 2020, DTE Gas dispatch received a call from 911 at 19:33 of an explosion at 14404 & 14406 Evergreen Street in Detroit, Michigan. This is a residence that is considered a 2-family flat (one structure with two residences). DTE gas first responders arrived on-site at 19:55 to investigate and terminate gas service. There were 6 individuals taking to the hospital, one with burns and 5 with smoke inhalation. Working with Detroit fire & arson, DTE Gas’s internal investigation team and the Michigan Public Service Commission, it was determined that the cause of this incident was due to an AK 47 gun that was shot in the house which penetrated the service line just below the meter & regulator assembly. The case has been turned over to Detroit police for further investigation.
Obviously, there is nothing to condone here, but it is extremely unlikely that the intended purpose of discharging a firearm inside a home was to damage the gas service line.
The second incident occurred on December 22, 2020 in Hempstead, Texas.
On December 22, 2020 we received a leak call by a customer. We found a customer had started inclosing his front porch. We detected gas we pulled the electric meter and told the customer he could stay there and must leave the door open to vent any gas. We called the 811 number to get a locate for 1337 5th. We had a crew there waiting on the locate from the telephone company. We could not get to the locate wire because of concrete being poured around the riser. We tried to dig outside the concrete put could not because of the excessive tree roots. We went out to the road and dug behind the curb, inline with the meter could not find the pipe to squeeze off. Went south a few feet found the 1″ plastic pipe we squeezed it off and caped and check for leaks. We went to go on the porch but the customer had left and locked the door so we were not able to retrieve the meter or verify the gas was off. We were called on December 24, 2020 stating the house blew up. because the explosion blew away the concrete fence down so we were able to dig next to the concrete and squeeze off the service line. It stopped the gas flow. I went to call the RRC to inform them of the accident.
This situation does not seem intentional, either, leaving zero intentional incidents for the year compared with 69 from excavation. Given the inherent danger of pipelines, it might be ambitious to get the excavation accidents down to zero, but many of them could be avoided by providing comprehensive and detailed pipeline location data to the public. The argument that this information should be withheld from the public under the auspices of national security hold no water, especially when power plants, refineries, compressor stations, processing plants, and well pads are impossible to hide.
In fact, pipelines are required to be marked with surface signs at road and railroad crossings, plus additional locations along the route to “reduce the possibility of damage or interference.” Of course, not all of the pipelines in service are marked with the placards, or excavation-caused incidents wouldn’t be a problem.
Additionally, printed maps of these pipelines become publicly available through a variety of required documents, such as this map that Energy Transfer submitted to the Federal Energy Regulatory Commission for the Rover Pipeline, for example. FracTracker has digitized printed maps in public documents such as these, but due to issues of scale, they are inherently less accurate than the original documents. As a result, when we talk about potential impacts to people and natural areas along the way, this process introduces unnecessary uncertainty into the discussion, and could keep stakeholders from being aware of the impact that such project may have on them moving forward.
As we’ve seen, the only thing accomplished by PHMSA’s “security policy” of obfuscating public pipeline data is keeping the public in the dark. A cynical person might argue that this process is intentional, allowing the route to pass through the public comment period without community members being able to raise informed objections to the project. It’s time to join the digital age and provide the public with accurate geospatial pipeline data.
Lingering Uncertainty
With millions of miles of pipelines in the United States, nobody knows where the next major incident will occur. The only thing that we can tell for sure is that there will indeed be more serious incidents, some of which will happen in locations that can lead to significant losses of life and property.
Some of these, like the recent Southwest Gas explosion in Arizona, will happen in pipelines that have been in operation for decades. Others, like the 2018 Revolution Pipeline explosion in Pennsylvania will occur on brand new pipes. Many will release methane into the atmosphere, such as the 2012 Mojave Pipeline incident, which the data blame on more than 585 million cubic feet of planet-warming gas to into the atmosphere. Others, like the Colonial Pipeline in North Carolina, will soak the earth with more than 1.2 million gallons of gasoline, causing untold ecological damage.
Recently, FracTracker released a report revealing that the Falcon Ethane Pipeline System, a significant piece of infrastructure in the petrochemical industry’s planned expansion into the Ohio River Valley, is at the center of major investigations into possible noncompliance with construction and public safety requirements. As we can see from the data above, it’s not a question of if pipeline incidents will occur, but when. Dozens of advocacy groups have urged regional agencies to take these matters extremely seriously and halt operations until resolved and explained.
Meanwhile, it is past time for federal agencies such as PHMSA to provide Americans with accurate and easy to access pipeline data. Since the regulatory agencies have proven themselves unwilling or incapable of keeping us safe from this nearly omnipresent infrastructure, the very least that they can do is demand that accurate geospatial files are publicly available, so that the rest of us have at least a fighting chance to fill that gap. Operators from Texas and regulators from Washington might not be aware of a bald eagle’s nest in Ohio or a local propensity for rock slides in Colorado. Local residents would, however, and regulatory agencies are not doing the affected communities any favors by effectively helping the industry keep secrets from them.
The Take Away
The map above shows 6,950 total incidents since 2010. This means that the incident rate has been holding steady at 1.7 incidents per day as it has for many years, although it is has actually increased slightly since our first analysis of PHMSA incident data back in 2013. Clearly, any assertion that pipelines are either safe or getting safer is not supported by data. And because of that, any suggestion that pipelines are effectively regulated is clearly wrong as well.
References & Where to Learn More
- FracTracker’s February 2020 Pipeline Incidents report: https://www.fractracker.org/2020/02/pipelines-continue-to-catch-fire-and-explode/
- FracTracker National Energy & Petrochemical Map: https://www.fractracker.org/2020/02/national-energy-petrochemical-map/
- Jinsoo Kim, Donghoon Ryu, Benjamin K. Sovacool. Critically assessing and projecting the frequency, severity, and cost of major energy accidents. The Extractive Industries and Society, Volume 8, Issue 2, 2021. https://doi.org/10.1016/j.exis.2021.02.005.
Topics in This Article:
Join the Conversation
Stay Informed
FracTracker Newsletter
Support Our Work
FracTracker Alliance helps communicate the risks of oil and gas and petrochemical development to advance just energy alternatives that protect public health, natural resources, and the climate.
By contributing to FracTracker, you are helping to make tangible changes, such as decreasing the number of oil and gas wells in the US, protecting the public from toxic and radioactive chemicals, and stopping petrochemical expansion into vulnerable communities.
Your donations help fund the sourcing and analysis of new data so that we can keep you informed and continually update our resources.
Please donate to FracTracker today as a way to advocate for clean water, clean air, and healthy communities.
Shortcut: left arrow key
What You Should Read Next
https://www.fractracker.org/a5ej20sjfwe/wp-content/uploads/2024/09/Satellite-emissions-feature.jpeg
443
1500
FracTracker Alliance
https://www.fractracker.org/a5ej20sjfwe/wp-content/uploads/2025/09/2025-Wordmark-Logo.png
FracTracker Alliance2024-09-03 14:23:262025-05-02 14:52:33Mapping the Invisible Threat: Emissions from Oil and Gas https://www.fractracker.org/a5ej20sjfwe/wp-content/uploads/2023/05/Corpus-Christi-Data-Dashboard.jpg
798
1500
FracTracker Alliance
https://www.fractracker.org/a5ej20sjfwe/wp-content/uploads/2025/09/2025-Wordmark-Logo.png
FracTracker Alliance2023-06-01 13:14:222023-11-27 17:00:10Visualizing Pollution: Corpus Christi Data Dashboard
https://www.fractracker.org/a5ej20sjfwe/wp-content/uploads/2023/05/Corpus-Christi-Data-Dashboard.jpg
798
1500
FracTracker Alliance
https://www.fractracker.org/a5ej20sjfwe/wp-content/uploads/2025/09/2025-Wordmark-Logo.png
FracTracker Alliance2023-06-01 13:14:222023-11-27 17:00:10Visualizing Pollution: Corpus Christi Data Dashboard https://www.fractracker.org/a5ej20sjfwe/wp-content/uploads/2020/09/Methane_Air_WaterQualityConcerns-1.jpg
534
800
FracTracker Alliance
https://www.fractracker.org/a5ej20sjfwe/wp-content/uploads/2025/09/2025-Wordmark-Logo.png
FracTracker Alliance2023-01-31 15:01:342023-02-27 16:43:15Testimony On EPA’s Proposed Methane Pollution Standards for the Oil and Gas Industry
https://www.fractracker.org/a5ej20sjfwe/wp-content/uploads/2020/09/Methane_Air_WaterQualityConcerns-1.jpg
534
800
FracTracker Alliance
https://www.fractracker.org/a5ej20sjfwe/wp-content/uploads/2025/09/2025-Wordmark-Logo.png
FracTracker Alliance2023-01-31 15:01:342023-02-27 16:43:15Testimony On EPA’s Proposed Methane Pollution Standards for the Oil and Gas Industry https://www.fractracker.org/a5ej20sjfwe/wp-content/uploads/2022/11/Rager-Mountain-Feature.jpg
636
1500
Erica Jackson
https://www.fractracker.org/a5ej20sjfwe/wp-content/uploads/2025/09/2025-Wordmark-Logo.png
Erica Jackson2022-11-30 14:12:222023-02-03 13:50:48Major Gas Leak Reveals Risks of Aging Gas Storage Wells in Pennsylvania
https://www.fractracker.org/a5ej20sjfwe/wp-content/uploads/2022/11/Rager-Mountain-Feature.jpg
636
1500
Erica Jackson
https://www.fractracker.org/a5ej20sjfwe/wp-content/uploads/2025/09/2025-Wordmark-Logo.png
Erica Jackson2022-11-30 14:12:222023-02-03 13:50:48Major Gas Leak Reveals Risks of Aging Gas Storage Wells in Pennsylvania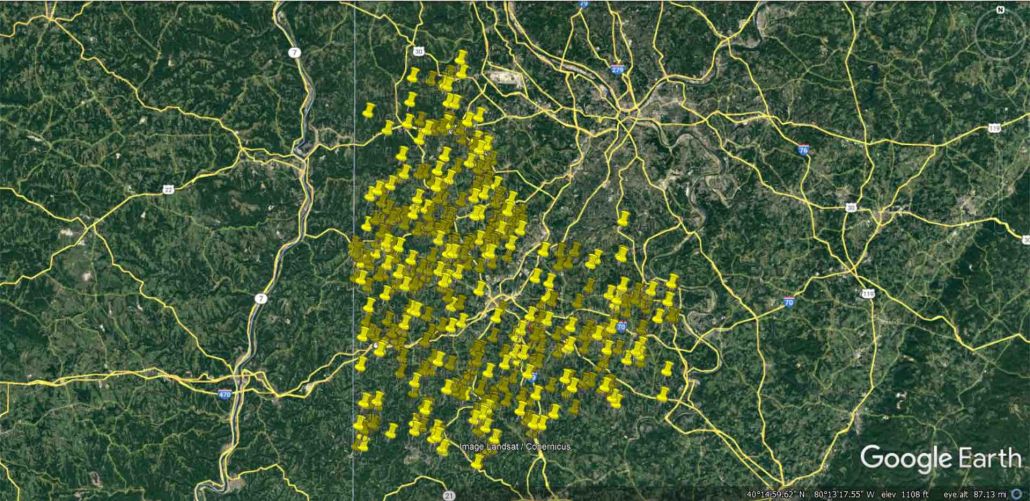 https://www.fractracker.org/a5ej20sjfwe/wp-content/uploads/2022/11/Washington-County-PA-2022-Google-Earth.jpg
933
1920
FracTracker Alliance
https://www.fractracker.org/a5ej20sjfwe/wp-content/uploads/2025/09/2025-Wordmark-Logo.png
FracTracker Alliance2022-11-04 12:55:532022-11-04 13:04:53FracTracker Receives Two Federal Grants to Support Community Air Monitoring Initiatives in the Ohio River Valley
https://www.fractracker.org/a5ej20sjfwe/wp-content/uploads/2022/11/Washington-County-PA-2022-Google-Earth.jpg
933
1920
FracTracker Alliance
https://www.fractracker.org/a5ej20sjfwe/wp-content/uploads/2025/09/2025-Wordmark-Logo.png
FracTracker Alliance2022-11-04 12:55:532022-11-04 13:04:53FracTracker Receives Two Federal Grants to Support Community Air Monitoring Initiatives in the Ohio River Valley https://www.fractracker.org/a5ej20sjfwe/wp-content/uploads/2022/07/kyle-ferrar-e1663254307641.jpg
636
1430
Kyle Ferrar, MPH
https://www.fractracker.org/a5ej20sjfwe/wp-content/uploads/2025/09/2025-Wordmark-Logo.png
Kyle Ferrar, MPH2022-07-29 19:04:322022-09-15 11:05:17California Regulators Approve More Oil Well Permits Amid a Crisis of Leaking Oil Wells that Should be Plugged
https://www.fractracker.org/a5ej20sjfwe/wp-content/uploads/2022/07/kyle-ferrar-e1663254307641.jpg
636
1430
Kyle Ferrar, MPH
https://www.fractracker.org/a5ej20sjfwe/wp-content/uploads/2025/09/2025-Wordmark-Logo.png
Kyle Ferrar, MPH2022-07-29 19:04:322022-09-15 11:05:17California Regulators Approve More Oil Well Permits Amid a Crisis of Leaking Oil Wells that Should be Plugged https://www.fractracker.org/a5ej20sjfwe/wp-content/uploads/2022/05/DustingHighVolDirtyFilter-feature.jpg
667
1500
Guest Author
https://www.fractracker.org/a5ej20sjfwe/wp-content/uploads/2025/09/2025-Wordmark-Logo.png
Guest Author2022-05-03 09:37:492022-05-03 09:37:49PA Environment Digest Blog: Conventional Oil & Gas Drillers Dispose Of Drill Cuttings By ‘Dusting’
https://www.fractracker.org/a5ej20sjfwe/wp-content/uploads/2022/05/DustingHighVolDirtyFilter-feature.jpg
667
1500
Guest Author
https://www.fractracker.org/a5ej20sjfwe/wp-content/uploads/2025/09/2025-Wordmark-Logo.png
Guest Author2022-05-03 09:37:492022-05-03 09:37:49PA Environment Digest Blog: Conventional Oil & Gas Drillers Dispose Of Drill Cuttings By ‘Dusting’ https://www.fractracker.org/a5ej20sjfwe/wp-content/uploads/2021/02/Los-Angeles-skyline-feature-scaled.jpg
667
1500
Kyle Ferrar, MPH
https://www.fractracker.org/a5ej20sjfwe/wp-content/uploads/2025/09/2025-Wordmark-Logo.png
Kyle Ferrar, MPH2021-02-23 14:42:162021-04-15 14:08:42California Oil & Gas Setbacks Recommendations Memo
https://www.fractracker.org/a5ej20sjfwe/wp-content/uploads/2021/02/Los-Angeles-skyline-feature-scaled.jpg
667
1500
Kyle Ferrar, MPH
https://www.fractracker.org/a5ej20sjfwe/wp-content/uploads/2025/09/2025-Wordmark-Logo.png
Kyle Ferrar, MPH2021-02-23 14:42:162021-04-15 14:08:42California Oil & Gas Setbacks Recommendations Memo https://www.fractracker.org/a5ej20sjfwe/wp-content/uploads/2020/12/Undermined-feature2-scaled.jpg
667
1500
FracTracker Alliance
https://www.fractracker.org/a5ej20sjfwe/wp-content/uploads/2025/09/2025-Wordmark-Logo.png
FracTracker Alliance2020-11-20 15:52:252021-06-22 11:21:42Undermined: Voices from the Frontlines of Frac Sand Mining
https://www.fractracker.org/a5ej20sjfwe/wp-content/uploads/2020/12/Undermined-feature2-scaled.jpg
667
1500
FracTracker Alliance
https://www.fractracker.org/a5ej20sjfwe/wp-content/uploads/2025/09/2025-Wordmark-Logo.png
FracTracker Alliance2020-11-20 15:52:252021-06-22 11:21:42Undermined: Voices from the Frontlines of Frac Sand Mining https://www.fractracker.org/a5ej20sjfwe/wp-content/uploads/2019/08/EQT-Tioga-Wide-7.gif
300
800
Kyle Ferrar, MPH
https://www.fractracker.org/a5ej20sjfwe/wp-content/uploads/2025/09/2025-Wordmark-Logo.png
Kyle Ferrar, MPH2020-11-18 12:40:132021-04-15 14:16:04Documenting emissions from new oil and gas wells in California
https://www.fractracker.org/a5ej20sjfwe/wp-content/uploads/2019/08/EQT-Tioga-Wide-7.gif
300
800
Kyle Ferrar, MPH
https://www.fractracker.org/a5ej20sjfwe/wp-content/uploads/2025/09/2025-Wordmark-Logo.png
Kyle Ferrar, MPH2020-11-18 12:40:132021-04-15 14:16:04Documenting emissions from new oil and gas wells in California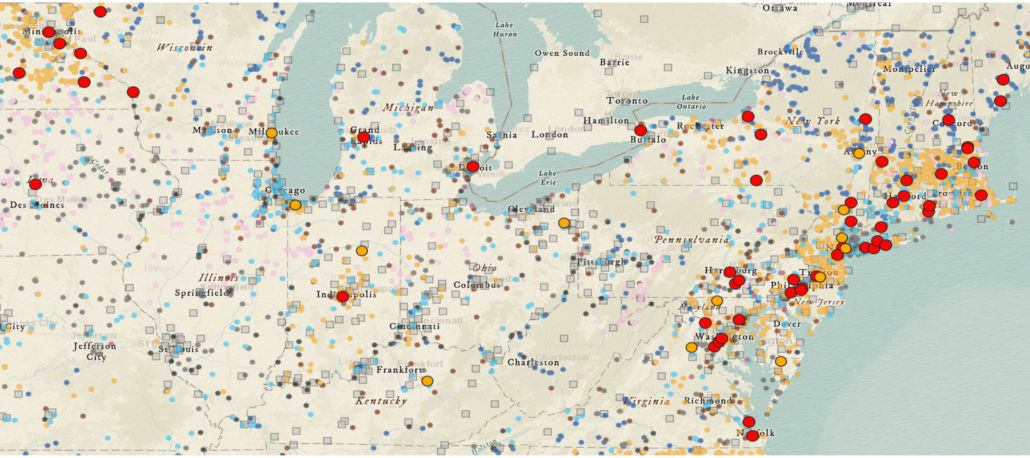 https://www.fractracker.org/a5ej20sjfwe/wp-content/uploads/2020/10/Waste-to-Energy-facilities-in-the-US-feature--scaled.jpg
667
1500
Karen Edelstein
https://www.fractracker.org/a5ej20sjfwe/wp-content/uploads/2025/09/2025-Wordmark-Logo.png
Karen Edelstein2020-10-19 15:11:492021-04-15 14:16:05Incinerators: Dinosaurs in the world of energy generation
https://www.fractracker.org/a5ej20sjfwe/wp-content/uploads/2020/10/Waste-to-Energy-facilities-in-the-US-feature--scaled.jpg
667
1500
Karen Edelstein
https://www.fractracker.org/a5ej20sjfwe/wp-content/uploads/2025/09/2025-Wordmark-Logo.png
Karen Edelstein2020-10-19 15:11:492021-04-15 14:16:05Incinerators: Dinosaurs in the world of energy generation https://www.fractracker.org/a5ej20sjfwe/wp-content/uploads/2020/09/Pump_Jack_at_the_Lost_Hills_Oil_Field_In_Central_California-feature.jpg
833
1875
Kyle Ferrar, MPH
https://www.fractracker.org/a5ej20sjfwe/wp-content/uploads/2025/09/2025-Wordmark-Logo.png
Kyle Ferrar, MPH2020-09-16 19:45:072021-04-15 14:16:08Recommendations for an EIR to prioritize Kern County Frontline Communities
https://www.fractracker.org/a5ej20sjfwe/wp-content/uploads/2020/09/Pump_Jack_at_the_Lost_Hills_Oil_Field_In_Central_California-feature.jpg
833
1875
Kyle Ferrar, MPH
https://www.fractracker.org/a5ej20sjfwe/wp-content/uploads/2025/09/2025-Wordmark-Logo.png
Kyle Ferrar, MPH2020-09-16 19:45:072021-04-15 14:16:08Recommendations for an EIR to prioritize Kern County Frontline Communities Ted Auch, FracTracker Alliance
https://www.fractracker.org/a5ej20sjfwe/wp-content/uploads/2020/09/TAuch_Infrastructure-CompressorStation_Flaring-ButlerCounty_OH_Jan20183.jpg
833
1875
Shannon Smith
https://www.fractracker.org/a5ej20sjfwe/wp-content/uploads/2025/09/2025-Wordmark-Logo.png
Shannon Smith2020-09-04 16:56:012020-11-02 20:08:23Health & Environmental Effects of Fracking
Ted Auch, FracTracker Alliance
https://www.fractracker.org/a5ej20sjfwe/wp-content/uploads/2020/09/TAuch_Infrastructure-CompressorStation_Flaring-ButlerCounty_OH_Jan20183.jpg
833
1875
Shannon Smith
https://www.fractracker.org/a5ej20sjfwe/wp-content/uploads/2025/09/2025-Wordmark-Logo.png
Shannon Smith2020-09-04 16:56:012020-11-02 20:08:23Health & Environmental Effects of Fracking https://www.fractracker.org/a5ej20sjfwe/wp-content/uploads/2020/08/Loyalsock-feature-scaled.jpg
667
1500
Shannon Smith
https://www.fractracker.org/a5ej20sjfwe/wp-content/uploads/2025/09/2025-Wordmark-Logo.png
Shannon Smith2020-08-04 18:44:392023-01-17 10:30:44The Loyalsock Watershed Project
https://www.fractracker.org/a5ej20sjfwe/wp-content/uploads/2019/08/EQT-Tioga-Wide-7.gif
300
800
Shannon Smith
https://www.fractracker.org/a5ej20sjfwe/wp-content/uploads/2025/09/2025-Wordmark-Logo.png
Shannon Smith2020-06-29 11:04:372021-04-15 14:16:43Testimony to PA DEP on Control of Methane & VOC Emissions from Oil and Natural Gas Sources
https://www.fractracker.org/a5ej20sjfwe/wp-content/uploads/2020/08/Loyalsock-feature-scaled.jpg
667
1500
Shannon Smith
https://www.fractracker.org/a5ej20sjfwe/wp-content/uploads/2025/09/2025-Wordmark-Logo.png
Shannon Smith2020-08-04 18:44:392023-01-17 10:30:44The Loyalsock Watershed Project
https://www.fractracker.org/a5ej20sjfwe/wp-content/uploads/2019/08/EQT-Tioga-Wide-7.gif
300
800
Shannon Smith
https://www.fractracker.org/a5ej20sjfwe/wp-content/uploads/2025/09/2025-Wordmark-Logo.png
Shannon Smith2020-06-29 11:04:372021-04-15 14:16:43Testimony to PA DEP on Control of Methane & VOC Emissions from Oil and Natural Gas Sources Photo by Ted Auch, FracTracker Alliance, with aerial support by LightHawk
https://www.fractracker.org/a5ej20sjfwe/wp-content/uploads/2020/04/HoustonArea_feature.jpg
666
1500
Shannon Smith
https://www.fractracker.org/a5ej20sjfwe/wp-content/uploads/2025/09/2025-Wordmark-Logo.png
Shannon Smith2020-03-24 15:48:412021-04-15 14:16:51COVID-19 and the oil & gas industry
Photo by Ted Auch, FracTracker Alliance, with aerial support by LightHawk
https://www.fractracker.org/a5ej20sjfwe/wp-content/uploads/2020/04/HoustonArea_feature.jpg
666
1500
Shannon Smith
https://www.fractracker.org/a5ej20sjfwe/wp-content/uploads/2025/09/2025-Wordmark-Logo.png
Shannon Smith2020-03-24 15:48:412021-04-15 14:16:51COVID-19 and the oil & gas industry https://www.fractracker.org/a5ej20sjfwe/wp-content/uploads/2020/03/Compressor-station-within-Loyalsock-State-Forest-PA-scaled.jpg
667
1500
Guest Author
https://www.fractracker.org/a5ej20sjfwe/wp-content/uploads/2025/09/2025-Wordmark-Logo.png
Guest Author2020-03-19 13:16:212021-04-15 14:16:51Air Pollution from Pennsylvania Shale Gas Compressor Stations – REPORT
https://www.fractracker.org/a5ej20sjfwe/wp-content/uploads/2020/03/Compressor-station-within-Loyalsock-State-Forest-PA-scaled.jpg
667
1500
Guest Author
https://www.fractracker.org/a5ej20sjfwe/wp-content/uploads/2025/09/2025-Wordmark-Logo.png
Guest Author2020-03-19 13:16:212021-04-15 14:16:51Air Pollution from Pennsylvania Shale Gas Compressor Stations – REPORT https://www.fractracker.org/a5ej20sjfwe/wp-content/uploads/2020/03/TruckFeatureImage.jpg
666
1500
Erica Jackson
https://www.fractracker.org/a5ej20sjfwe/wp-content/uploads/2025/09/2025-Wordmark-Logo.png
Erica Jackson2020-02-28 23:18:032020-07-17 10:27:25Front Range Health Tracking Project
https://www.fractracker.org/a5ej20sjfwe/wp-content/uploads/2020/03/TruckFeatureImage.jpg
666
1500
Erica Jackson
https://www.fractracker.org/a5ej20sjfwe/wp-content/uploads/2025/09/2025-Wordmark-Logo.png
Erica Jackson2020-02-28 23:18:032020-07-17 10:27:25Front Range Health Tracking Project https://www.fractracker.org/a5ej20sjfwe/wp-content/uploads/2019/12/drilling-rig-scaled.jpg
667
1500
Erica Jackson
https://www.fractracker.org/a5ej20sjfwe/wp-content/uploads/2025/09/2025-Wordmark-Logo.png
Erica Jackson2019-12-18 10:56:062021-04-15 14:55:33Allegheny County Air Quality Monitoring Project
https://www.fractracker.org/a5ej20sjfwe/wp-content/uploads/2019/12/drilling-rig-scaled.jpg
667
1500
Erica Jackson
https://www.fractracker.org/a5ej20sjfwe/wp-content/uploads/2025/09/2025-Wordmark-Logo.png
Erica Jackson2019-12-18 10:56:062021-04-15 14:55:33Allegheny County Air Quality Monitoring Project https://www.fractracker.org/a5ej20sjfwe/wp-content/uploads/2019/07/DSC_0624_LowRes-scaled.jpg
982
1500
Shannon Smith
https://www.fractracker.org/a5ej20sjfwe/wp-content/uploads/2025/09/2025-Wordmark-Logo.png
Shannon Smith2019-08-07 09:36:032020-03-20 17:32:33Wildness Lost – Pine Creek
https://www.fractracker.org/a5ej20sjfwe/wp-content/uploads/2019/07/DSC_0624_LowRes-scaled.jpg
982
1500
Shannon Smith
https://www.fractracker.org/a5ej20sjfwe/wp-content/uploads/2025/09/2025-Wordmark-Logo.png
Shannon Smith2019-08-07 09:36:032020-03-20 17:32:33Wildness Lost – Pine Creek https://www.fractracker.org/a5ej20sjfwe/wp-content/uploads/2019/03/IdleWellsHathaway_resize.jpg
400
900
Kyle Ferrar, MPH
https://www.fractracker.org/a5ej20sjfwe/wp-content/uploads/2025/09/2025-Wordmark-Logo.png
Kyle Ferrar, MPH2019-04-03 11:30:582021-04-15 14:56:34Idle Wells are a Major Risk
https://www.fractracker.org/a5ej20sjfwe/wp-content/uploads/2019/03/IdleWellsHathaway_resize.jpg
400
900
Kyle Ferrar, MPH
https://www.fractracker.org/a5ej20sjfwe/wp-content/uploads/2025/09/2025-Wordmark-Logo.png
Kyle Ferrar, MPH2019-04-03 11:30:582021-04-15 14:56:34Idle Wells are a Major RiskShortcut: right arrow key
![]()
216 Franklin St, Suite 400, Johnstown, PA 15901
Phone: +1 (717) 303-0403 | info@fractracker.org
FracTracker Alliance is a 501(c)3 non-profit: Tax identification number: 80-0844297