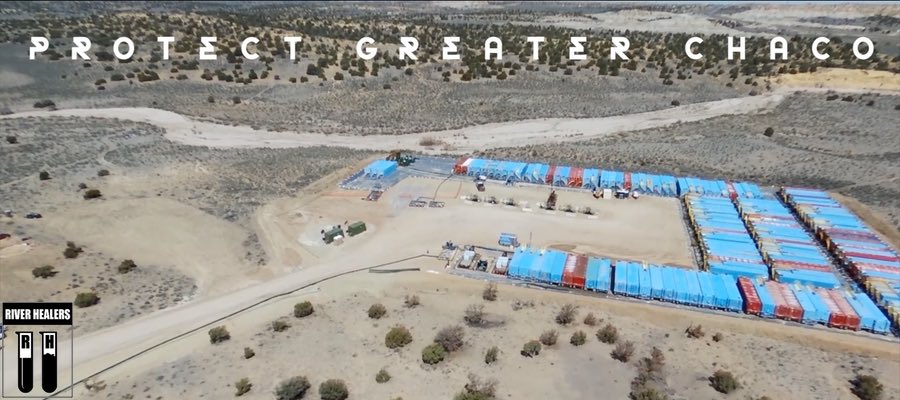
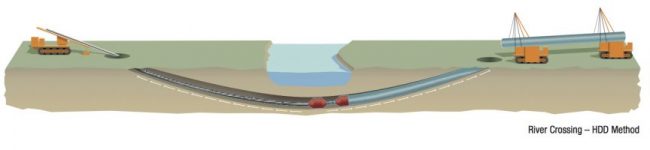
Protect Greater Chaco: Drone surveillance of regional fracking sites in NM
By Tom Burkett – River Healer Spokesperson, New Mexico Watchdog
The Greater Chaco region is known to the Diné (Navajo) as Dinétah, the land of their ancestors. It contains countless sacred sites that date to the Anasazi and is home of the Bisti Badlands and Chaco Culture National Historical Park, a World Heritage Site. Currently WPX Energy has rights to lease about 100,000 acres of federal, state, and Navajo allottee lands in the oil rich San Juan Basin, which includes Greater Chaco.1 WPX Energy along with other fracking companies plan to continue establishing crude oil fracking wells on these sacred lands, although the Greater Chaco community has spoken out against fracking and continue to call for more safety and oversight from New Mexico state regulatory bodies such as the EMNRD Oil Conservation Division.
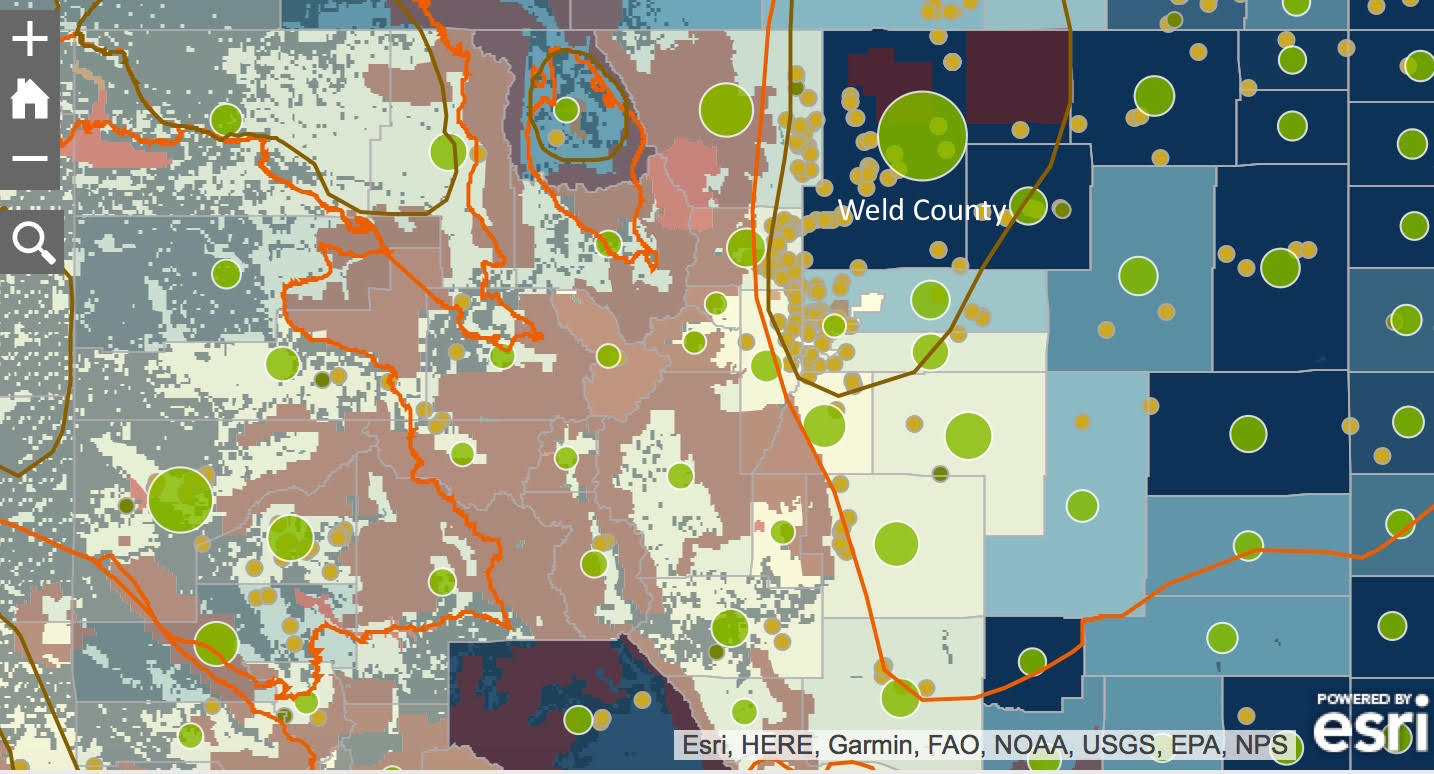
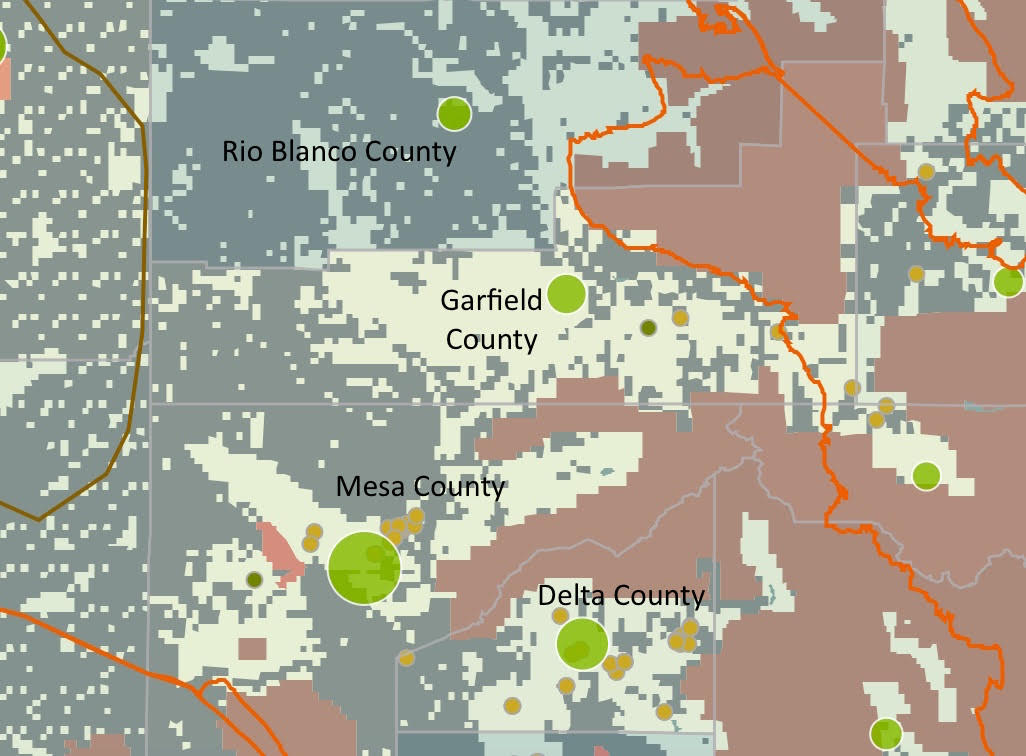
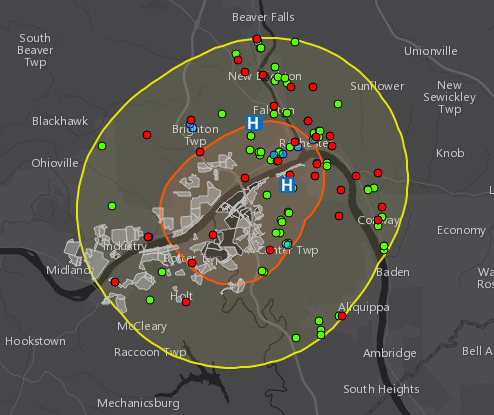
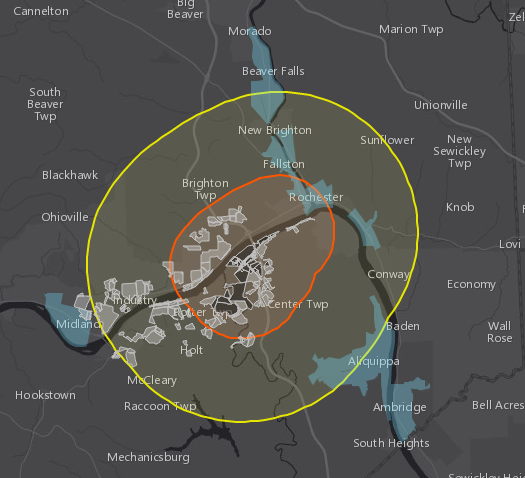
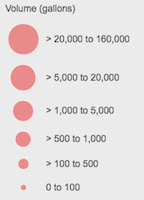
The River Healers pulled EMNRD records that show over 8,300 spills in New Mexico had been reported by the the fracking industry to EMNRD between 2011-2016 (map below). This is thousands more than reported by the Environmental Protection Agency. The records also showed how quickly reports of spills, fires, and explosions were processed by the EMNRD as ‘non-emergency’ and accepted industry reports that no groundwater had been contaminated.
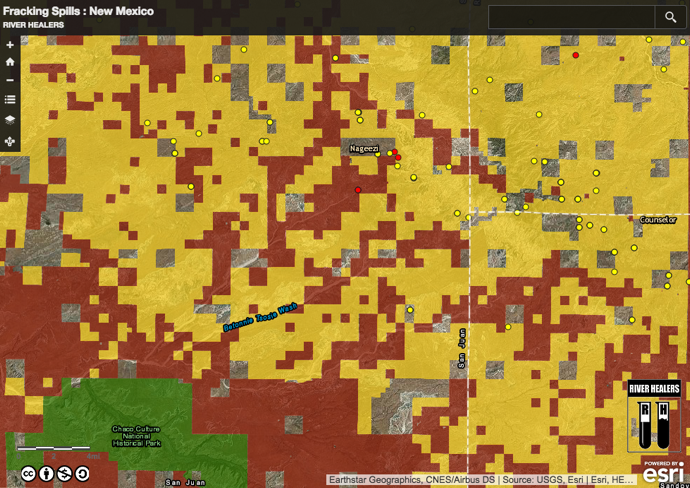
Zoomed in view of the River Healers’ NM fracking spills map. Learn more
Daniel Tso, Member of the Navajo Nation and Elder of the Counselor Chapter, led us to fracking sites in Greater Chaco that had reported spills and fires. Daniel Tso is one of many Navajo Nation members working on the frontlines to protect Greater Chaco, their ancestral land, and their pastoral ways of life from the expanding fracking industry. Traveling in white trucks and cars we blended in with the oil and gas trucks that dot indigenous community roads and group around fracking pads on squares federally owned land. Years of watchdogging the fracking destruction on their sacred land was communicated through Tso’s eyes looking over the landscape for new fracking disruption and a calm voice,
… the hurt on the sacred landscapes; the beauty of the land is destroyed, this affects our people’s mental, spiritual, and emotional health.
At each site our eyes were scanning the fracking sites and terrain for drone flight patterns while the native elders were slowly scanning the ground for pottery shards and signs of their ancestors. Arroyos sweep around the fracking pads and display how quickly the area can flash flood from rain that gathers on the striated volcanic ash hills of the badlands.
Fracking Regulation in NM
The EMNRD Oil Conservation Division has only 12 inspectors that are in charge of overseeing over 50,000 wells scattered throughout New Mexico.2 Skepticism around EMNRD’s ability to regulate not only comes from a short staff being stretched across 121,598 square miles of New Mexico’s terrain, but thousands of active fracking sites continue to report spills, fires, and explosions every year.3 Even more problematic is that Ken McQueen, Cabinet Secretary of EMNRD formerly served as Vice President of WPX Energy.4 Ken McQueen managed WPX Energy’s assets in the Four Corners area of New Mexico, Colorado, and in addition, part of Wyoming. New Mexico Governor, Susana Martinez’s appointment of McQueen severely compromises the state’s ability to impartially oversee WPX Energy and regulate the fracking industry. Governor Martinez has been called to clean up the EMNRD, and rid the regulatory body of cabinet members more interested in protecting the assets of WPX than the health and rights of New Mexicans. Tso remarks,
The sacrifices of indigenous communities continue for a society that thinks gasoline comes from a gas station. That thinks oil is a commodity that is unending resource. This is unfortunate, and ultimately compromises our physical health. Yet this doesn’t matter to the industry. They want every last drop of crude oil even if it is cost prohibitive.
The River Healers maintain that Governor Martinez is complicit in the exploitation of human water rights as long as the EMNRD remains a compromised and unreliable regulatory body.
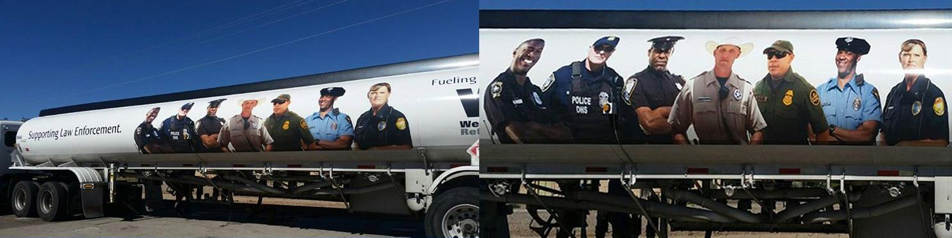
New Mexico governmental assimilation with the oil and gas industry is presented to the Greater Chaco indigenous communities in the form of 90,000-lb gross weight oilfield trucks. Western Refining started rolling out trucks with larger-than-life prints of state and county law enforcements officers and military personnel at the same time water protectors at Standing Rock were being arrested and assaulted by the Morton County Sheriff’s Department in North Dakota.5 The indigenous-led movement to stop the Dakota Access Pipeline from desecrating sacred land and threatening rights to clean water has drawn greater resistance to oil and gas projects around the country.
Indigenous solidarity is felt in Greater Chaco, but Western Refining’s blatant propaganda campaign demonstrates how oil and gas corporations continue to threaten and silence the communities they extract oil from by displaying the paid power of state and federal law enforcement. The River Healers view this as a direct form of intimidation that aims to further a corporate ideology and remind native communities of the violence they experienced at the hand of the United States Federal Government in the past. The Western Refining campaign is a direct form of corporate-sponsored terrorism and should be grounds to ban their ability to use images of law enforcement officers to further their interests. Furthermore, the state should discontinue paying for officers to patrol facking roads and pads and instead use state funds to make state regulatory bodies work for the communities most impacted by the oil and gas industries.
What we are finding
Drone surveillance of fracking sites in Greater Chaco show how quickly the fracking industry has exploited a state government tied to the interests of a booming and unchecked resource extraction industry. In Greater Chaco this element of time is more deeply understood through the lens of the indigenous community.
Ultimately, the health of the fauna and flora are devastated. The adaptation of the delicate ecosystem is forever destroyed. Their recovery and healing will take years and years.
The Anasazi Kivas in Chaco Canyon took over 300 years to construct, while drill rigs such as Cyclone 32 take less than 10 days to drill 6,500 ft wells in the canyon plateau. We hiked 12 miles of the sacred Chaco Wash, pulled water samples, and saw the red palm of the Supernova Petrograph clinging to the understory of the canyon wall, clearly taking notice of what is happening above.
We deeply thank members of the Navajo Nation for inviting us into their lives, and our hearts stand with them in solidarity. Protect Greater Chaco! Dooda Fracking!
River Healers Site Videos
Site 1
Nageezi, NM
County: San Juan
Kimbeto Wash/Chaco River
GPS: 36°14’22.38”, -107°43’51.38”
Protect Greater Chaco : Site 1 from River Healers on Vimeo.
This particular site caught fire on June 11th, 2016 and was allowed to burn until July 14th. The fracking fire and contaminates spread to areas north and south of the fracking pad, burning Juniper trees within 200 feet of residential buildings. This fire is not the only documented case in the Greater Chaco Area where communities were disrupted and evacuated in the middle of the night. While community members remain concerned about their health, WPX reported that the incident was not an emergency and that no damage was caused to groundwater.
Site 2
Nageezi, NM
County: San Juan
Kimbeto Wash/Chaco River
GPS: 36°13’43.23″, -107°44’28.72″
Protect Greater Chaco : Site 2 from River Healers on Vimeo.
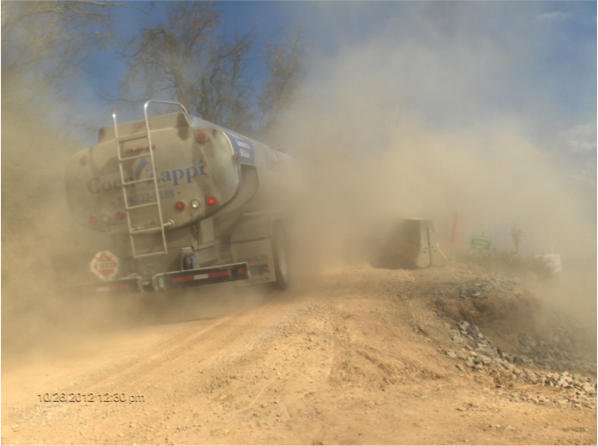
Drone surveys of this particular site show Cyclone 32, a 1500 Horsepower 755 ton drill rig manufactured in Wyoming. The drill rig is transported through Greater Chaco communities on small dusty single lane dirt roads used by the community members and school buses. The drilling is heard and seen moving from pad to pad. The rig is establishing multiple drill heads on pockets of land tucked along the Kimbeto Wash, a tributary to the Chaco River and sacred source of water security for members of the Greater Chaco Area in Nageezi, New Mexico.
Site 3
Nageezi, NM
County: San Juan
Kimbeto Wash/Chaco River
GPS: 36°13’27.51″, -107°45’3.24″
No video available
Site 4
Counselor, NM
County: Rio Arriba
Canada Larga River
GPS: 36°13’18.19″, -107°28’56.24″
Protect Greater Chaco : Site 4 from River Healers on Vimeo.
Drone surveys show Lybrook Elementary School only 1600ft from a WPX Energy fracking site. The crude oil tanks of the site can be seen from the classroom windows of the school. The elementary school was moved to this location in 2006 because it was right across the highway from a large and expanding natural gas plant and had to relocate elementary students to a safe location.
Although the WPX Energy site is established on federal land, this area of Counselor, New Mexico is referred to as ‘The Checkerboard’ because of the quadrants of federal land that break up tribal land. The 5 well heads are highlighted to show that these pockets of federal land are being fracked with a high concentration of fracking wells. By drilling multiple wells in one pad location fracking companies are able to quickly drain the plays of crude oil under the the Greater Chaco Area and avoid signing contracts with the native property owners that live and attend school in the area they are fracking.
Site 5
Counselor, NM
County: Sandoval
Chaco Wash/Chaco River
GPS: 36° 9’45.22″, -107°29’11.47″
Protect Greater Chaco : Site 5 from River Healers on Vimeo.
Drone surveys show crude oil being fracked within 840 ft of an indigenous community in Sandoval County, NM (Greater Chaco). The fracking site is located in the path of the community water supply, which had to be routed around the wellhead and crude tanks. The underground water line remains only 110 ft from active fracking activity.
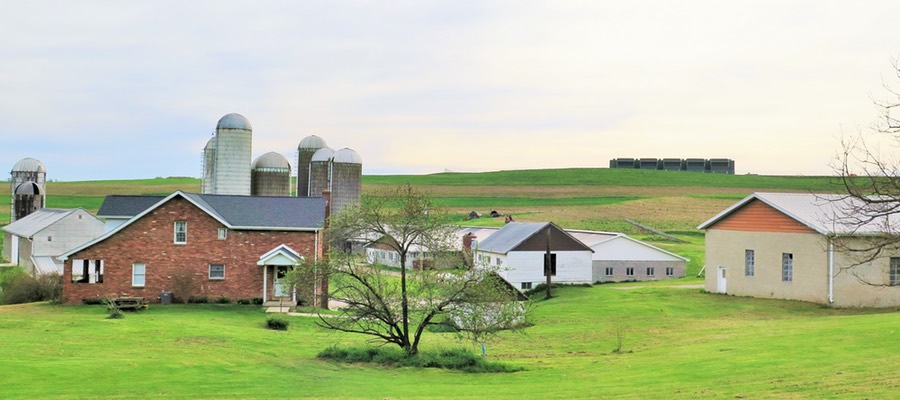
Particular communities in Greater Chaco are dependent upon pastoral industry and the health of their livestock. Horses owned by the indigenous community are seen grazing on open and unprotected fracking pads. Many of these fracking pads have recorded spills of either fracking fluid, wastewater, or crude oil and pose health risks to the livestock grazing on potentially contaminated grasses and wastewater.
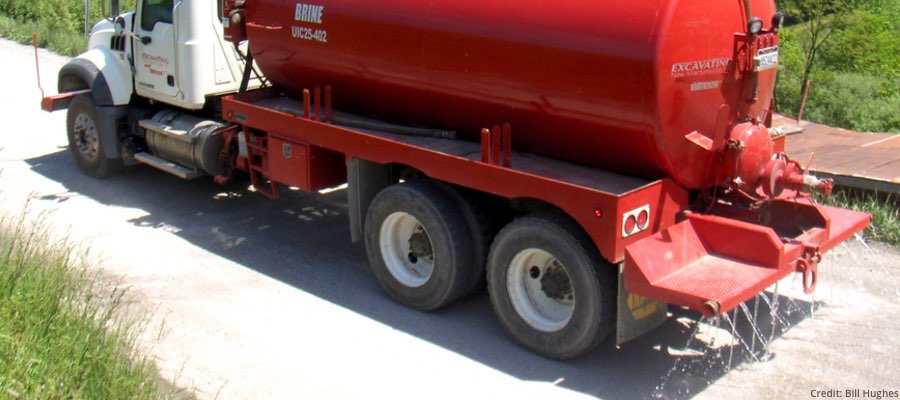
A Western Refining (WPX) crude truck can be seen driving down the community road. These dirt roads were designed to support local community traffic and school buses but are now heavily used by the fracking industry. 90,000-lb gross weight oilfield trucks haul the volatile crude oil through pastoral lands, endangering livestock and community members. Fracking companies continue to level dirt roads to accommodate the weight of their crude trucks. The practice cuts roads deep into the landscape. Roads in Greater Chaco now resemble trenches and make travel dangerous, block scenic views of ancestral land, and hinder the ability to monitor livestock and fracking development.
Site 6
Nageezi, NM
County: San Juan
Kimbeto Wash/Chaco River
GPS: 36°15’20.46”, -107°41’43.14”
Protect Greater Chaco : Site 6 from River Healers on Vimeo.
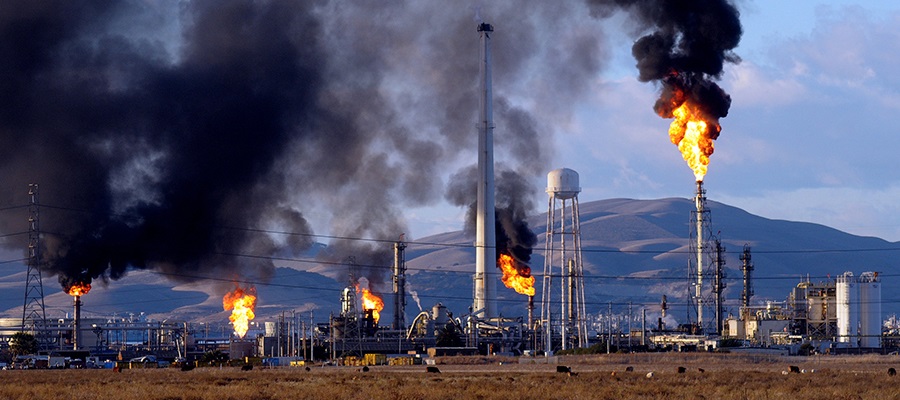
Drone surveys show 3 well heads, crude tanks, and compressors north of Hwy 550 in Nageezi, NM. The location is of importance because it shows how flaring is used to burn off methane caused by fracking and the transportation processes of crude oil. The River Healers droned this site when workers were not present and the flare tower was turned off for safety concerns, but the flame can usually be seen all the way from Hwy 550 tucked into the distinct hills of the Bisti Badlands. Such methane hotspots are of concern because methane causes severe health risks for individuals living near crude oil facilities. NASA has identified two large methane gas clouds in new Mexico. The methane gas is concentrated above fracking occurring in the San Juan Basin and Permian Basin and disproportionately affects the air quality of Greater Chaco, Four Corners Region, Farmington, and South East region of New Mexico.
Two unlined wastewater pits can be seen on the edge of the fracking pad near the well heads and compressors. Erosion caused by water drainage can be seen leading from the well heads and compressor areas directly to the wastewater pits. Drainages can also be seen coming directly out of the waste water pits and going into the Upper Kimbeto Wash, a tributary of the Chaco River. It is illegal for fracking companies to keep fracking wastewater in unlined pits in the state of New Mexico. The River Healers reported this possible water violation to the EMNRD Oil Conservation Division (a state regulatory body for the fracking industry). EMNRD replied that WPX Energy maintains that the wastewater is caused by stormwater runoff and contains no fracking contaminates. This is the first time we have heard of the fracking industry creating stormwater runoff pits and find the practice to be unusual. Further skepticism that these runoff pits are not contaminated comes from research about the site. In June of 2016, WPX Energy reported a spill of 600 gallons of crude oil at this site because of a fire. WPX maintains that no groundwater was impacted and marked the incident as not an emergency.
References
- WPX Adds Accreage in Gallup Oil Play, press release
- NM Oil and Gas Enforcement Inspections, Earthworks
- New Mexico Geologic Mapping Program, NM Bureau of Geology and Mineral resources
- New Mexico Energy, Minerals, and Natural Resources Department – Cabinet Secretary Ken McQueen
- Western Refining, Community Supporting Law Enforcement


 The Pennsylvania Department of Environmental Protection (DEP) posted information on potential regulatory violations associated with these IRs on the