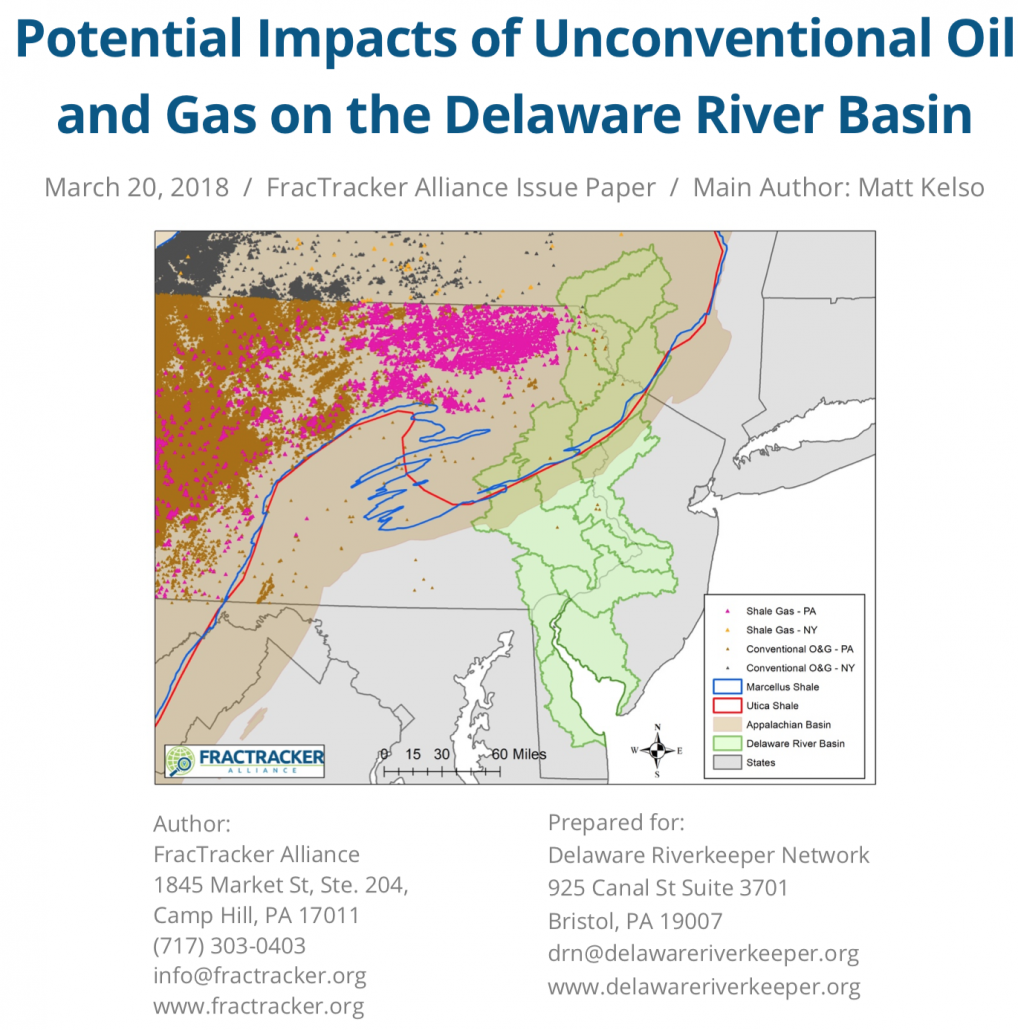
Shell Pipeline: Not Quite the “Good Neighbor”
In August 2016, Shell Pipeline announced plans to develop the Falcon Ethane Pipeline System, a 97-mile pipeline network that will carry more than 107,000 barrels of ethane per day through Pennsylvania, West Virginia, and Ohio, to feed Shell Appalachia’s petrochemical facility currently under construction in Beaver County, PA.
FracTracker has covered the proposed Falcon pipeline extensively in recent months. Our Falcon Public EIA Project explored the project in great detail, revealing the many steps involved in risk assessments and a range of potential impacts to public and environmental health.
This work has helped communities better understand the implications of the Falcon, such as in highlighting how the pipeline threatens drinking water supplies and encroaches on densely populated neighborhoods. Growing public concern has since convinced the DEP to extend public comments on the Falcon until April 15th, as well as to host three public meetings scheduled for early April.
Shell’s response to these events has invariably focused on their intent to build and operate a pipeline that exceeds safety standards, as well as their commitments to being a good neighbor. In this article, we investigate these claims by looking at federal data on safety incidents related to Shell Pipeline.
Contrary to claims, records show that Shell’s safety record is one of the worst in the nation.
The “Good Neighbor” Narrative
Maintaining a reputation as a “good neighbor” is paramount to pipeline companies. Negotiating with landowners, working with regulators, and getting support from implicated communities can hinge on the perception that the pipeline will be built and operated in a responsible manner. This is evident in cases where Shell Pipeline has sold the Falcon in press releases as an example of the company’s commitment to safety in public comments.

Figure 1. Shell flyer
A recent flyer distributed to communities in the path of the Falcon, seen in Figure 1, also emphasizes safety, such as in claims that “Shell Pipeline has a proven track record of operating safely and responsibility and remains committed to engaging with local communities regarding impacts that may arise from its operations.”
Shell reinforced their “good neighbor” policy on several occasions at a recent Shell-sponsored information meeting held in Beaver County, stating that, everywhere they do business, Shell was committed to the reliable delivery of their product. According to project managers speaking at the event, this is achieved through “planning and training with first responders, preventative maintenance for the right-of-way and valves, and through inspections—all in the name of maintaining pipeline integrity.”
Shell Pipeline also recently created an informational website dedicated to the Falcon pipeline to provide details on the project and emphasize its minimal impact. Although, curiously, Shell’s answer to the question “Is the pipeline safe?” is blank.
U.S. Pipeline Incident Data
Every few years FracTracker revisits data on pipeline safety incidents that is maintained by the Pipeline and Hazardous Materials Safety Administration (PHMSA). In our last national analysis we found that there have been 4,215 pipeline incidents resulting in 100 reported fatalities, 470 injuries, and property damage exceeding $3.4 billion.
These numbers were based on U.S. data from 2010-2016 for natural gas transmission and gathering pipelines, natural gas distribution pipelines, and hazardous liquids pipelines. It is also worth noting that incident data are heavily dependent on voluntary reporting. They also do not account for incidents that were only investigated at the state level.
Shell Pipeline has only a few assets related to transmission, gathering, and distribution lines. Almost all of their pipeline miles transport highly-volatile liquids such as crude oil, refined petroleum products, and hazardous liquids such as ethane. Therefore, to get a more accurate picture of how Shell Pipeline’s safety record stacks up to comparable operators, our analysis focuses exclusively on PHMSA’s hazardous liquids pipeline data. We also expanded our analysis to look at incidents dating back to 2002.
Shell’s Incident Record
In total, PHMSA data show that Shell was responsible for 194 pipeline incidents since 2002. These incidents spilled 59,290 barrels of petrochemical products totaling some $183-million in damages. The below map locates where most of these incidents occurred. Unfortunately, 34 incidents have no location data and so are not visible on the map. The map also shows the location of Shell’s many refineries, transport terminals, and off-shore drilling platforms.
Open the map fullscreen to see more details and tools for exploring the data.
View Map Fullscreen | How FracTracker Maps Work
Incidents Relative to Other Operators
PHMSA’s hazardous liquid pipeline data account for more than 350 known pipeline operators. Some operators are fairly small, only maintaining a few miles of pipeline. Others are hard to track subsidiaries of larger companies. However, the big players stand out from the pack — some 20 operators account for more than 60% of all pipeline miles in the U.S., and Shell Pipeline is one of these 20.
Comparing Shell Pipeline to other major operators carrying HVLs, we found that Shell ranks 2nd in the nation in the most incidents-per-mile of maintained pipeline, seen in table 1 below. These numbers are based on the total incidents since 2002 divided by the number of miles maintained by each operator as of 2016 miles. Table 2 breaks Shell’s incidents down by year and number of miles maintained for each of those years.
Table 1: U.S. Pipeline operators ranked by incidents-per-mile
| Operator | HVL Incidents | HVL Pipeline Miles | Incidents Per Mile (2016) |
| Kinder Morgan | 387 | 3,370 | 0.115 |
| Shell Pipeline | 194 | 3,490 | 0.056 |
| Chevron | 124 | 2,380 | 0.051 |
| Sunoco Pipeline | 352 | 6,459 | 0.049 |
| ExxonMobile | 240 | 5,090 | 0.048 |
| Colonial Pipeline | 244 | 5,600 | 0.044 |
| Enbride | 258 | 6,490 | 0.04 |
| Buckeye Pipeline | 231 | 7,542 | 0.031 |
| Magellan Pipeline | 376 | 12,928 | 0.03 |
| Marathan Pipeline | 162 | 5,755 | 0.029 |
Table 2: Shell incidents and maintained pipeline miles by year
| Year | Incidents | Pipeline Miles | Total Damage | Notes |
| 2002 | 15 | no PHMSA data | $2,173,704 | |
| 2003 | 20 | no PHMSA data | $3,233,530 | |
| 2004 | 25 | 5,189 | $40,344,002 | Hurricane Ivan |
| 2005 | 22 | 4,830 | $62,528,595 | Hurricane Katrina & Rita |
| 2006 | 10 | 4,967 | $11,561,936 | |
| 2007 | 5 | 4,889 | $2,217,354 | |
| 2008 | 12 | 5,076 | $1,543,288 | |
| 2009 | 15 | 5,063 | $11,349,052 | |
| 2010 | 9 | 4,888 | $3,401,975 | |
| 2011 | 6 | 4,904 | $2,754,750 | |
| 2012 | 12 | 4,503 | $17,268,235 | |
| 2013 | 4 | 3,838 | $10,058,625 | |
| 2014 | 11 | 3,774 | $3,852,006 | |
| 2015 | 12 | 3,630 | $4,061,340 | |
| 2016 | 6 | 3,490 | $6,875,000 | |
| 2017 | 9 | no PHMSA data | $242,800 | |
| 2018 | 1 | no PHMSA data | $47,000 | As of 3/1/18 |
Cause & Location of Failure
What were the causes of Shell’s pipeline incidents? At Shell’s public informational session, it was said that “in the industry, we know that the biggest issue with pipeline accidents is third party problems – when someone, not us, hits the pipeline.” However, PHMSA data reveal that most of Shell’s incidents issues should have been under the company’s control. For instance, 66% (128) of incidents were due to equipment failure, corrosion, welding failure, structural issues, or incorrect operations (Table 3).
Table 3. Shell Pipeline incidents by cause of failure
| Cause | Incidents |
| Equipment Failure | 51 |
| Corrosion | 37 |
| Natural Forces | 35 |
| Incorrect Operation | 25 |
| Other | 20 |
| Material and/or Weld Failure | 15 |
| Excavation Damage | 11 |
| Total | 194 |
However, not all of these incidents occurred at one of Shell’s petrochemical facilities. As Table 4 below illustrates, at least 57 incidents occurred somewhere along the pipeline’s right-of-way through public areas or migrated off Shell’s property to impact public spaces. These numbers may be higher as 47 incidents have no mention of the property where incidents occurred.
Table 4. Shell Pipeline incidents by location of failure
| Location | Incidents |
| Contained on Operator Property | 88 |
| Pipeline Right-of-Way | 54 |
| Unknwon | 47 |
| Originated on Operator Property, Migrated off Property | 3 |
| Contained on Operator-Controlled Right-of-Way | 2 |
| Total | 194 |
On several occasions, Shell has claimed that the Falcon will be safely “unseen and out of mind” beneath at least 4ft of ground cover. However, even when this standard is exceeded, PHMSA data revealed that at least a third of Shell’s incidents occurred beneath 4ft or more of soil.
Many of the aboveground incidents occurred at sites like pumping stations and shut-off valves. For instance, a 2016 ethylene spill in Louisiana was caused by lightning striking a pumping station, leading to pump failure and an eventual fire. In numerous incidents, valves failed due to water seeping into systems from frozen pipes, or large rain events overflowing facility sump pumps. Table 5 below breaks these incidents down by the kind of commodity involved in each case.
Table 5. Shell Pipeline incidents by commodity spill volumes
| Commodity | Barrels |
| Crude Oil | 51,743 |
| Highly Volatile Liquids | 6,066 |
| Gas/Diesel/Fuel | 1,156 |
| Petroleum Products | 325 |
| Total | 59,290 |
Impacts & Costs
None of Shell’s incidents resulted in fatalities, injuries, or major explosions. However, there is evidence of significant environmental and community impacts. Of 150 incidents that included such data, 76 resulted in soil contamination and 38 resulted in water contamination issues. Furthermore, 78 incidents occurred in high consequence areas (HCAs)—locations along the pipeline that were identified during construction as having sensitive environmental habitats, drinking water resources, or densely populated areas.
Table 6 below shows the costs of the 194 incidents. These numbers are somewhat deceiving as the “Public (other)” category includes such things as inspections, environmental cleanup, and disposal of contaminated soil. Thus, the costs incurred by private citizens and public services totaled more than $80-million.
Table 6. Costs of damage from Shell Pipeline incidents
| Private Property | Emergency Response | Environmental Cleanup | Public (other) | Damage to Operator | Total Cost |
| $266,575 | $62,134,861 | $11,024,900 | $7,308,000 | $102,778,856 | $183,513,192 |
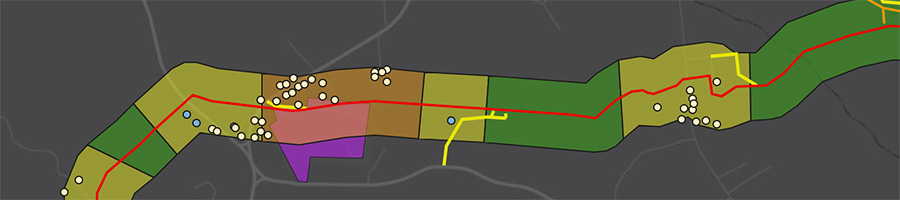
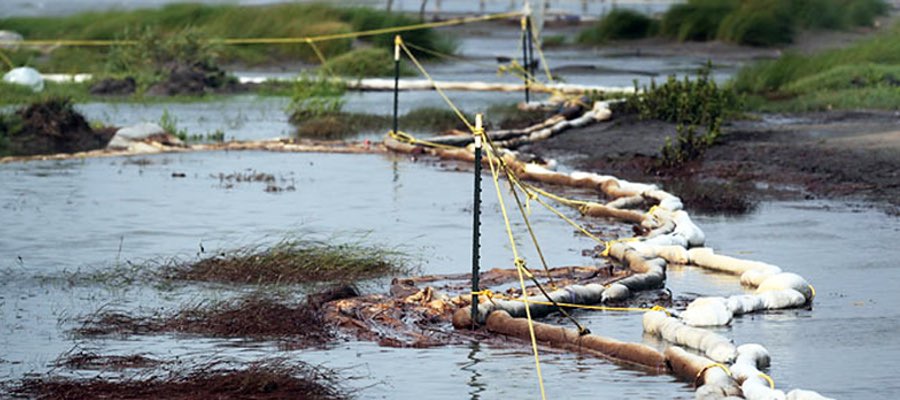
A number of significant incidents are worth mention. For instance, in 2013, a Shell pipeline rupture led to as much as 30,000 gallons of crude oil spilling into a waterway near Houston, Texas, that connects to the Gulf of Mexico. Shell’s initial position was that no rupture or spill had occurred, but this was later found not to be the case after investigations by the U.S. Coast Guard. The image at the top of this page depicts Shell’s cleanup efforts in the waterway.

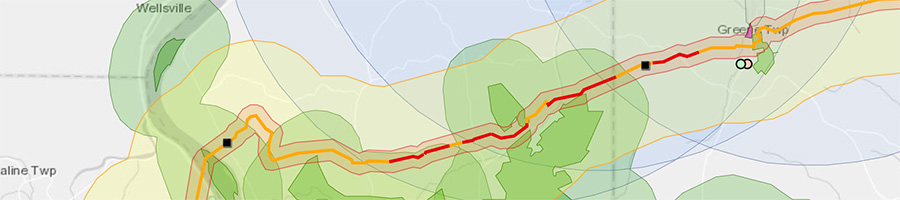
Another incident found that a Shell crude oil pipeline ruptured twice in less than a year in the San Joaquin Valley, CA. Investigations found that the ruptures were due to “fatigue cracks” that led to 60,000 gallons of oil spilling into grasslands, resulting in more than $6 million in environmental damage and emergency response costs. Concerns raised by the State Fire Marshal’s Pipeline Safety Division following the second spill in 2016 forced Shell to replace a 12-mile stretch of the problematic pipeline, as seen in the image above.
Conclusion
These findings suggest that while Shell is obligated to stress safety to sell the Falcon pipeline to the public, people should take Shell’s “good neighbor” narrative with a degree of skepticism. The numbers presented by PHMSA’s pipeline incident data significantly undermine Shell’s claim of having a proven track record as a safe and responsible operator. In fact, Shell ranks near the top of all US operators for incidents per HVL pipeline mile maintained, as well as damage totals.
There are inherent gaps in our analysis based on data inadequacies worth noting. Incidents dealt with at the state level may not make their way into PHMSA’s data, nor would problems that are not voluntary reported by pipeline operators. Issues similar to what the state of Pennsylvania has experienced with Sunoco Pipeline’s Mariner East 2, where horizontal drilling mishaps have contaminated dozens of streams and private drinking water wells, would likely not be reflected in PHMSA’s data unless those incidents resulted in federal interventions.
Based on the available data, however, most of Shell’s pipelines support one of the company’s many refining and storage facilities, primarily located in California and the Gulf states of Texas and Louisiana. Unsurprisingly, these areas are also where we see dense clusters of pipeline incidents attributed to Shell. In addition, many of Shell’s incidents appear to be the result of inadequate maintenance and improper operations, and less so due to factors beyond their control.
As Shell’s footprint in the Appalachian region expands, their safety history suggests we could see the same proliferation of pipeline incidents in this area over time, as well.
NOTE: This article was amended on 4/9/18 to include table 2.
Header image credit: AFP Photo / Joe Raedle
By Kirk Jalbert, FracTracker Alliance